A Multi-Mode PDR Perception and Positioning System Assisted by Map Matching and Particle Filtering

Abstract
:
1. Introduction
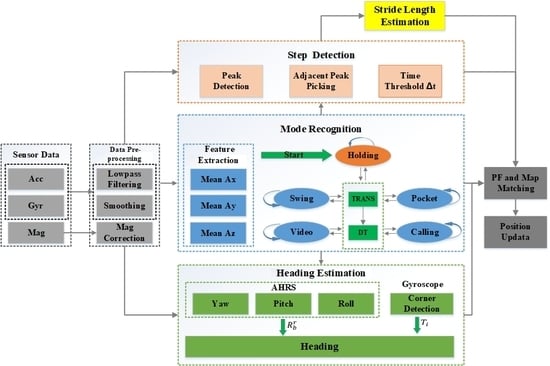
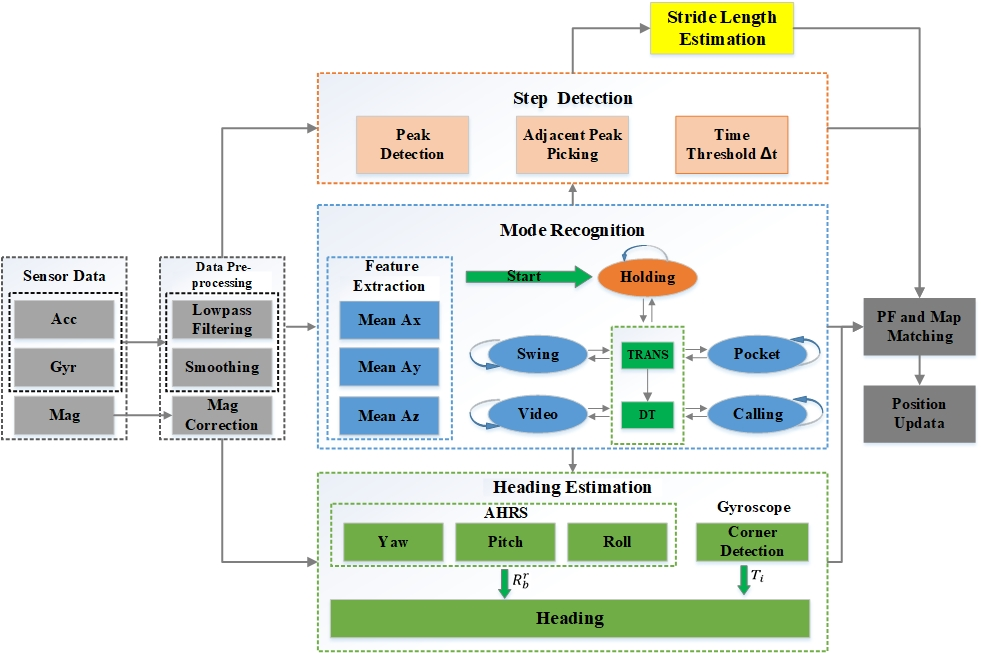
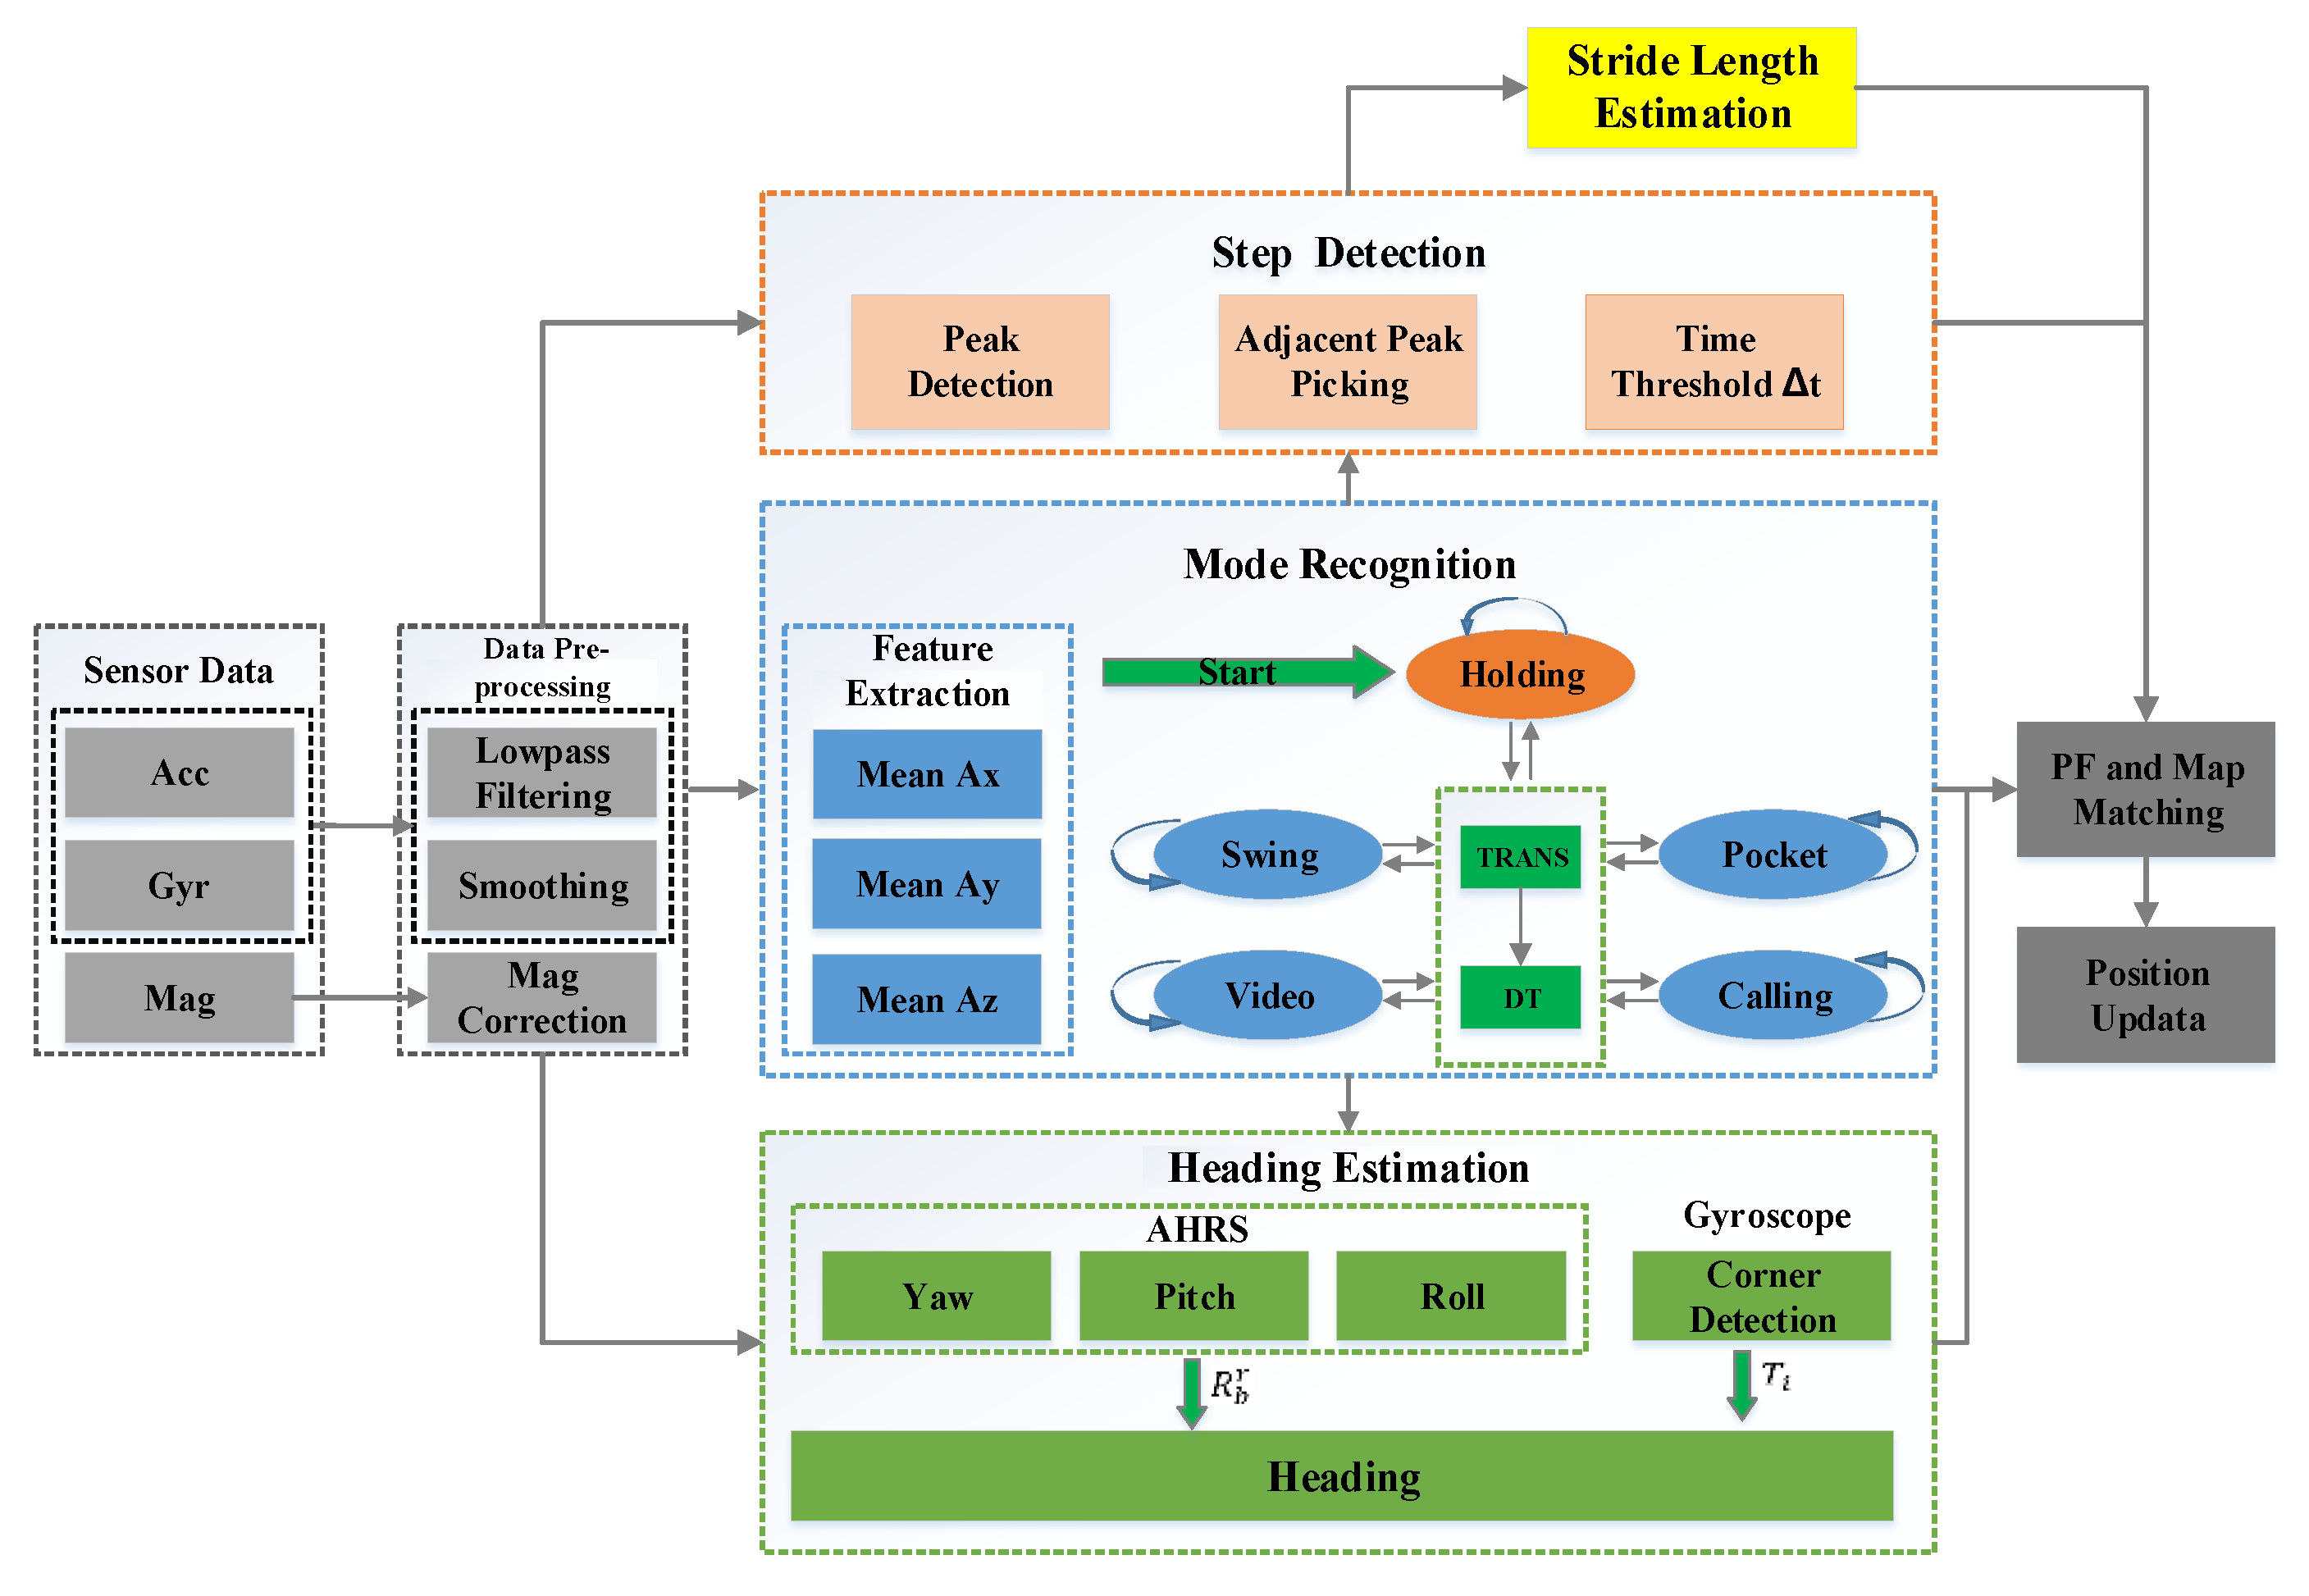
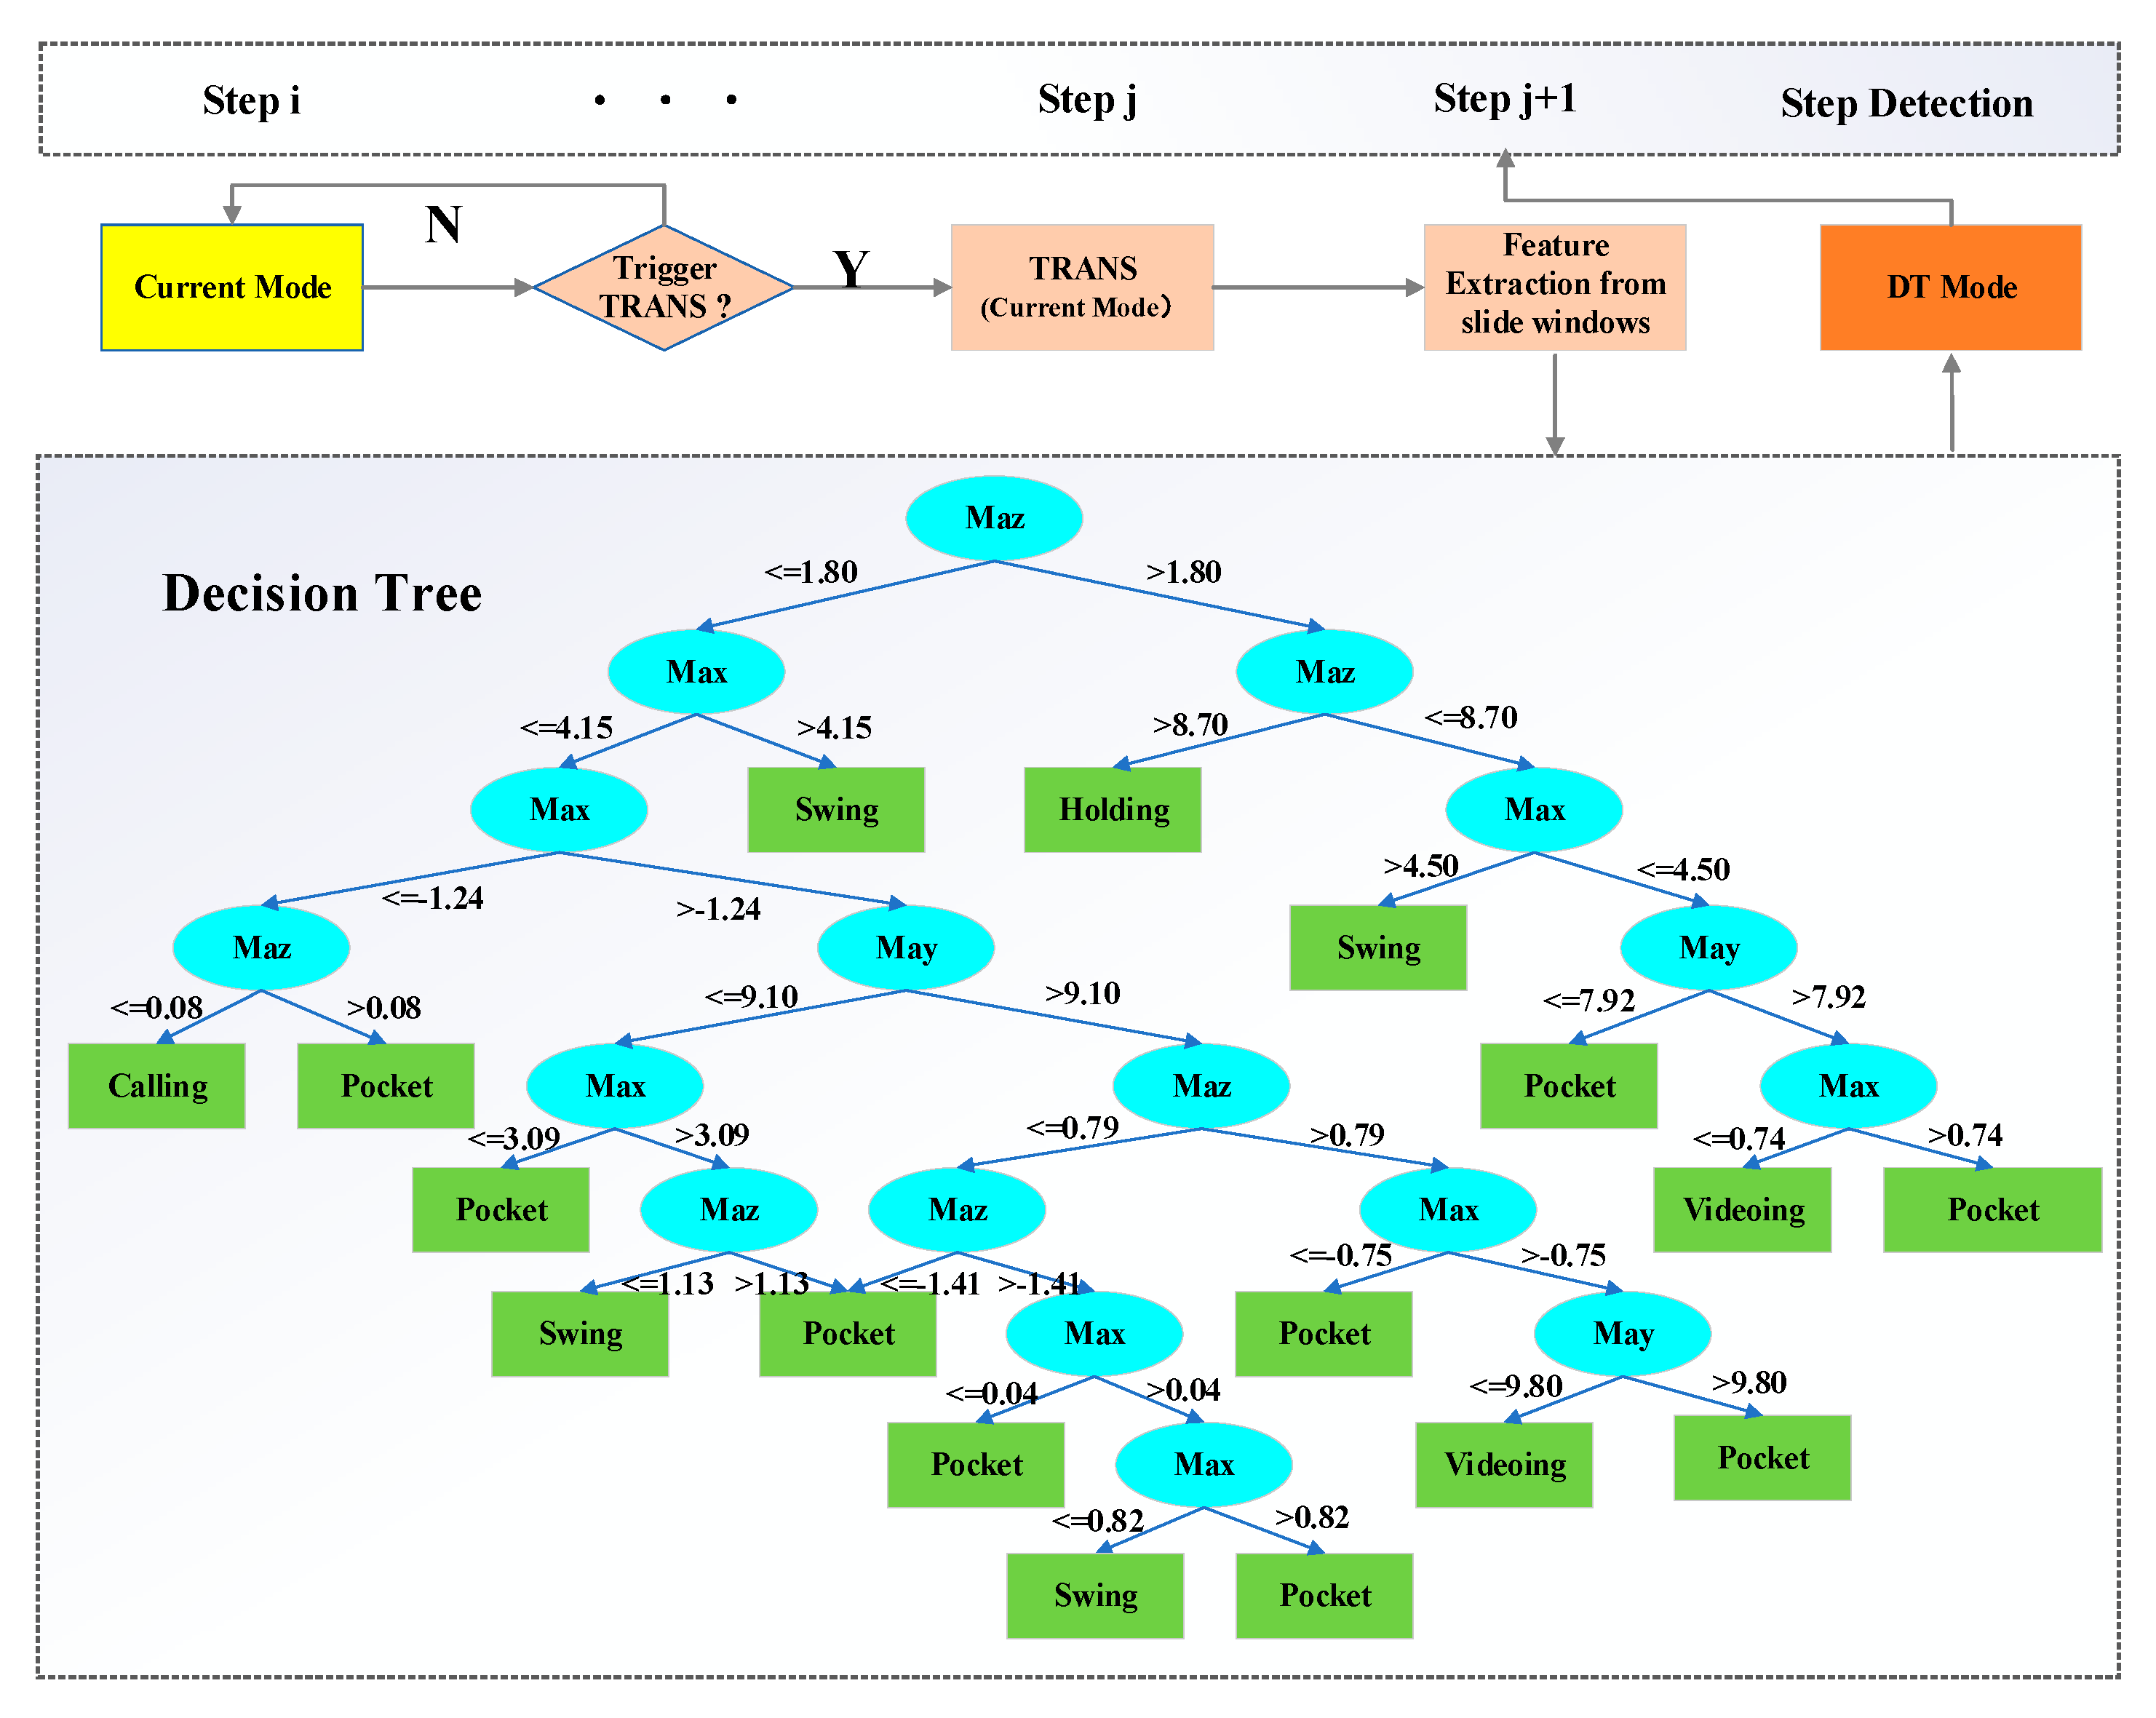
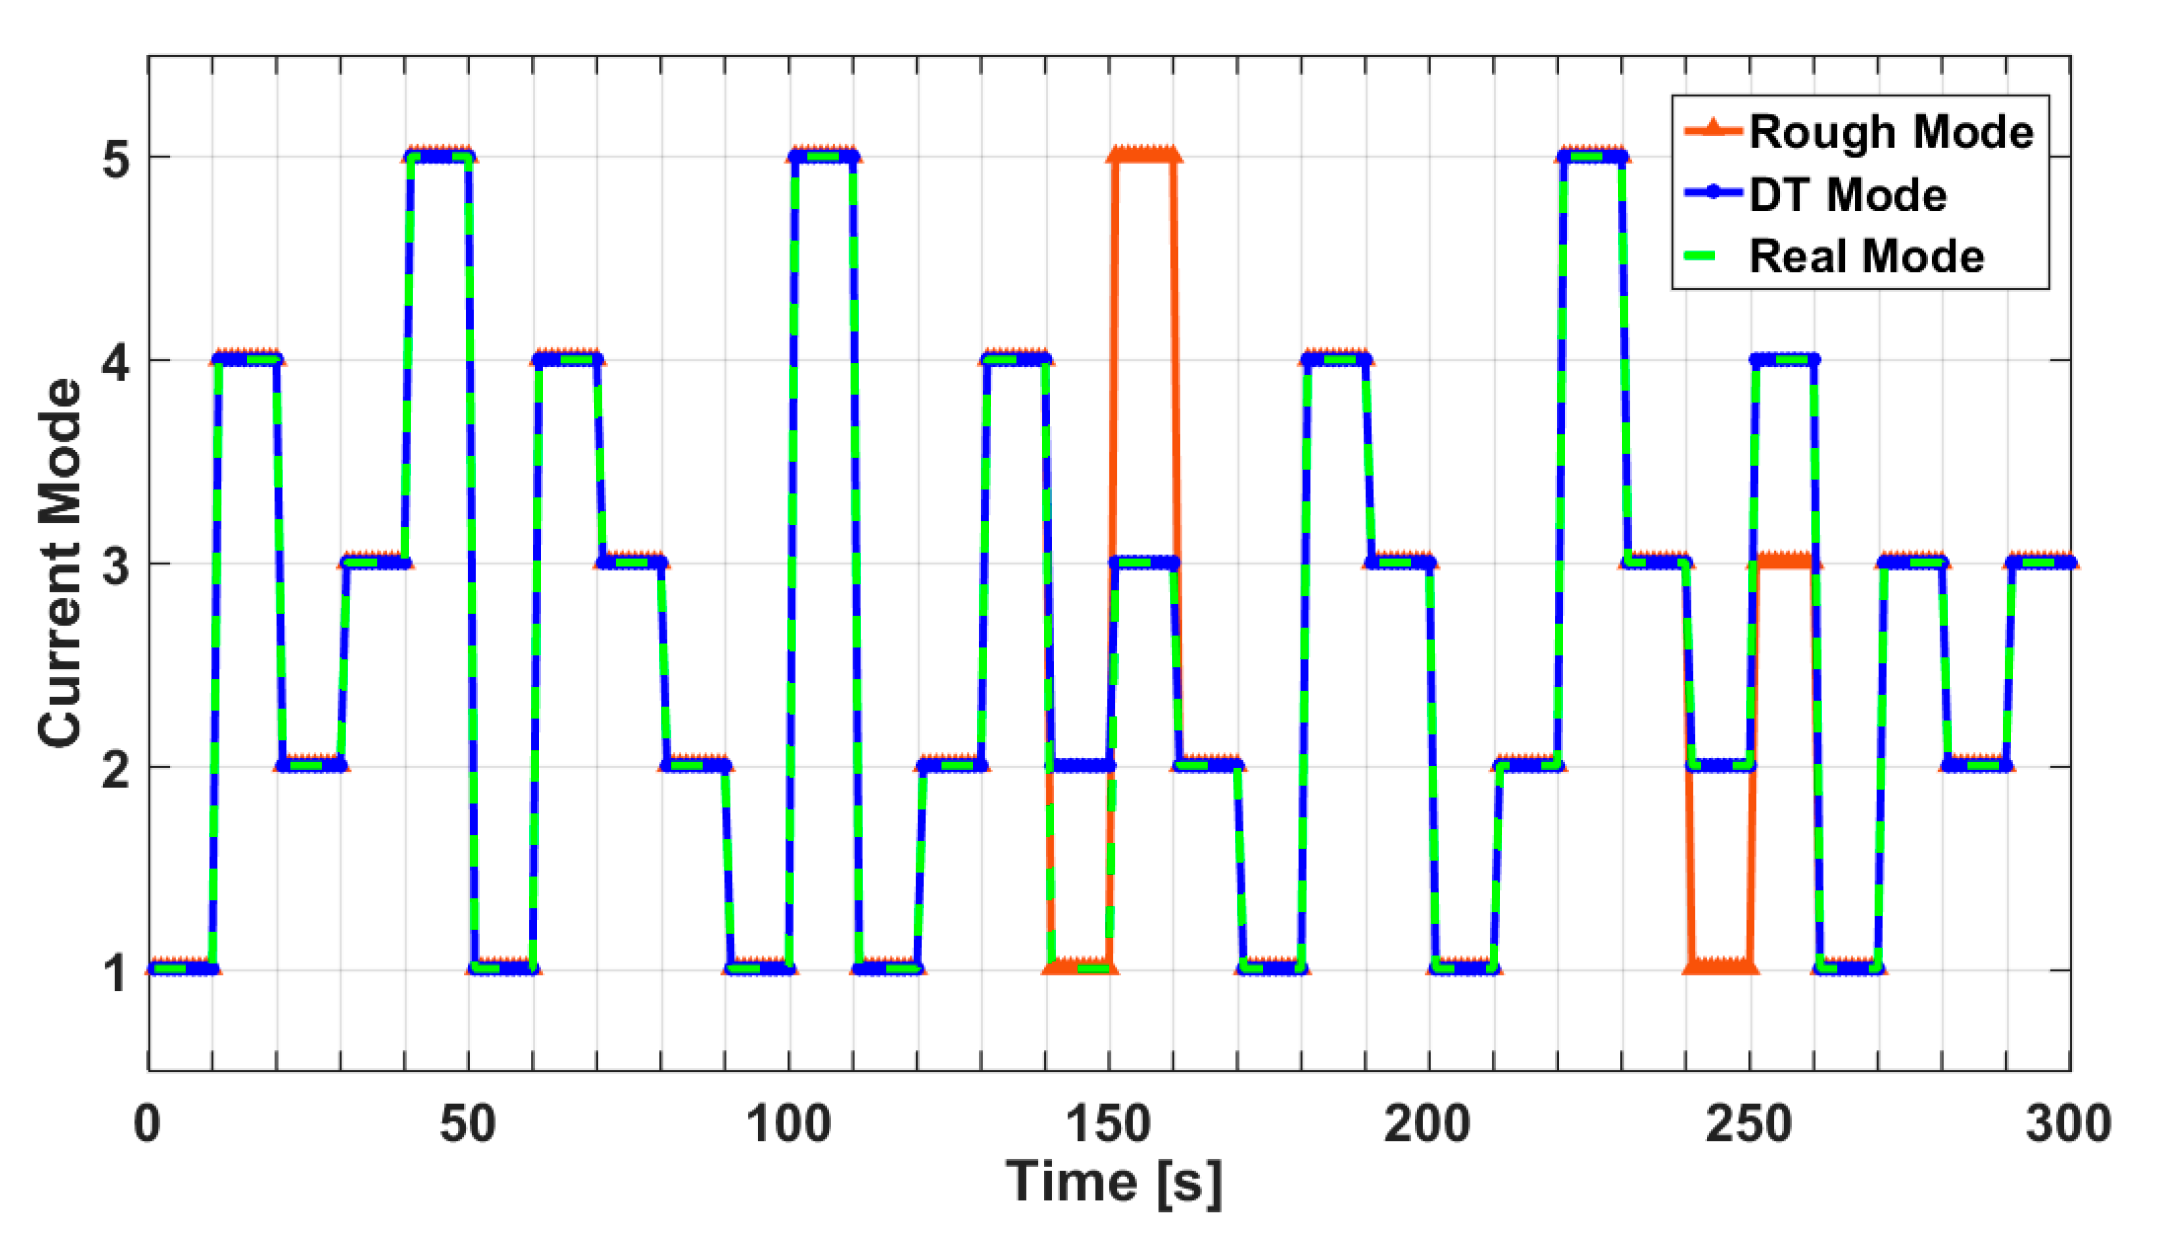
- According to the pedestrian’s daily custom of using a phone, we defined five typical modes for carrying a smartphone, including holding, videoing, calling, swing, and pocket. In prior works, sensor data were continuously extracted to recognize the mode of the device, which not only consumes a lot of memory but also greatly reduces the battery life. By matching a pre-defined threshold, the finite state machine (FSM) algorithm can make a timely response to the mode switch without extracting data features. Therefore, in this paper, the FSM and decision tree (DT) algorithms were combined to perform real-time monitoring and the recognition of the phone mode. This method uses a DT algorithm to identify the user’s current mode once the FSM algorithm detects the change of the device pose. Experimental results show that the light-weight classification approach proposed in this paper can accurately recognize the defined modes.
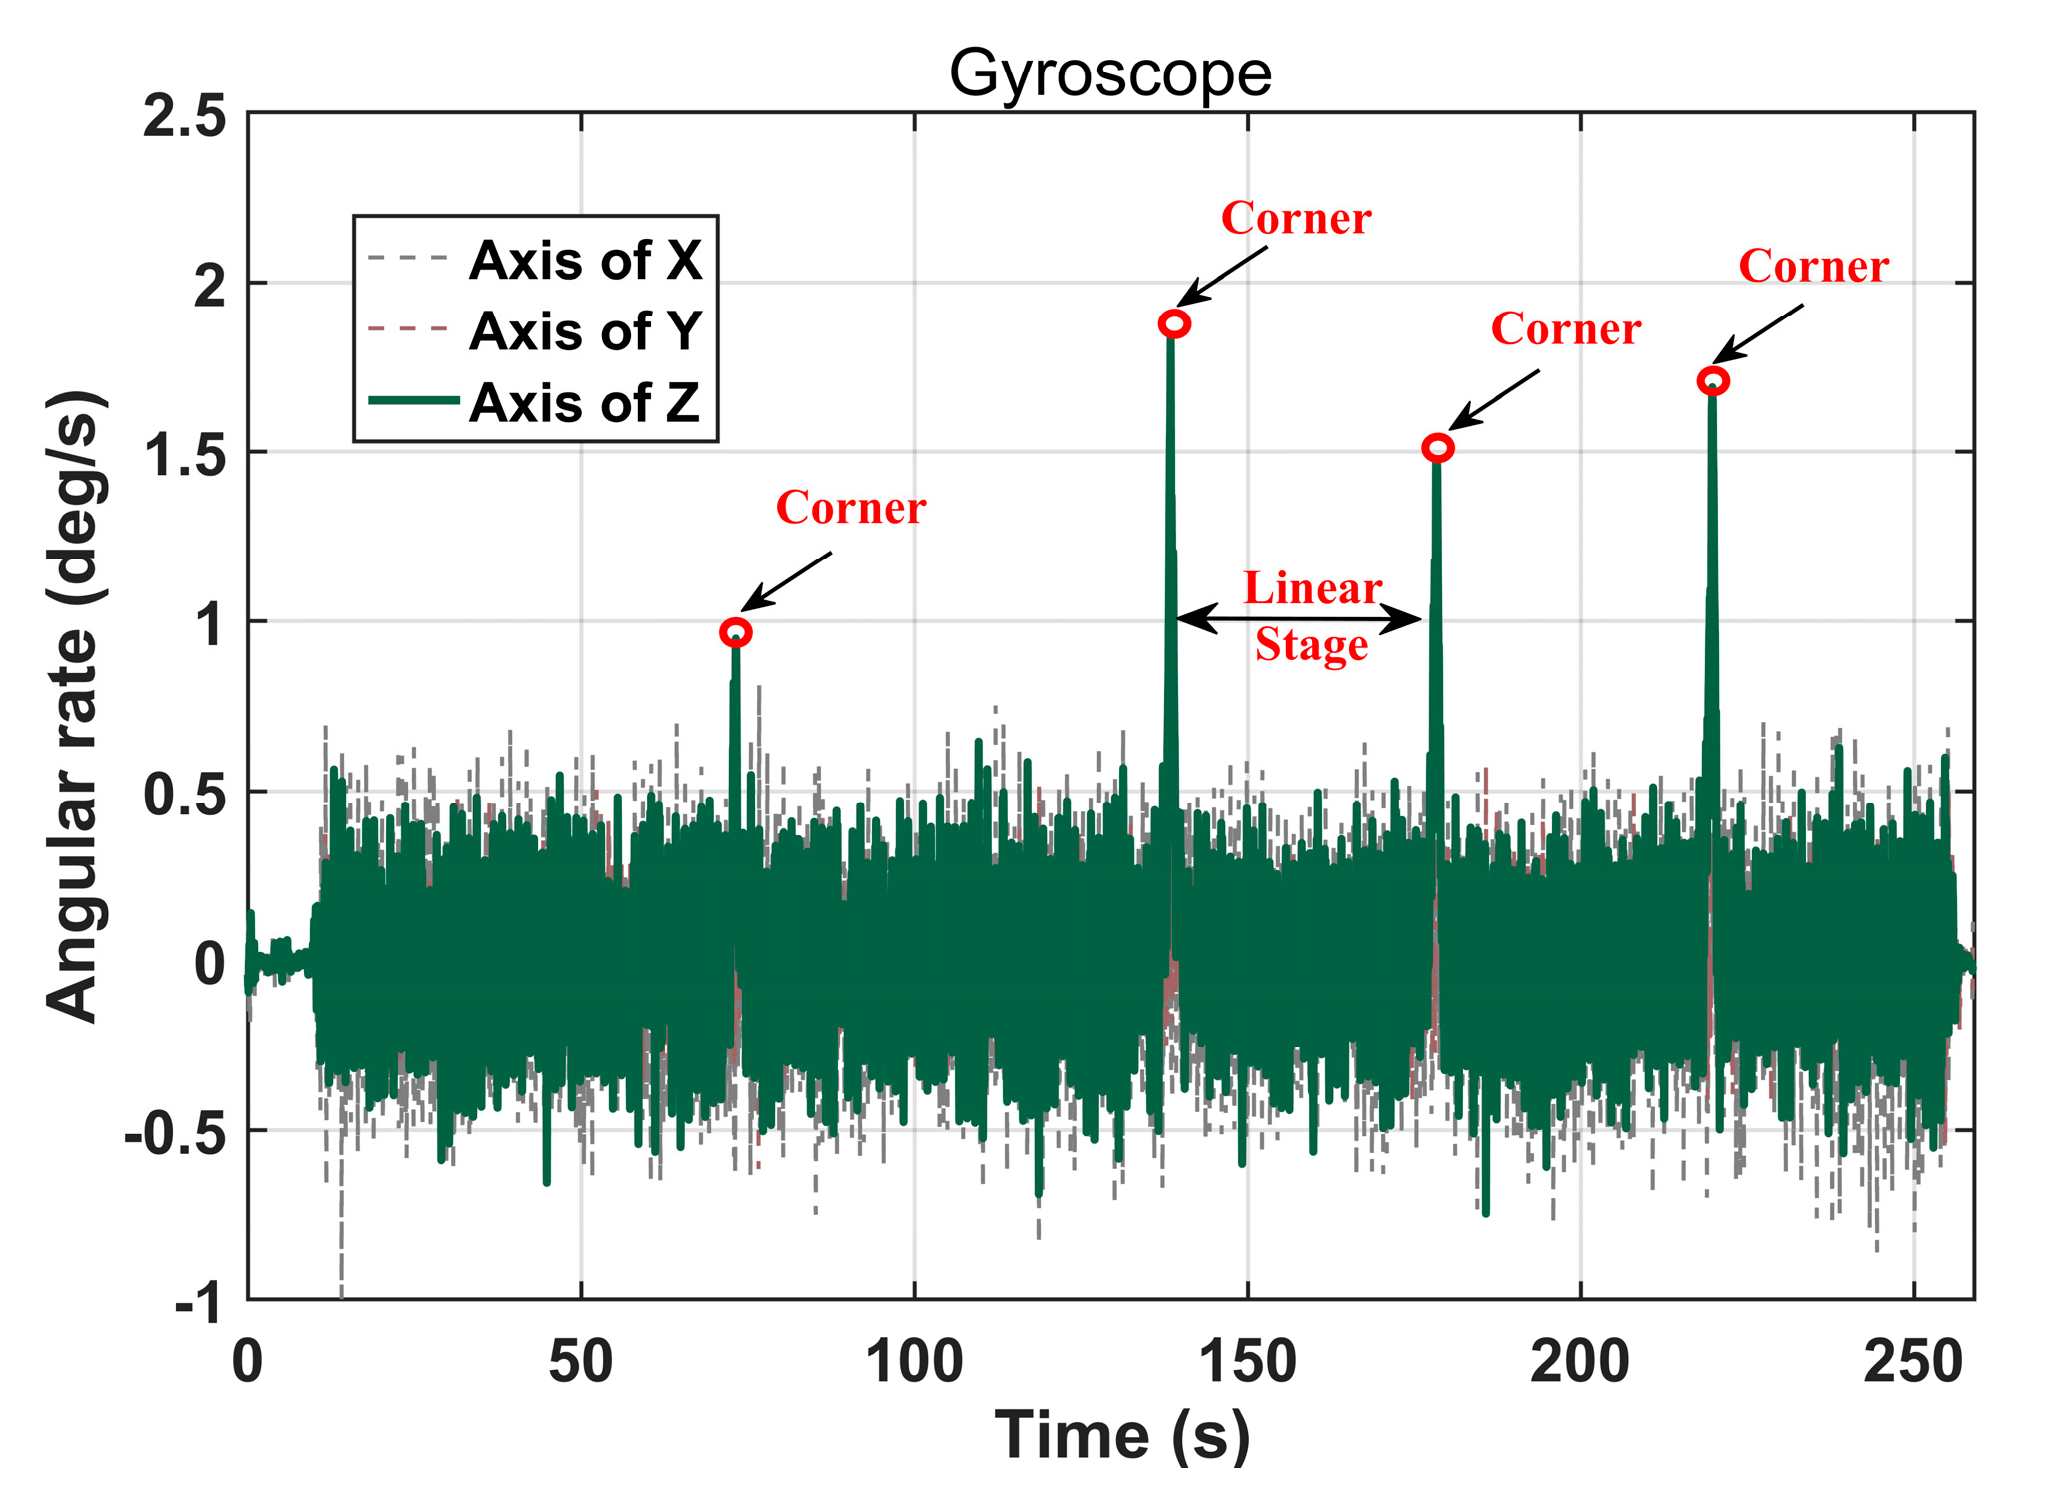
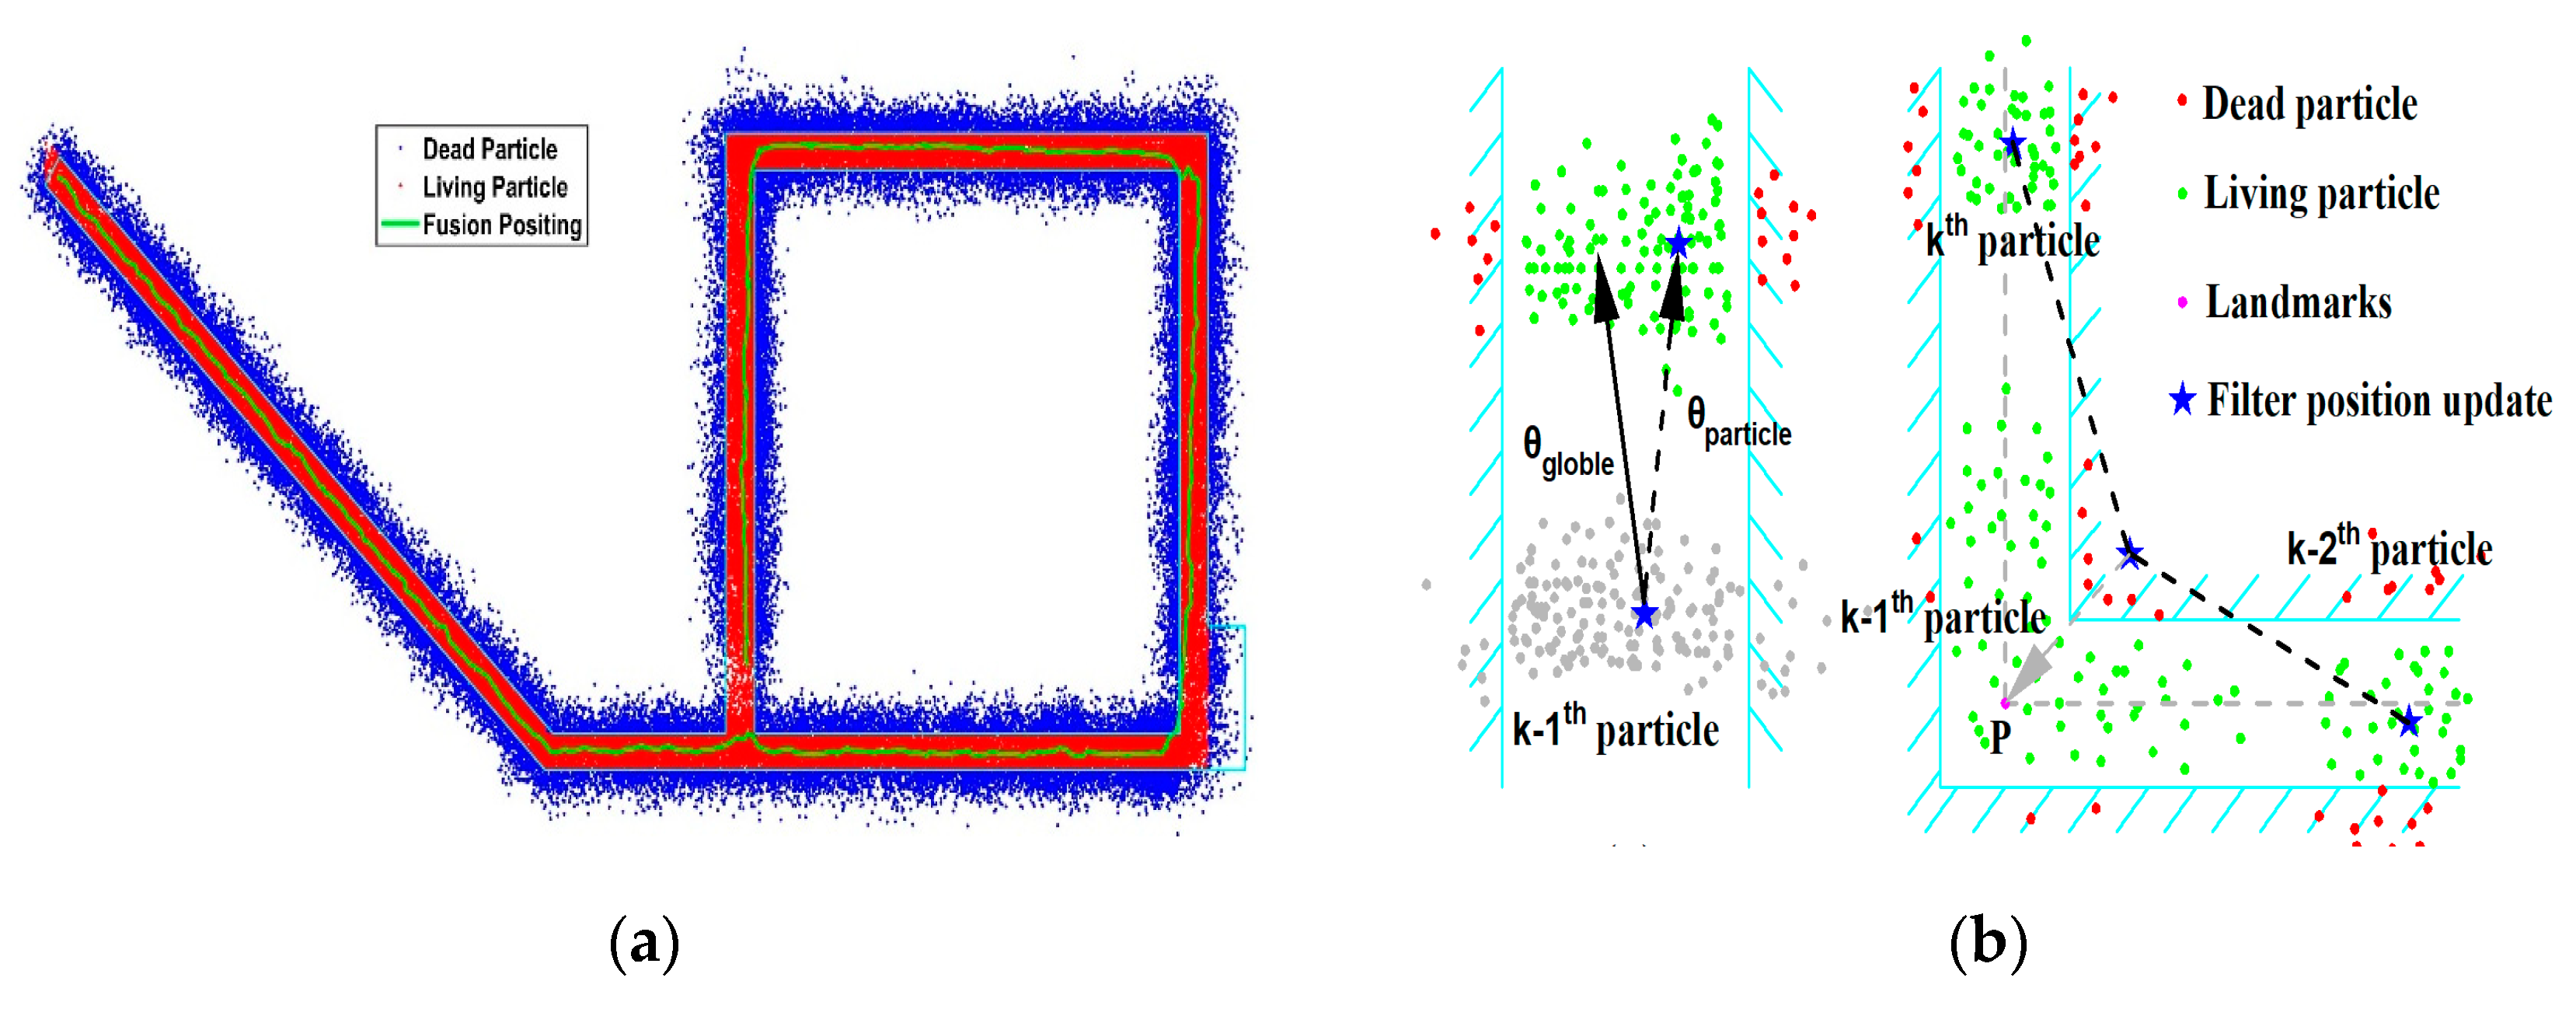
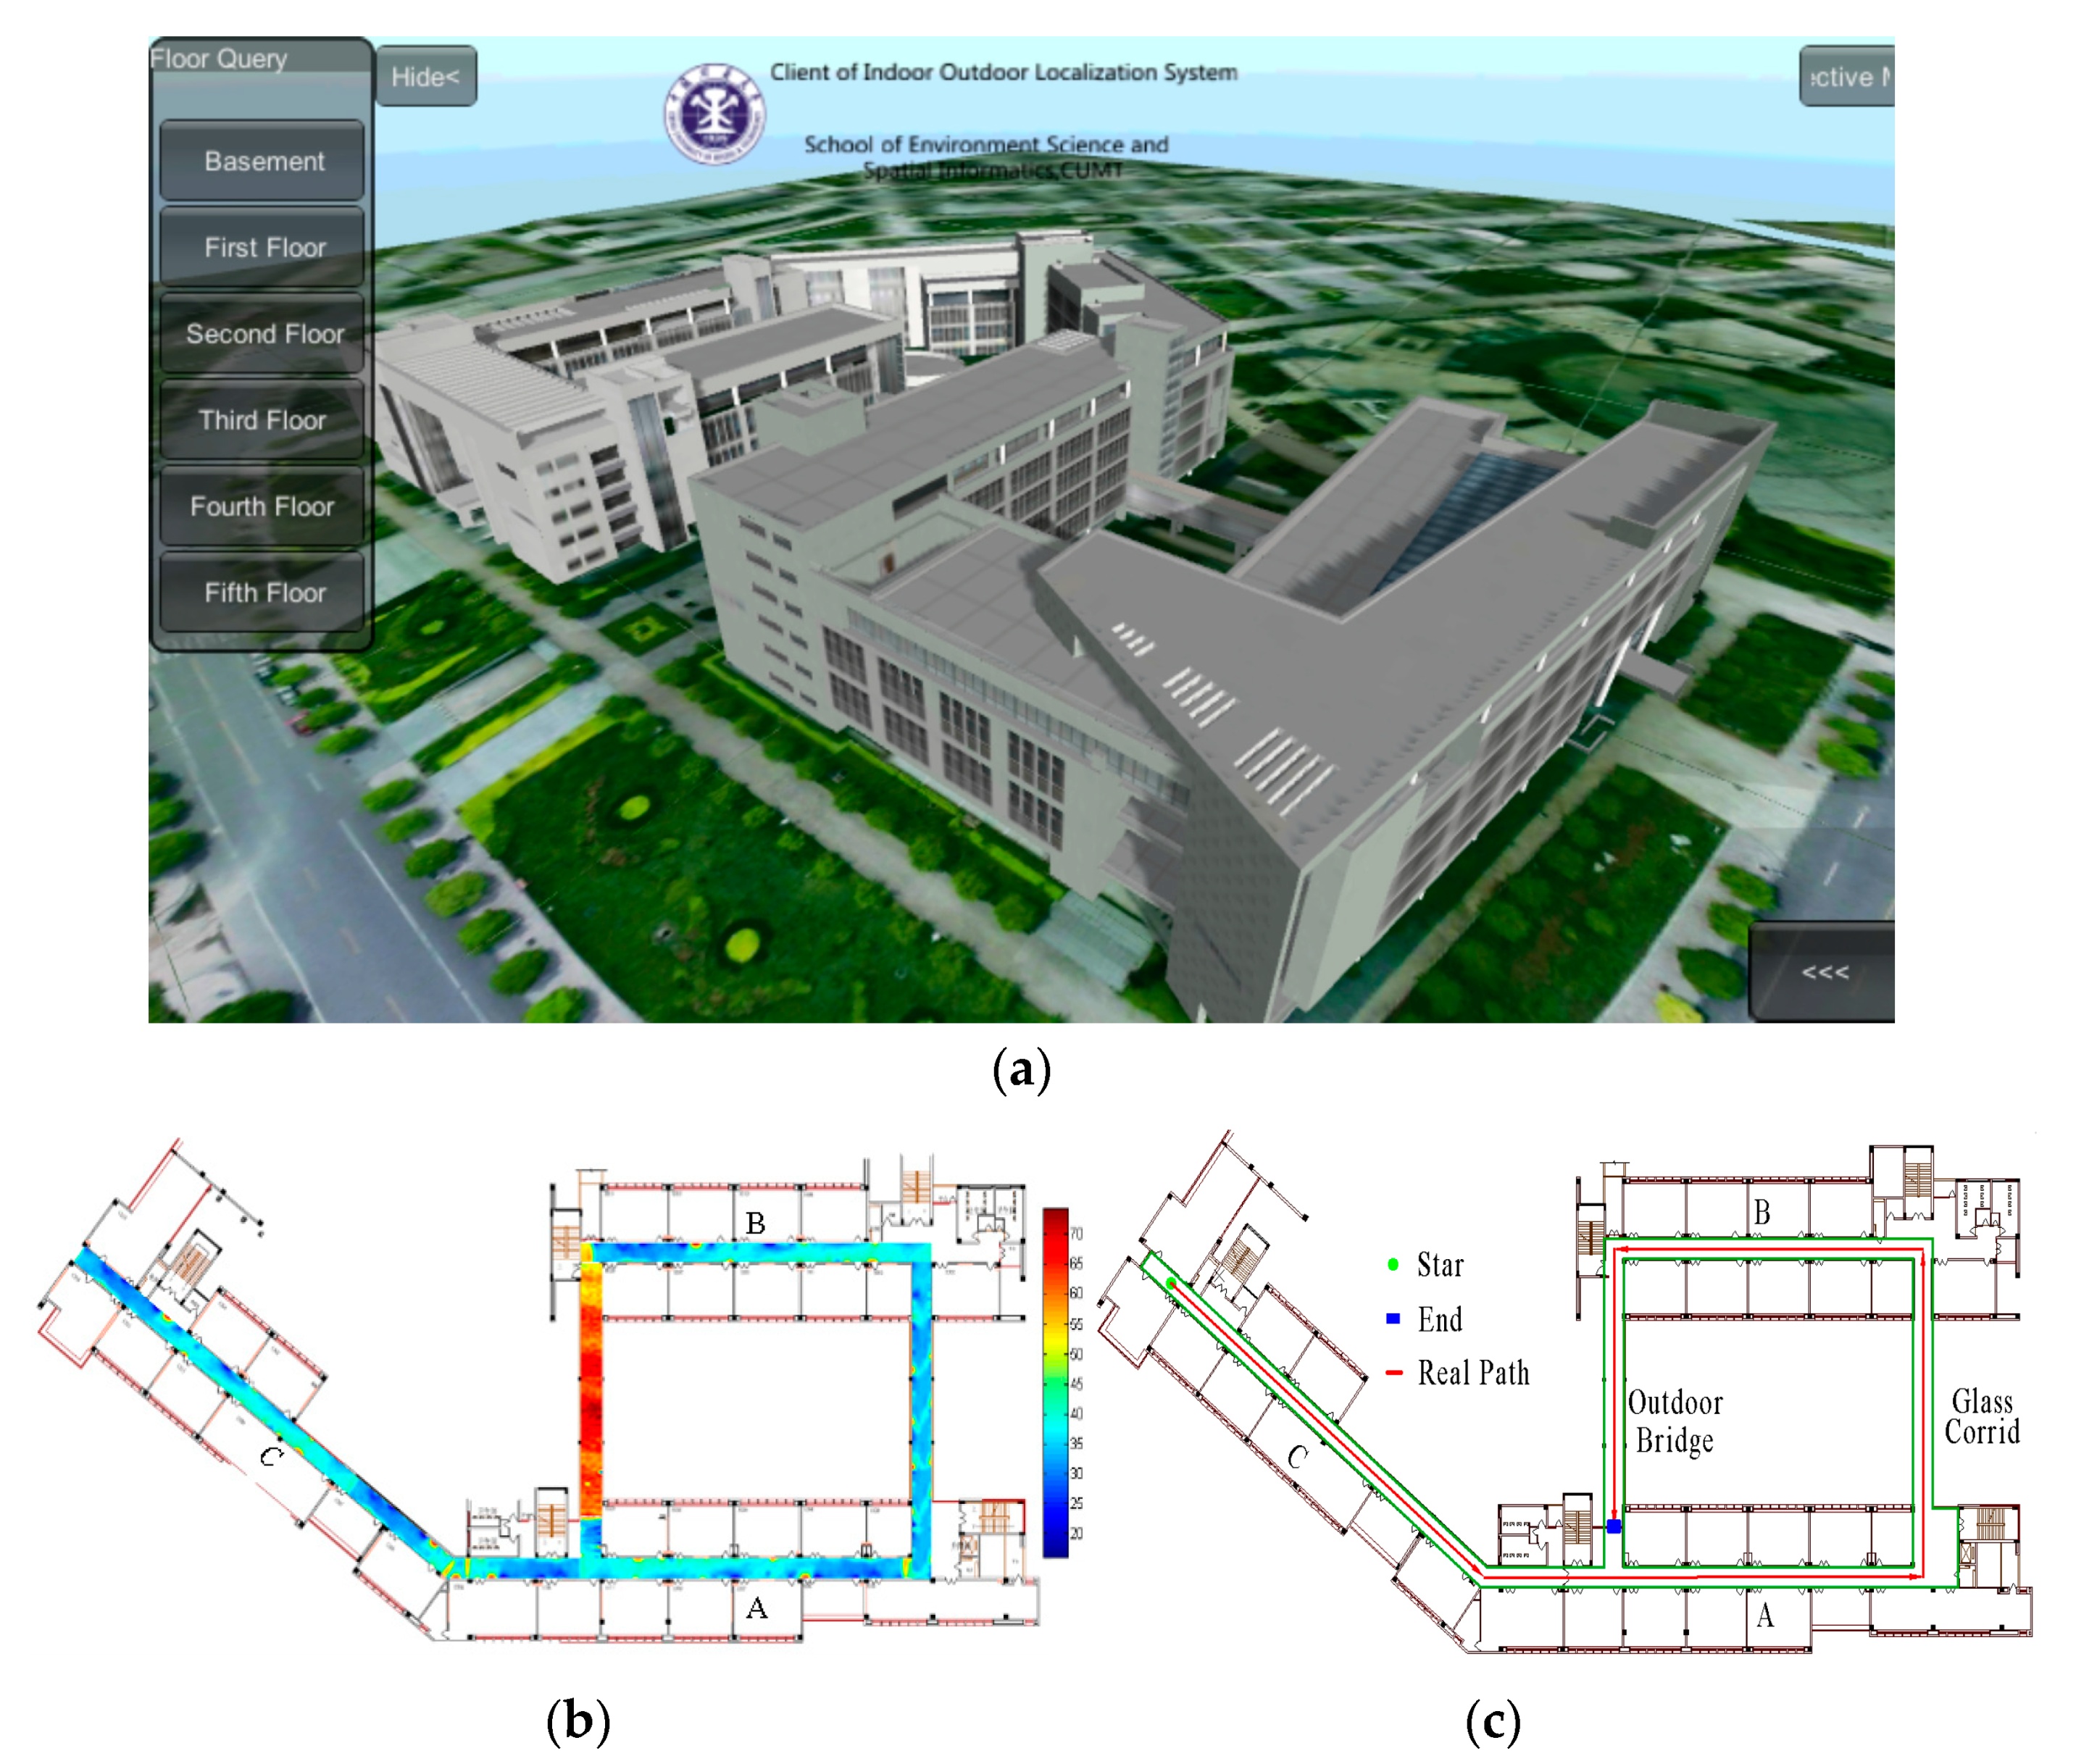
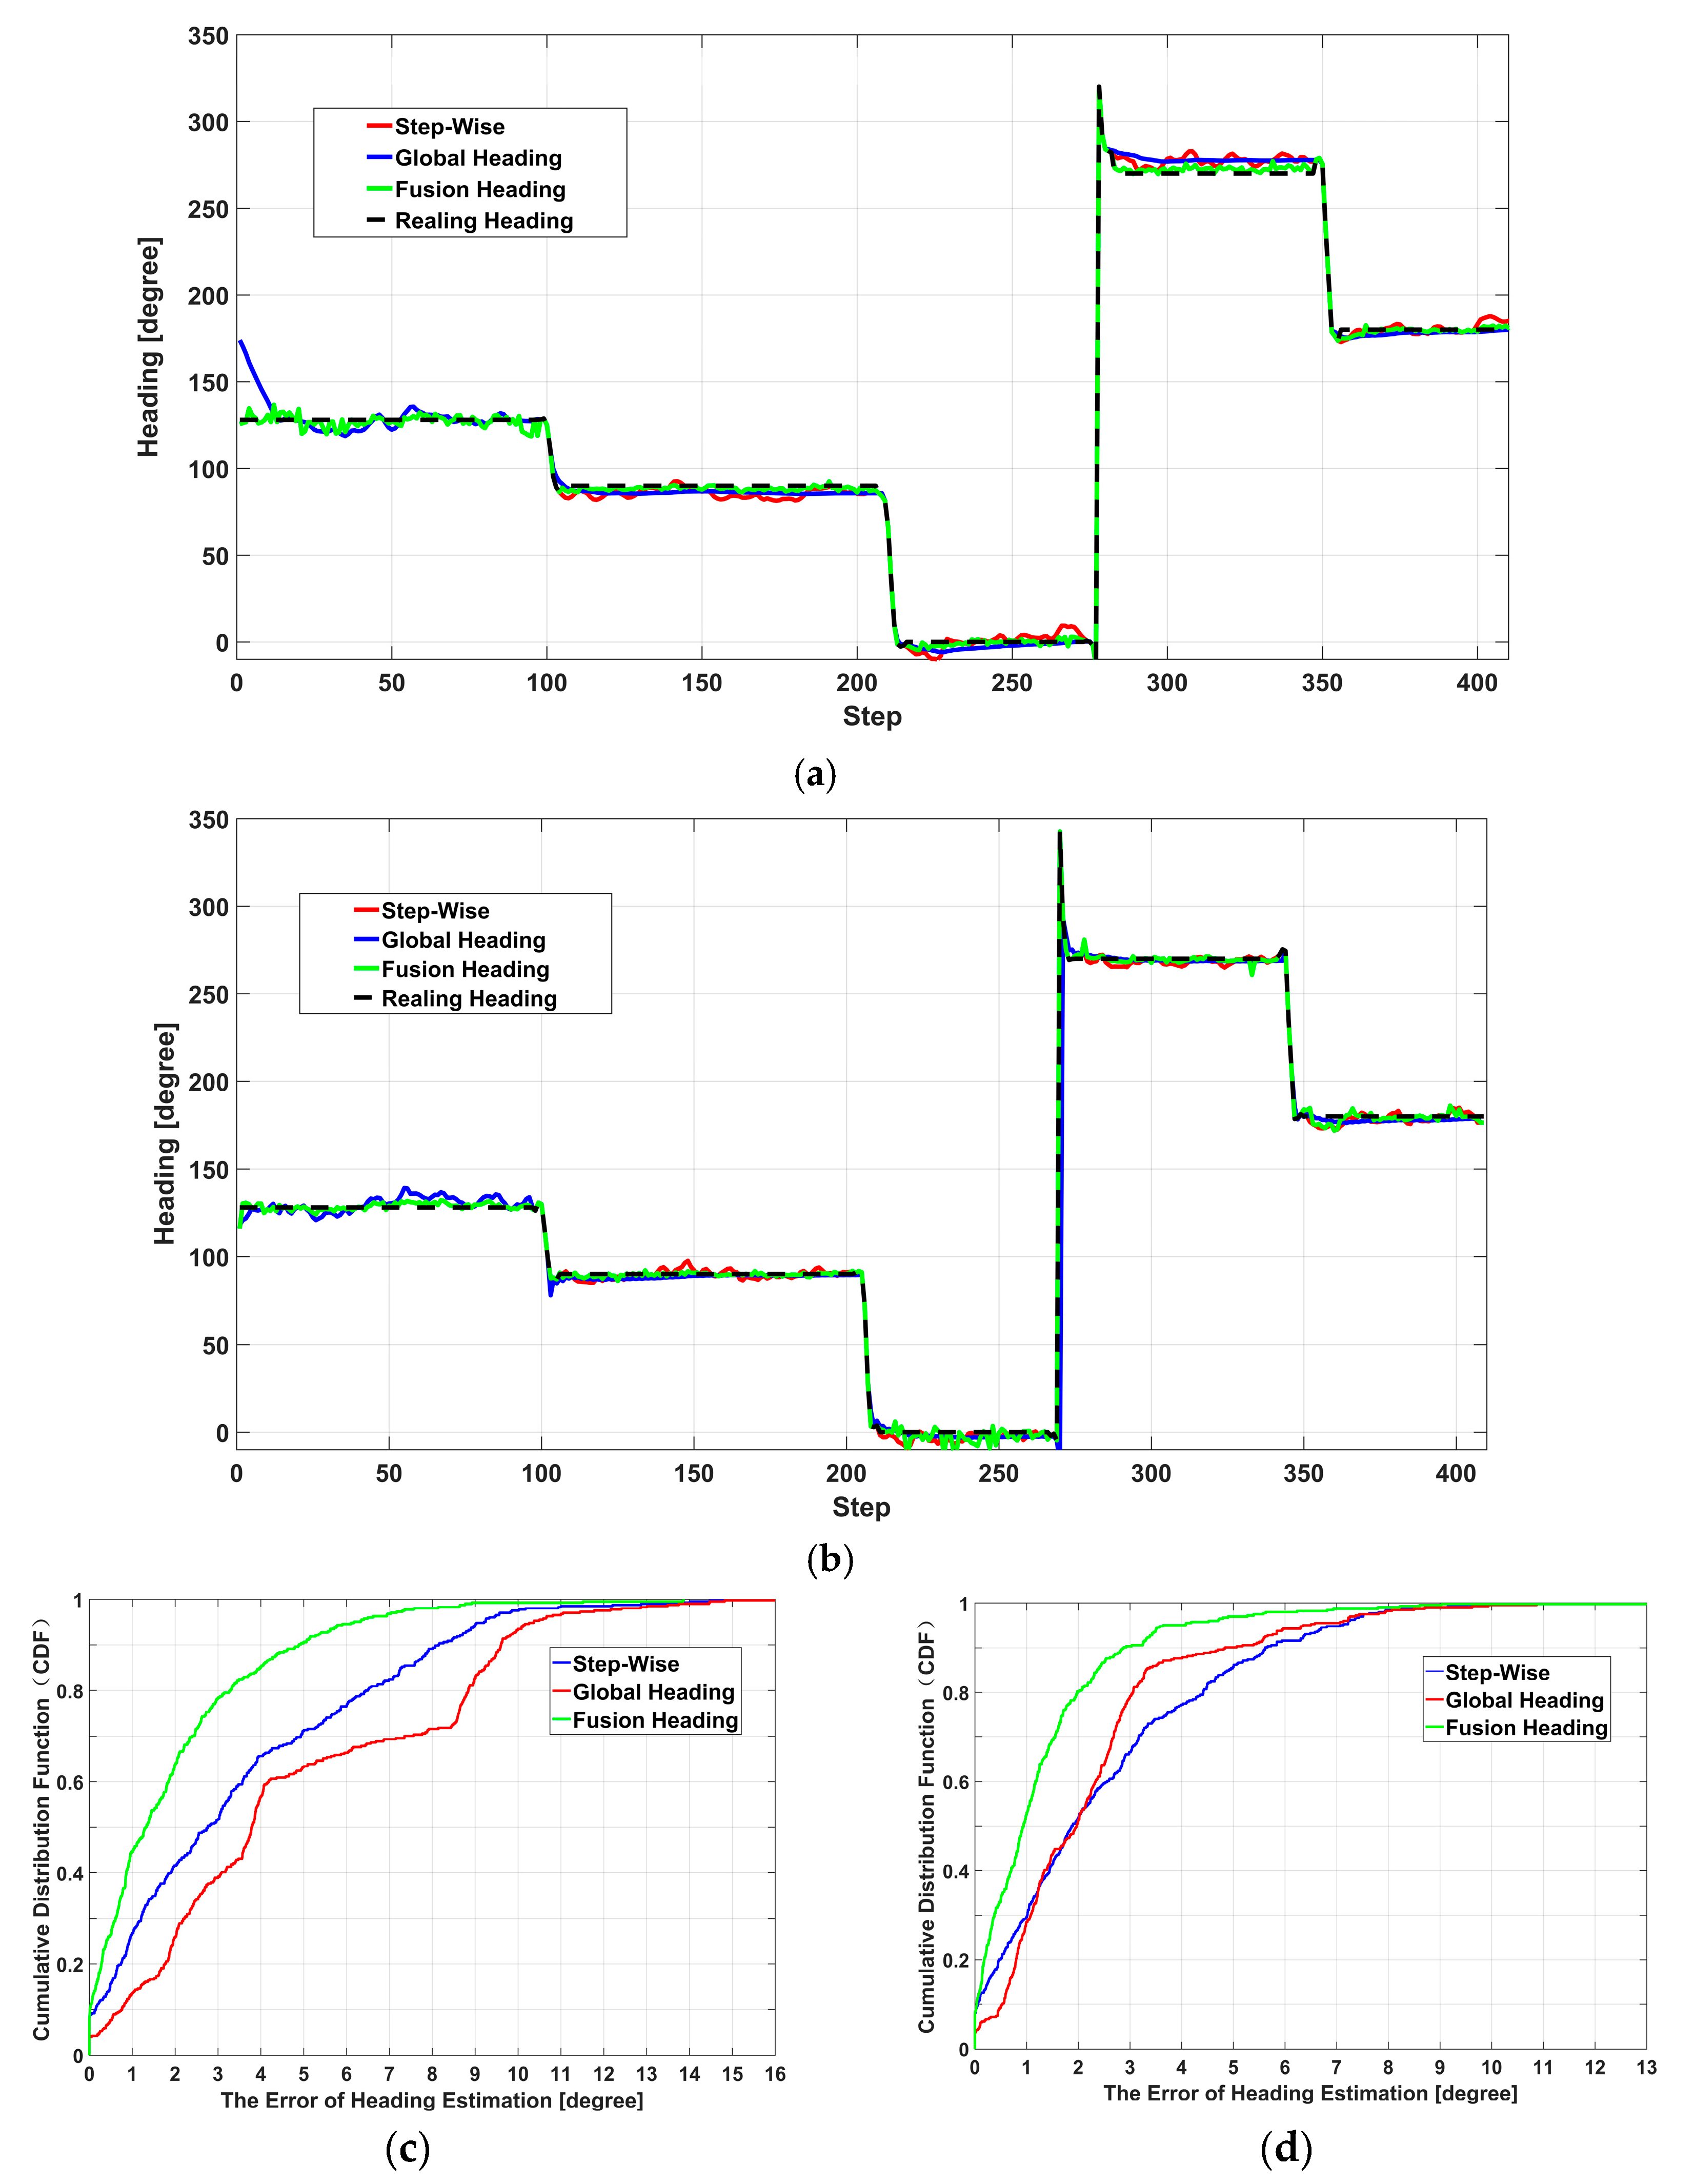
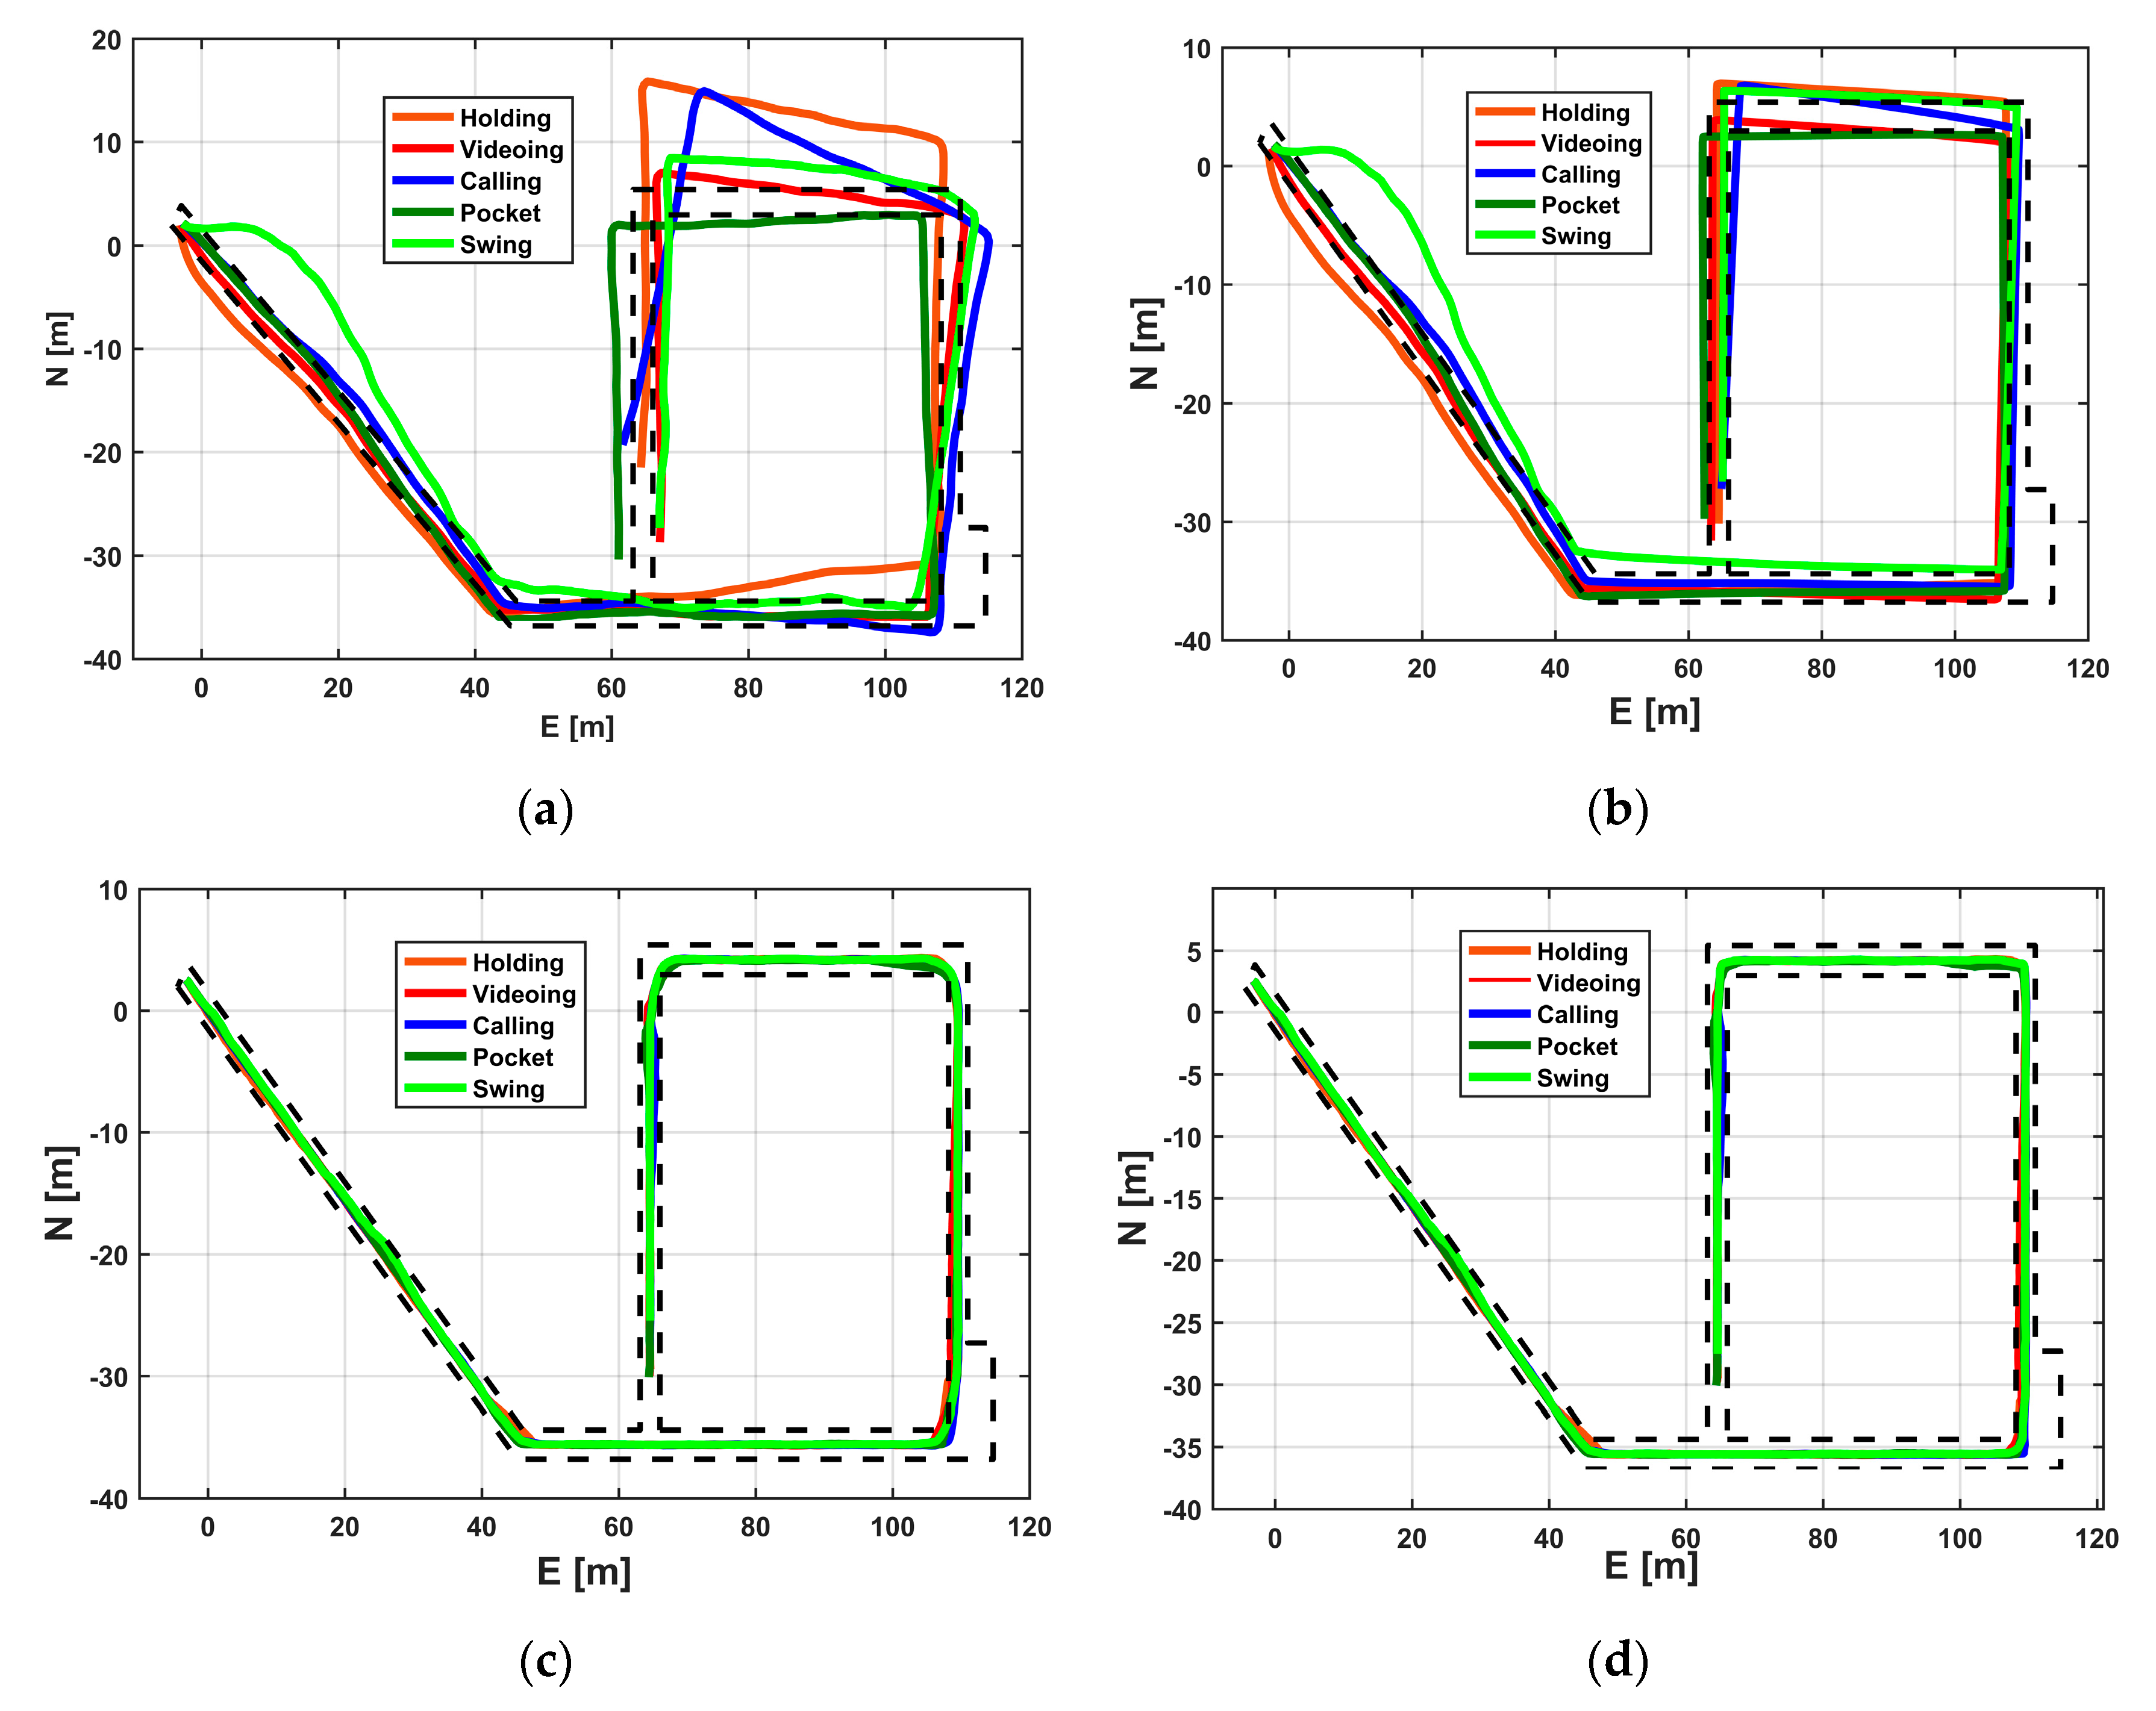
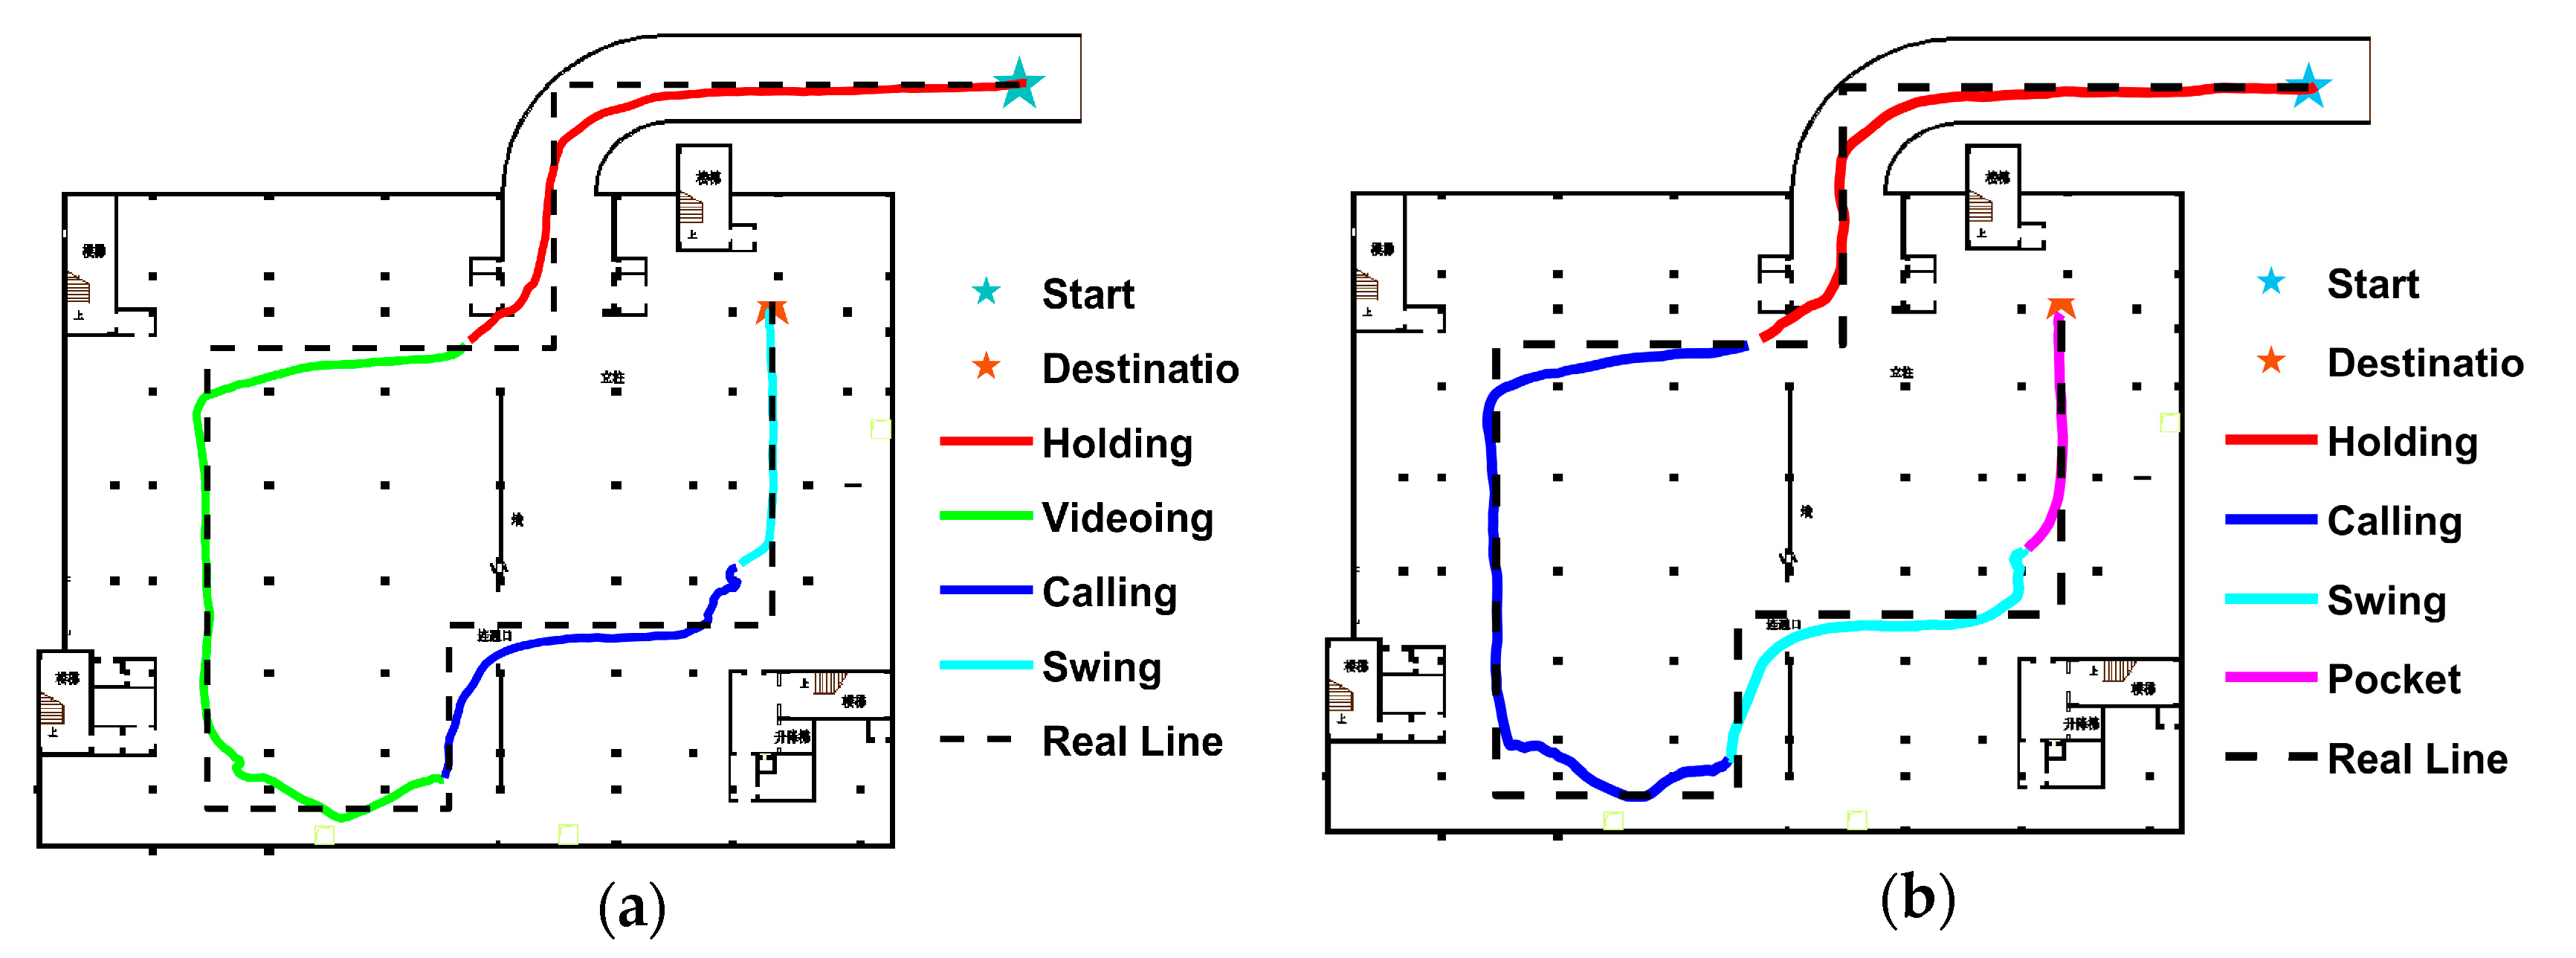
- We improved the step-wise heading estimation method by introducing gyroscope information to calculate the global heading of pedestrian in the linear stage. Moreover, we introduced a particle filter-based map-matching algorithm to improve the performance for heading estimation and positioning. We conducted experiments to evaluate the performance of the proposed method in two scenes: an indoor positioning experimental site and an underground parking garage. The results show that the proposed algorithm obtains robust performance for heading estimation and positioning in various usage modes.
2. Materials and Methods
2.1. Raw Data Preprocessing
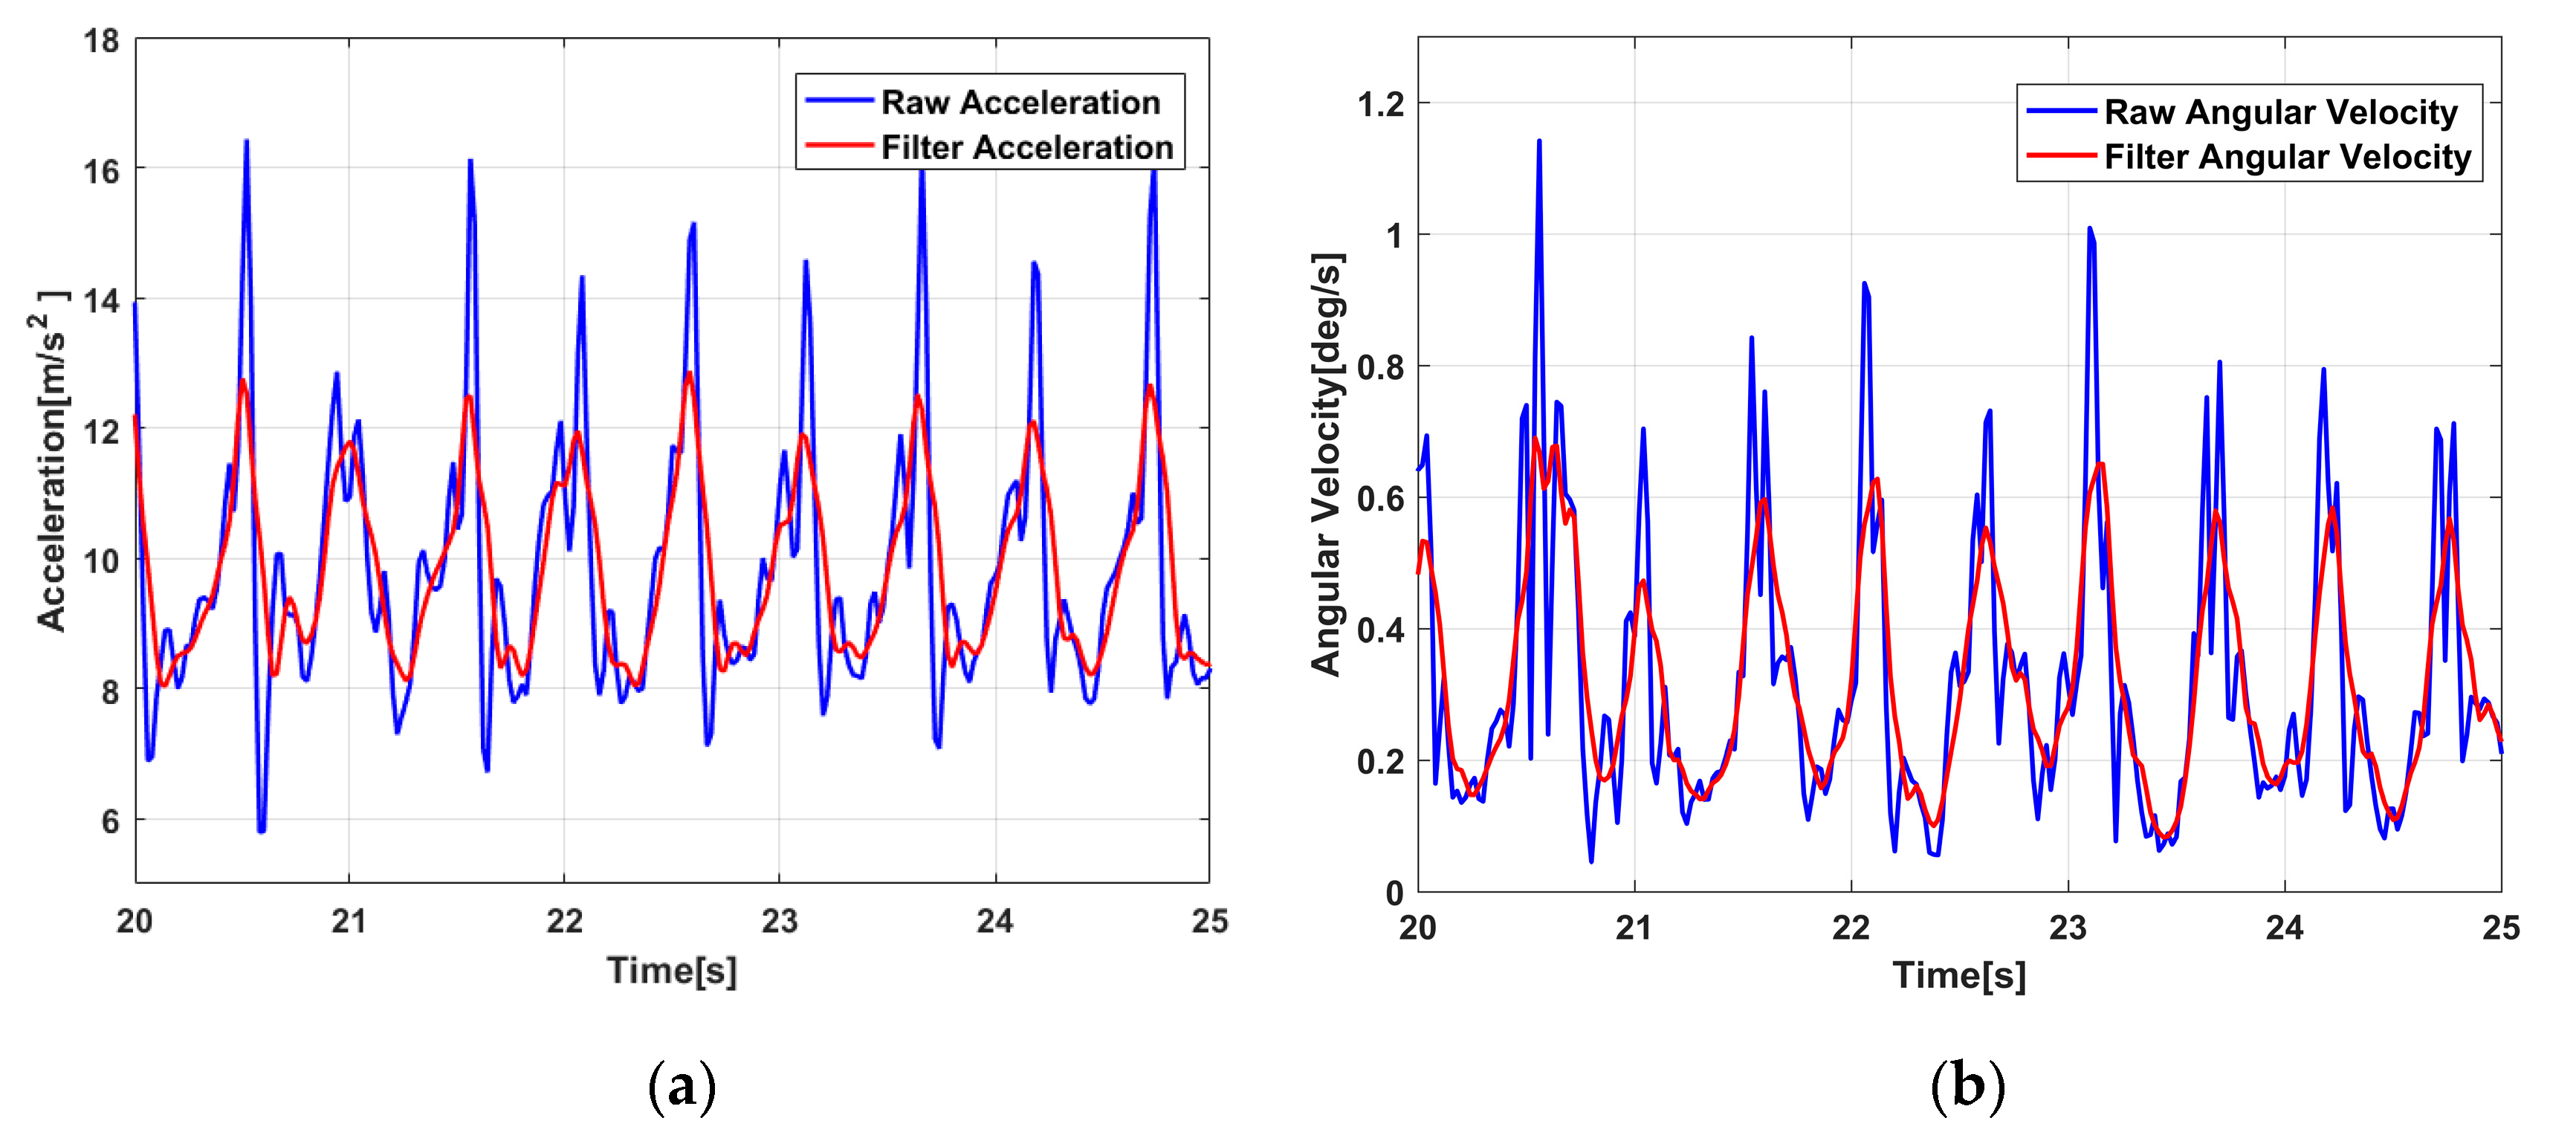
2.1.1. Low-Pass Filtering and Smoothing
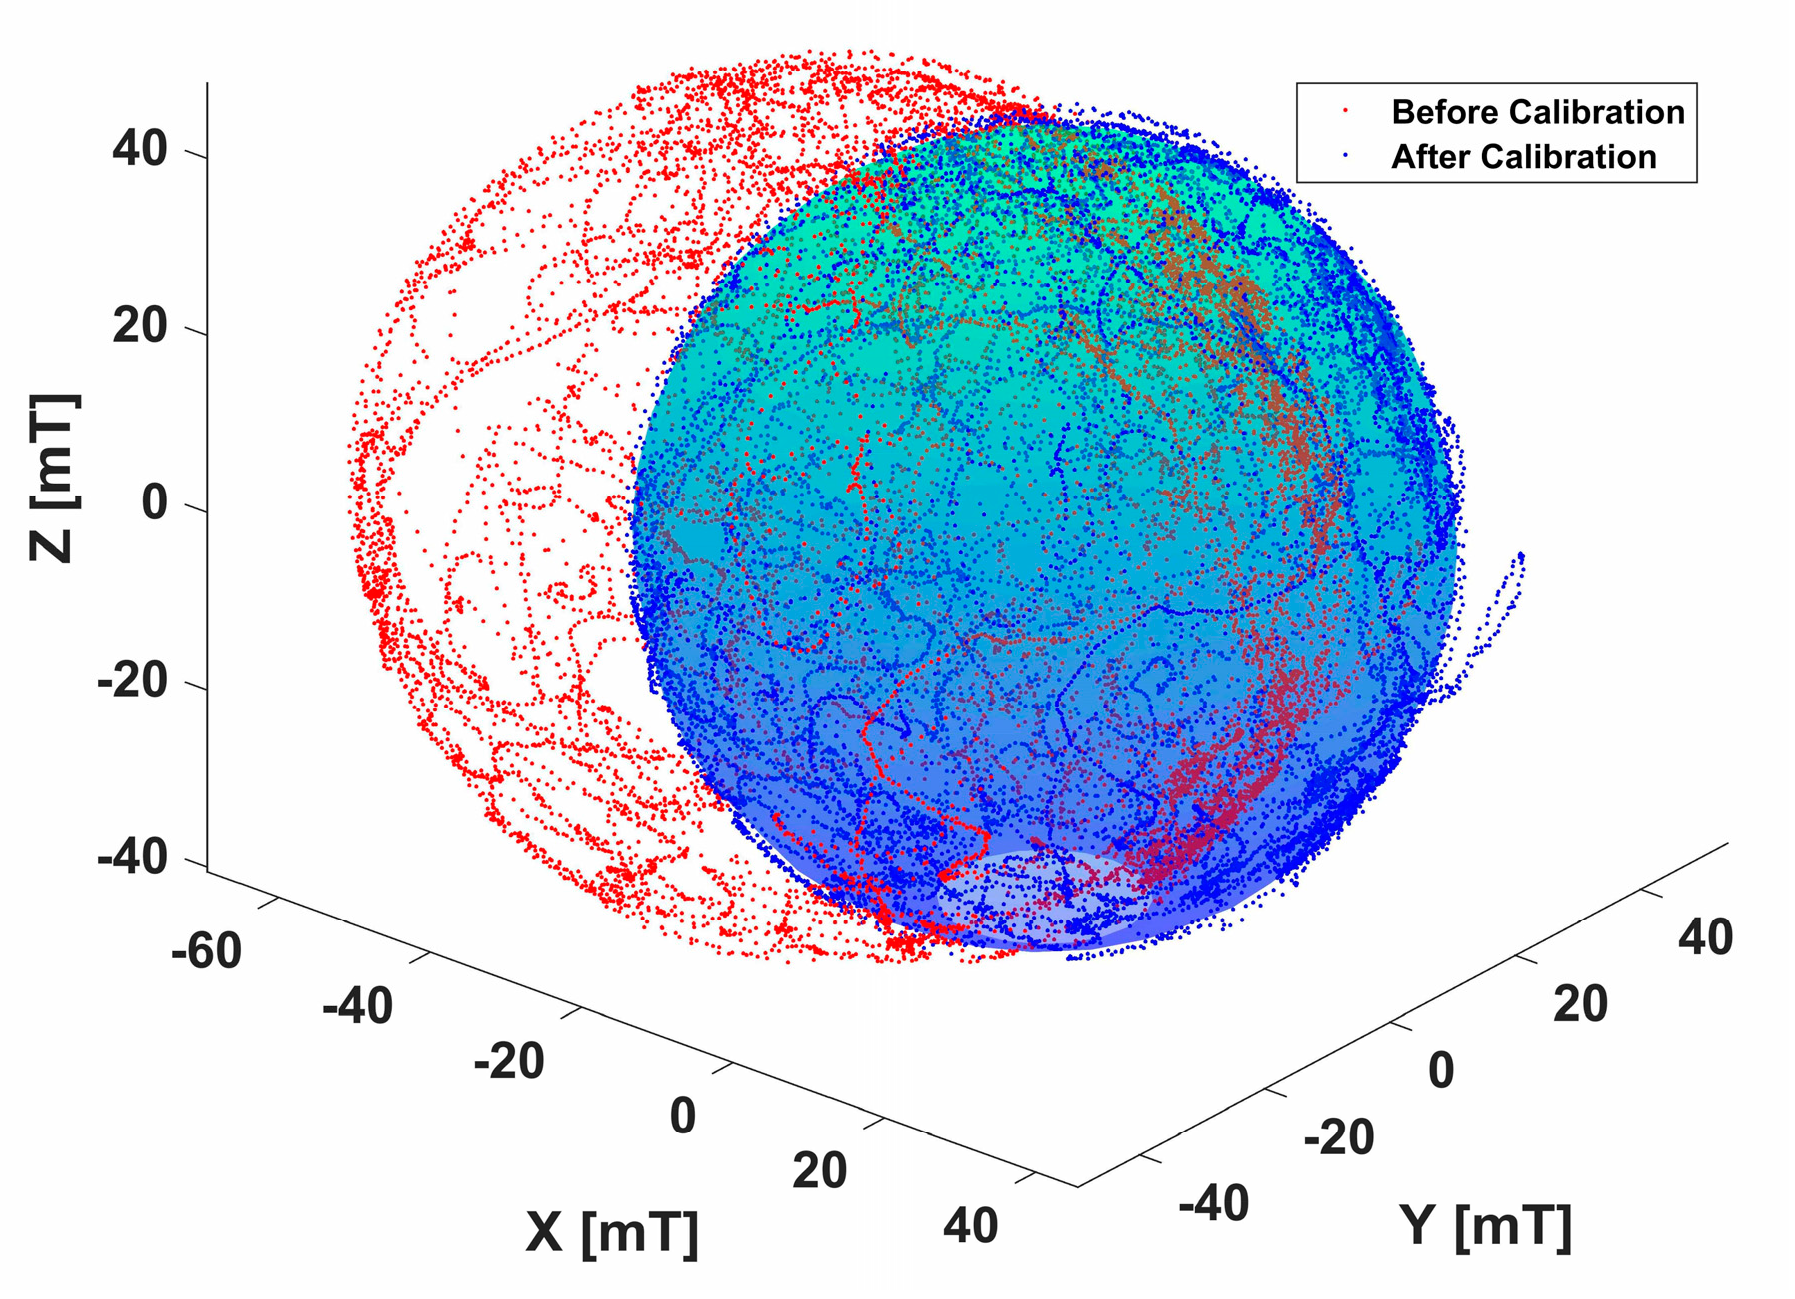
2.1.2. Magnetometer Calibration
2.2. Mode Recognition
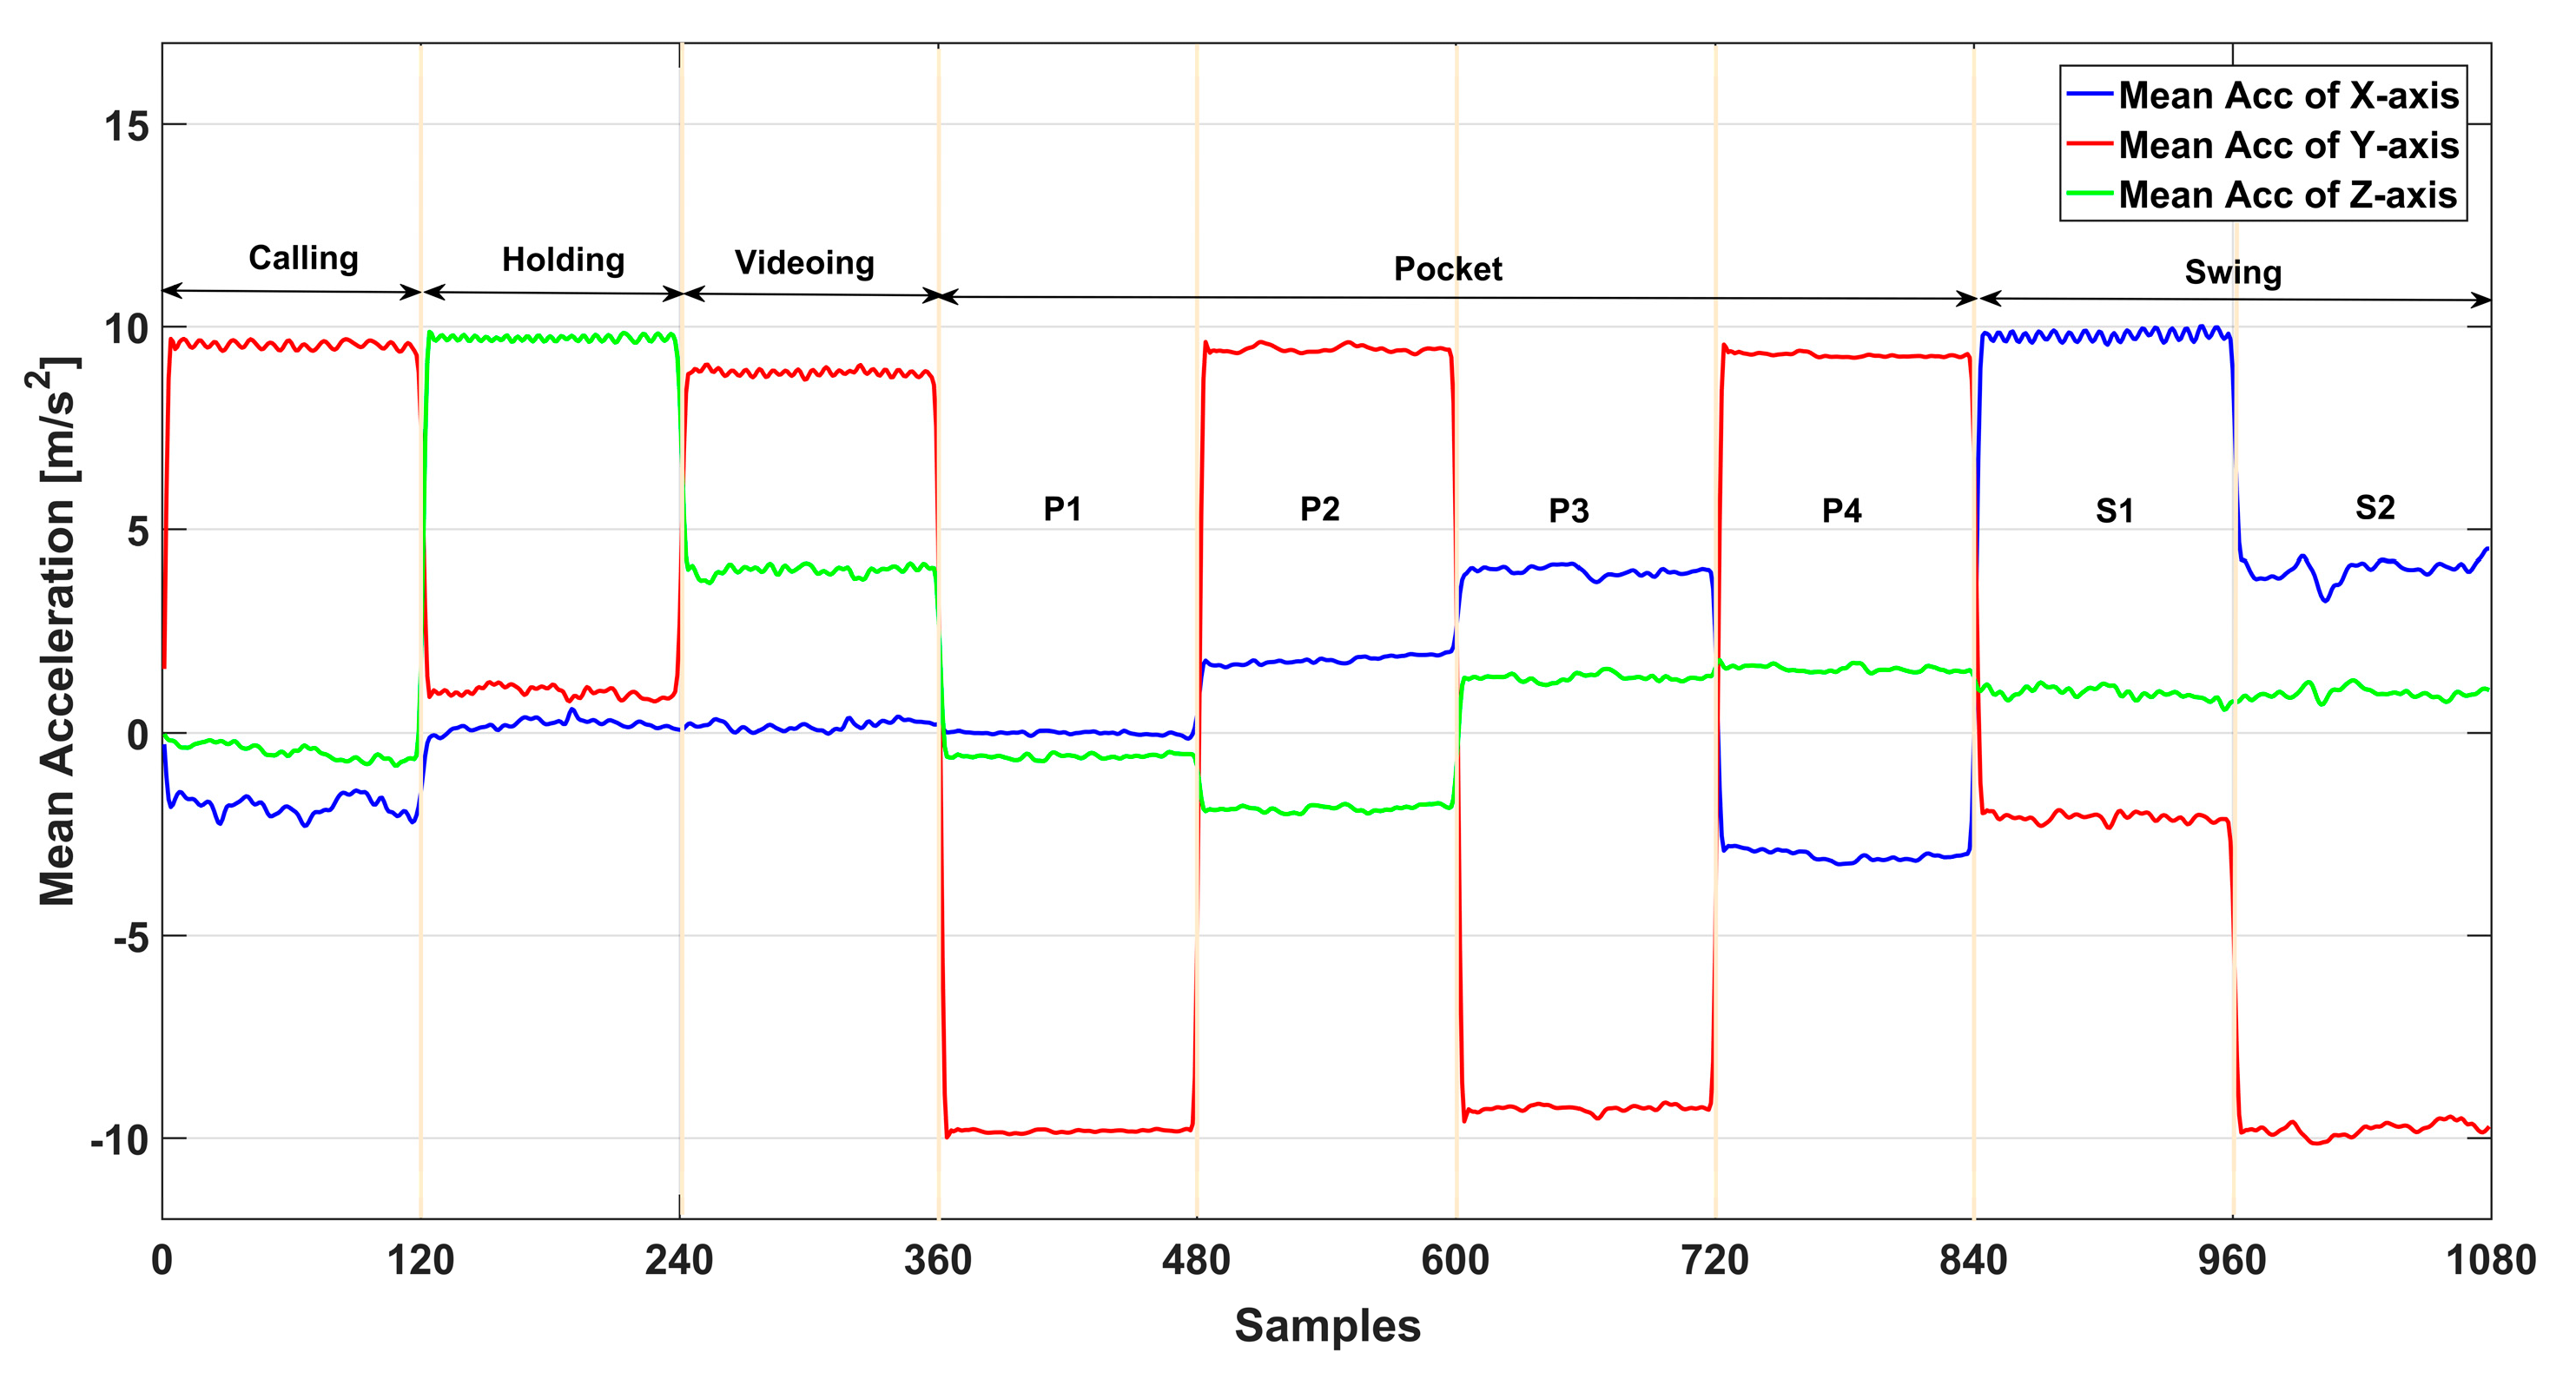
2.2.1. Feature Extraction
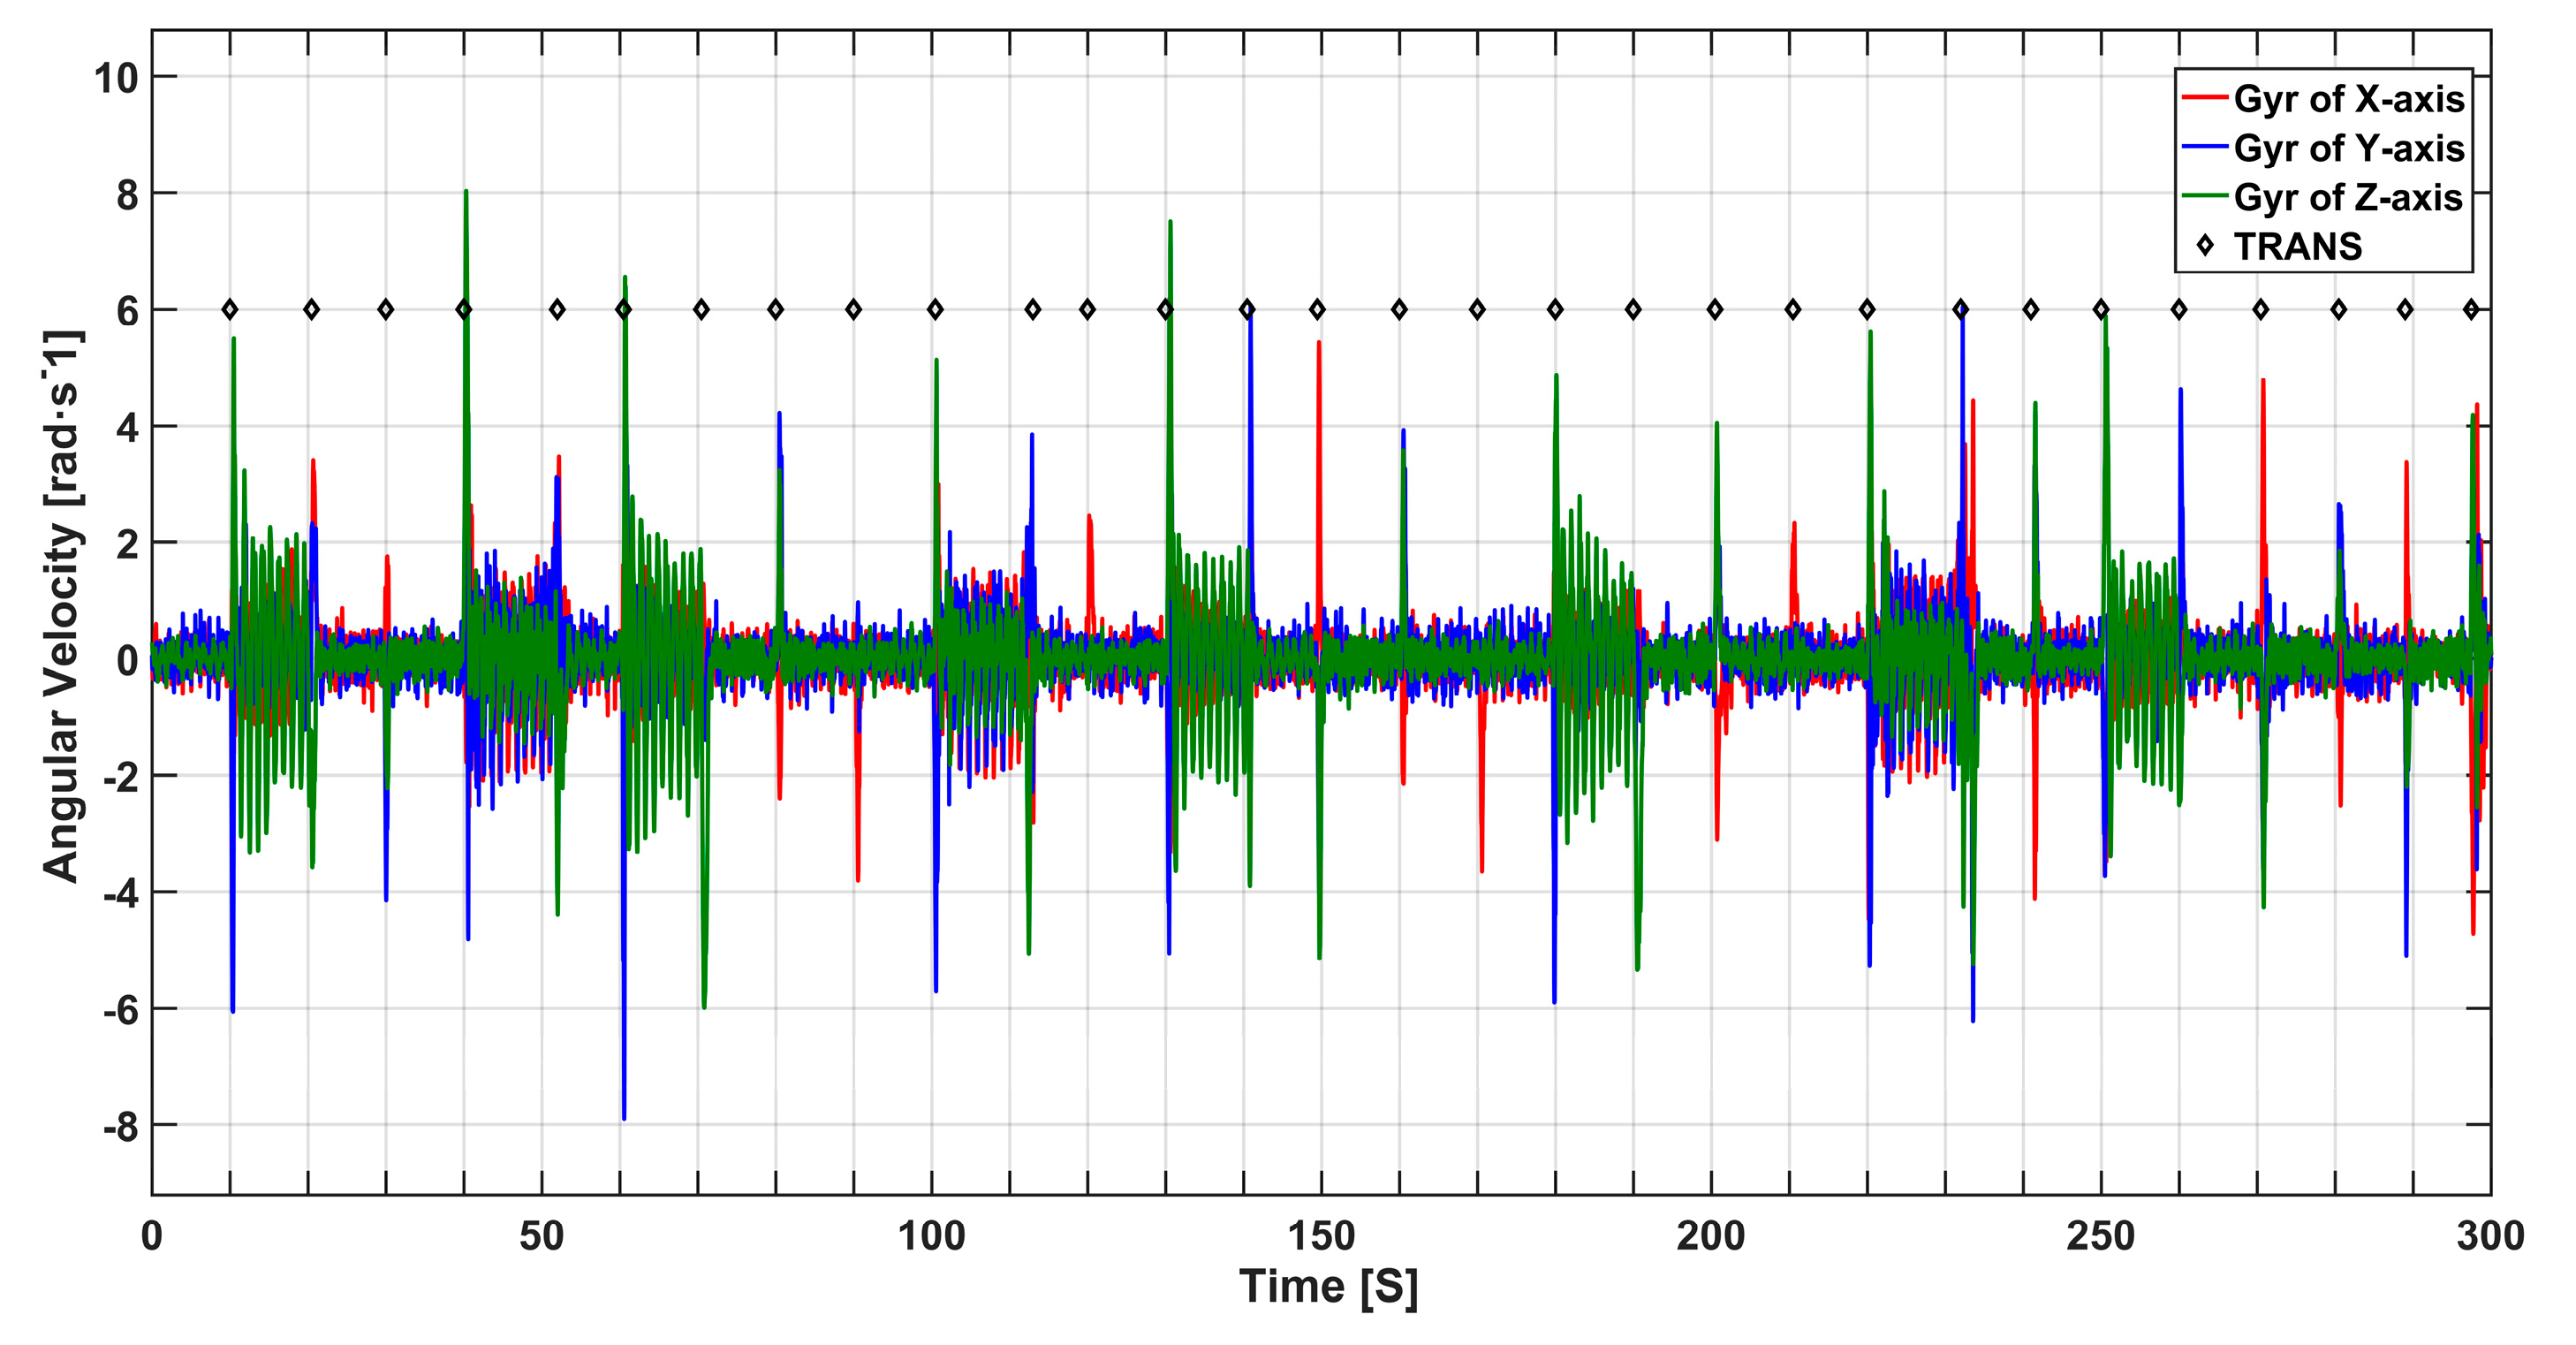
2.2.2. Mode Monitoring and Classification
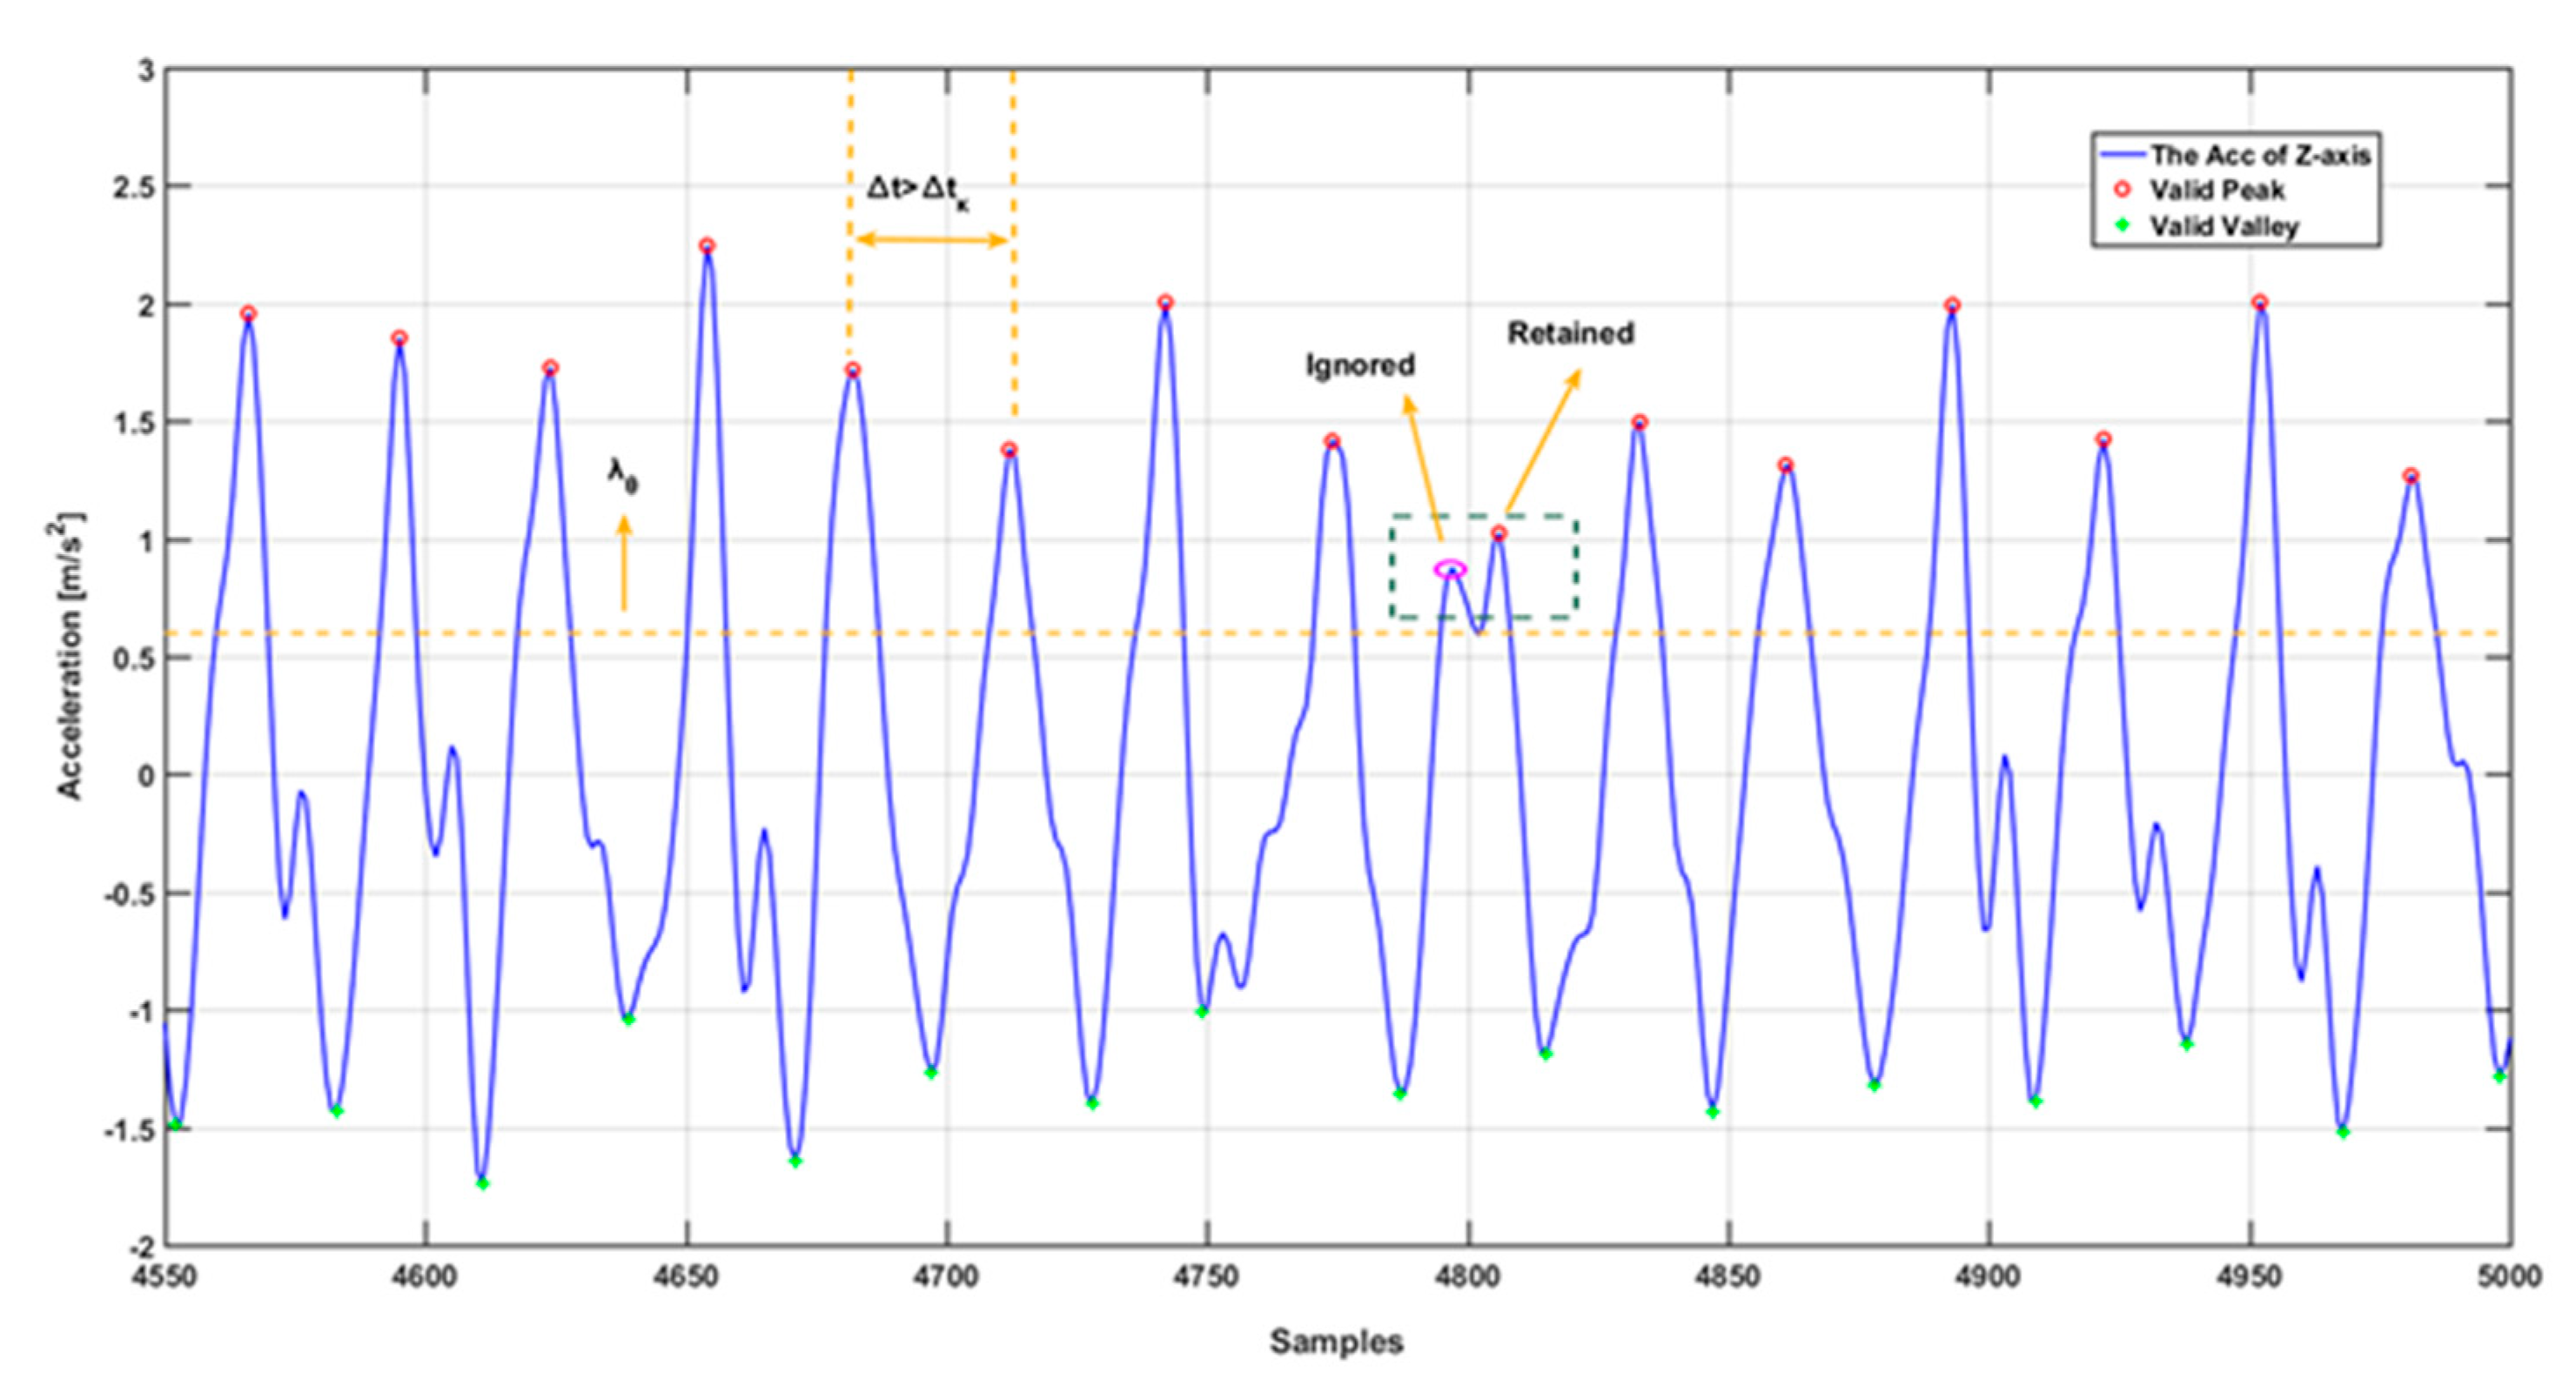
2.3. Step Detection and Step Length Estimation
2.4. Heading Estimation
2.4.1. Global Heading
2.4.2. Heading Estimation and Localization Assisted by PF and Map Matching
3. Results and Discussion
3.1. Experimental Conditions
3.2. Mode Monitoring and Classification Experiment
3.3. Localization Experiment
4. Conclusions
Author Contributions
Funding
Acknowledgments
Conflicts of Interest
References
- Pei, L.; Liu, D.; Zou, D.; Lee Fook Choy, R.; Chen, Y.; He, Z. Optimal Heading Estimation Based Multidimensional Particle Filter for Pedestrian Indoor Positioning. IEEE Access 2018, 6, 49705–49720. [Google Scholar] [CrossRef]
- Foxlin, E. Pedestrian tracking with shoe-mounted inertial sensors. IEEE COMPUT GRAPH 2005, 25, 38–46. [Google Scholar] [CrossRef] [PubMed]
- Kang, X.; Huang, B.; Qi, G. A Novel Walking Detection and Step Counting Algorithm Using Unconstrained Smartphones. Sensors 2018, 18, 297. [Google Scholar] [CrossRef] [PubMed] [Green Version]
- Lai, Y.; Chang, C.; Tsai, C.; Huang, S.; Chiang, K. A Knowledge-Based Step Length Estimation Method Based on Fuzzy Logic and Multi-Sensor Fusion Algorithms for a Pedestrian Dead Reckoning System. ISPRS Int. J. Geo-Inf. 2016, 5, 70. [Google Scholar] [CrossRef] [Green Version]
- Wang, J.; Hu, A.; Li, X.; Wang, Y. An Improved PDR/Magnetometer/Floor Map Integration Algorithm for Ubiquitous Positioning Using the Adaptive Unscented Kalman Filter. ISPRS Int. J. Geo-Inf. 2015, 4, 2638–2659. [Google Scholar] [CrossRef] [Green Version]
- Chen, J.; Ou, G.; Peng, A.; Zheng, L.; Shi, J. An INS/Floor-Plan Indoor Localization System Using the Firefly Particle Filter. ISPRS Int. J. Geo-Inf. 2018, 7, 324. [Google Scholar] [CrossRef] [Green Version]
- Chen, J.; Ou, G.; Peng, A.; Zheng, L.; Shi, J. An INS/WiFi Indoor Localization System Based on the Weighted Least Squares. Sensors 2018, 18, 1458. [Google Scholar] [CrossRef] [Green Version]
- Baronti, P.; Barsocchi, P.; Chessa, S.; Mavilia, F.; Palumbo, F. Indoor Bluetooth Low Energy Dataset for Localization, Tracking, Occupancy, and Social Interaction. Sensors 2018, 18, 4462. [Google Scholar] [CrossRef] [Green Version]
- Han, K.; Xing, H.; Deng, Z.; Du, Y. A RSSI/PDR-Based Probabilistic Position Selection Algorithm with NLOS Identification for Indoor Localisation. ISPRS Int. J. Geo-Inf. 2018, 7, 232. [Google Scholar] [CrossRef] [Green Version]
- Lu, X.; Dong, Y.; Wang, X. A Monte Carlo Localization algorithm for 2-D indoor self-localization based on magnetic field. In Proceedings of the 2013 8th International Conference on Communications and Networking in China (CHINACOM), Guilin, China, 14–16 August 2013; pp. 563–568. [Google Scholar]
- Wang, S.; Wen, H.; Clark, R.; Trigoni, N. Keyframe based large-scale indoor localisation using geomagnetic field and motion pattern. In Proceedings of the 2016 IEEE/RSJ International Conference on Intelligent Robots and Systems (IROS), Daejeon, South Korea, 9–14 October 2016. [Google Scholar]
- Zhao, J.; Yao, J.; Su, X.; Yan, H.; Chen, J. Indoor Positioning Hardware System Design Based on RFID. Comput. Meas. Control 2011, 2011, 2848–2850. [Google Scholar] [CrossRef]
- Han, S.; Kim, J.; Park, C.H.; Yoon, H.C.; Heo, J. Optimal Detection Range of RFID Tag for RFID-based Positioning System Using the k-NN Algorithm. Sensors 2009, 9, 4543–4558. [Google Scholar] [CrossRef] [PubMed]
- Bing, W.; Yanyan, L.; Qingquan, L.; Yan, Z. A High-precision Dynamic Indoor Localization Algorithm Based on UWB Technology. In Proceedings of the 2018 Ubiquitous Positioning, Indoor Navigation and Location-Based Services (UPINLBS), Wuhan, China, 22–23 March 2018; pp. 1–7. [Google Scholar]
- Mazhar, F.; Khan, M.G.; Sällberg, B. Precise Indoor Positioning Using UWB: A Review of Methods, Algorithms and Implementations. Wireless Pers. Commun. 2017, 97, 4467–4491. [Google Scholar] [CrossRef]
- Li, Z.; Liu, C.; Gao, J.; Li, X. An Improved WiFi/PDR Integrated System Using an Adaptive and Robust Filter for Indoor Localization. ISPRS Int. J. Geo-Inf. 2016, 5, 224. [Google Scholar] [CrossRef] [Green Version]
- Li, X.; Wang, J.; Liu, C.; Zhang, L.; Li, Z. Integrated WiFi/PDR/Smartphone Using an Adaptive System Noise Extended Kalman Filter Algorithm for Indoor Localization. ISPRS Int. J. Geo-Inf. 2016, 5, 8. [Google Scholar] [CrossRef] [Green Version]
- Sun, T.; Zheng, L.; Peng, A.; Tang, B.; Ou, G. Building information aided Wi-Fi fingerprinting positioning system. Comput. Electr. Eng. 2018, 71, 558–568. [Google Scholar] [CrossRef]
- Sun, T.; Fu, W.; Peng, A.; Zheng, L.X.; Tang, B.Y. RSS-based Map Construction for Indoor Localization. In Proceedings of the International Conference on Indoor Positioning and Indoor Navigation (IPIN), Nantes, France, 24–27 September 2018. [Google Scholar]
- Ozcan, K.; Velipasalar, S. Robust and reliable step counting by mobile phone cameras. In Proceedings of the 9th International Conference on Distributed Smart Cameras, Seville, Spain, 8 September 2015; pp. 164–169. [Google Scholar]
- Wu, D.; Chen, R.; Chen, L. Visual Positioning Indoors: Human Eyes vs. Smartphone Cameras. Sensors 2017, 17, 2645. [Google Scholar] [CrossRef] [Green Version]
- Afzal, M.H.; Renaudin, V.; Lachapelle, G. Magnetic field based heading estimation for pedestrian navigation environments, International. In Proceedings of the 2011 International Conference on Indoor Positioning and Indoor Navigation, Guimaraes, Portugal, 21–23 September 2011. [Google Scholar]
- Poulose, A.; Kim, J.; Han, D.S. Indoor Localization with Smartphones: Magnetometer Calibration. In Proceedings of the 2019 IEEE International Conference on Consumer Electronics (ICCE), Las Vegas, NV, USA, 11–13 January 2019. [Google Scholar]
- Zheng, L.; Zhou, W.; Tang, W.; Zheng, X.; Ao, P.; Zheng, H. A 3D indoor positioning system based on low-cost MEMS sensors. Simulation Model. Practice Theory 2016, 65, 45–56. [Google Scholar] [CrossRef]
- Lin, S.L.; Wong, W. Improved Pedestrian Dead-Reckoning-Based Indoor Positioning by RSSI-Based Heading Correction. IEEE Sens. J. 2016, 16, 7762–7773. [Google Scholar] [CrossRef]
- Poulose, A.; Senouci, B.; Han, D.S. Performance Analysis of Sensor Fusion Techniques for Heading Estimation Using Smartphone Sensors. IEEE Sens. J. 2019, 19, 12369–12380. [Google Scholar] [CrossRef]
- Poulose, A.; Eyobu, O.S.; Han, D.S. An Indoor Position-Estimation Algorithm Using Smartphone IMU Sensor Data. IEEE Access 2019, 7, 11165–11177. [Google Scholar] [CrossRef]
- Wang, L.; Dong, Z.J.; Pei, L.; Qian, J.C.; Liu, C.X.; Liu, D.H.; Liu, P.L. A robust context-based heading estimation algorithm for pedestrian using a smartphone. In Proceedings of the Inst Navigation: Washington, Tampa, FL, USA, 14 September 2015; pp. 2493–2500. [Google Scholar]
- Yang, X.; Huang, B.; Miao, Q. A step-wise algorithm for heading estimation via a smartphone. In Proceedings of the 2016 Chinese Control and Decision Conference (CCDC), Yinchuan, China, 28–30 May 2016; pp. 4598–4602. [Google Scholar]
- Wang, B.; Liu, X.; Yu, B.; Jia, R.; Gan, X. Pedestrian Dead Reckoning Based on Motion Mode Recognition Using a Smartphone. Sensors 2018, 18, 1811. [Google Scholar] [CrossRef] [PubMed] [Green Version]
- Zhou, Y.; Zheng, X.; Xiong, H.; Chen, R. Robust Indoor Mobile Localization with a Semantic Augmented Route Network Graph. ISPRS Int. J. Geo-Inf. 2017, 6, 221. [Google Scholar] [CrossRef] [Green Version]
- Guo, S.; Xiong, H.; Zheng, X. A Novel Semantic Matching Method for Indoor Trajectory Tracking. ISPRS Int. J. Geo-Inf. 2017, 6, 197. [Google Scholar] [CrossRef]
- Chiang, K.W.; Liao, J.K.; Huang, S.H.; Chang, H.W.; Chu, C.H. The Performance Analysis of Space Resection-Aided Pedestrian Dead Reckoning for Smartphone Navigation in a Mapped Indoor Environment. ISPRS Int. J. Geo-Inf. 2017, 6, 43. [Google Scholar] [CrossRef] [Green Version]
- Guo, S.; Xiong, H.; Zheng, X.; Zhou, Y. Activity Recognition and Semantic Description for Indoor Mobile Localization. Sensors 2017, 17, 649. [Google Scholar] [CrossRef] [Green Version]
- Liu, D.; Pei, L.; Qian, J.; Wang, L.; Liu, P.; Dong, Z.; Xie, S.; Wei, W. A novel heading estimation algorithm for pedestrian using a smartphone without attitude constraints. In Proceedings of the 2016 Fourth International Conference on Ubiquitous Positioning, Indoor Navigation and Location Based Services (UPINLBS), Shanghai, China, 2–4 November 2016; pp. 29–37. [Google Scholar]
- Liu, D.; Ling, P.; Qian, J.; Lin, W.; Liu, C.; Liu, P.; Yu, W. Simplified Ellipsoid Fitting-Based Magnetometer Calibration for Pedestrian Dead Reckoning. In Proceedings of the China Satellite Navigation Conference (CSNC) 2016 Proceedings: Volume II, Changsha, China, 27 April 2016; pp. 473–486. [Google Scholar]
- Fang, J.; Sun, H.; Cao, J.; Zhang, X.; Tao, Y. A Novel Calibration Method of Magnetic Compass Based on Ellipsoid Fitting. IEEE Trans. Instrum. Meas. 2011, 60, 2053–2061. [Google Scholar] [CrossRef]
- Zhang, H.; Yuan, W.; Shen, Q.; Li, T.; Chang, H. A Handheld Inertial Pedestrian Navigation System with Accurate Step Modes and Device Poses Recognition. IEEE Sens. J. 2015, 15, 1421–1429. [Google Scholar] [CrossRef]
- Zhao, S.; Li, W.; Cao, J. A User-Adaptive Algorithm for Activity Recognition Based on K-Means Clustering, Local Outlier Factor, and Multivariate Gaussian Distribution. Sensors 2018, 18, 1850. [Google Scholar] [CrossRef] [Green Version]
- Shin, B.; Kim, C.; Kim, J.; Lee, S.; Kee, C.; Kim, H.S.; Lee, T. Motion Recognition based 3D Pedestrian Navigation System using Smartphone. IEEE Sens. J. 2016, 16, 6977–6989. [Google Scholar] [CrossRef]
- Gu, F.; Kealy, A.; Khoshelham, K.; Shang, J. User-Independent Motion State Recognition Using Smartphone Sensors. Sensors 2015, 15, 30636–30652. [Google Scholar] [CrossRef]
- Brajdic, A.; Harle, R. Walk detection and step counting on unconstrained smartphones. In Proceedings of the 2013 ACM International Joint Conference on Pervasive and Ubiquitous Computing, Zurich, Switzerland, 8–12 September 2013; pp. 225–234. [Google Scholar]
- Gu, F.; Khoshelham, K.; Shang, J.; Yu, F.; Wei, Z. Robust and Accurate Smartphone-Based Step Counting for Indoor Localization. IEEE Sens. J. 2017, 17, 3453–3460. [Google Scholar] [CrossRef]
- Pham, V.T.; Nguyen, D.A.; Dang, N.D.; Pham, H.H.; Tran, V.A.; Sandrasegaran, K.; Tran, D.T. Highly Accurate Step Counting at Various Walking States Using Low-Cost Inertial Measurement Unit Support Indoor Positioning System. Sensors 2018, 18, 3186. [Google Scholar] [CrossRef] [PubMed] [Green Version]
- Ayub, S.; Zhou, X.; Honary, S.; Bahraminasab, A.; Honary, B. Sensor Placement Modes for Smartphone Based Pedestrian Dead Reckoning. In Proceedings of the Computer, Informatics, Cybernetics and Applications, Shanghai, China, 13–16 September 2011. [Google Scholar]
- Jimenez, A.R.; Seco, F.; Prieto, C.; Guevara, J. A comparison of Pedestrian Dead-Reckoning algorithms using a low-cost MEMS IMU. In Proceedings of the 2009 IEEE International Symposium on Intelligent Signal Processing, Budapest, Hungary, 26–28 August 2009; pp. 37–42. [Google Scholar]
- O H Madgwick, S. An Efficient Orientation Filter for Inertial and Inertial/Magnetic Sensor Arrays. 2010, pp. 113–118. Available online: https://www.samba.org/tridge/UAV/madgwick_internal_report.pdf (accessed on 1 February 2020).
- Zhao, W.H.; Gao, J.X.; Li, Z.K.; Yao, Y.F. An Indoor Positioning System Based on Map-Aided KF-PF Module. Geomat. Inf. Sci. Wuhan Univ. 2018, 43, 806–812. [Google Scholar]
- Hui, W.; Lenz, H.; Szabo, A.; Bamberger, J.; Hanebeck, U.D. WLAN-Based Pedestrian Tracking Using Particle Filters and Low-Cost MEMS Sensors. In Proceedings of the 2007 4th Workshop on Positioning, Navigation and Communication, Hannover, Germany, 22 March 2007. [Google Scholar]
- Guo, S.; Xiong, H.J.; Zheng, X.W.; Zhou, Y. Indoor pedestrian trajectory tracking based on activity recognition. In Proceedings of the IEEE International Symposium on Geoscience and Remote Sensing IGARSS, Fort Worth, TX, USA, 23–28 July 2017; pp. 6079–6082. [Google Scholar]
- Tian, Q.; Salcic, Z.; Wang, K.I.K.; Pan, Y. A Multi-Mode Dead Reckoning System for Pedestrian Tracking Using Smartphones. IEEE SENS J 2016, 16, 2079–2093. [Google Scholar] [CrossRef]


| Current Mode | Rough Mode | ||||
|---|---|---|---|---|---|
| Holding | Videoing | Calling | Swing | ||
| Holding | — | ||||
| Videoing | — | ||||
| Calling | — | ||||
| Swing | — | ||||
| — | |||||
| Mode | Holding | Videoing | Calling | Swing | Accuracy | |
|---|---|---|---|---|---|---|
| Holding | 1841 | 0 | 0 | 3 | 1 | 99.78% |
| Videoing | 0 | 1880 | 0 | 0 | 50 | 97.34% |
| Calling | 4 | 8 | 1822 | 0 | 27 | 97.86% |
| Swing | 0 | 0 | 3 | 2747 | 46 | 98.22% |
| 1 | 69 | 13 | 40 | 3785 | 96.75% |
| Holding | Videoing | Calling | Swing | ||
|---|---|---|---|---|---|
| Accuracy | 95.24% | 93.85% | 91.18% | 93.94% | 90.70% |
| omission ratio | 1.19% | 3.08% | 4.41% | 4.55% | 2.33% |
| Overall omission | 3.07% | ||||
| Overall accuracy | 93.25% | ||||
| Mode | Step-Wise | Global Heading | Fusion Heading | |||
|---|---|---|---|---|---|---|
| Mean Error/° | Standard Deviation/° | Mean Error/° | Standard Deviation/° | Mean Error/° | Standard Deviation/° | |
| Holding | 4.52 | 22.16 | 4.29 | 14.97 | 1.78 | 10.19 |
| Videoing | 3.55 | 13.17 | 4.08 | 8.02 | 1.96 | 8.77 |
| Calling | 8.87 | 17.88 | 8.31 | 10.16 | 2.86 | 17.50 |
| Swing | 2.48 | 13.74 | 2.26 | 7.98 | 1.32 | 9.60 |
| 7.78 | 33.45 | 8.80 | 26.41 | 2.94 | 18.67 | |
| Mode | Step-Wise | Global Heading | Fusion Heading | |||
|---|---|---|---|---|---|---|
| Mean Error/m | Max Error/m | Mean Error/m | Max Error/m | Mean Error/m | Max Error/m | |
| Holding | 5.30 | 11.79 | 2.10 | 3.34 | 1.17 | 4.74 |
| Videoing | 1.65 | 4.59 | 2.70 | 6.13 | 2.01 | 6.51 |
| Calling | 3.29 | 11.79 | 1.67 | 2.84 | 0.88 | 3.92 |
| Swing | 3.43 | 7.94 | 2.76 | 7.77 | 1.65 | 3.66 |
| 3.45 | 8.22 | 2.85 | 6.29 | 2.11 | 7.38 | |
© 2020 by the authors. Licensee MDPI, Basel, Switzerland. This article is an open access article distributed under the terms and conditions of the Creative Commons Attribution (CC BY) license (http://creativecommons.org/licenses/by/4.0/).
Share and Cite
Wang, X.; Chen, G.; Yang, M.; Jin, S. A Multi-Mode PDR Perception and Positioning System Assisted by Map Matching and Particle Filtering. ISPRS Int. J. Geo-Inf. 2020, 9, 93. https://0-doi-org.brum.beds.ac.uk/10.3390/ijgi9020093
Wang X, Chen G, Yang M, Jin S. A Multi-Mode PDR Perception and Positioning System Assisted by Map Matching and Particle Filtering. ISPRS International Journal of Geo-Information. 2020; 9(2):93. https://0-doi-org.brum.beds.ac.uk/10.3390/ijgi9020093
Chicago/Turabian StyleWang, Xuan, Guoliang Chen, Mengyi Yang, and Saizhou Jin. 2020. "A Multi-Mode PDR Perception and Positioning System Assisted by Map Matching and Particle Filtering" ISPRS International Journal of Geo-Information 9, no. 2: 93. https://0-doi-org.brum.beds.ac.uk/10.3390/ijgi9020093