1. Introduction
Wayfinding is an almost daily operation defined as the process of determining a route, learning the route, and retracing or reversing the route from memory [
1]. Spatial orientation (i.e., determining the direction one is facing in a given spatial reference) is a key task in wayfinding and is closely related to spatial self-localization (i.e., determining one’s location). Both spatial orientation and self-localization are often performed at decision points. To facilitate these two tasks, external cues, such as signs, landmarks, and maps are frequently used during wayfinding.
The wayfinding process can be affected by the format of information presentation, such as landmark utility [
2,
3] and map representations [
4]. In addition, human attributes play an important role in wayfinding behavior. Sex [
5,
6], age [
7], and cultural background [
8] are confirmed factors that can influence people’s wayfinding process. The relation between wayfinding and human attributes could provide a reference for the improved human-centered design of navigation systems and wayfinding applications. Sex difference is a controversial factor that influences wayfinding and has been discussed extensively in the available literature, but most studies focus on exploring the capacities between males and females during wayfinding. These studies are not sufficient to determine the exact behavioral similarities and differences between the sexes in the wayfinding process.
Vision is a primary human sense and requires up to 40% of the brain’s functional area [
9]. In wayfinding tasks, people mainly find cues (e.g., signposts) and match them with physical maps or cognitive maps in their mind, then make a decision. The ability to observe the environment is crucial for performing wayfinding tasks. However, visual behavior differences between males and females must be further elaborated. The pattern of visual behavior may help clarify the differences in behavior between sexes and aid in the design of an advanced navigation system.
In this study, we asked participants to perform a series of spatial orientation tasks (i.e., determining which direction to go in a given scene using a map). After grouping participants into males and females, we analyzed the visual behavior differences in the following aspects: the fixation count for different categories of cues, the fixation duration for different categories of cues, the fixation duration distribution, and the switch times between the map and four categories of cues in the scene.
The remainder of this paper is structured as follows: In
Section 2, we review related works on the perception of sex differences in wayfinding and visual behavior in the context of wayfinding; in
Section 3, we describe the experimental design, including the participants, materials, and procedure; data processing and results are presented in
Section 4; in
Section 5, we discuss the research results; finally, in
Section 6, we provide a conclusion about the results and discuss future potential works.
2. Related Works
2.1. Sexed-Related Research in Wayfinding
Wayfinding has always been an essential task for human beings and remains a key aspect of modern life. People behave differently in wayfinding tasks. Sex is considered an important factor that influences the performance of daily wayfinding tasks [
10]. Many researchers have made considerable efforts to illustrate the relationship between sex and wayfinding.
A considerable amount of attention has been focused on the performance difference between males and females. Researchers have designed various experiments to study whether there are sex-related differences in accuracy and efficiency of wayfinding. Existing work also includes real-world experiments [
11] and virtual environments [
12]. However, many controversial results have been reported. For example, Martens [
12] found that females spend more time on finding targets but did not take more detours than males. Lin [
13] designed wayfinding tasks in a virtual environment and did not find conclusive evidence supporting the hypothesis that males perform better than females. Wang [
14] also found no significant differences between males and females. Hegarty [
15] found that males and females do not show differences in accuracy and reaction time. Saucier [
16] found that females perform best with the instructions provided by landmark information.
Scientists have also found that spatial anxiety and wayfinding strategies can be used to explain certain differences between males and females during wayfinding tasks. Lawton [
17] reported that women feel more anxiety than men during wayfinding and that this increased anxiety leads to more mistakes [
18]. Males and females adopt different navigation strategies. For example, Lawton found that males use an orientation strategy in finding their way, whereas females tend to adopt a routing strategy [
5]. Females also rely more on landmarks than males, while males prefer a combination of landmarks and route description [
19].
In-depth theories have been proposed to explain sex differences. A biological theory was proposed by many researchers to illustrate the differences [
20]. These researchers suggested that due to genetic differences, males and females develop different abilities related to spatial cognition and wayfinding. Silverman hypothesized that social division of labor between males and females during early human history caused these sex differences [
21]. This theory proposed that females spent most of their time in domestic environments looking after children while males found food far away from home, which caused males to develop greater spatial cognition than females.
Disputed results and complex factors leading to sex differences provide evidence for sex differences. Another aspect of sex differences in wayfinding discussed by researchers is how males and females interact with the environment, which is important for designing human-centered navigation aids to improve the wayfinding ability of both males and females.
2.2. Sexed-Related Research in Visual Behavior
Sex differences in visual behavior have been studied in many non-spatial contexts, and a relationship between sex and visual behavior has been shown [
22,
23,
24]. Sex also plays an important role in spatial cognition ability [
6,
25]. Specifically, it has been widely recognized that sex is related to differences in many aspects, such as wayfinding strategies [
5] and arithmetical reasoning, and these differences have been verified using many approaches, including the use of functional magnetic resonance imaging (FMRI) to study the active area of the brain when performing spatial tasks [
26,
27].
The academic literature on sex differences in visual behavior has revealed several patterns. For example, females are more likely than males to focus their visual attention on landmarks [
16]. A greater number of landmarks helps females perform better in wayfinding tasks [
28], however, the performance may be inverse given a different map format. For example, Liao found that males focus more than females on 3D map landmarks, while for 2D maps, females focus their visual attention on landmarks to a greater extent than do males [
29]. According to Lin [
13], males and females perform better when using global and local landmark information, respectively.
There are also several studies discussing sex differences in eye-tracking indices during the performance of wayfinding tasks; visual attention on landmarks has been discussed substantially, and other eye-tracking indices also show differences between males and females. For example, Sven [
30] found sex differences in fixation duration and pupil diameter when performing a spatial navigation task. Valentina [
31] found that when planning a route, the number of fixations and fixation ratio between males and females is significantly different, but these studies are limited to pure eye-tracking data without considering semantic information on the environment.
2.3. Visual Behavior Studies on Wayfinding
Eye-tracking sensors have been widely used in the study of wayfinding to gain real insights into human behavior. During the wayfinding process, people obtain information about the scene, and wayfinding tools, such as maps, navigation aids, and other sources of information are related to eye movement behavior. Compared to traditional methods such as interviews [
32], questionnaires [
33] and drawing sketch maps [
34], for wayfinding studies, the eye-tracking method provides more objective and intuitive data for analysis. This method is also a popular approach in the fields of spatial cognition and cartography.
A group of studies used eye-tracking methods to study the process of wayfinding. Visual attention, an index of fixation location, is the most commonly used index in eye-tracking related research. For example, Kiefer [
35] observed the use of different strategies employed by participants based on visual attention to maps and real scenes. Other studies attempted to find the start time of visual attention by using the first fixation on areas of interest (AOIs) [
36] or whether fixation falls on AOIs throughout the tasks, which represents the efficiency of wayfinding. However, one limitation to visual attention is that it does not involve how people look when they make decisions. Another type of eye-tracking index is the fixation time; Viaene [
37] used the average fixation time and fixation time maximum to rank the most fixated-upon landmark in an indoor environment. The eye gaze shift is also a useful index in wayfinding studies. Wiener [
38] calculated the gaze shifts between the center of the AOI and the image edge before making a decision in a virtual environment. Kiefer [
39] established a self-localization test in an urban environment and found that more switches between map labels and corresponding landmarks in the environment helped participants perform better in the tasks. Pupil size, as an indicator of cognition load, can also be used to measure the wayfinding process [
40]. For example, Condappa [
41] found more cognitively demanding configuration strategies to be associated with increases in pupil dilation.
Given the context of wayfinding, visual behavior is defined by visual attention, fixation time, and gaze shifts between specific AOIs to simplify the environment. In reality, understanding how eye movements interact between a complex environment (which has roads, signposts, and buildings) and a map requires the consideration of both landmarks and non-landmarks, such as roads and cars, which may disrupt people’s concentration. A complex assessment of the environment’s effect on wayfinding is required based on available visual behavior studies on wayfinding.
3. Materials and Methods
3.1. Participants
Forty undergraduate and graduate students (20 females and 20 males) from Beijing Normal University participated in this experiment voluntarily. Their ages ranged from 20 to 30 (Mean (M)male = 24.54, Standard Deviation (SD)male = 2.32; Mfemale = 22.56, SDfemale = 2.32). All participants had normal or corrected-to-normal vision. All participants had a basic knowledge of reading maps and experience with the use of electronic maps in pedestrian navigation. None of them had prior knowledge of the experimental materials. Sample rates of all participants were over 70%. Each participant was paid 15 yuan as compensation for participating in the experiment. The experiment was reviewed and approved by the local institutional board of the authors’ university. All participants provided their written consent.
3.2. Apparatus
The eye tracker used in our experiment was the Tobii T120 eye tracker (USA, Tobii AB;
www.tobii.com). This eye tracker has a tracking accuracy of 0.5° and a sampling rate of 120 Hz. Tobii Studio v3.2 software was used to process the eye movement data. The experimental materials were presented on a 17 inch monitor, with a resolution of 1280 × 1024. The experiment was set in an eye-tracking laboratory with sufficient light and a noise-free environment.
3.3. Materials
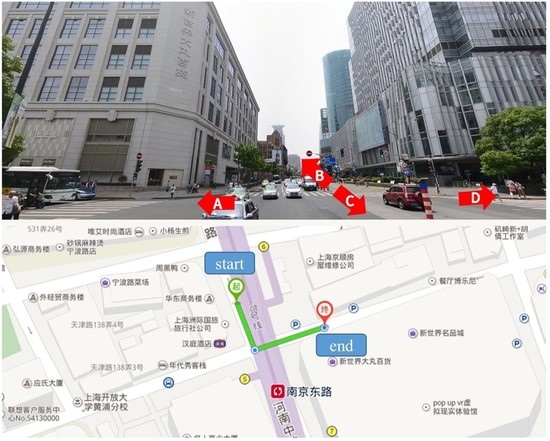
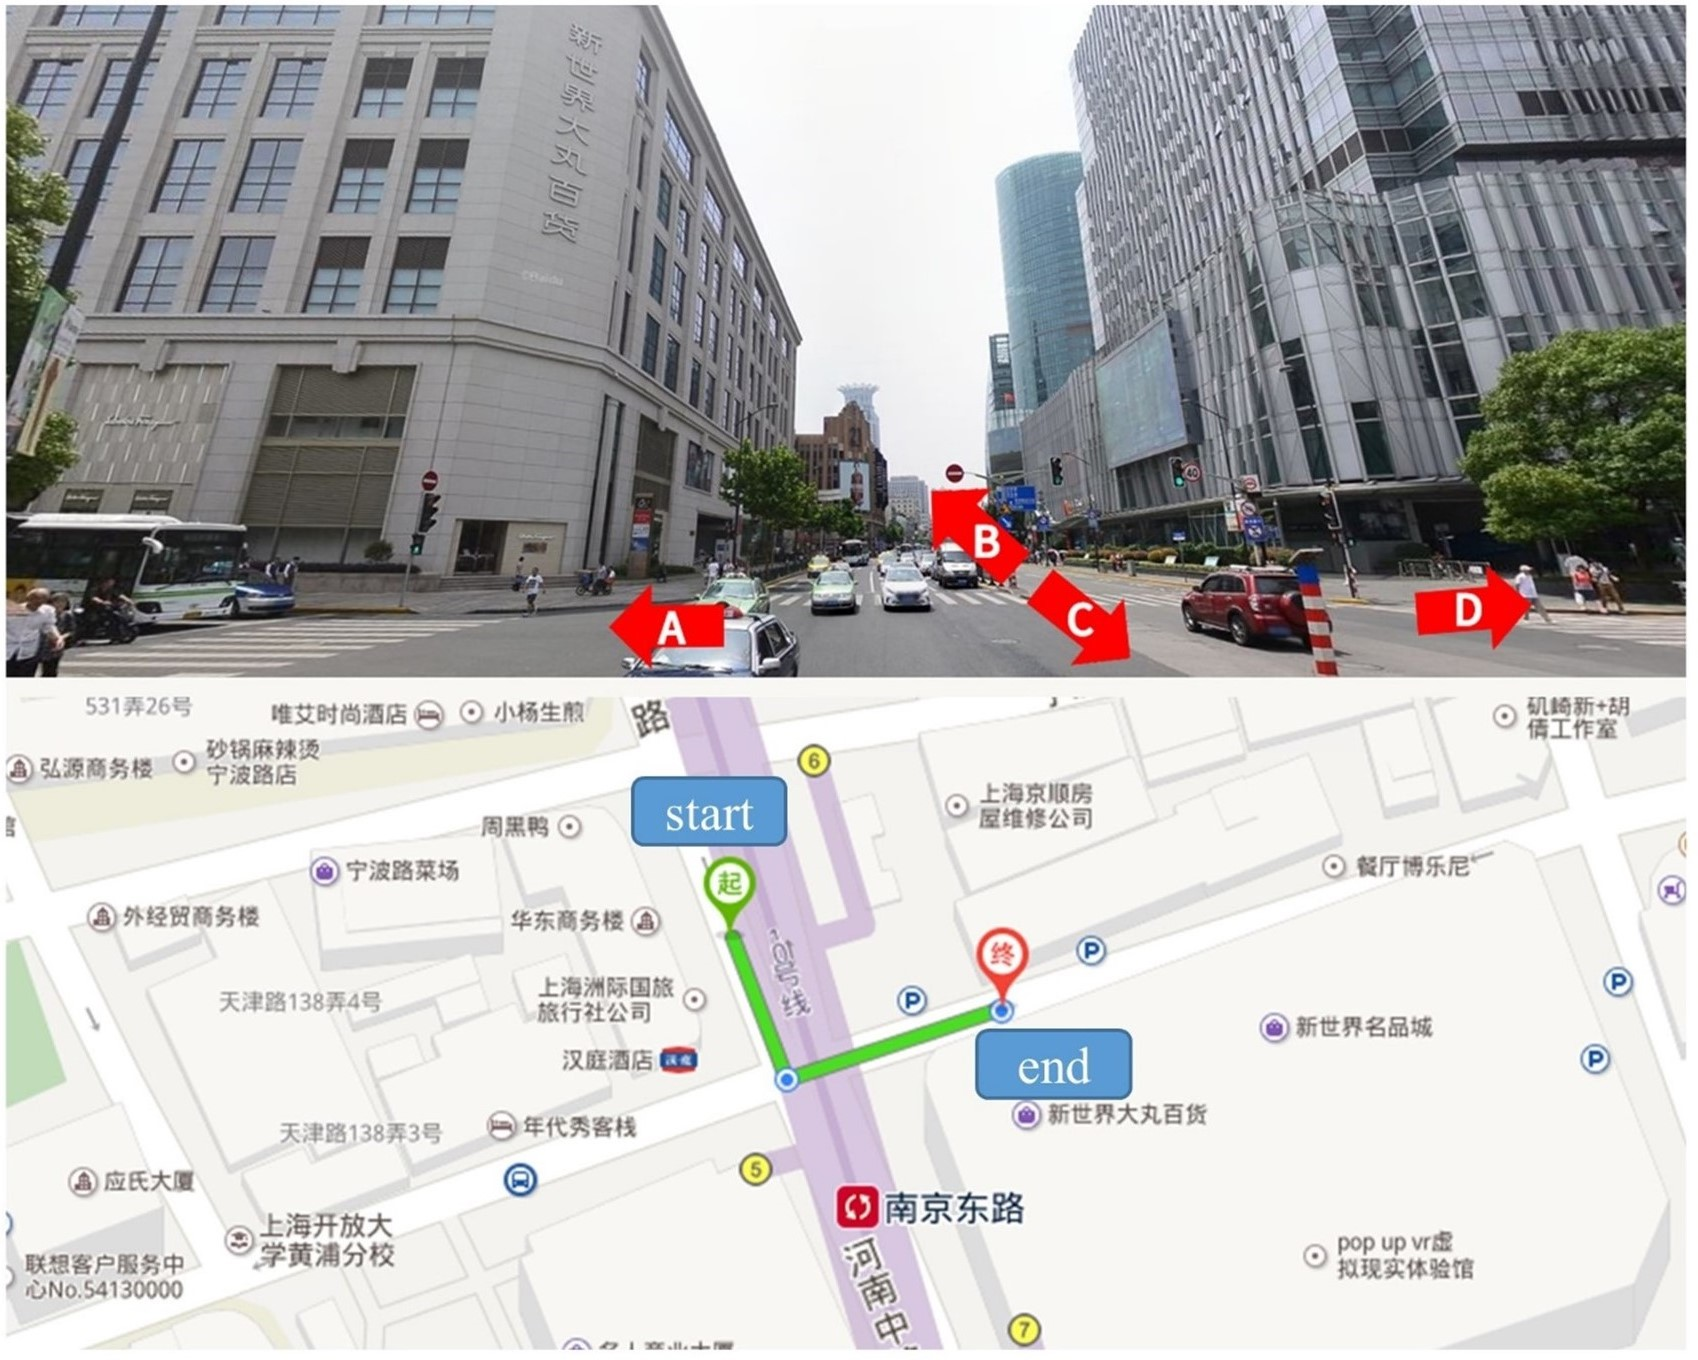
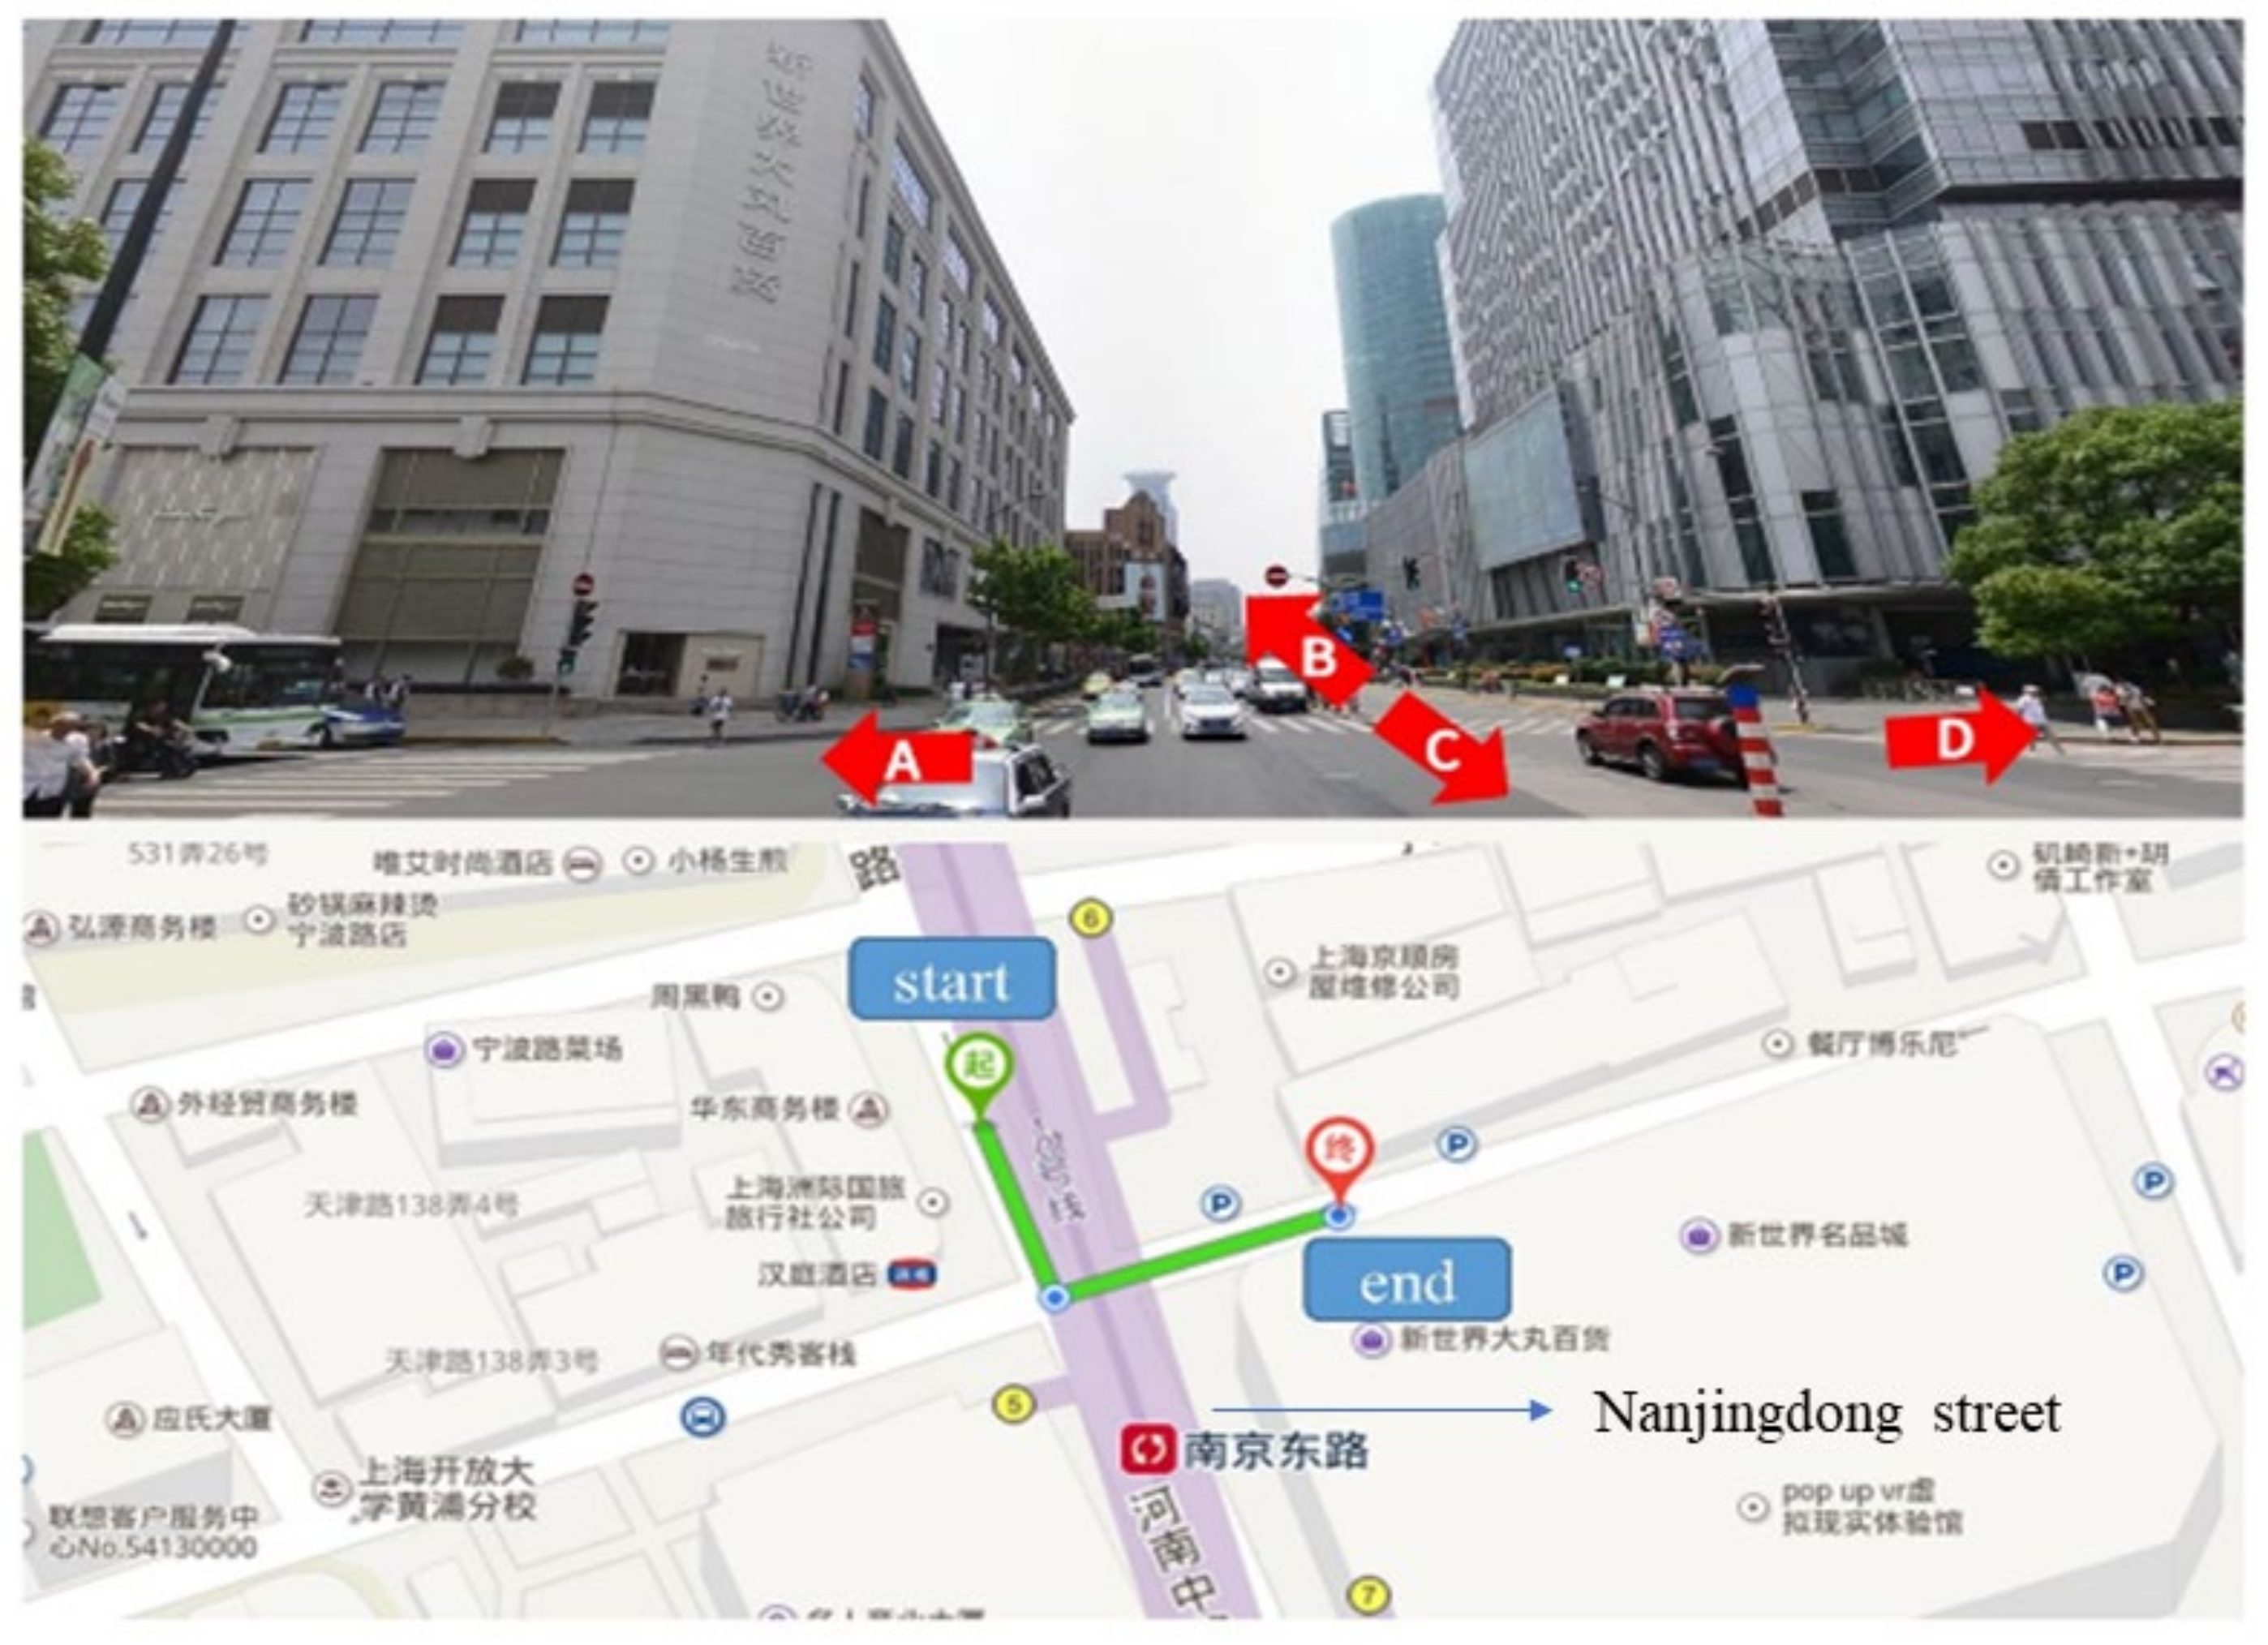
We designed 20 spatial orientation tasks for the experiment. In each task, an image was shown on the screen (
Figure 1). The top half of the image was a scene of an urban environment that was captured with Baidu Street View (
http://ditu.baidu.com). The scene showed a junction of two or more roads and included landmarks, such as buildings and signposts. The text on the signposts and buildings was clear enough to be recognized. There were several candidate arrows (e.g., A, B, C, and D) in the scene indicating different turning directions at the junction. The bottom half of the image comprised an electronic map from the internet corresponding to the scene. On the map, a route with a turn at the junction was labelled. The start and endpoints were also shown on the map. All selected scenes were located in Nanjing and Shanghai, China. None of the participants were familiar with these places. Both the street views and maps were provided by Baidu Map (
https://map.baidu.com).
3.4. Procedure
The participants were first welcomed and briefly introduced to the experiment. Their eyes were then calibrated using five-point calibration methods to ensure tracking accuracy. The participants then read task instructions and started with an example task. The instructions were as follows:
Imagine that you are following the route on the map (lower) to go to your destination. Currently, you are standing at the turning point. A picture of the turning point is presented on the upper half of the screen. Four directions (arrows), labelled A, B, C, and D, are shown in the picture. Please read the map and the picture carefully and decide which direction you should turn towards. When you have made a decision, click one of the labels. You have 90 s for the task, and if you do not make a decision when time is up, then the task will be skipped automatically.
After the example task, the participants were required to accomplish another 20 tasks similar to the task shown in
Figure 1. Half of the participants (10 males and 10 females) completed the tasks in sequence. For the other half of participants, the sequence of the tasks was reversed. The participants were required to complete a questionnaire regarding to their demographic information, such as age, university major, and experience with using maps in wayfinding. The experiment took approximately 15 min for each participant.
4. Results
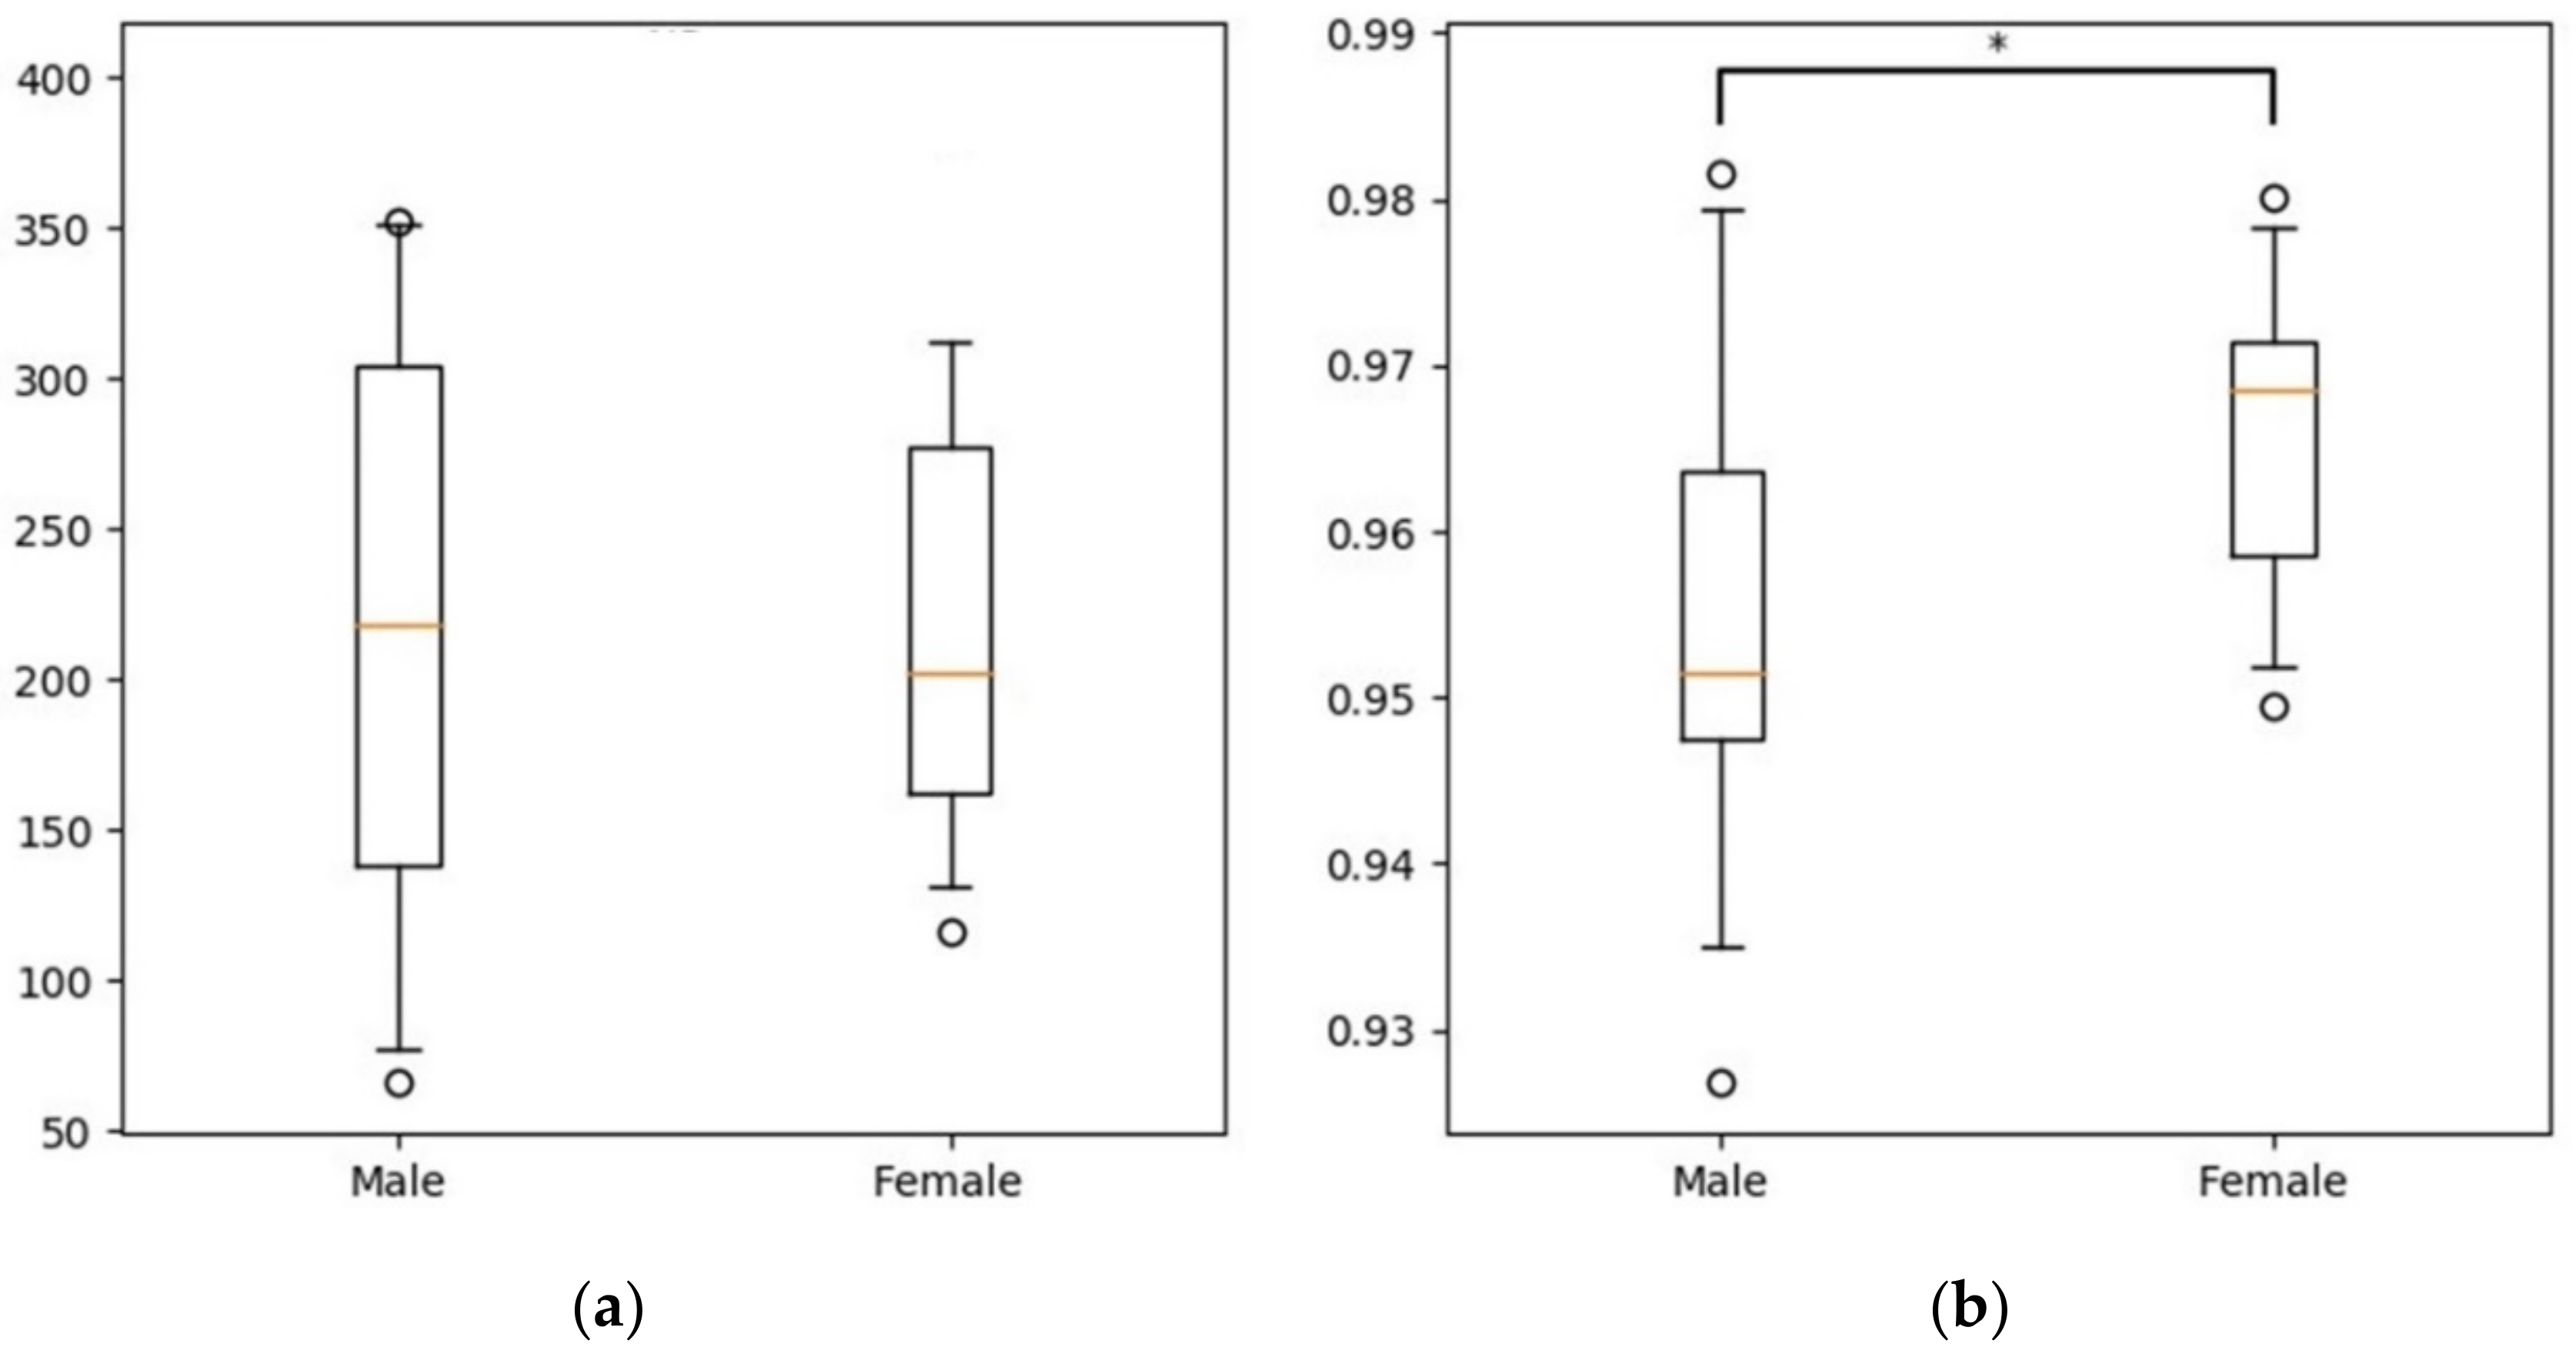
4.1. General Performance
General performance in wayfinding can be assessed based on efficiency (response time) and accuracy. We used the number of correct answers and the completion time for all tasks to measure the accuracy and response time, respectively.
t-tests were applied to test the significance of the sex differences in these two metrics. We also calculated Cohen’s
d [
42] as metric of effect size, where 0.3 to 0.5 was considered small, 0.5 to 0.8 was considered medium, and above 0.8 was considered large. The results are shown in
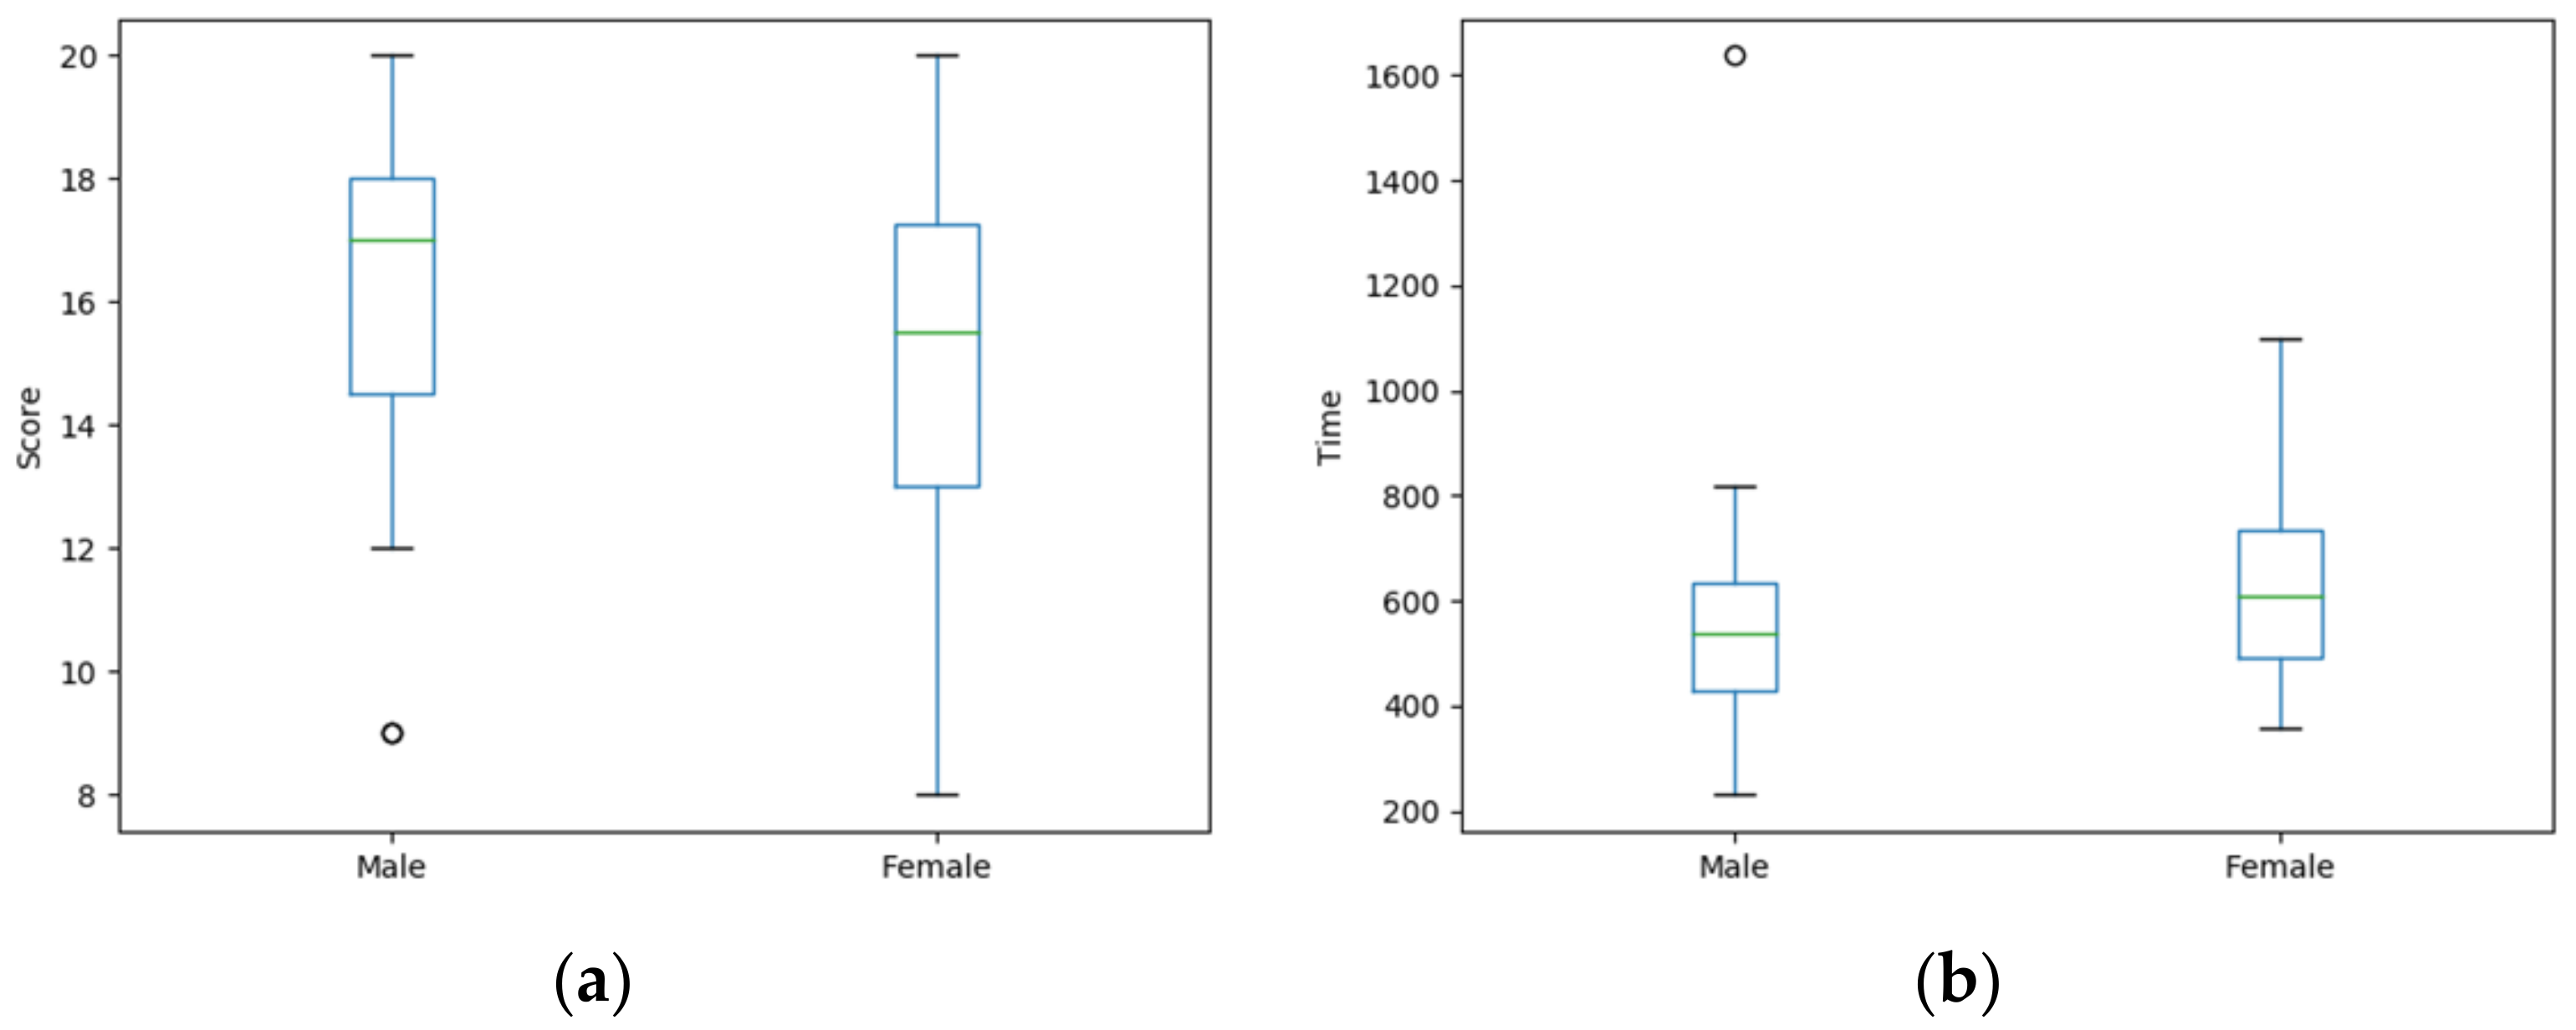
Table 1 and
Figure 2. Males achieved higher accuracy (M = 16.0, SD = 3.129) than females (M = 15.05, SD = 3.170;
t = 0.917,
p = 0.365, Cohen’s
d = 0.304), but the result is not significant. Males spent less tie performing the tasks (M = 581.363 s, SD = 283.113 s) than females (M = 644.464 s, SD = 201.385 s), but the difference was not significant (
t = −0.784,
p = 0.438, Cohen’s
d = 0.257).
4.2. Visual Attention
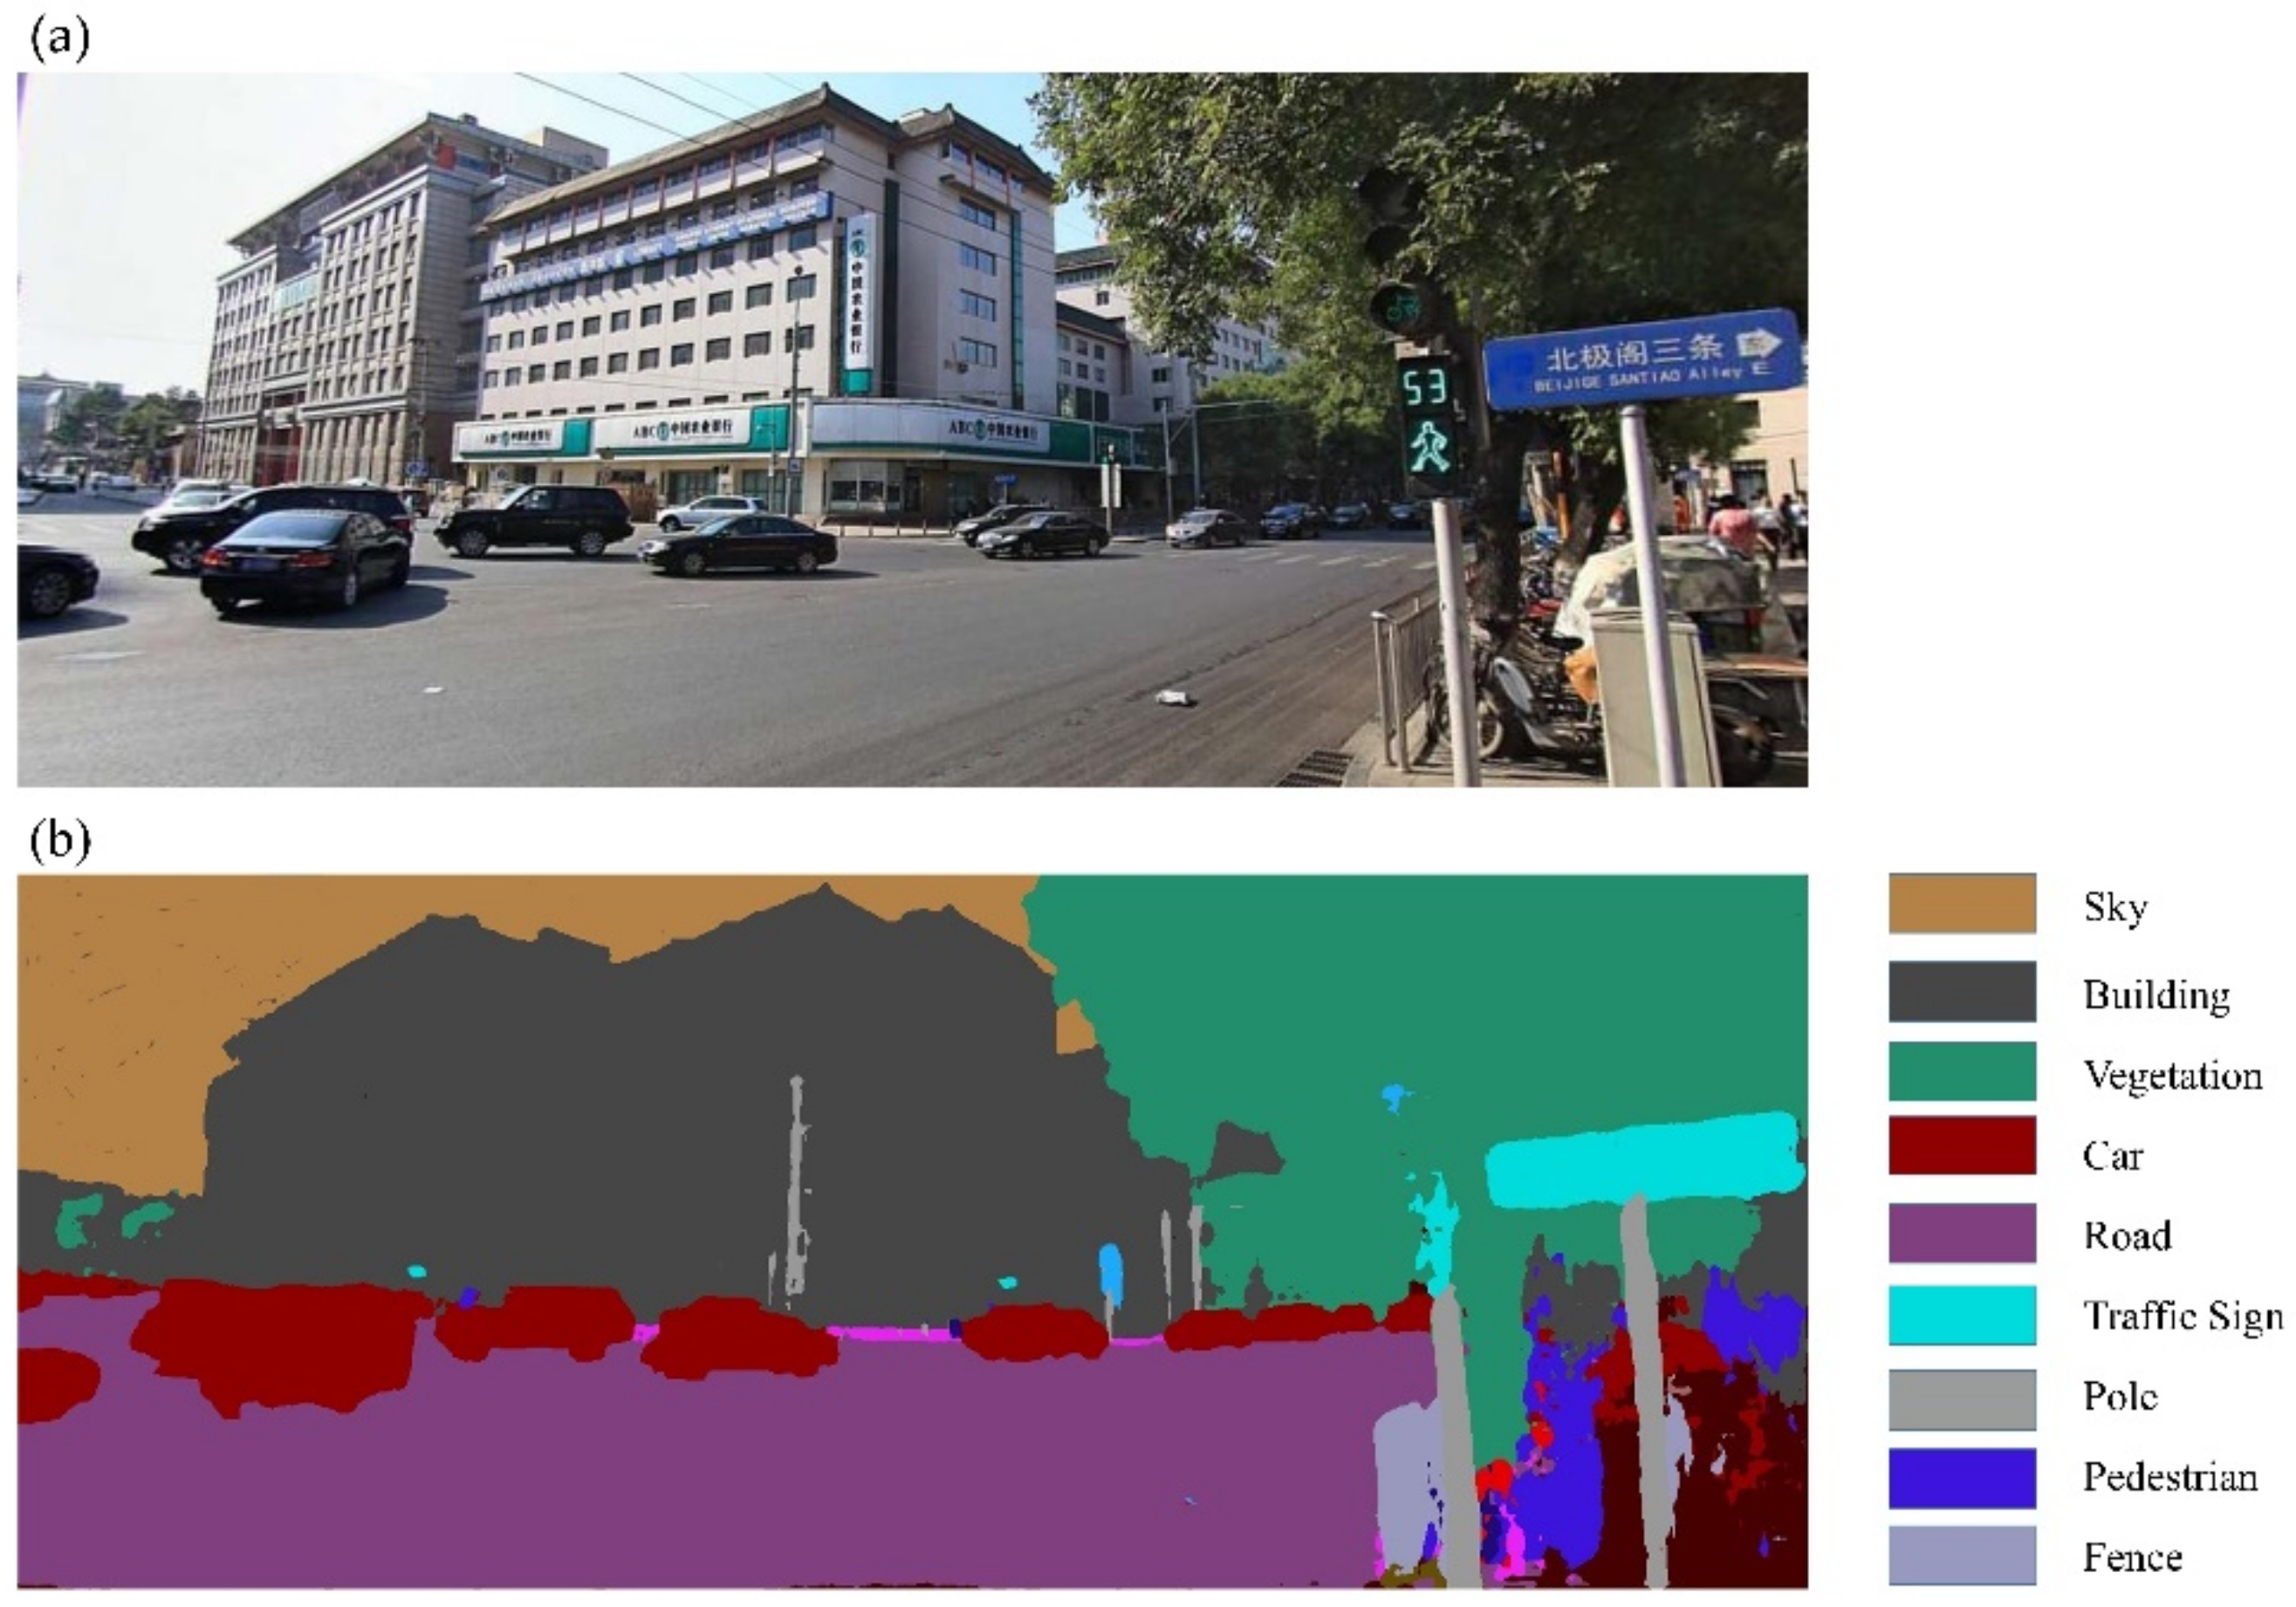
4.2.1. Image Segmentation
It is important to focus on which objects the participants saw. According to traditional methods, drawing AOIs is commonly used in many eye-tracking studies. In contrast to traditional methods, we annotated fixations using semantic image segmentation methods. This method enables for more efficient divisions of the image into different areas with high accuracy. We used Deeplabv3+ [
43], an open-source image segmentation model based on a deep neural network, to segment the images automatically. An example is shown in
Figure 3. Trained by the Cityscapes dataset [
44], Deeplabv3+ could classify each pixel into one of 19 object classes, such as roads, buildings, sky, and vegetation. Deeplabv3+ could achieve an accuracy of 82.0% and was ranked sixth in the Cityscapes dataset pixel-level semantic labelling task (
https://www.cityscapes-dataset.com/benchmarks/#scene-labeling-task) on 30 August 2018. After semantic image segmentation, we overlaid fixations on the segmented images and annotated them based on the corresponding object classes. We then reclassified the original 19 object classes into four areas of interest (AOIs;
Table 2) [
35].
Map was regarded as a single AOI category.
The first AOI category was
road, which included sidewalks and roads. Roads can provide geometrical and topological structure information for wayfinding. However, few studies have been concerned with visual behavior regarding roads. Here, we classified
road as a type of AOI. The second AOI category was
building. Buildings are a commonly used AOI in wayfinding studies. People often utilize buildings as landmarks to assist with self-localization and orientation in wayfinding. Prior studies have suggested that there are significant differences between males and females in the use of buildings during wayfinding. For example, Liao found that males’ fixation on buildings lasted for shorter durations than females’ fixation [
45]. The third AOI category was
signpost, which indicated road names and directions; it is also an essential landmark for spatial orientation. The fourth AOI category was
other objects, which included vegetation, vehicles, and people; these objects are less useful for spatial orientation, but it is interesting to explore whether these objects affect males and females differently. Finally,
map was regarded as a single AOI category used to elucidate the interaction between the map and the environment.
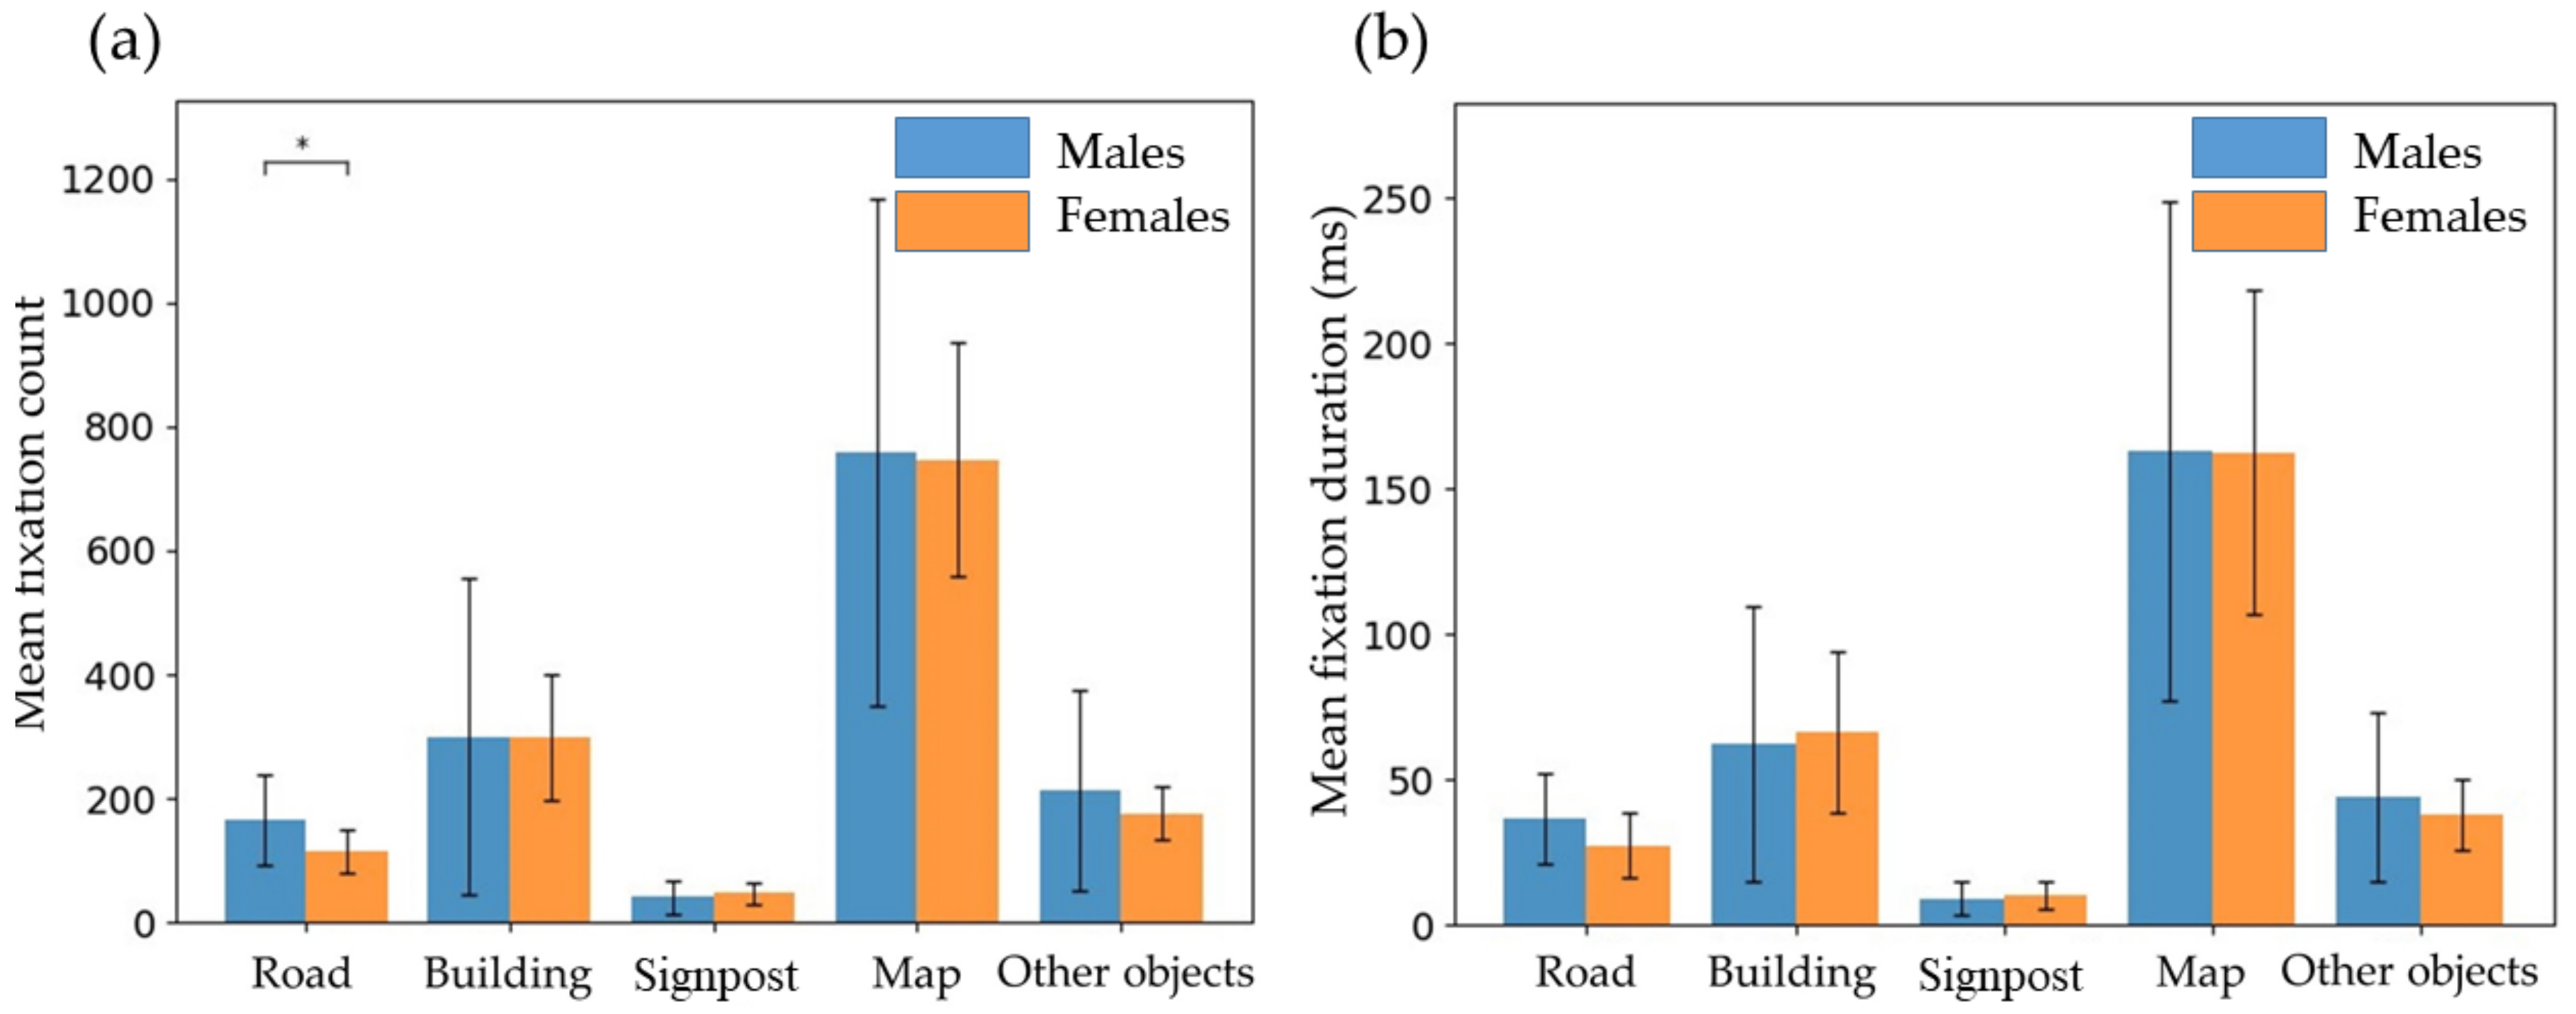
4.2.2. Fixation Count and Fixation Duration
We first tested the sex similarities and differences in the mean fixation count and mean fixation duration on the five types of AOI. The results are shown in
Table 3 and
Figure 4. The fixation count on roads by males (M = 165.929, SD = 72.821) was significantly higher than that by females (M = 114.933, SD = 34.085;
t = 2.302,
p = 0.033 Cohen’s
d = 0.897). The mean fixation count on
other objects by males (M = 213.214, SD = 160.910) was greater than that by females (M = 176.600, SD = 43.420), but the difference was not significant (
t = 0.819,
p = 0.420, Cohen’s
d = 0.311). The mean fixation count for
building,
signpost, and
map showed similar values. In particular, the male mean fixation count for
building (M = 300.071, SD = 254.603),
signpost (M = 41.714, SD = 27.230), and
map (M = 758.286, SD = 409.633) were similar to the female fixations for
building (M = 298.467, SD = 101.897),
signpost (M = 46.933, SD = 16.205), and
map (M = 745.867, SD = 188.088); no significant differences were found (
tbuilding = −0.266,
pbuilding = 0.793, Cohen’s
d = 0.008;
tsignpost = 0.544,
psignpost = 0.591, Cohen’s
d = 0.233; and
tmap = 0.026,
pmap = 0.979, Cohen’s
d = 0.039).
A similar pattern was observed for the fixation duration (
Table 4 and
Figure 4b). The fixation durations of
road,
map, and
other objects by males (M
road = 36.661 s, SD
road = 15.576 s; M
map = 163.164 s, SD
map = 85.846 s; and M
other objects = 44.123 s, SD
other objects = 29.197 s) were higher than those of females (M
road = 27.471 s, SD
road = 11.090 s; M
map = 162.444 s, SD
map = 55.839 s; and M
other objects = 38.017 s, SD
other objects = 12.412 s), while females exhibited longer mean fixation durations for
building (M = 70.231 s, SD = 22.612 s) and
signpost (M = 11.123 s, SD = 3.263 s) than males (M
building = 66.333 s, SD
building = 27.710 s; and M
signpost = 10.201 s, SD
signpost = 4.719 s). The differences were not significant (
troad = 1.775,
proad = 0.087, Cohen’s
d = 0.680;
tbuilding = −0.265,
pbuilding = 0.793, Cohen’s
d = 0.154;
tsignpost = −0.544,
psignpost = 0.591, Cohen’s
d = 0.227;
tmap = 0.026,
pmap = 0.979, Cohen’s
d = 0.010; and
tother objects = 0.715,
pother objects = 0.481, Cohen’s
d = 0.272).
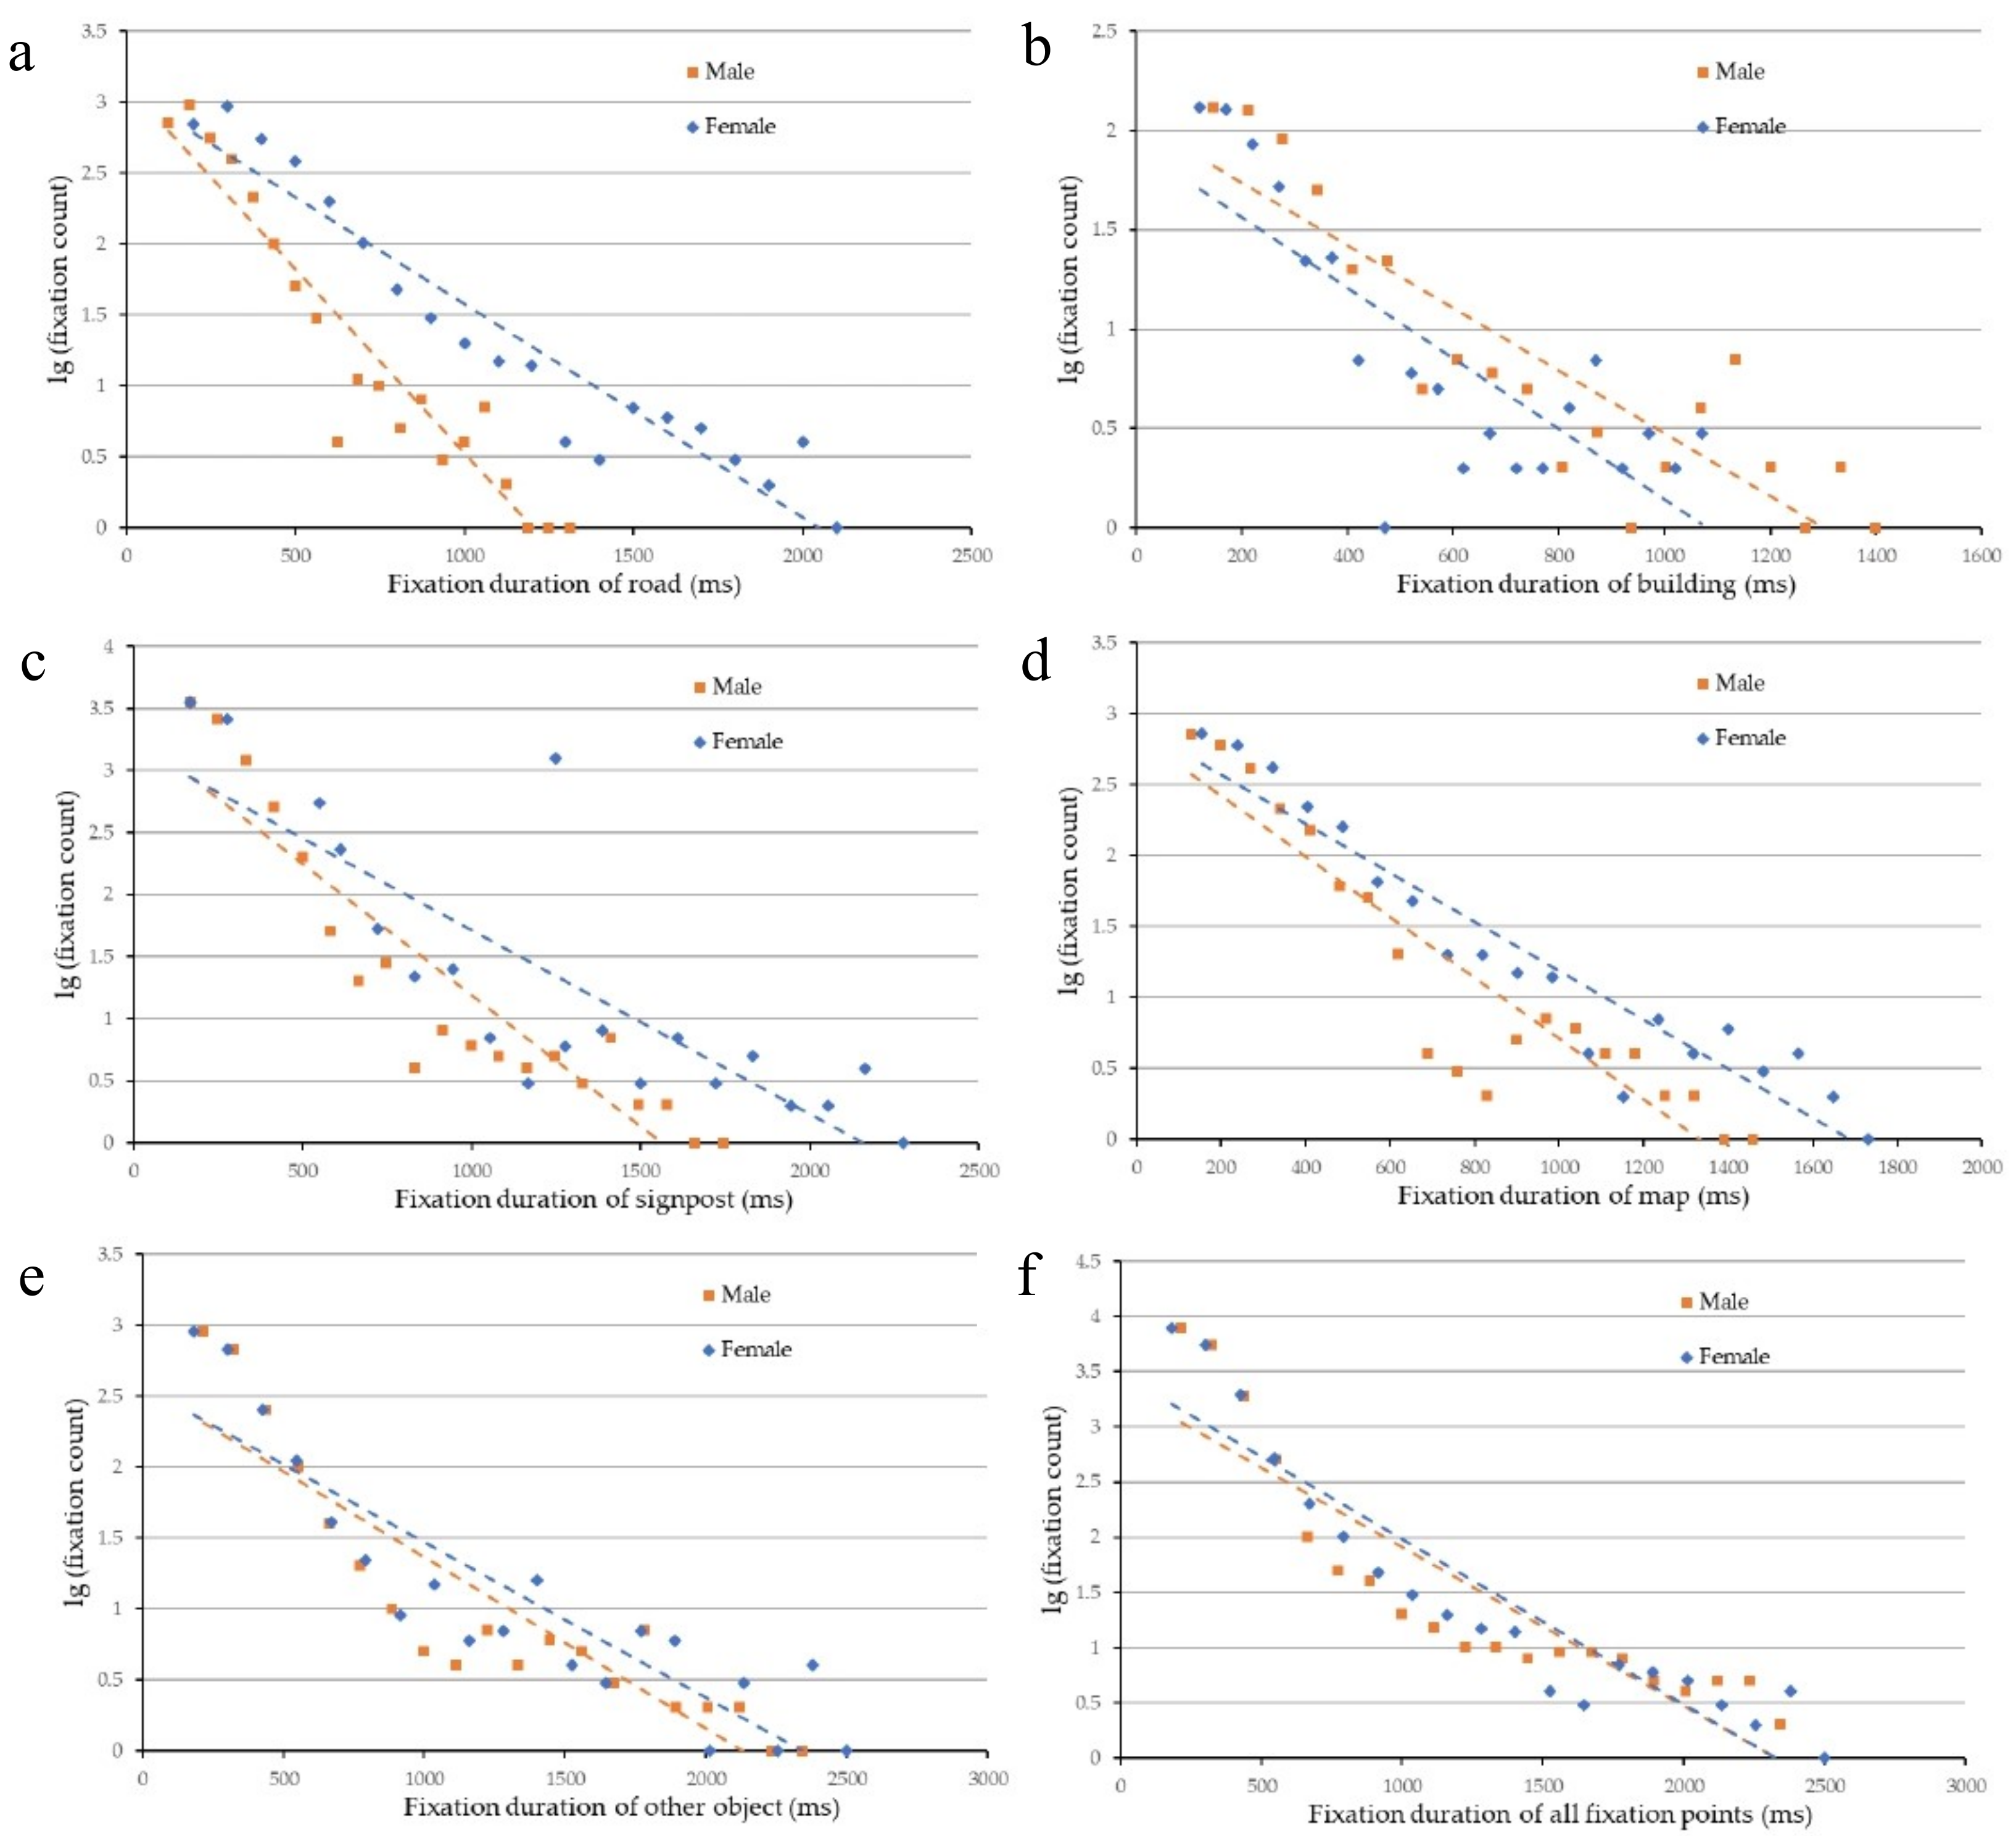
4.2.3. Fixation Duration Distribution
The mean fixation duration can reflect the average duration but does not provide distribution information. The fixation duration distribution reflects the pattern of how people distribute their attention. A long duration of looking at a certain area indicates a high level of interest or higher processing difficulty, while a short duration means indicates that certain information is valueless or easy to process. It has been empirically corroborated that the eye gaze duration obeys an exponential distribution [
46,
47]. Here, we fit the fixation duration of every participant with the formula
y =
abx, where
y is the number of fixation counts and
x is fixation duration. Parameter
b is base of the function that controls the change rate of y influenced by
x. Parameter
a is a coefficient defining the magnitude of
y. The comparison of the fitting coefficients between males and females is shown in
Table 5 and
Figure 5, which shows that
a for males (M = 216.732, SD = 56.789) is higher than that for females (M = 203.743, SD = 43,287), but the difference is not significant (
t = 0.134,
p = 0.860, Cohen’s
d = 0.257). The parameter
b for males (M = 0.951, SD = 0.543) is significantly (
t = 1.92,
p = 0.038, Cohen’s
d = 0.037) lower than that for females (M = 0.968, SD = 0.357).
Furthermore, we explored the fixation duration distribution for different AOIs (
Figure 6A–E). For
building and
other objects, males and females showed similarities in the fitness curve, while for
road,
signpost, and
map, females had a greater fixation count and a lower fixation duration than males. The total fixation duration distribution (
Figure 6F) also shows that females had more low-value fixation durations than males. We can also determine that males had a broader fixation duration range in the
building category than females. Males focused their attention for durations up to 1400 ms, and females’ fixation duration reached approximately 1040 ms. For
road,
signpost,
map, and
other objects, females showed a wider fixation duration range than males, with maximum fixation durations of 2100 ms, 2300 ms, 1750 ms, and 2500 ms, respectively.
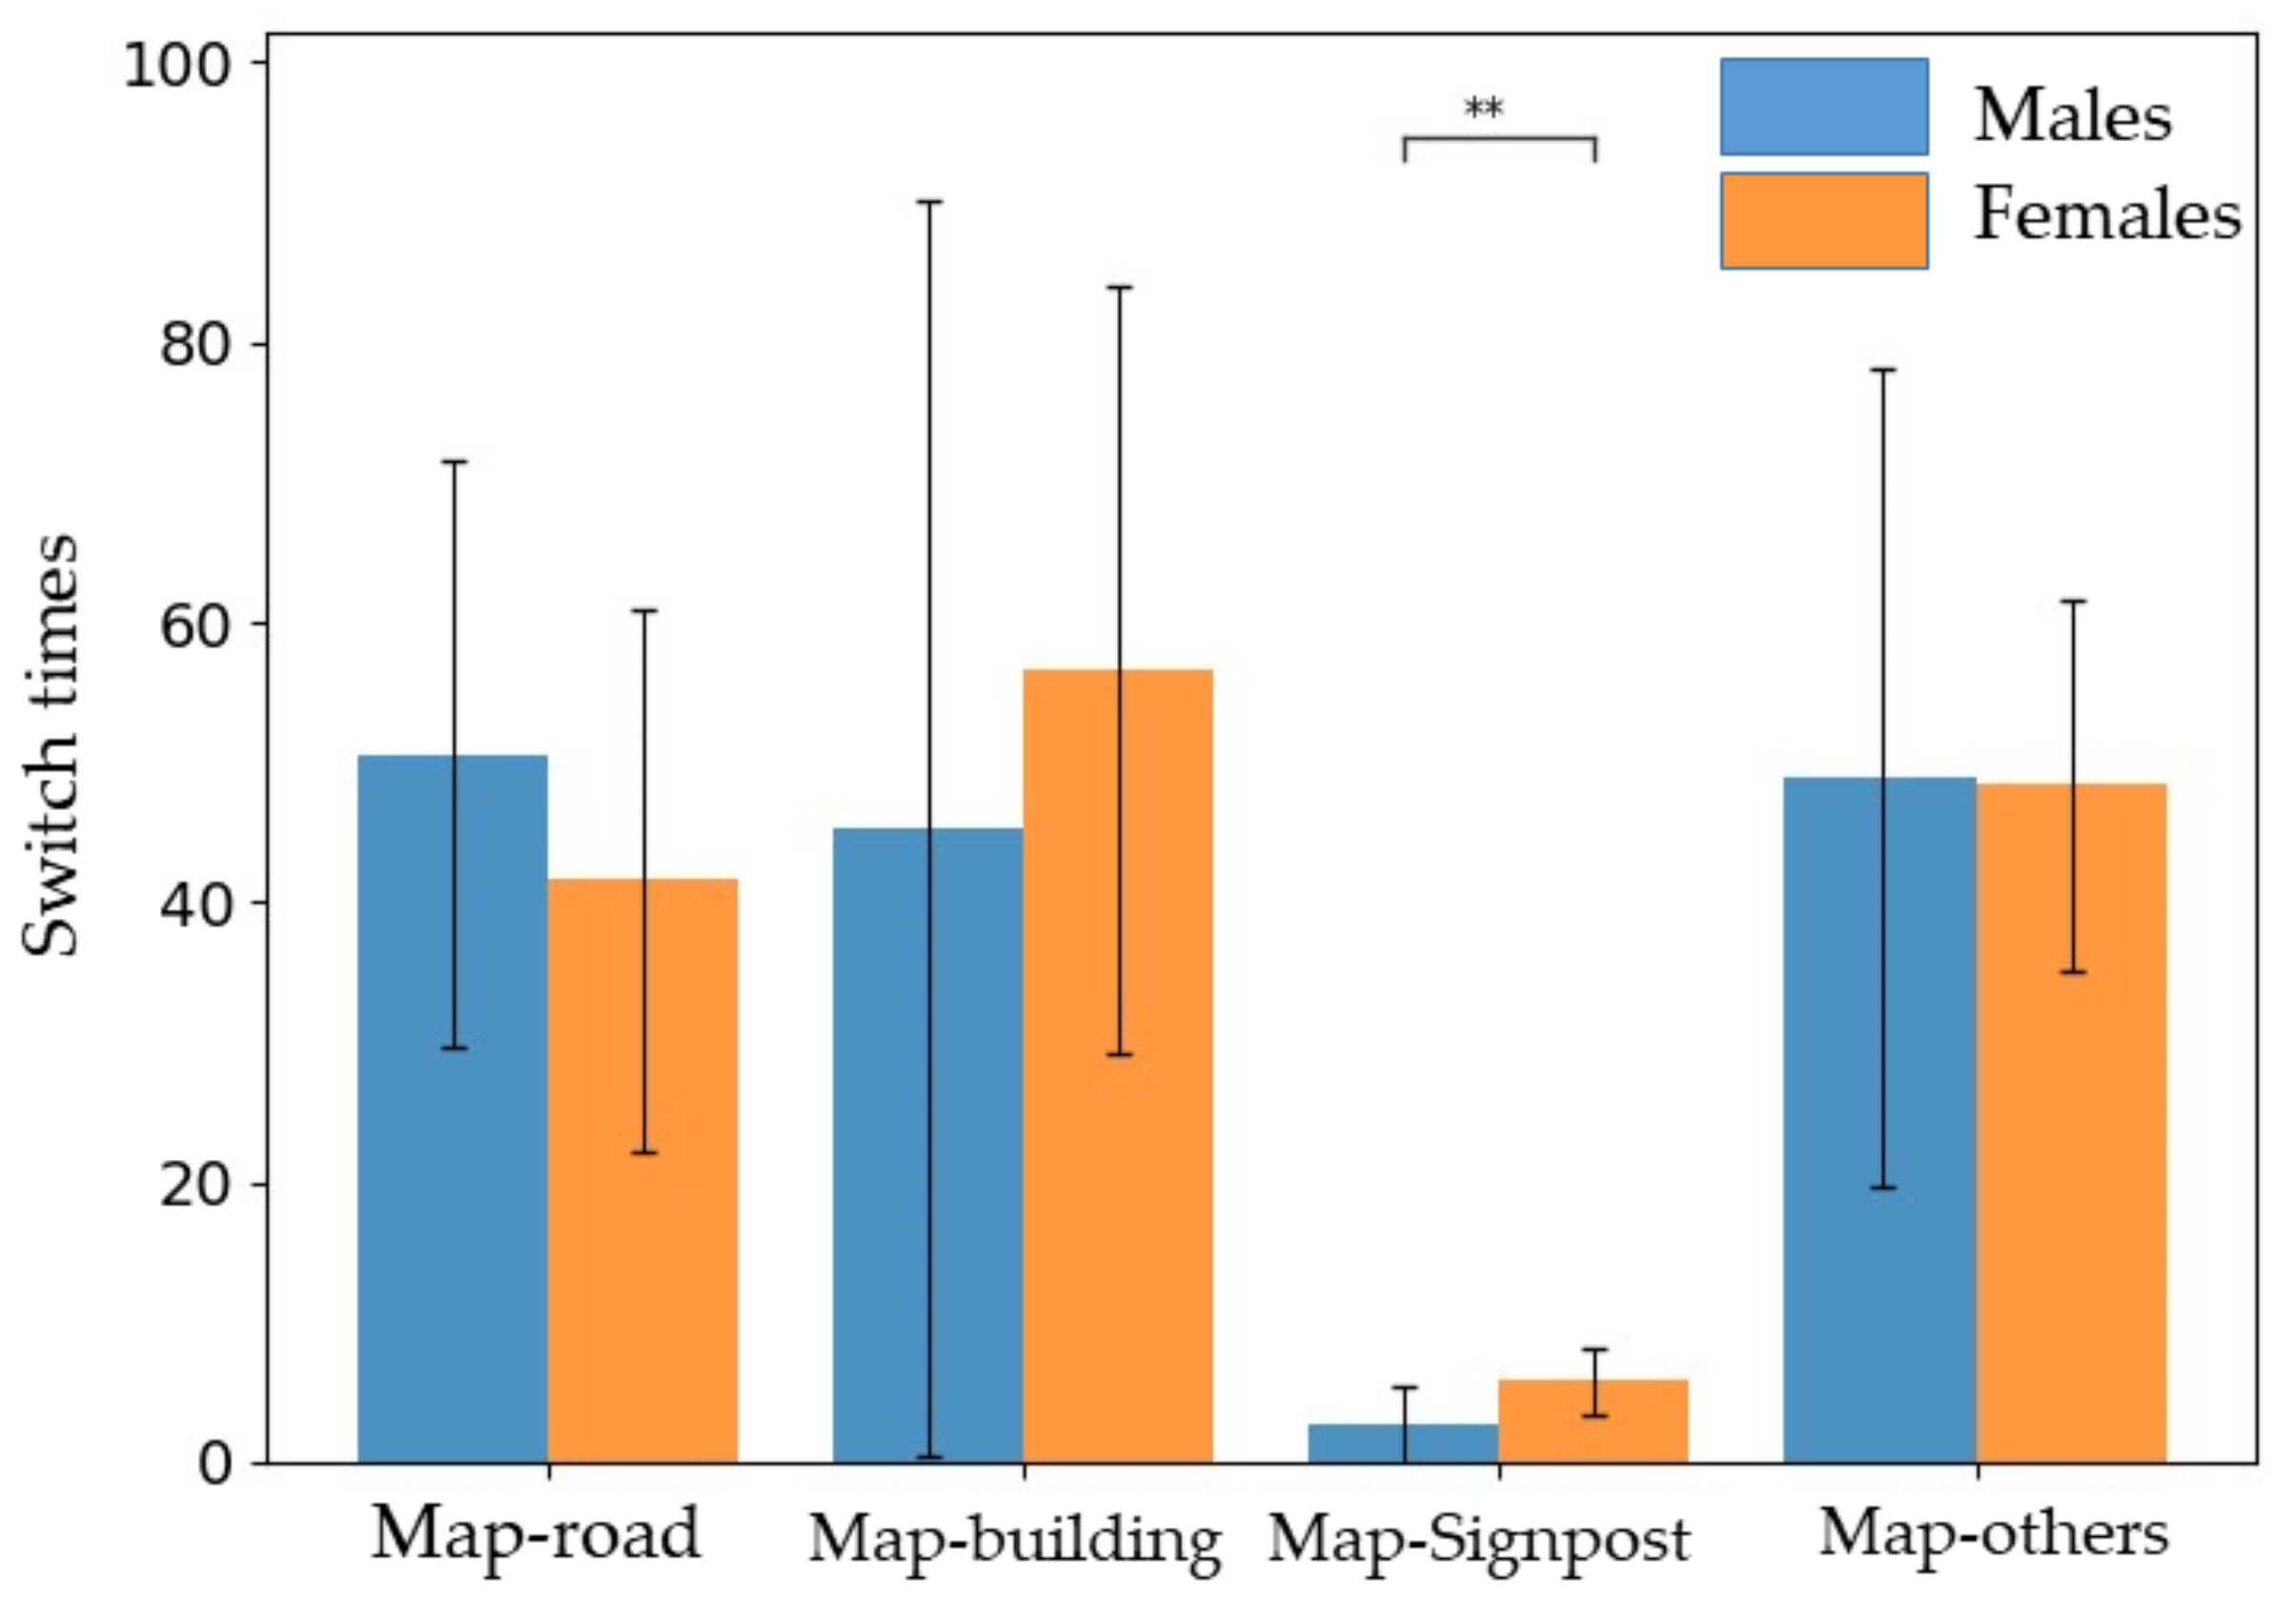
4.2.4. Attention Switches between AOIs
Attention switches between the map and scene involve the processes of localization and orientation.
Table 6 and
Figure 7 shows the attention switches from the
map to
road (map–road),
map to
building (map–building),
map to
signposts (map–Signpost) and
map to
other objects (map–others). Females exhibited more map–signpost attention switches (M = 5.786, SD = 2.425) than males (M = 2.571, SD = 2.796), and the difference was significant (
t = −3.131,
p = 0.004, Cohen’s
d = 1.228). The map–others attention shift times between males (M = 48.235, SD = 18.013) and females (M = 47.271, SD = 16.231) were similar, showing no significant difference (
t = 0.064,
p = 0.949, Cohen’s
d = 0.056). However, males exhibited more attention switches (M = 50.571, SD = 20.900) from the
map to
road than did females (M = 41.571, SD = 19.349), but the difference was not significant (
t = 1.139,
p = 0.265, Cohen’s
d = 0.457). Attention switches between
map and
building were more common for females (M = 56.571, SD = 27.453) than for males (M = 45.285, SD = 44.853), but the difference was not significant (
t = −0.774,
p = 0.446, Cohen’s
d = 0.304).
5. Discussion
We focused on studying sex similarities and differences in visual behaviors using the eye-tracking method in spatial orientation tasks, which differs from previous studies emphasizing wayfinding skills or performance. We obtained results showing that there were no significant sex differences in the accuracy and efficiency of spatial orientation tasks. In addition, we discuss the obtained results with respect to sex similarities and differences in visual behaviors.
We concentrated on identifying the visual behavior similarities and differences between males and females based on AOIs. In our experiment, males looked at the roads significantly more than females. This finding reflects the fact that males tend to focus on the information on geometrical cues that is provided by roads [
48]. In contrast, females tend to find landmarks that confirm their direction and position, which is consistent with previous studies showing that females rely more on landmarks to obtain an understanding of how to move from place to place [
16,
28]. Moreover, males and females show similarities in fixation count in buildings, map, signposts, and other objects. And they also have similar fixation duration of road, buildings, map, signposts, and other objects.
The fixation duration distribution in our study also revealed sex-associated similarities and differences. Although previous studies discussed the fixation duration distribution in other tasks [
49], little research has discussed the pattern in wayfinding processes or the differences between males and females. Nevertheless, this feature is of interest for determining how males and females distribute their limited visual attention among the abundant information sources available in a street scene within a given time. In our spatial orientation tasks, the goodness-of-fit results indicated that the fixation duration obeys an exponential distribution. The distribution of the fixation duration indicates that most of the information can be processed within a short time, while key information is treated visually and with greater attention. Females have more fixation counts of low fixation durations when it refers to road, signpost, and map, indicating that females tend to use more short-duration processing in the three types of objects than males. Females also have broader fixation duration of road, signpost, and map categories, indicating that females tend to spend a longer fixation time processing these objects. In contrast, males are prone to focus their attention for a longer duration on buildings.
In addition to the fixation count related to the eye-tracking indices, we also found sex similarities and differences in attention switches between the map and other types of AOIs. The process of fixation shifts between the map and street image reflects that the matching process is also an essential eye-tracking behavior. The result shows that females have more switches from the map to signposts. This result can also reflect the fact that females rely more on landmarks than males to match the map and environment. Meanwhile, males and females have similar switches between map and other categories.
Our results fill the gap in wayfinding research from the human perspective and provide new evidence indicating visual behavior similarities and differences between males and females. These findings can aid in the improved design of human-centered navigation applications, especially when technologies such as eye-tracking sensors and augmented reality are introduced into navigation systems in the near future. The present study may provide a useful reference to guide the development of such systems. For example, according to the feature of females have more attention switches between maps and landmarks than males, it can be inferred that females have an advantage in using information of landmark. Therefore a navigation system could enhance landmarks like signposts in the environment for female users.
There are certain limitations to our study. We used a desktop environment instead of a real environment in our research. We considered that because our focus was on spatial orientation tasks, it was unnecessary for the participants to complete the entire wayfinding process requiring them to walk around. The tasks were set in the decision point during which people often lose their way. In addition, a static desktop environment allows the scene to be easily controlled and enables a reasonable comparison between males and females. The desktop environment differs somewhat from a real and dynamic environment in which noise and movement are included. This difference may have caused us to underestimate participants’ fixation on cars or pedestrians in comparison to real-world experiments. Another related point of the experimental design is that the image environment allowed participants only a fixed perspective, which provided limited information to the participants. In addition, we used the DeeplabV3+ model to segment the images; although this method was a fast way to classify each pixel into one class, several points need further improvement. First, AOIs drawn by image segmentation methods are different from manually drawn methods, which enlarged AOI areas, and some fixation points might be misclassified. A method for more accurate classification would be desirable in the future. Another shortcoming is that our method failed to confirm the relationship between different objects. This leads to uncertainty in confirming which objects participants are truly interested in looking at because the fixation is overlain on segmented images. As an example, when a fixation falls on a car, it is also a possibility that the participant wants to see the road; the uncertainty is caused by the overlapping relationship between the car and the road. Therefore, it is important to address how to further confirm which objects fixation points truly belong to from the participant’s perspective.
6. Conclusions
In this article, we discuss sex similarities and differences in visual behaviors by using an eye-tracking method. We divided a street scene into four categories according to their guiding features. Different from many existing discussions on sex similarities and differences in wayfinding, our study focused on visual behaviors. These similarities and differences are measured by our selected eye-tracking indices: similarities and differences in fixation count, fixation duration and fixation duration distribution, and switches between AOIs. We found that males and females have no significant differences in the number of correct answers to the tasks or in the completion time. According to the visual behavior analysis, males seem to be more interested in roads, while females transfer more often between map and signpost. In addition to the differences we found in our research, we also claimed several similarities in fixation duration, fixation count, and fixation switches between males and females. Our results reveal eye-tracking feature patterns between males and females, and this may help us to understand their different behaviors in spatial orientation.
It should also be noted that we describe a series of visual behaviors in this study, but no evidence indicates how these visual behaviors are related to task efficiency and accuracy. Further research must be conducted to determine how these visual behaviors affect the decision-making process, and these future works might help us to enhance spatial abilities. The combination of computer vision methods and eye-tracking methods is a potential trend in the study of spatial cognition in the future. Further research on the eye-tracking method could be conducted to identify which objects the participants really want to see instead of relying on the direction of fixation. This advance could be realized by comparing the commonalities and differences between computer vision and human vision.
Author Contributions
Conceptualization, W.D.; Data curation, H.L.; Formal analysis, W.D.; Investigation, Z.Z.; Methodology, Z.Z.; Visualization, H.L.; Writing—original draft, Z.Z.; Writing—review & editing, W.D., L.M. and J.L. All authors have read and agreed to the published version of the manuscript.
Acknowledgments
This research is funded by the Natural Science Foundation of China (NSFC, Grant No. 41871366) and the China Scholarship Council (Grant No. 201906040236).
Conflicts of Interest
The authors declare no conflict of interest.
References
- Golledge, R.G. Human wayfinding and cognitive maps. In The Colonization of Unfamiliar Landscapes; Routledge: Abingdon, UK, 2003; pp. 49–54. [Google Scholar]
- Xia, J.C.; Arrowsmith, C.; Jackson, M.; Cartwright, W. The wayfinding process relationships between decision-making and landmark utility. Tour. Manag. 2008, 29, 445–457. [Google Scholar] [CrossRef]
- Lee, P.U.; Tversky, B. Interplay between visual and spatial: The effect of landmark descriptions on comprehension of route/survey spatial descriptions. Spat. Cogn. Comput. 2005, 5, 163–185. [Google Scholar] [CrossRef]
- Ying Chia, W. Mobile 3D Library Map: An innovative wayfinding tool for library users on the move. Libr. Hi Tech. News 2014, 31, 9–10. [Google Scholar] [CrossRef]
- Lawton, C.A. Gender differences in way-finding strategies: Relationship to spatial ability and spatial anxiety. Sex. Roles 1994, 30, 765–779. [Google Scholar] [CrossRef]
- Dabbs, J.M., Jr.; Chang, E.-L.; Strong, R.A.; Milun, R. Spatial ability, navigation strategy, and geographic knowledge among men and women. Evol. Hum. Behav. 1998, 19, 89–98. [Google Scholar] [CrossRef]
- Davis, R.L.; Therrien, B.A.; West, B.T. Cue conditions and wayfinding in older and younger women. Res. Gerontol. Nurs. 2008, 1, 252–263. [Google Scholar] [CrossRef]
- Ito, K.; Sano, Y. Cultural differences in the use of spatial information in wayfinding behavior. In Proceedings of the 25th International Cartographic Conference, Paris, France, 3–8 July 2011. [Google Scholar]
- Cavanagh, P. Visual cognition. Vis. Res. 2011, 51, 1538–1551. [Google Scholar] [CrossRef] [Green Version]
- Lawton, C.A. Gender, spatial abilities, and wayfinding. In Handbook of Gender Research in Psychology; Springer: Berlin/Heidelberg, Germany, 2010; pp. 317–341. [Google Scholar]
- Chebat, J.-C.; Gélinas-Chebat, C.; Therrien, K. Gender-related wayfinding time of mall shoppers. J. Bus. Res. 2008, 61, 1076–1082. [Google Scholar] [CrossRef]
- Martens, J.; Antonenko, P.D. Narrowing gender-based performance gaps in virtual environment navigation. Comput. Hum. Behav. 2012, 28, 809–819. [Google Scholar] [CrossRef]
- Lin, C.-T.; Huang, T.-Y.; Lin, W.-J.; Chang, S.-Y.; Lin, Y.-H.; Ko, L.-W.; Hung, D.L.; Chang, E.C. Gender differences in wayfinding in virtual environments with global or local landmarks. J. Environ. Psychol. 2012, 32, 89–96. [Google Scholar] [CrossRef]
- Wang, C.; Chen, Y.; Zheng, S.; Liao, H. Gender and Age Differences in Using Indoor Maps for Wayfinding in Real Environments. ISPRS Int. J. Geo Inf. 2019, 8, 11. [Google Scholar] [CrossRef] [Green Version]
- Hegarty, M.; Montello, D.R.; Richardson, A.E.; Ishikawa, T.; Lovelace, K. Spatial abilities at different scales: Individual differences in aptitude-test performance and spatial-layout learning. Intelligence 2006, 34, 151–176. [Google Scholar] [CrossRef]
- Saucier, D.M.; Green, S.M.; Leason, J.; MacFadden, A.; Bell, S.; Elias, L.J. Are sex differences in navigation caused by sexually dimorphic strategies or by differences in the ability to use the strategies? Behav. Neurosci. 2002, 116, 403. [Google Scholar] [CrossRef]
- Lawton, C.A.; Kallai, J. Gender differences in wayfinding strategies and anxiety about wayfinding: A cross-cultural comparison. Sex. Roles 2002, 47, 389–401. [Google Scholar] [CrossRef]
- Hund, A.M.; Minarik, J.L. Getting from here to there: Spatial anxiety, wayfinding strategies, direction type, and wayfinding efficiency. Spat. Cogn. Comput. 2006, 6, 179–201. [Google Scholar] [CrossRef] [Green Version]
- Schmitz, S. Gender differences in acquisition of environmental knowledge related to wayfinding behavior, spatial anxiety and self-estimated environmental competencies. Sex. Roles 1999, 41, 71–93. [Google Scholar] [CrossRef]
- Williams, C.L.; Barnett, A.M.; Meck, W.H. Organizational effects of early gonadal secretions on sexual differentiation in spatial memory. Behav. Neurosci. 1990, 104, 84. [Google Scholar] [CrossRef]
- Silverman, I.; Eals, M. Sex differences in spatial abilities: Evolutionary theory and data. In The Adapted Mind: Evolutionary Psychology and the Generation of Culture; Barkow, J.H., Cosmides, L., Tooby, J., Eds.; Oxford University Press: Oxford, UK, 1992; pp. 533–549. [Google Scholar]
- Djamasbi, S.; Tullis, T.; Hsu, J.; Mazuera, E.; Osberg, K.; Bosch, J. Gender preferences in web design: Usability testing through eye tracking. In Proceedings of the AMCIS 2007, Keystone, CO, USA, 9–12 August 2007. [Google Scholar]
- Hewig, J.; Trippe, R.H.; Hecht, H.; Straube, T.; Miltner, W.H. Gender differences for specific body regions when looking at men and women. J. Nonverbal. Behav. 2008, 32, 67–78. [Google Scholar] [CrossRef]
- Lorigo, L.; Pan, B.; Hembrooke, H.; Joachims, T.; Granka, L.; Gay, G. The influence of task and gender on search and evaluation behavior using Google. Inf. Process. Manag. 2006, 42, 1123–1131. [Google Scholar] [CrossRef]
- Geary, D.C.; Saults, S.J.; Liu, F.; Hoard, M.K. Sex differences in spatial cognition, computational fluency, and arithmetical reasoning. J. Exp. Child Psychol. 2000, 77, 337–353. [Google Scholar] [CrossRef] [Green Version]
- Gur, R.C.; Alsop, D.; Glahn, D.; Petty, R.; Swanson, C.L.; Maldjian, J.A.; Turetsky, B.I.; Detre, J.A.; Gee, J.; Gur, R.E. An fMRI study of sex differences in regional activation to a verbal and a spatial task. Brain Lang. 2000, 74, 157–170. [Google Scholar] [CrossRef] [PubMed]
- Grön, G.; Wunderlich, A.P.; Spitzer, M.; Tomczak, R.; Riepe, M.W. Brain activation during human navigation: Gender-different neural networks as substrate of performance. Nat. Neurosci. 2000, 3, 404. [Google Scholar] [CrossRef] [PubMed]
- Andersen, N.E.; Dahmani, L.; Konishi, K.; Bohbot, V.D. Eye tracking, strategies, and sex differences in virtual navigation. Neurobiol. Learn. Mem. 2012, 97, 81–89. [Google Scholar] [CrossRef] [PubMed]
- Liao, H.; Dong, W.; Peng, C.; Liu, H. Exploring differences of visual attention in pedestrian navigation when using 2D maps and 3D geo-browsers. Cartogr. Geogr. Inf. Sci. 2017, 44, 474–490. [Google Scholar] [CrossRef]
- Mueller, S.C.; Jackson, C.P.; Skelton, R.W. Sex differences in a virtual water maze: An eye tracking and pupillometry study. Behav. Brain Res. 2008, 193, 209–215. [Google Scholar] [CrossRef]
- Cazzato, V.; Basso, D.; Cutini, S.; Bisiacchi, P. Gender differences in visuospatial planning: An eye movements study. Behav. Brain Res. 2010, 206, 177–183. [Google Scholar] [CrossRef] [Green Version]
- Raubal, M.; Egenhofer, M.J.; Pfoser, D.; Tryfona, N. Structuring space with image schemata: Wayfinding in airports as a case study. In International Conference on Spatial Information Theory; Springer: Berlin/Heidelberg, Germany, 1997; pp. 85–102. [Google Scholar]
- Lawton, C.A.; Charleston, S.I.; Zieles, A.S. Individual-and gender-related differences in indoor wayfinding. Environ. Behav. 1996, 28, 204–219. [Google Scholar] [CrossRef]
- Ishikawa, T.; Fujiwara, H.; Imai, O.; Okabe, A. Wayfinding with a GPS-based mobile navigation system: A comparison with maps and direct experience. J. Environ. Psychol. 2008, 28, 74–82. [Google Scholar] [CrossRef]
- Kiefer, P.; Straub, F.; Raubal, M. Location-aware mobile eye-tracking for the explanation of wayfinding behavior. In Proceedings of the AGILE’2012 International Conference on Geographic Information Science, Avignon, France, 24–27 April 2012. [Google Scholar]
- Schwarzkopf, S.; von Stülpnagel, R.; Büchner, S.J.; Konieczny, L.; Kallert, G.; Hölscher, C. What lab eye tracking tells us about wayfinding: A comparison of stationary and mobile eye tracking in a large building scenario. In Proceedings of the 1st International Workshop on Eye Tracking for Spatial Research, Scarborough, UK, 2 September 2013; pp. 31–36. [Google Scholar]
- Viaene, P.; Ooms, K.; Vansteenkiste, P.; Lenoir, M.; De Maeyer, P. The Use of Eye Tracking in Search of Indoor Landmarks. In Proceedings of the ET4S@ GIScience, Vienna, Austria, 23 September 2014; pp. 52–56. [Google Scholar]
- Wiener, J.M.; Hölscher, C.; Büchner, S.; Konieczny, L. Gaze behaviour during space perception and spatial decision making. Psychol. Res. 2012, 76, 713–729. [Google Scholar] [CrossRef] [Green Version]
- Kiefer, P.; Giannopoulos, I.; Raubal, M. Where am I? Investigating map matching during self-localization with mobile eye tracking in an urban environment. Trans. GIS 2014, 18, 660–686. [Google Scholar] [CrossRef]
- Beatty, J. Task-evoked pupillary responses, processing load, and the structure of processing resources. Psychol. Bull. 1982, 91, 276. [Google Scholar] [CrossRef] [PubMed]
- De Condappa, O.; Wiener, J.M. Human place and response learning: Navigation strategy selection, pupil size and gaze behavior. Psychol. Res. 2016, 80, 82–93. [Google Scholar] [CrossRef] [PubMed] [Green Version]
- Cohen, J. Statistical Power Analysis for the Behavioral Sciences; Routledge: Abingdon, UK, 2013. [Google Scholar]
- Chen, L.-C.; Papandreou, G.; Kokkinos, I.; Murphy, K.; Yuille, A.L. Deeplab: Semantic image segmentation with deep convolutional nets, atrous convolution, and fully connected crfs. IEEE Trans. Pattern Anal. Mach. Intell. 2018, 40, 834–848. [Google Scholar] [CrossRef] [PubMed]
- Cordts, M.; Omran, M.; Ramos, S.; Rehfeld, T.; Enzweiler, M.; Benenson, R.; Franke, U.; Roth, S.; Schiele, B. The cityscapes dataset for semantic urban scene understanding. In Proceedings of the IEEE Conference on Computer Vision and Pattern Recognition, Las Vegas, NV, USA, 27–30 June 2016; pp. 3213–3223. [Google Scholar]
- Liao, H.; Dong, W. An Exploratory Study Investigating Gender Effects on Using 3D Maps for Spatial Orientation in Wayfinding. ISPRS Int. J. Geo Inf. 2017, 6, 60. [Google Scholar] [CrossRef] [Green Version]
- Suppes, P. Stochastic models of reading. In Eye Movements in Reading; Ygge, J., Lennerstrand, G., Eds.; Pergamon: Oxford, UK, 1994; pp. 349–364. [Google Scholar]
- Rosbergen, E.; Pieters, R.; Wedel, M. Visual attention to advertising: A segment-level analysis. J. Consum. Res. 1997, 24, 305–314. [Google Scholar] [CrossRef] [Green Version]
- De Goede, M. Gender Differences in Spatial Cognition. Ph.D. Thesis, Utrecht University, Utrecht, The Netherlands, 2009. [Google Scholar]
- Hooge, I.T.C.; Erkelens, C.J. Control of fixation duration in a simple search task. Percept. Psychophys. 1996, 58, 969–976. [Google Scholar] [CrossRef] [Green Version]
© 2020 by the authors. Licensee MDPI, Basel, Switzerland. This article is an open access article distributed under the terms and conditions of the Creative Commons Attribution (CC BY) license (http://creativecommons.org/licenses/by/4.0/).


