Article

A New Approach to Refining Land Use Types: Predicting Point-of-Interest Categories Using Weibo Check-in Data

1
Guangdong Provincial Key Laboratory of Urbanization and Geo-simulation, School of Geography and Planning, Sun Yat-sen University, Guangzhou 510275, China
2
Department of Urban and Rural Planning, School of Architecture, Tianjin University, Tianjin 300072, China
*
Author to whom correspondence should be addressed.
ISPRS Int. J. Geo-Inf. 2020, 9(2), 124; https://0-doi-org.brum.beds.ac.uk/10.3390/ijgi9020124
Submission received: 19 December 2019 / Revised: 13 February 2020 / Accepted: 20 February 2020 / Published: 21 February 2020
(This article belongs to the Special Issue Convergence of GIS and Social Media)

Abstract

:
The information of land use plays an important role in urban planning and optimizing the allocation of resources. However, traditional land use classification is imprecise. For instance, the type of commercial land is highly filled with the categories of shopping, eating, etc. The number of mixed-use lands is increasingly growing nowadays, and these lands sometimes are too mixed to be well investigated by conventional approaches such as remote sensing technology. To address this issue, we used a new social sensing approach to classify land use according to human mobility and activity patterns. Previous studies used other social sensing approaches to predict land use types at the parcel or the area level, whilst fine-grained point-of-interest (POI)-level land use data are likely to more useful in urban planning. To abridge this research gap, we proposed a new social sensing approach dedicated to classifying land use at a finer scale (i.e., POI-level or building level) according to human mobility and activity patterns reflected by location-based social network (LBSN) data. Specifically, we firstly investigated spatial and temporal patterns of human mobility and activity behavior using check-in data from a popular Chinese LBSN named Sina Weibo and subsequently applied those patterns to predicting the category of POI to refine urban land use classification in Guangzhou, China. In this study, we applied three classification methods (i.e., naive Bayes, support vector machines, and random forest) to recognize category of a certain POI by spatial and temporal features of human mobility and activity behavior as well as POIs’ locational characteristics. Random forest outperformed the other two methods and obtained an overall accuracy of 72.21%. Apart from that, we compared the results of the different rules in filtering check-in samples. The comparison results show that a reasonable rule to select samples is essential for predicting the category of POI. Moreover, the approach proposed in this study can be potentially applied to identifying functions of buildings according to visitors’ mobility and activity behavior and buildings’ locational characteristics.

1. Introduction

In order to develop a reasonable and desirable policy for improving the city structure and the city resource allocation to support the city sustainable development, urban planners and policy makers must improve their understanding of land use distribution that influence people’s real-time activity pattern. Understanding the land use distribution is very important, since the different categories of land use attract different proportional people who have different activity purposes and thus influence the city resource allocation such as public transportation. In addition, the information of land use distribution can assist urban planners in learning about the urban structure at a fine scale and how planners can efficiently improve that. Therefore, the technology of spatially fine-grained land use classification is needed for urban sustainable development. As in modern cities, there are increasing numbers of building complexes, and conventional land use classification approaches such as remote sensing are not well applicable to identifying the specific functions of building complexes. For instance, a building complex sometimes includes restaurants, offices, or hotels located in different rooms or floors. Conventional remote sensing approaches cannot well identify the specific functions of large or tall buildings such as complexes. Although aerial remote sensing technologies can better classify building functions than satellite remote sensing technologies, they are highly costly and time-consuming. A less costly but novel approach is needed to classify land use at a finer level (e.g., building-level) in an urban environment.
In the past, human activity patterns were investigated in traditional household surveys. However, this way is time-consuming and high-cost. With the development of social networks and location-based services, the number of social media applications such as Foursquare, Facebook, Twitter, Weibo, etc., continue to increase. Therefore, the location-based information gained from those applications has been frequently used in many fields and has thus produced a lot of social benefits. Those data make a significant contribution to city center recognition [1], recommendation systems [2,3,4,5], and human activity patterns [6,7,8]. Owing to the different activities of residents in different points-of-interest (POIs), the information can be used to indicate the function or the activity category of certain POI. In a word, within different POIs, people may demonstrate different movements (e.g., in residential POI, people may check-in when they get up or leave home in the morning and then come back home or watch TV in the evening, whereas, in shopping center POI, people may check-in more when they undertake shopping or entertainment activities in the evening or weekend). This may allow us to investigate and refine the internal human activity structure of certain big functional areas, where a number of similar POIs are highly mixed in, by location-based social network (LBSN) data.
With the maturity of remote sensing technology, the ability of remote sensing technology to capture the physical features of ground objects has increasingly improved. Therefore, the remote sensing technology has been regarded as a common or even vital approach to classifying land use. Theoretically, classifying land use is mainly based on the technology of remote sensing, which can recognize land use by spectral and textual characteristics [9,10,11]. However, since the traditional methods consider only physical factors, social factors have not been considered by these methods, which might significantly impact the accuracy of classifying land use [12]. Therefore, to bring together physical characteristics and social functions of lands, some studies attempted to combine remote sensing images with emerging geospatial big data produced by humans in everyday life in land use classifications {e.g., applying mobile phone data as a supplement for remote sensing images to land use classification [12], classifying land use by the use of taxi trip data and remote sensing data to improve the accuracy of classification [13], integrating social media data and remote sensing data to classify land use [14], collected volunteered geographic information (VGI) data such as OpenStreetMap to model the land use patterns [15], and even combining Landsat images with POIs to map the urban land use [16]}. However, the number of mixed-use lands is increasingly growing nowadays, and these lands sometimes are too mixed to be well investigated by conventional approaches such as remote sensing (e.g., commercial land consists of different functional areas such as eating, hotel, entertainment, etc.). In this case, conventional parcel- or area-level land use classifications cannot satisfy the demand of modern urban planning [17]. To address this issue, classifying land use or functional areas at a finer spatial scale is needed to enhance urban planning. In other words, refining functional area classification can provide greater assistance to urban planning [17]. For instance, Long and Liu used POI data to precisely measure land use mix to reduce the mismatch between urban land use plans and actual land use [17]. It can be demonstrated that the POI-based approach can better measure the land use mix than the traditionally parcel-based approach. Furthermore, previous studies have proposed social sensing approaches instead of remote sensing approaches to classify functional areas or land use parcels according to human mobility and activity patterns [12]. However, those studies have a limited spatial granularity, as land use types predicted based on mobile phone record data are at the parcel or the area level, whilst a more fine-grained land use data, such as POI-level or building-level data, are definitely more useful in urban planning [17]. To abridge this research gap, we attempted to classify land use at a finer scale according to human mobility and activity patterns reflected by LBSN data. Our proposed social sensing approach has some advantages over other existing social sensing approaches, including low cost and fine granularity.
In our study, we only utilized a small part of POI and check-in data for POI-level land use classification. In other words, we finished finer precision work with fewer kinds of data. Specifically, we firstly investigated spatial and temporal patterns of human mobility and activity behavior using check-in data from a popular Chinese LBSN named Sina Weibo and subsequently applied those patterns to predicting the category of POI to refine urban land use classification in Guangzhou, China. Our proposed approach can be potentially applied to classify building functions according to visitors’ human and mobility behavior and buildings’ locational characteristics.
The remainder of this paper is organized as follows: Section 2 introduces the data sources and the study area. Section 3 presents the methodology used in this paper. Section 4 presents the empirical results and discussion. Finally, this paper presents the conclusion and future works.

2. Study Area and Data Sources

Guangzhou is a core city in the Pearl River Delta, one of the biggest economic zones in China. Meanwhile, Sina Weibo is one of the most popular LBSNs, with more than 400 million users, in China. Guangzhou is one of the most developed and populous cities in China. Therefore, we chose the check-in data of Sina Weibo in the city of Guangzhou as a typical example to demonstrate our methodology.

2.1. Study Area

Guangzhou, the capital city of Guangdong province, is located on the north of Pearl River Delta. Guangzhou is also a significantly important city in Guangdong-Hong Kong-Macao Greater Bay Area (GBA). According to the open and dependable data from China National Bureau of Statistics, Guangzhou has a gross domestic product of about 325.16 billion USD at the end of 2018. Guangzhou is regarded as one of most promising cities in China, as it had a population of about 14.9 million at the end of 2018 and capability for highly technological innovation. Guangzhou consists of 11 districts (Baiyun, Conghua, Haizhu, Huadu, Huangpu, Liwan, Nansha, Panyu, Tianhe, Yuexiu, and Zengcheng) shown as Figure 1.

2.2. Data Source

The huge number of users Weibo renders becomes an abundant database for mining the value of human activities information. The information available in the database includes user id, time, user gender, user age, location, venue name, text, and phone type, but the personal information such as user name, family address, and profession are unavailable. Check-in data produced by active users have recorded POIs’ locations and users’ daily mobility and activity dairies. These data are available in the Application Programing Interfaces (APIs) of Weibo; we thus obtained them though Weibo’s APIs. However, owing to the information of categories sorted in Baidu Map, which is a map service application similar to Google Maps, is more exhaustive than that in Weibo’s location services. We therefore replaced the POI categories inherently offered by Weibo with those provided by Baidu map. How to preprocess data is shown in Figure 2. Firstly, the check-in dataset was gathered with a json format via Weibo API. Secondly, the categories of POI gained from the check-in dataset were replaced with those gained from Baidu Map API. Finally, the check-ins with replaced POI categories were stored with a CSV form in a database.
Within the administrative boundaries of Guangzhou, 134,250 check-ins produced by 74,826 users at 10,408 distinct venues (POIs) within 28 continuous weeks (from 1 March 2018 to 16 September 2018) were collected through Weibo APIs. In the following part of the study, we investigated the human activities patterns based on this dataset. After the elimination of useless check-ins (e.g., users post check-ins at some POIs that could not be found in Baidu Map location services), the quantities of different POI categories in remaining check-ins are shown as Figure 3.
Commercial and residential lands have become the most active areas for human daily activities. Therefore, the lands were highly filled with the various types of human activities. However, the majority of previous studies on land use classification cannot satisfy the demand of identifying the lands’ various types of human activities to precisely assist urban planners. We thus used a new approach to refine commercial and residential land use types with the assistance of people movement data in LBSN. Specifically, we selected four numerous POI categories (residential, entertainment, hotel, food) involving commercial and residential lands as the main classification targets of the study. Some other popular POI categories were not considered in the classification due to different reasons: the POIs of roads are likely to have a relatively small number of check-ins and visitors (Weibo users), POIs of administrative landmarks and attractions are easy to recognize using other approaches such as remote sensing, the check-ins at the POIs of transportation facilities are concentrated in the airport and railway stations, and the POIs of the education cluster around the college town of Guangzhou. These POI categories therefore were removed from the classification. As Figure 3 shows, the remaining POI categories were too few to classify, otherwise it may have resulted in a low prediction accuracy.
The experimental data of various POIs were filtered traditionally with the same rule—no further processing or all data following the same threshold. However, the main contributors to check-ins between the business lands and the residential areas, in fact, were different. We therefore proposed a method to deal with the typical residential POI (the type of residential) and commercial POI (the categories of food, entertainment, and hotel). Owing to the development of family hotels, some tourists prefer to rest in residential areas during the trip. However, the behavior patterns of travelers are different from those of residents. In our view, the main contributors to check-ins at residential areas are residents, although residents’ check-ins are mixed with tourists’ check-ins in residential areas, and the check-ins data pattern for tourists causes a significant influence in the common residential pattern. Therefore, in our perspective, we firstly wanted to remove the data produced by the tourists checking in at residential areas. The rules and the steps for removing tourists’ check-in data produced in residential districts are presented as follow:
(1)
the user who has checked in on at least five different dates;
(2)
the user whose first check-in date differs from the last check-in date by more than one week (7 days);
(3)
the user whose cumulative number of check-ins is greater than 10; and
(4)
in the data of residential POI, the check-in data of residents (the users satisfy criteria 1 to 3) were stored, and other data of non-residents were deleted.
In contrast, the check-ins at commercial areas are contributed to by both residents and tourists; meanwhile, the temporal characteristics of user check-in behavior between residents and tourists at commercial districts are insignificantly different. We therefore did not intentionally, in commercial POIs, distinguish the check-ins of residents and tourists at commercial POIs. However, in our opinion, we wanted to select the most representative POIs from commercial POIs as samples; in other words, we set a threshold of the number of individual POI check-ins to choose representative POIs. The reason is the non-representative POIs do not follow the common pattern under the impact of commercial advertisements. To the best of our knowledge, advertising commonly and massively exists in commercial POIs’ check-ins. The rule of setting the threshold for the number of individual POI check-ins is: the thresholds for entertainment, food, and hotel are six, four, and two, respectively. In the data of commercial POI, the POI data satisfying the rule were stored, and other data of POI were deleted. This rule took a consideration about the balance between the POIs’ quantities and representativeness. Given there is less advertising in residential POIs’ check-ins than commercial ones, we thus gave no thresholds for residential POI after manually removing the advertising check-ins of residential POIs.
We compared the results between the traditional rule—with no further processing or all data following the same threshold—and the rule proposed above to verify our perspective. After the elimination of POI check-ins data following the rules mentioned above, the final experimental dataset is presented as Table 1 shows. The dataset following the traditional rule—no further processing or all data following the same threshold—is also exhibited as Table 1 shows.

3. Methodology

In our POI-level land use classification model, we firstly replaced the Weibo check-in categories with the corresponding POI categories extracted from Baidu Map. As the dataset gained from Weibo had poor quality data, we subsequently improved data quality by the rule proposed in Section 2.2. We separated the sample into training and testing samples after improving the dataset, wherein the training sample fed to the classification learning model (e.g., random forest and support vector machine) to train an optimal classification model, and the testing sample tested the performance of the trained model. In the process of building the training classification model, we trained three kinds of machine learning models to seek the best model fitted in this study, since the different models have different features (e.g., random forest can produce unbiased accuracy estimate, and support vector machine can manage the large feature space [18]) to fit different studies. Finally, the best classifier was selected as the POI-level land use model in the study, and the workflow is shown as Figure 4.

3.1. Decision Tree

As a supervised learning method, the decision tree has been widely used in classification. A single decision tree partitions the samples into a series of mutually exclusive parts in the feature space. For instance, there are J sets of observations, and each set of observation constitutes k inputs with one response value, such as ( y i , x i 1 , x i 2 , , x i k ) for i = 1 , 2 , 3 , , J . In terms of POI category recognition, y i can represent the category for each i -th POI, and ( x i 1 , x i 2 , , x i k ) denotes the variables that are relevant to predicting the category of each POI. In the classification process, the classification tree recursively partitions POIs into different categories in terms of the k input explanatory variables [19]. Furthermore, the completion of this process usually contains more than one time of partition. After divided classification, the sub-region contains fewer and fewer samples. The process continues until the achievement of stopping criteria.
With the development of the decision tree, there are three kinds of decision trees widely used nowadays— iterative dichotomiser 3 (ID3), C4.5 (an extension of ID3 algorithm using the concept of information entropy), as well as classification and regression tree (CART)—and their criteria of classification are different from each other. However, the random forest model adopted the CART classification tree as the basic learning machine in this study. The CART classification utilizes a mean decrease in Gini method to measure the importance of independent variables based on the Gini impurity index to split the training samples. The decrease of Gini impurity index was used for recognizing the most important explanatory variable to make an optimal classification in this study. The average decrease of Gini impurity index for the selected explanatory variable was over that for other independent variables. For example, there are k categories in an actual classification problem, and p k is the possibility of k -th category, therefore the Gini impurity index can be calculated as follows:
Gini ( X i ) = k = 1 K p k ( 1 p k ) = 1 k = 1 K p k 2
where X i denotes a candidate variable to split the training samples. Once the Gini ( X i ) was calculated for each candidate explanatory variable, the variable with the lowest Gini impurity index was selected to split the samples.

3.2. Random Forest

Although the decision tree, with the development of classification criteria, achieves a relatively higher accuracy, the random forest (RF) model outperforms a single decision tree classifier [20]. The random forest model is constituted with large quantities of decision trees. Moreover, the final result calculated by the random forest is decided by votes produced from all decision trees. However, part of reason why the random forest algorithm can be widely utilized and obtains excellent results is the random characteristic. The characteristic of random can be demonstrated in two aspects: the training sample of each decision tree is partly and randomly selected from all training samples as well as the stochasticity of several explanatory variables gained from whole independent variables. The random forest utilizes a bootstrap method to extract training samples based on the stochastic principle to ensure the diversity of decision trees. For instance, suppose there is a sample set of number N , and the method mentioned above performs n   ( n < N ) times of put back sampling on the sample set. In other words, the extracted sample of each decision tree may be same as that of other decision trees; additionally, certain samples regarded as out of bag to measure the accuracy of model may not appear in the training sample of the decision tree. Furthermore, for each decision tree, the stochastic process is performed to extract the explanatory variables number of k   ( k < K ) in the whole independent variables number of K .
The illustration of the RF working process is shown as Figure 5. There are three steps to predict samples in certain categories. Training samples and features are randomly selected into different decision trees in step 1. Step 2 establishes multiple decision trees through which the number can be optimized by the executor. The results of each decision tree built by step 2 are combined together to determine the final result in step 3.

3.3. Other Comparison Models

In other to determine the model that can best predict POI categories, a comparison between random forest (RF), naïve Bayes model (NBM), and support vector machines (SVM) was introduced in this study.
The NBM is an algorithm based on Bayesian decision theory. In other words, all classifications of the NBM depend on Equation (2). For instance, there are i distinct types, ( A 1 , A 2 , , A i ) , and B denotes the sample. The NBM calculates the probability of sample B belonging to each type, which is based on the training dataset. The final type of sample B is decided by the biggest probability.
P ( A i | B ) = P ( B | A i ) P ( B ) j = 1 n P ( B | A j ) P ( A j )
The SVM model is a classical algorithm for classification and regression. SVM can achieve the largest distance separation between different classes by constructing a hyper-plane in a high-dimensional space constructed from a large number of features. A simple diagram is given to illustrate how to settle a classification issue, shown as Figure 6. Furthermore, the SVM can be divided into two forms of linear and non-linear to deal with linear and non-linear data, respectively. In the situation of linear cases, the classification problem can be solved by a linear function that can be a line or a plan in a one-dimensional or a two-dimensional space. The linear function can therefore be regarded as a hyper-plane if the number of dimensions is not considered. However, in the situation of non-linear cases, the demand of solving classification issues cannot be satisfied by linear functions. Therefore, the kernel function ( x ) is introduced to transfer the input space into feature space in this situation. In our comparison, the commonly used radial basis function (RBF) is regarded as the kernel function to recognize the categories of POI. The kernel function of RBF is defined as K ( x i x j ) = exp ( γ   x i x j ) wherein x i and x j is input data; γ = 1 / 2 σ , σ is the band width.

3.4. Explanatory Variables

In this study, we took account of characteristics of check-ins and users, temporal features of user check-in behavior, and spatial features of POI. Table 2 lists the explanatory variables. We assumed that (1) the number of users or the number of check-ins were likely from one POI category to another; (2) the proportion of check-ins in different daily time periods (e.g., morning, noon, afternoon, evening, and night) or different week parts (i.e., weekday and weekend) was likely to differ from one POI category to another; (3) the heterogeneity of users’ contributions to check-in volume, the heterogeneity of periods’ contributions to check-in volume in weekday, or the heterogeneity of time periods’ contributions to check-in volume in weekend were likely to differ from one POI category to another; and (4) built environment features of POI were likely to differ from one POI category to another. Variables such as user entropy (V3), weekday check-in entropy (V8), and weekend check-in entropy (V13) can be calculated by Equation (3).
E V i = i = 1 n p i log 2 p i
When calculating user entropy, weekday check-in entropy, and weekend check-in entropy, p i denotes the proportion of check-ins produced by each user in this POI check-ins’ record, the proportion of check-ins produced in each of four weekday time periods in this POI, and that produced in each of four weekend time periods in this POI, respectively.

4. Result and Discussion

For our experimental data gained from Weibo, we firstly selected check-in data according to the rule proposed in 
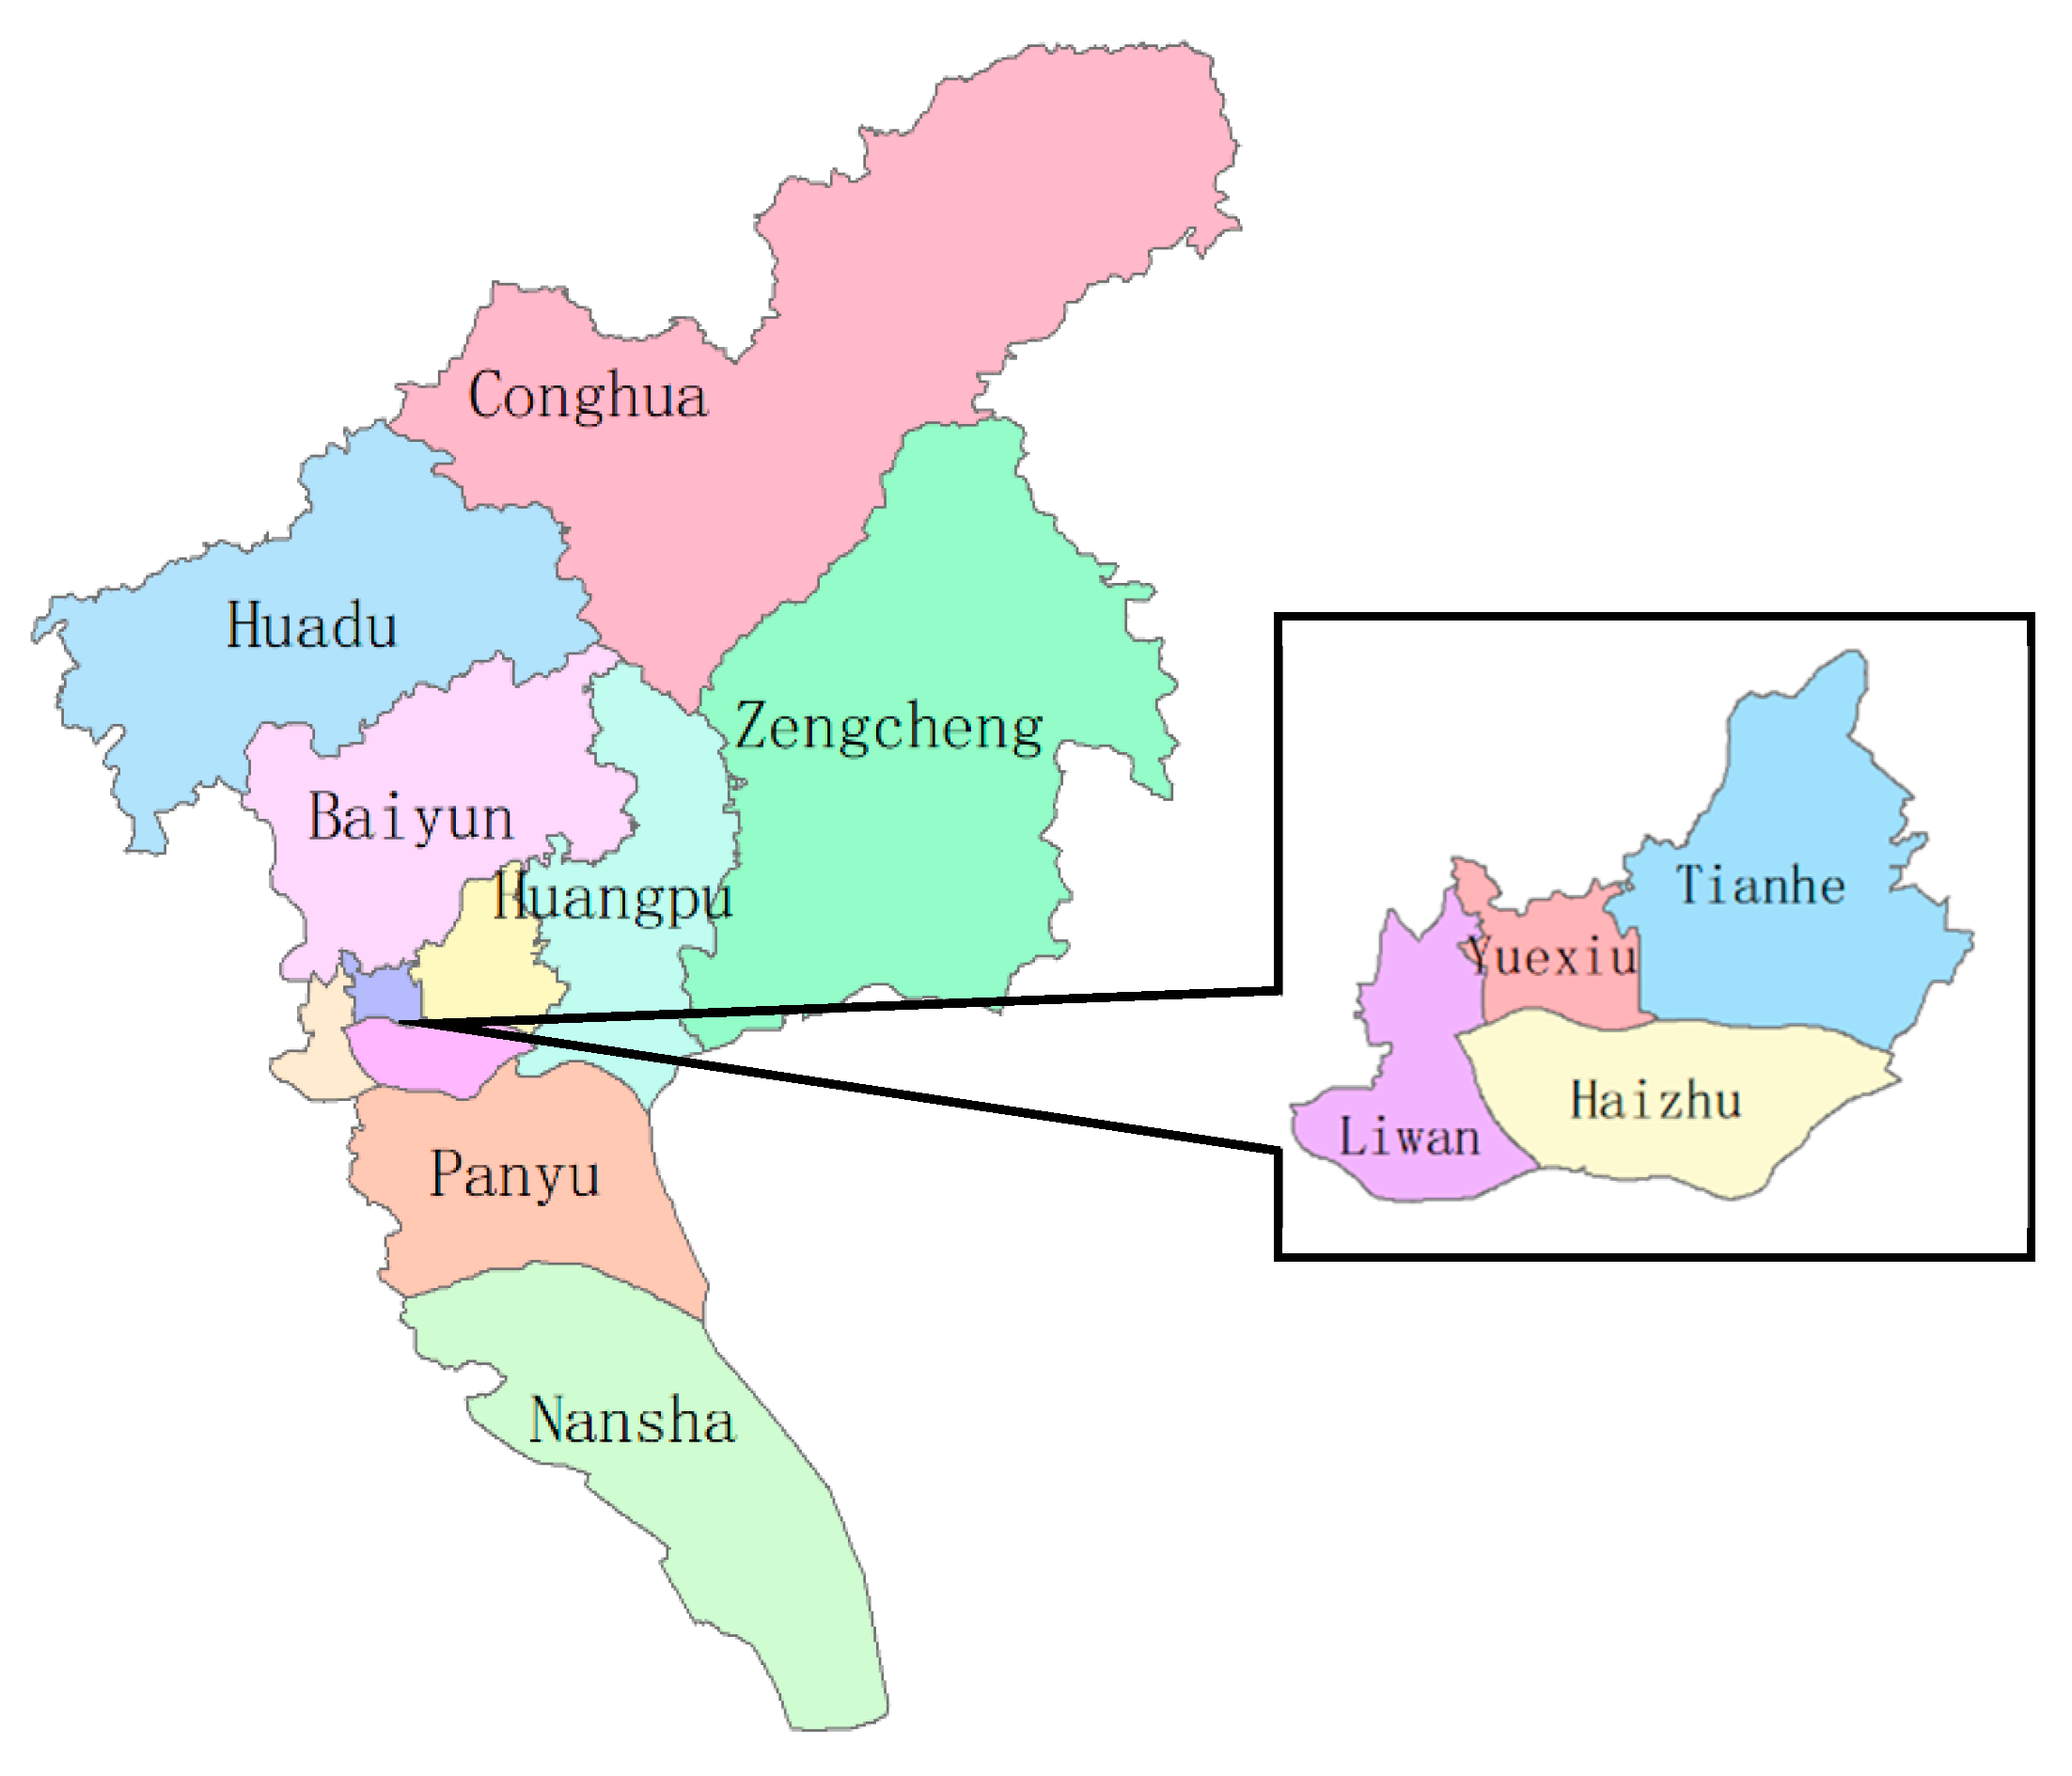
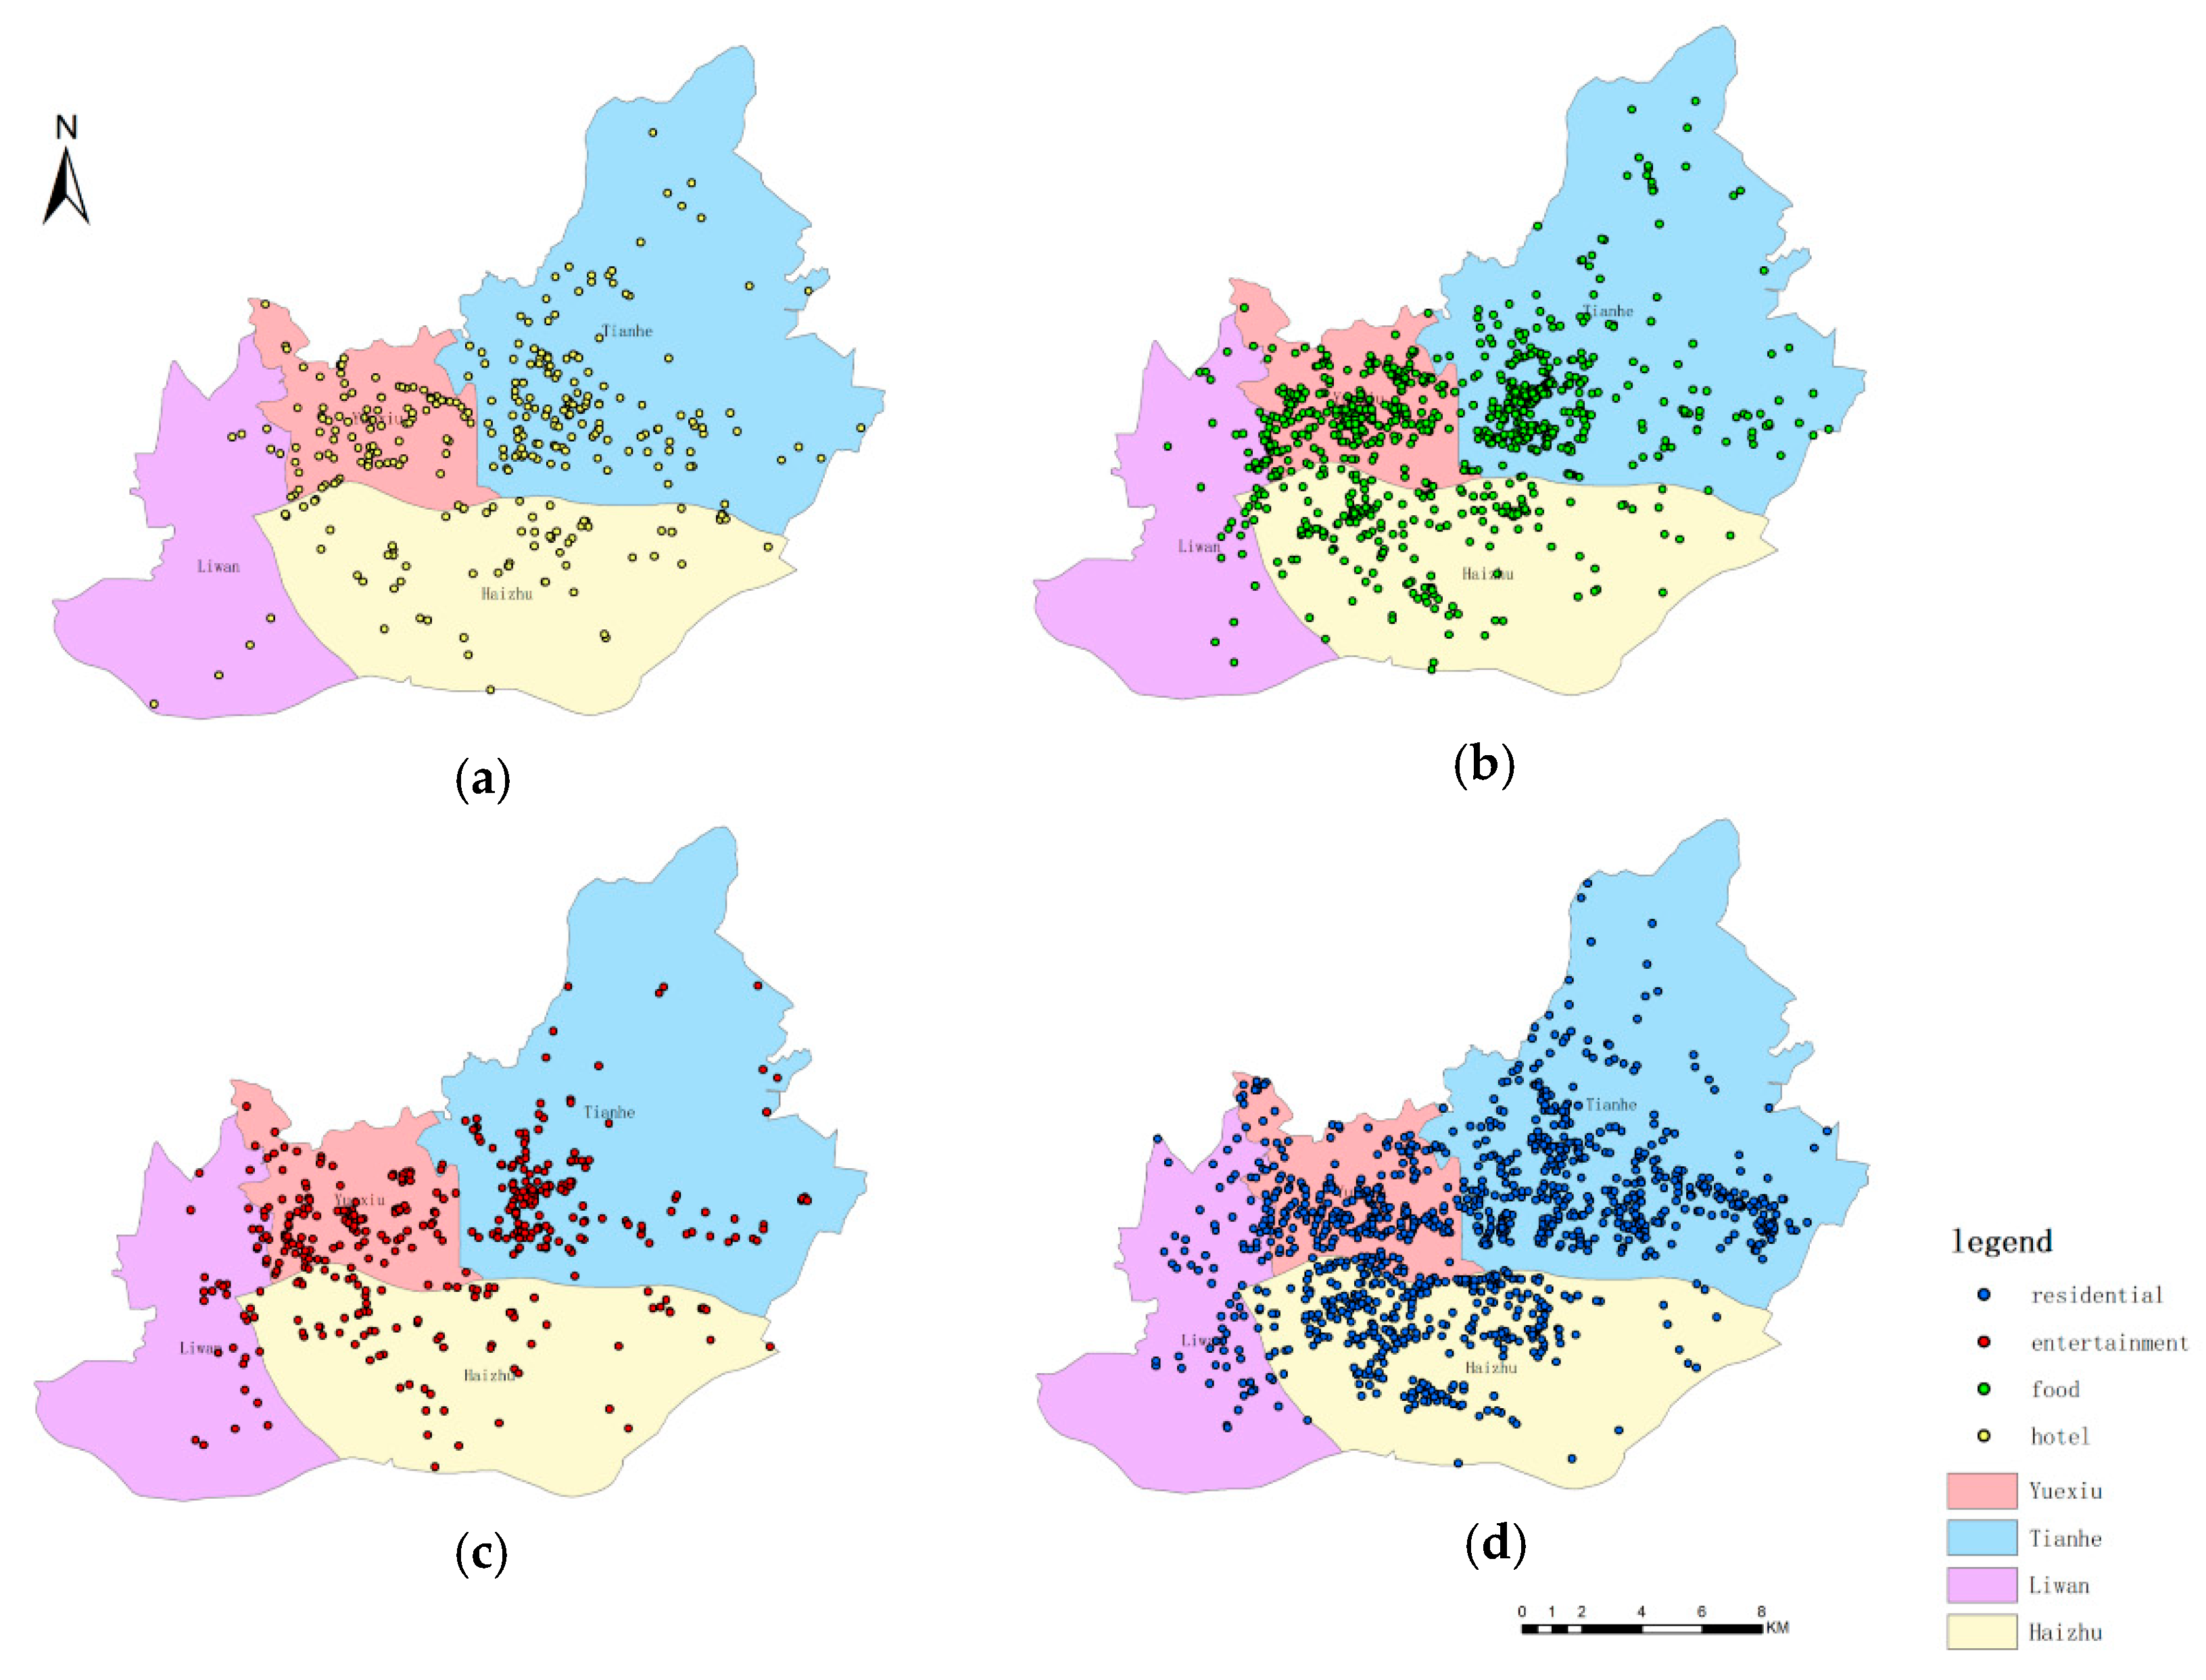
Section 2.2. Subsequently, we mapped four POI categories in four main urban districts of Guangzhou (Liwan, Haizhu, Yuexiu, Tianhe) by using the no-further-process dataset, wherein the POI set only represents POI of storing check-in records, the result of visualization shown as Figure 7. The majority of POIs, as the exhibition of the Figure 7, are located at the districts of Tianhe, Yuexiu, and Haizhu, where one can witness the modernization and the prosperity of Guangzhou. Moreover, the POIs of food and residential present a relatively homogeneous distribution in the three regions, while the POIs of hotel and entertainment exhibit a relative clustering distribution in the regions of Tianhe and Yuexiu. The 
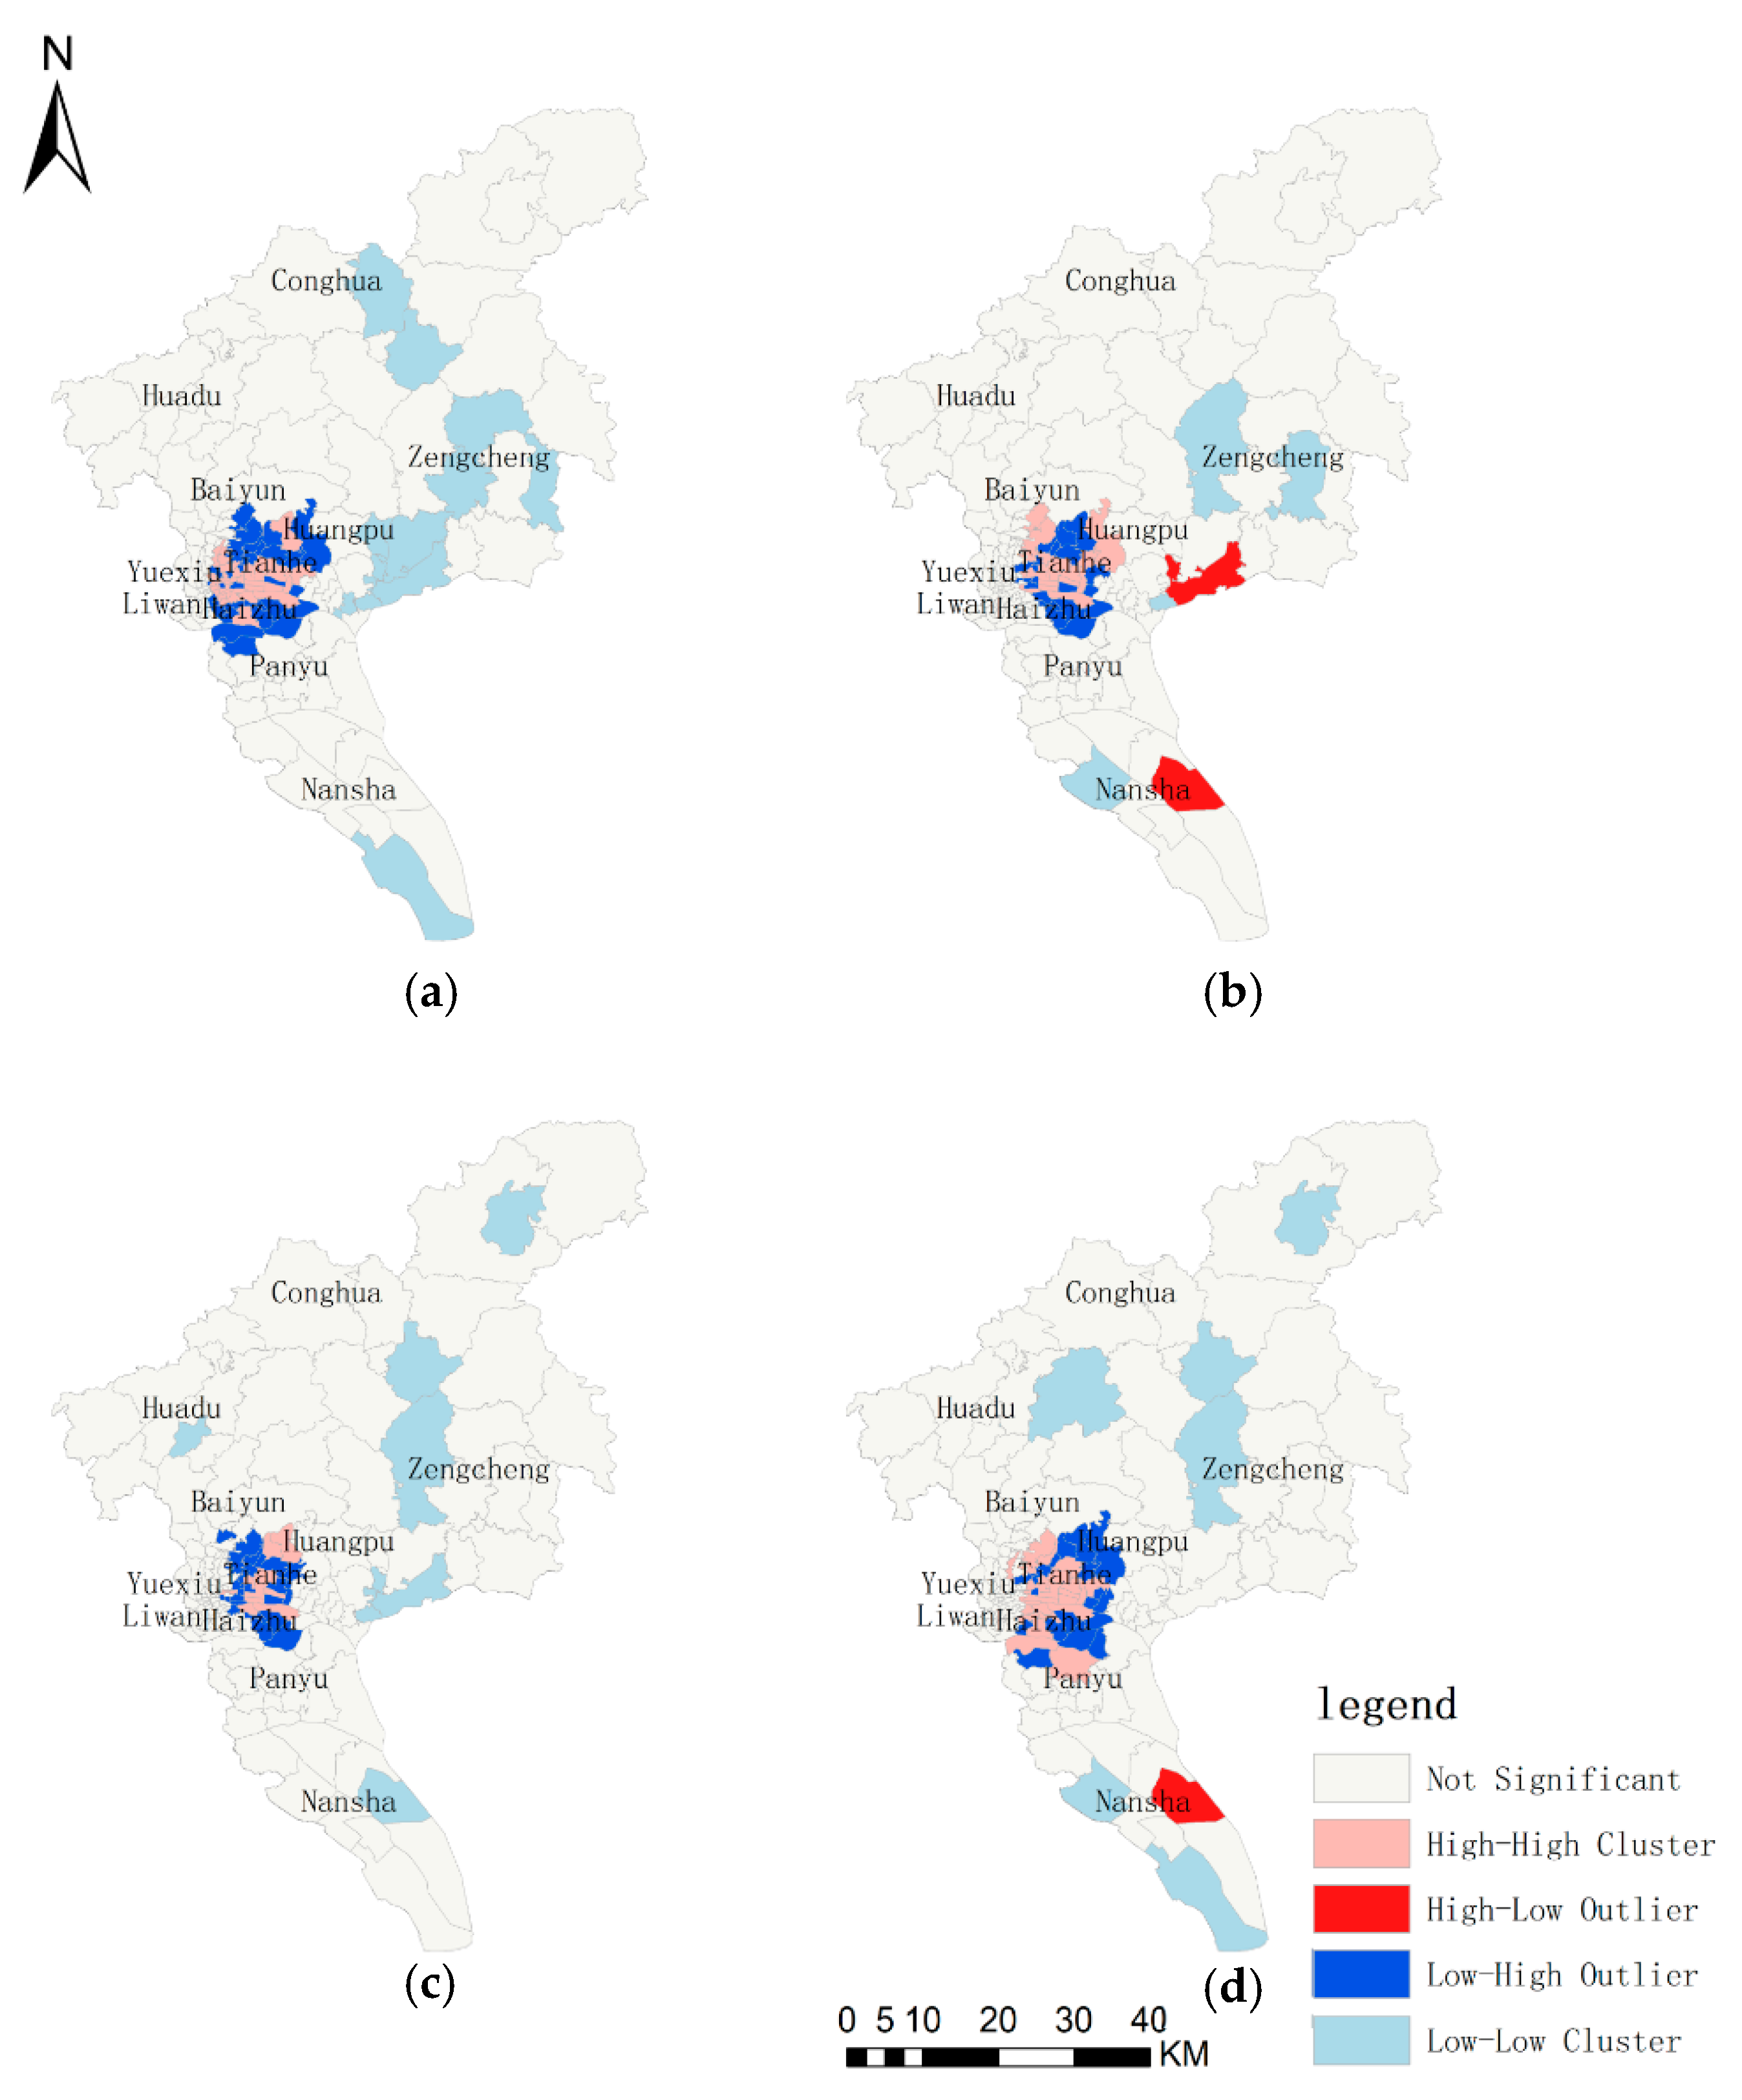
Figure 7 shows a high-level mix of four POI categories, especially in the districts of Tianhe and Yuexiu. It is worth mentioning that Tianhe and Yuexiu are the new town and the old town of the city, respectively, and they are also the most populous districts where a high-level land use mix exists. As the locations of four POI categories were likely to exhibit different spatial patterns, we further examined whether check-in counts of four POI categories were likely to exhibit different spatial patterns as well. Therefore, we utilized local Moran’s I to recognize the check-in quantity’s clustering features of different POI categories across city of Guangzhou after the map of Guangzhou was separated by the borders of towns and communities, shown as Figure 8. As the Figure 8 exhibits, the distribution maps of four POI categories were generally similar, but slight differences still existed in the local area; these differences may offer the possibility to recognize different types of POI in high mix areas. Moreover, the high-high cluster distribution of four types mainly existed in main urban districts, which means that the majority of users prefer to check in and be active at this area, and the significantly high mix of various human activities exists here. The situation of the high-level mix not only means it is necessary to refine land use types but also means it is hard for us to seek obvious boundaries to separate the four POI categories if only based on the display of Figure 7 and Figure 8. Therefore, at the level of space distribution, we speculated that the human activity types in the four kinds of POI cannot be recognized.
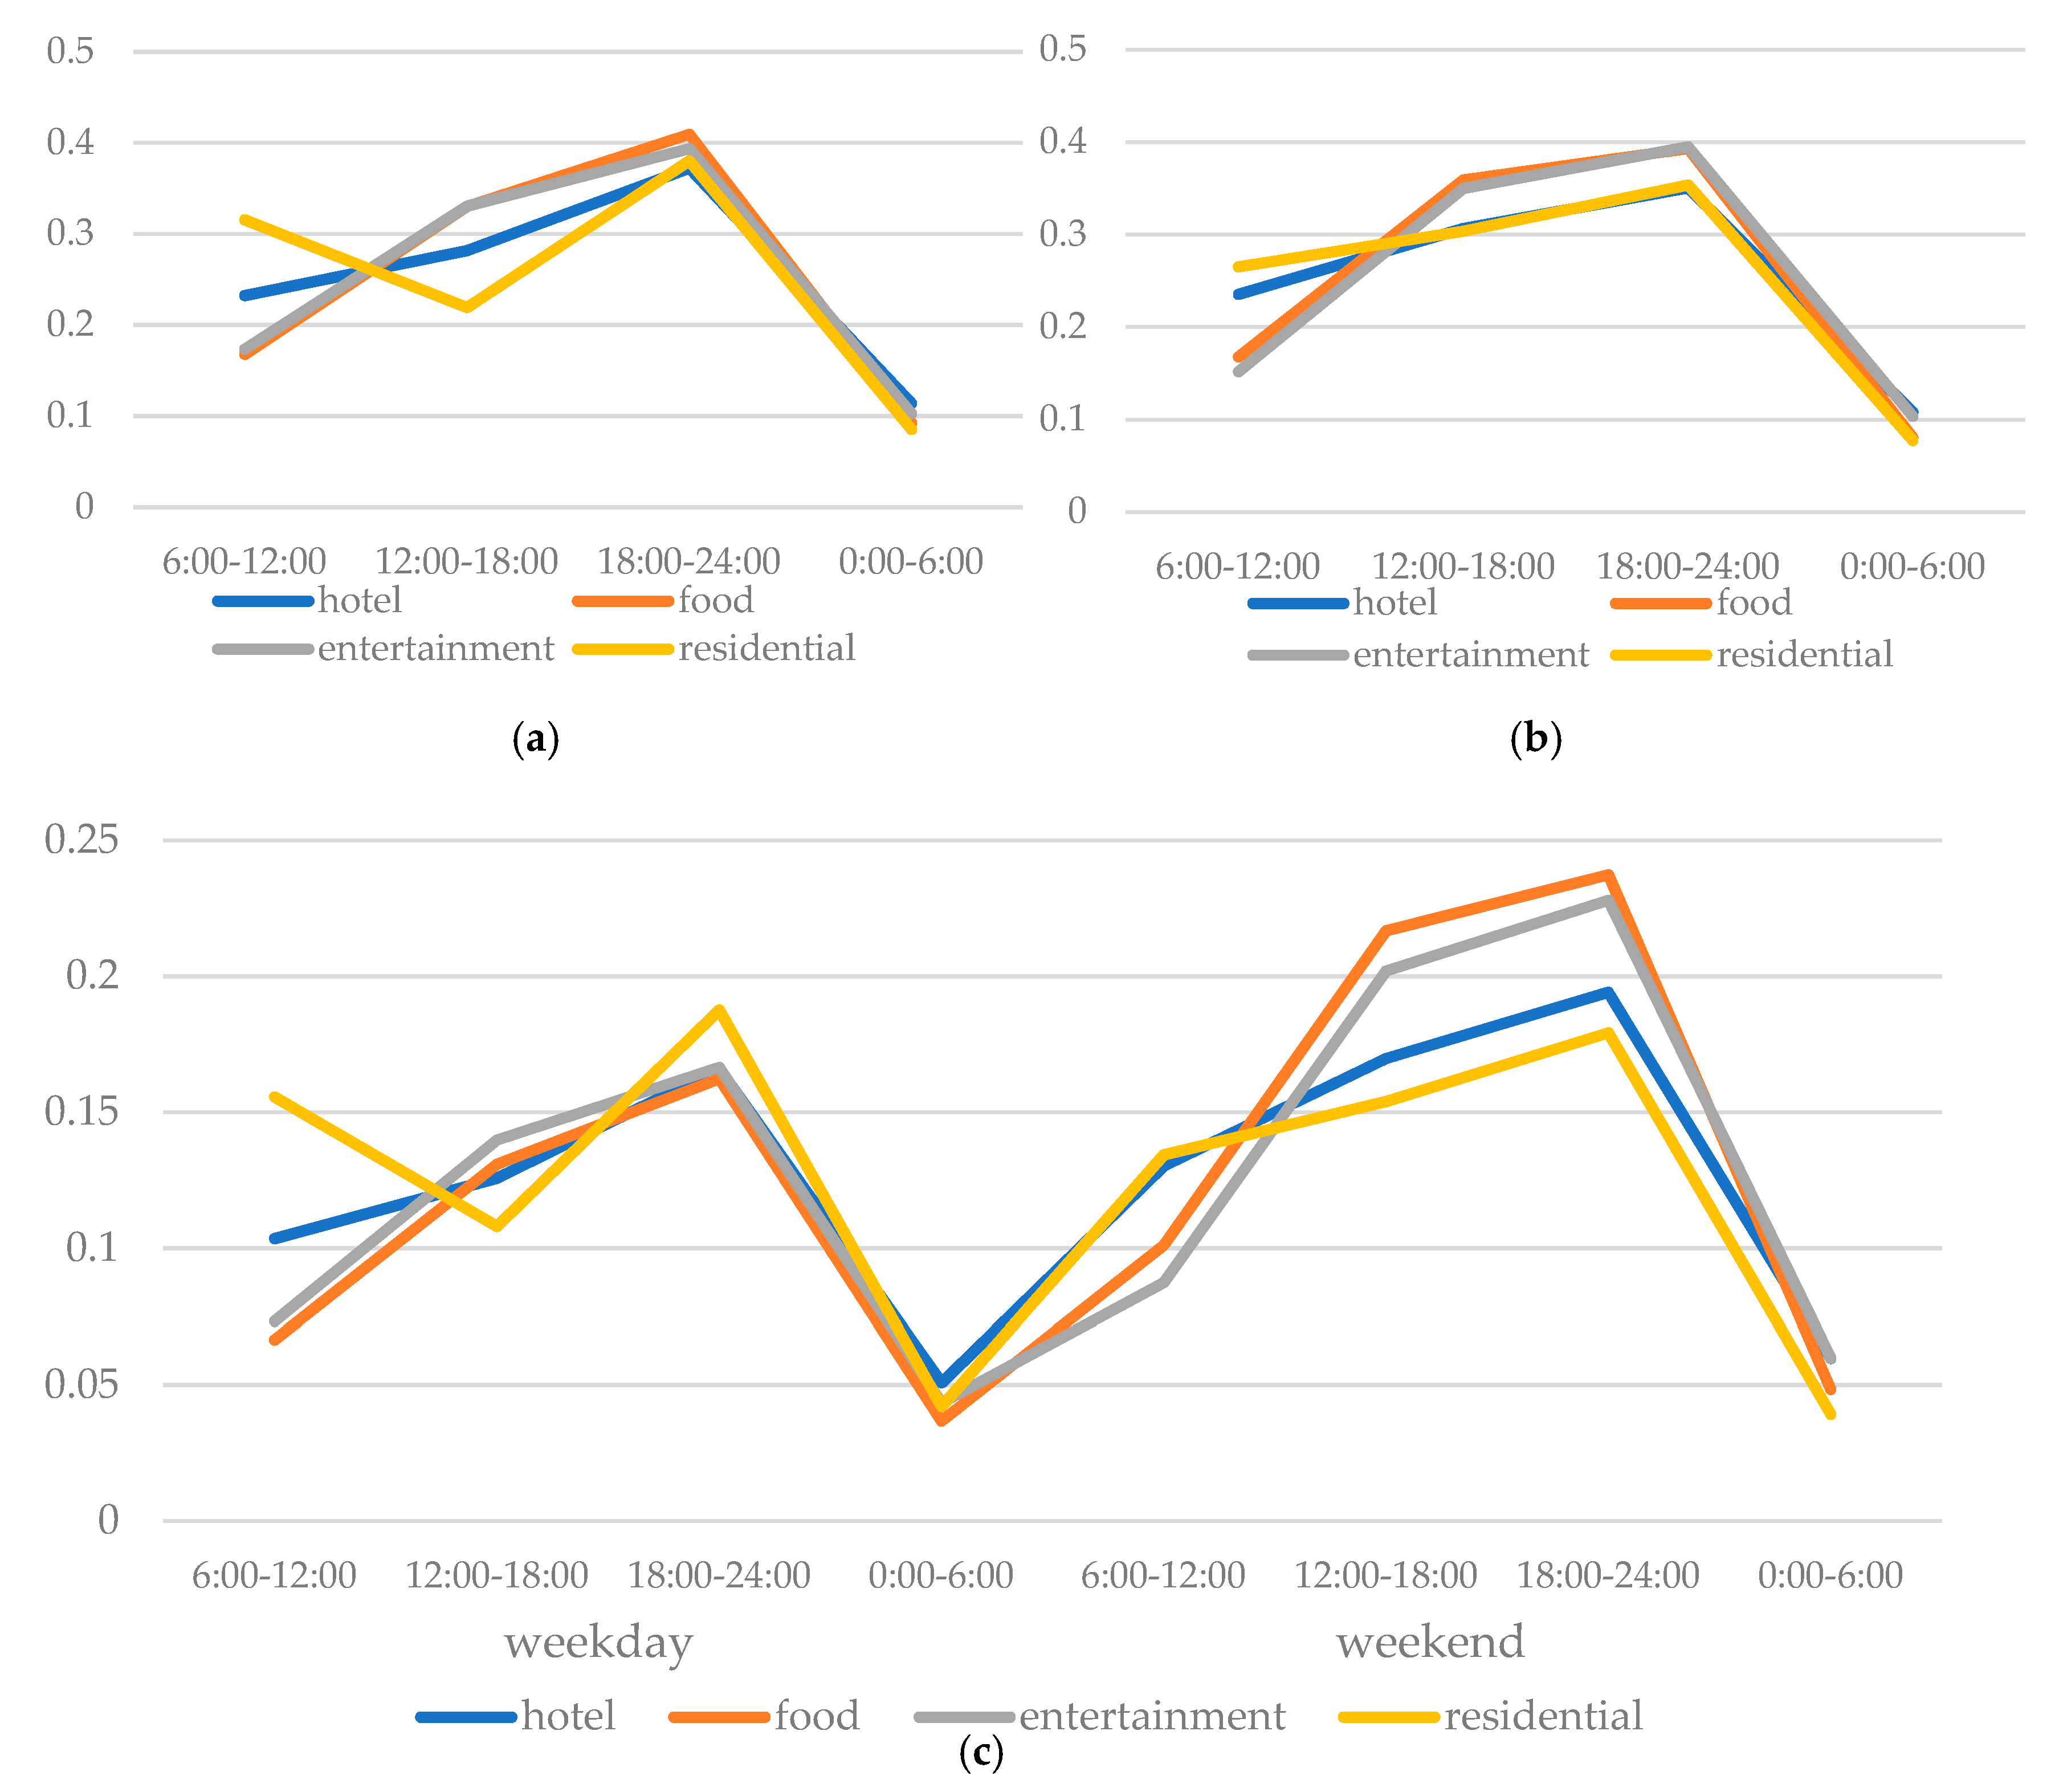
Beside the difference in the spatial distribution of POIs, the discrepancy in the check-in behavior patterns of users (e.g., number of check-ins, temporal patterns of check-in behavior, etc.) also can potentially assist in categories recognition. More specifically, in this study, we attempted to incorporate the temporal features of human check-in behavior into the POI category classification. In general, human activities are likely to be regular in daily life (e.g., people enjoy food in midday or evening, relax themselves at entertainment venues in non-working times, and stay at home in the evening or before going to work). Therefore, we firstly divided the check-in dataset into four time periods (6:00–12:00, 12:00–18:00, 18:00–24:00, 0:00–6:00) and two day types (weekday, weekend). We plotted the distribution of check-ins among the four time periods in weekday and in weekends, respectively shown as Figure 9a,b. The line charts (Figure 9a,b) indicate that people prefer to check in at home during the weekday mornings (before going to work) and evenings (after finishing work) and go to enjoy food and entertainment during weekday afternoons or nights, while, during the weekend, human mobility and activity patterns exhibit a relatively disordered state (each POI category reflects a similar active curve). It can be validated by the phenomenon that people generally have a regular daily schedule for work and entertainment on weekdays, while, due to more free time and space to schedule their personalized life, people tend to have a less regular daily schedule on weekends. Subsequently, we plotted the distribution of check-ins among eight time periods after one week was separated into weekday and weekend. More specifically, weekday check-ins and weekend check-ins were both averaged, as there are more weekdays than weekend days in total (e.g., the number of total weekday check-ins was divided by five, and the number of total weekend check-ins was divided by two; subsequently, two results were summed as total data in Figure 9c), illuminated as Figure 9c. In addition to the information reflected by Figure 9a,b, the broken line graph illustrates that the check-ins of POIs of hotel and residential hardly increase, while a significant growth takes place in the check-in number of POIs of food and entertainment. The discussions above indicate that temporal features of human check-in behavior pattern can benefit the recognition of POI categories. Therefore, the consideration of temporal features in check-in behavior were considered in the POI category prediction.
Beside the spatial and the temporal features, the quality of samples is also significantly essential for modeling. In order to explore the feasibility of the proposed rule for filtering samples in Section 2.2, the comparison between three rules (proposed rule, no further process, same threshold) mentioned in Section 2.2 were performed in the following. We utilized the RF to model the POI types pattern in this comparison, and the prediction accuracy of the three rules (proposed rule, no further process, same threshold) for the modeling sample selected were 76.75%, 45.77%, and 57.24%, respectively. Prediction accuracies indicates that the proposed rule for filtering samples performs with higher effectiveness than the other two rules. Therefore, we could speculate that the no further process rule may have caused the poor accuracy due to the potential existence of fake check-ins, while the same threshold rule increased the accuracy, since the rule filtered part of fake check-ins and less representative POI check-in data. Therefore, we selected the dataset filtered by the proposed rule in the following process.
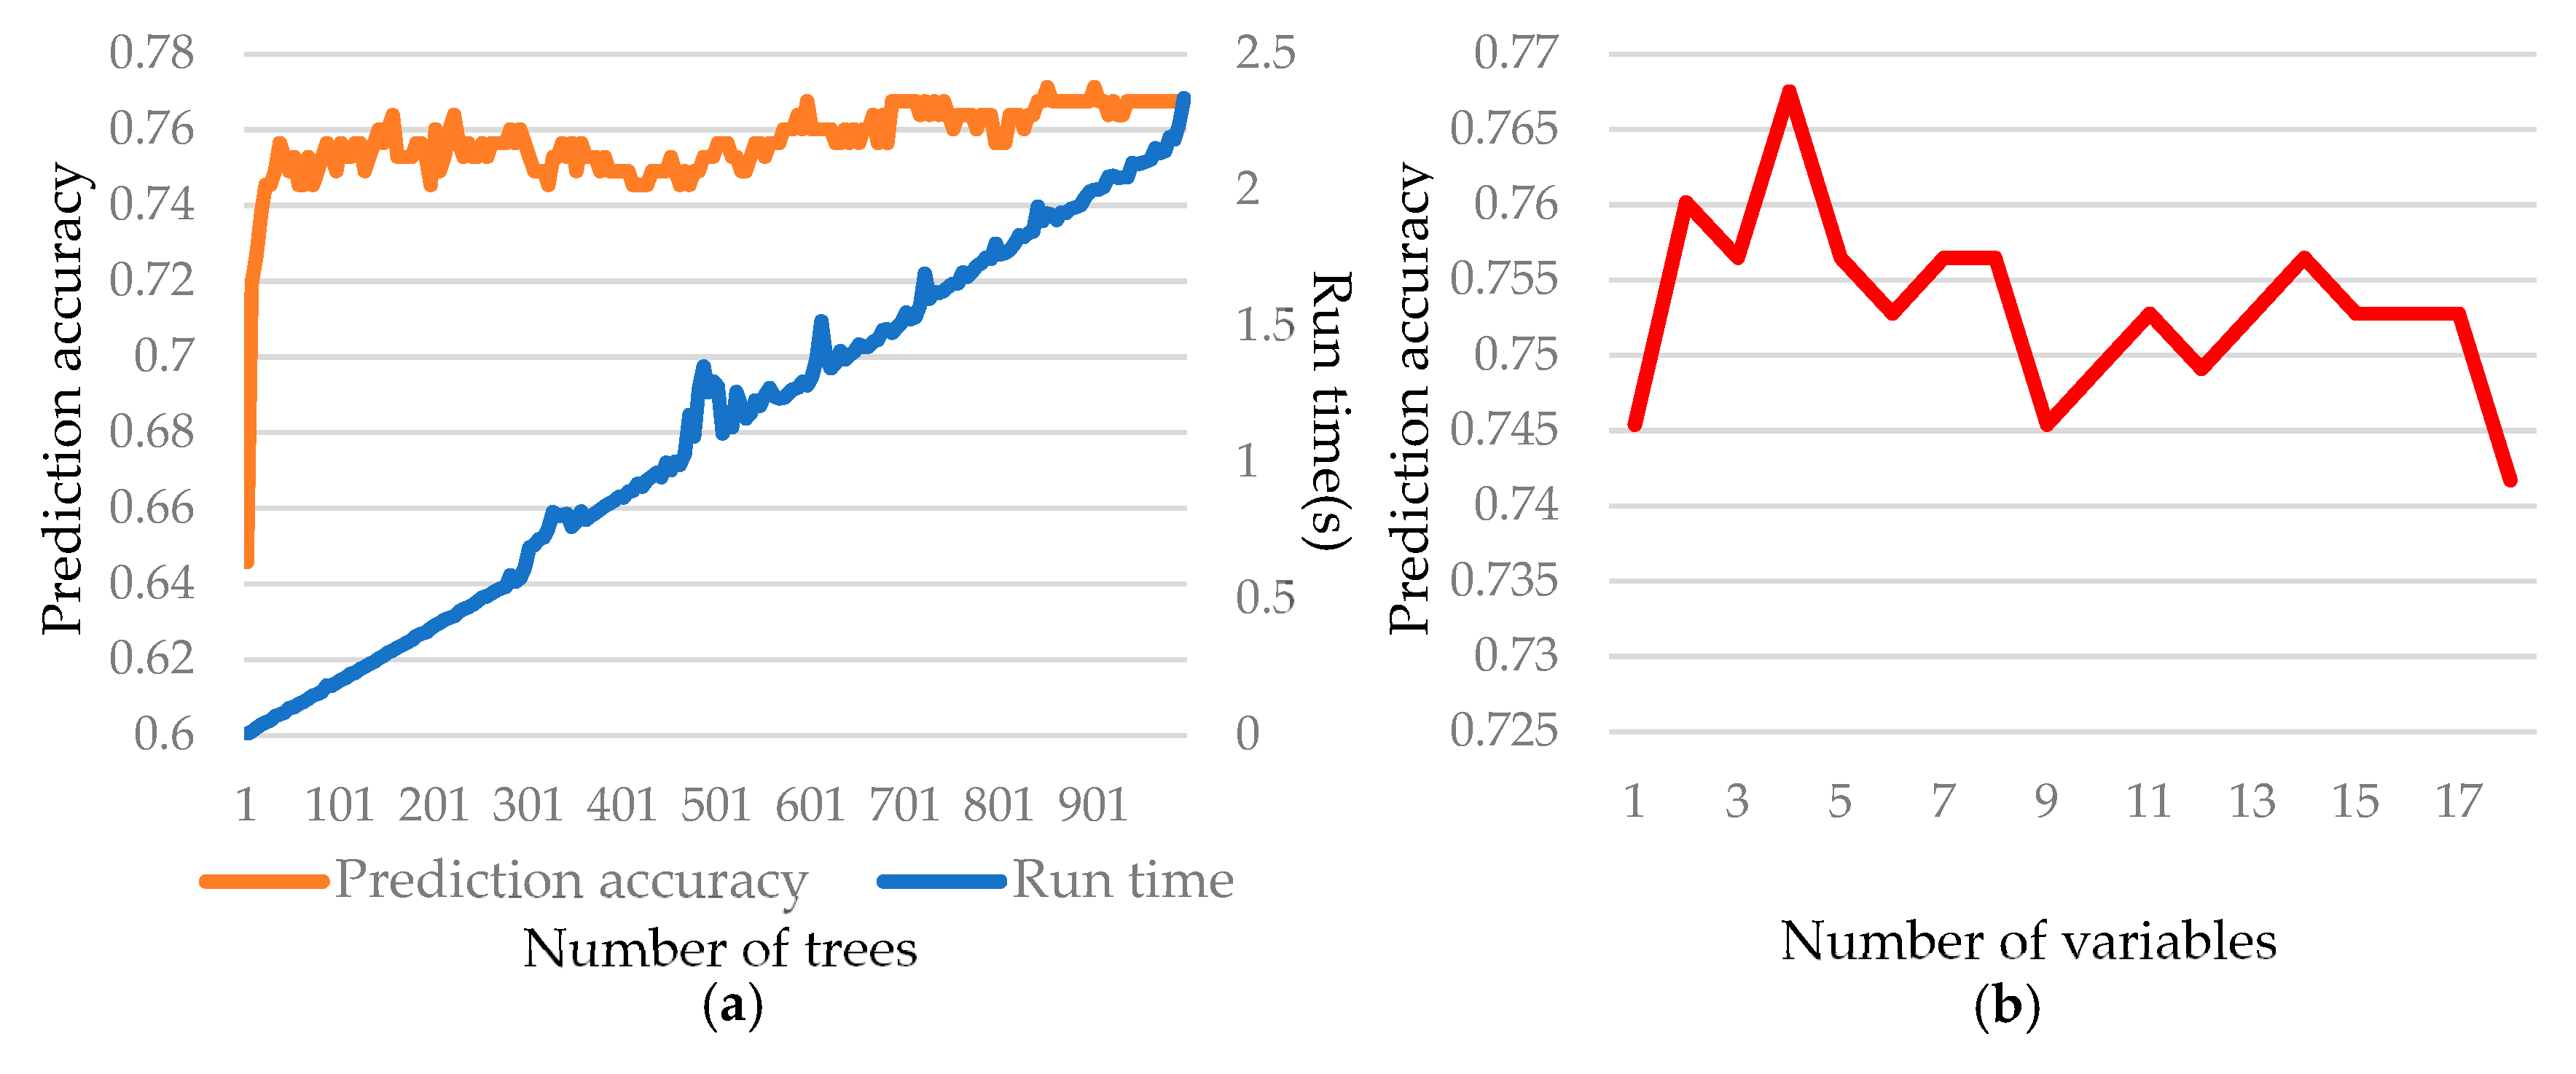
In general, the parameters of the model are a crucial part of optimizing model performances, and an optimal model is beneficial to the prediction precision as well as the efficiency. Therefore, in order to optimize the model, it is critical to examine the effect of model parameters on the performance of the model. In this process, according to Thanh Noi and Kappas [21], the max number of decision trees and splitting variables were selected as main parameters to explore the optimal RF model in this study. We firstly separated the dataset into training and predicted samples for training and testing prediction accuracy, respectively. Secondly, we constructed a model under the number of decision trees during the range from one to 1000 in increments of five. Generally, a bigger quantity of decision trees causes higher prediction accuracy, while the limitation of that is the time consumed. Therefore, we wanted to make a balance between time consumed and prediction accuracy. As the exhibition of Figure 10a we observed that the building trees beyond approximately 280 did not result in considerable additional performance increase but caused a slight decrease of prediction accuracy; finally, the relatively stable prediction accuracy happened at the tree beyond approximately 700. Therefore, we selected the forest size of 700 as a reasonable trade-off between time consumed and prediction accuracy. Subsequently, we built the model under the quantity of splitting variables from one to 18 (total number of selected features was 19). We could speculate that the performance of RF would be the best when the max number of splitting variables was four, as the illustration of Figure 10b. We thus choose four as the max number of splitting variables in our model. Through the experiment, we found that the other parameters of RF did not have a significant positive influence for the prediction accuracy in the study. Therefore, we do not discuss the influence of other parameters in detail herein.
Using the check-in dataset, we also explored the influences of explanatory variables for predicting POI categories. The importance of explanatory variables was calculated based on the Gini impurity index mentioned in Section 3. The process of calculation is as follows:
(1)
Calculating the Gini under node of m and the Gini after splitting from m, the importance of this explanatory variable in node of m is the difference between that;
(2)
Calculating the importance of this explanatory variable under all nodes of the tree by step (1), the importance of this explanatory variable under this tree is the sum of that;
(3)
Calculating the importance of this independent variable under all trees of this RF model by step (2), the importance of this explanatory variable under this RF model is the sum of that.
Through these three steps, we calculated and ranked the importance of all features in our model, shown as Table 3. It was obvious that each variable had a different influence on the prediction of POI categories. The variables of V1 and V2 as well as V3 played critical roles in predicting POI categories. It is presumably because, in large public venues such as entertainment, the numbers of users and check-ins are significantly larger than venues such as residential and hotel. According to that, the information of these variables can reasonably classify a large part of POIs. Meanwhile, the variables of V7 and V12 offered less effect to POI category prediction issues. We speculate that the period of 0:00–6:00 produced check-in data too small in size to generate obvious statistical results and to have a positive impact.
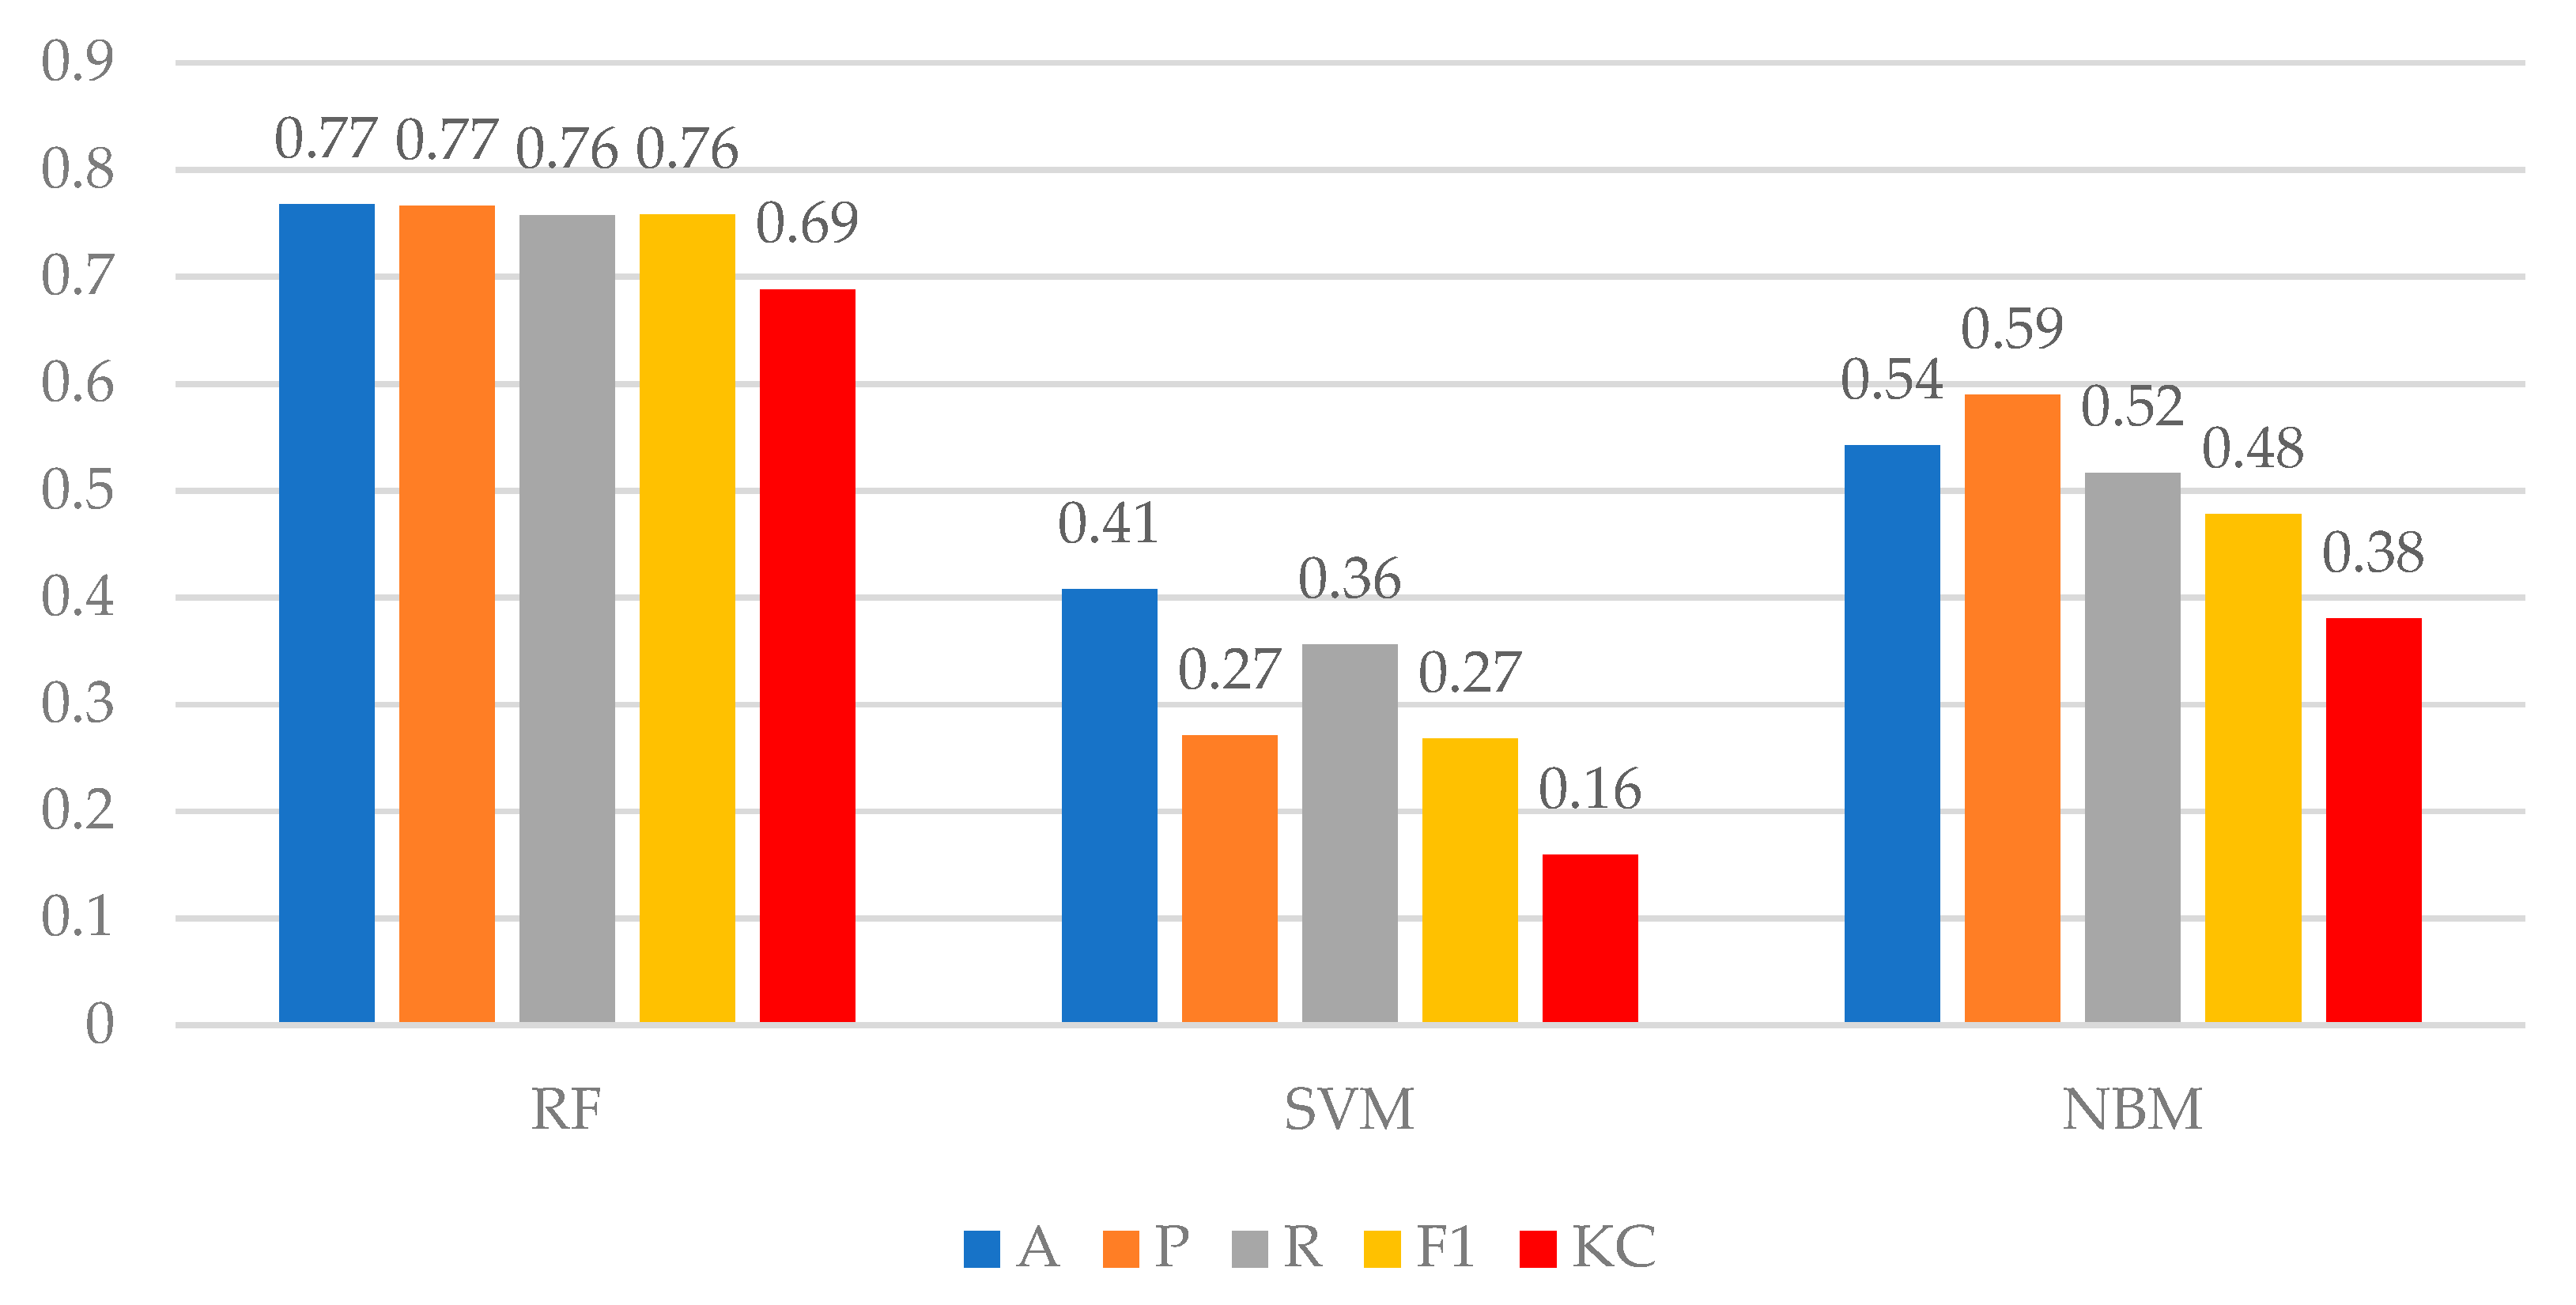
To determine whether the proposed model can achieve a relatively high accuracy in predicting POI categories, we made a comparison between random forest (RF), support vector machine (SVM), and naïve Bayes model (NBM). The principles of these models are exhibited in Section 3. In the same rule for filtering check-in data and splitting training datasets and test datasets, we fitted these models by using the same training dataset. Subsequently, we utilized these fitting models to predict POI categories. The prediction results of RF, SVM, and NBM were 76.75%, 40.76%, and 54.24% respectively, which can also be viewed as the accuracy of the three models. In the perspective of accuracy, the RF showed a better prediction performance than SVM and NBM in our study. However, accuracy alone cannot fully demonstrate the performance of these models; we therefore utilized five common classification evaluation indicators, accuracy (A), precision (P), recall (R), F1-score (F1), and kappa coefficient (KC), to show capability of the three models. We calculated these indicators by the equations as follows:
A = i T N i N
P = T N i P N i
R = T N i S N i
F 1 =   2 p r e c i s i o n r e c a l l p r e c i s i o n + r e c a l l
KC = p o p e 1 p e
where T N i denotes the number of correctly predicted in i-th categories; N represents the total number of samples in the testing dataset; P N i denotes the number of predictions in i-th categories; S N i denotes the total number of the testing samples in i-th categories; p o can be calculated by the way accuracy was calculated (and one can say that p o is accuracy); and p e can be calculated by p e = i P N i S N i N N .
The comparison of the five common classification evaluation indicators between three models is shown as Figure 11 after calculating with the above equations. Moreover, the indicators of P, R, and F1, shown as the Figure 11, were further calculated under the rule of macro average. In other words, the macro average was the arithmetic mean of all categories. It is obvious that the RF showed a significantly better prediction performance than SVM and NBM in terms of five evaluation indicators. We speculated that the best performer would be RF, and the next best performer would be NBM, followed by SVM in this study. Therefore, we selected the RF as our optimal model in our research. To obtain an overall prediction accuracy, we subsequently utilized the RF to obtain the overall accuracy of 72.21% by 10 predictions in different training and test samples.
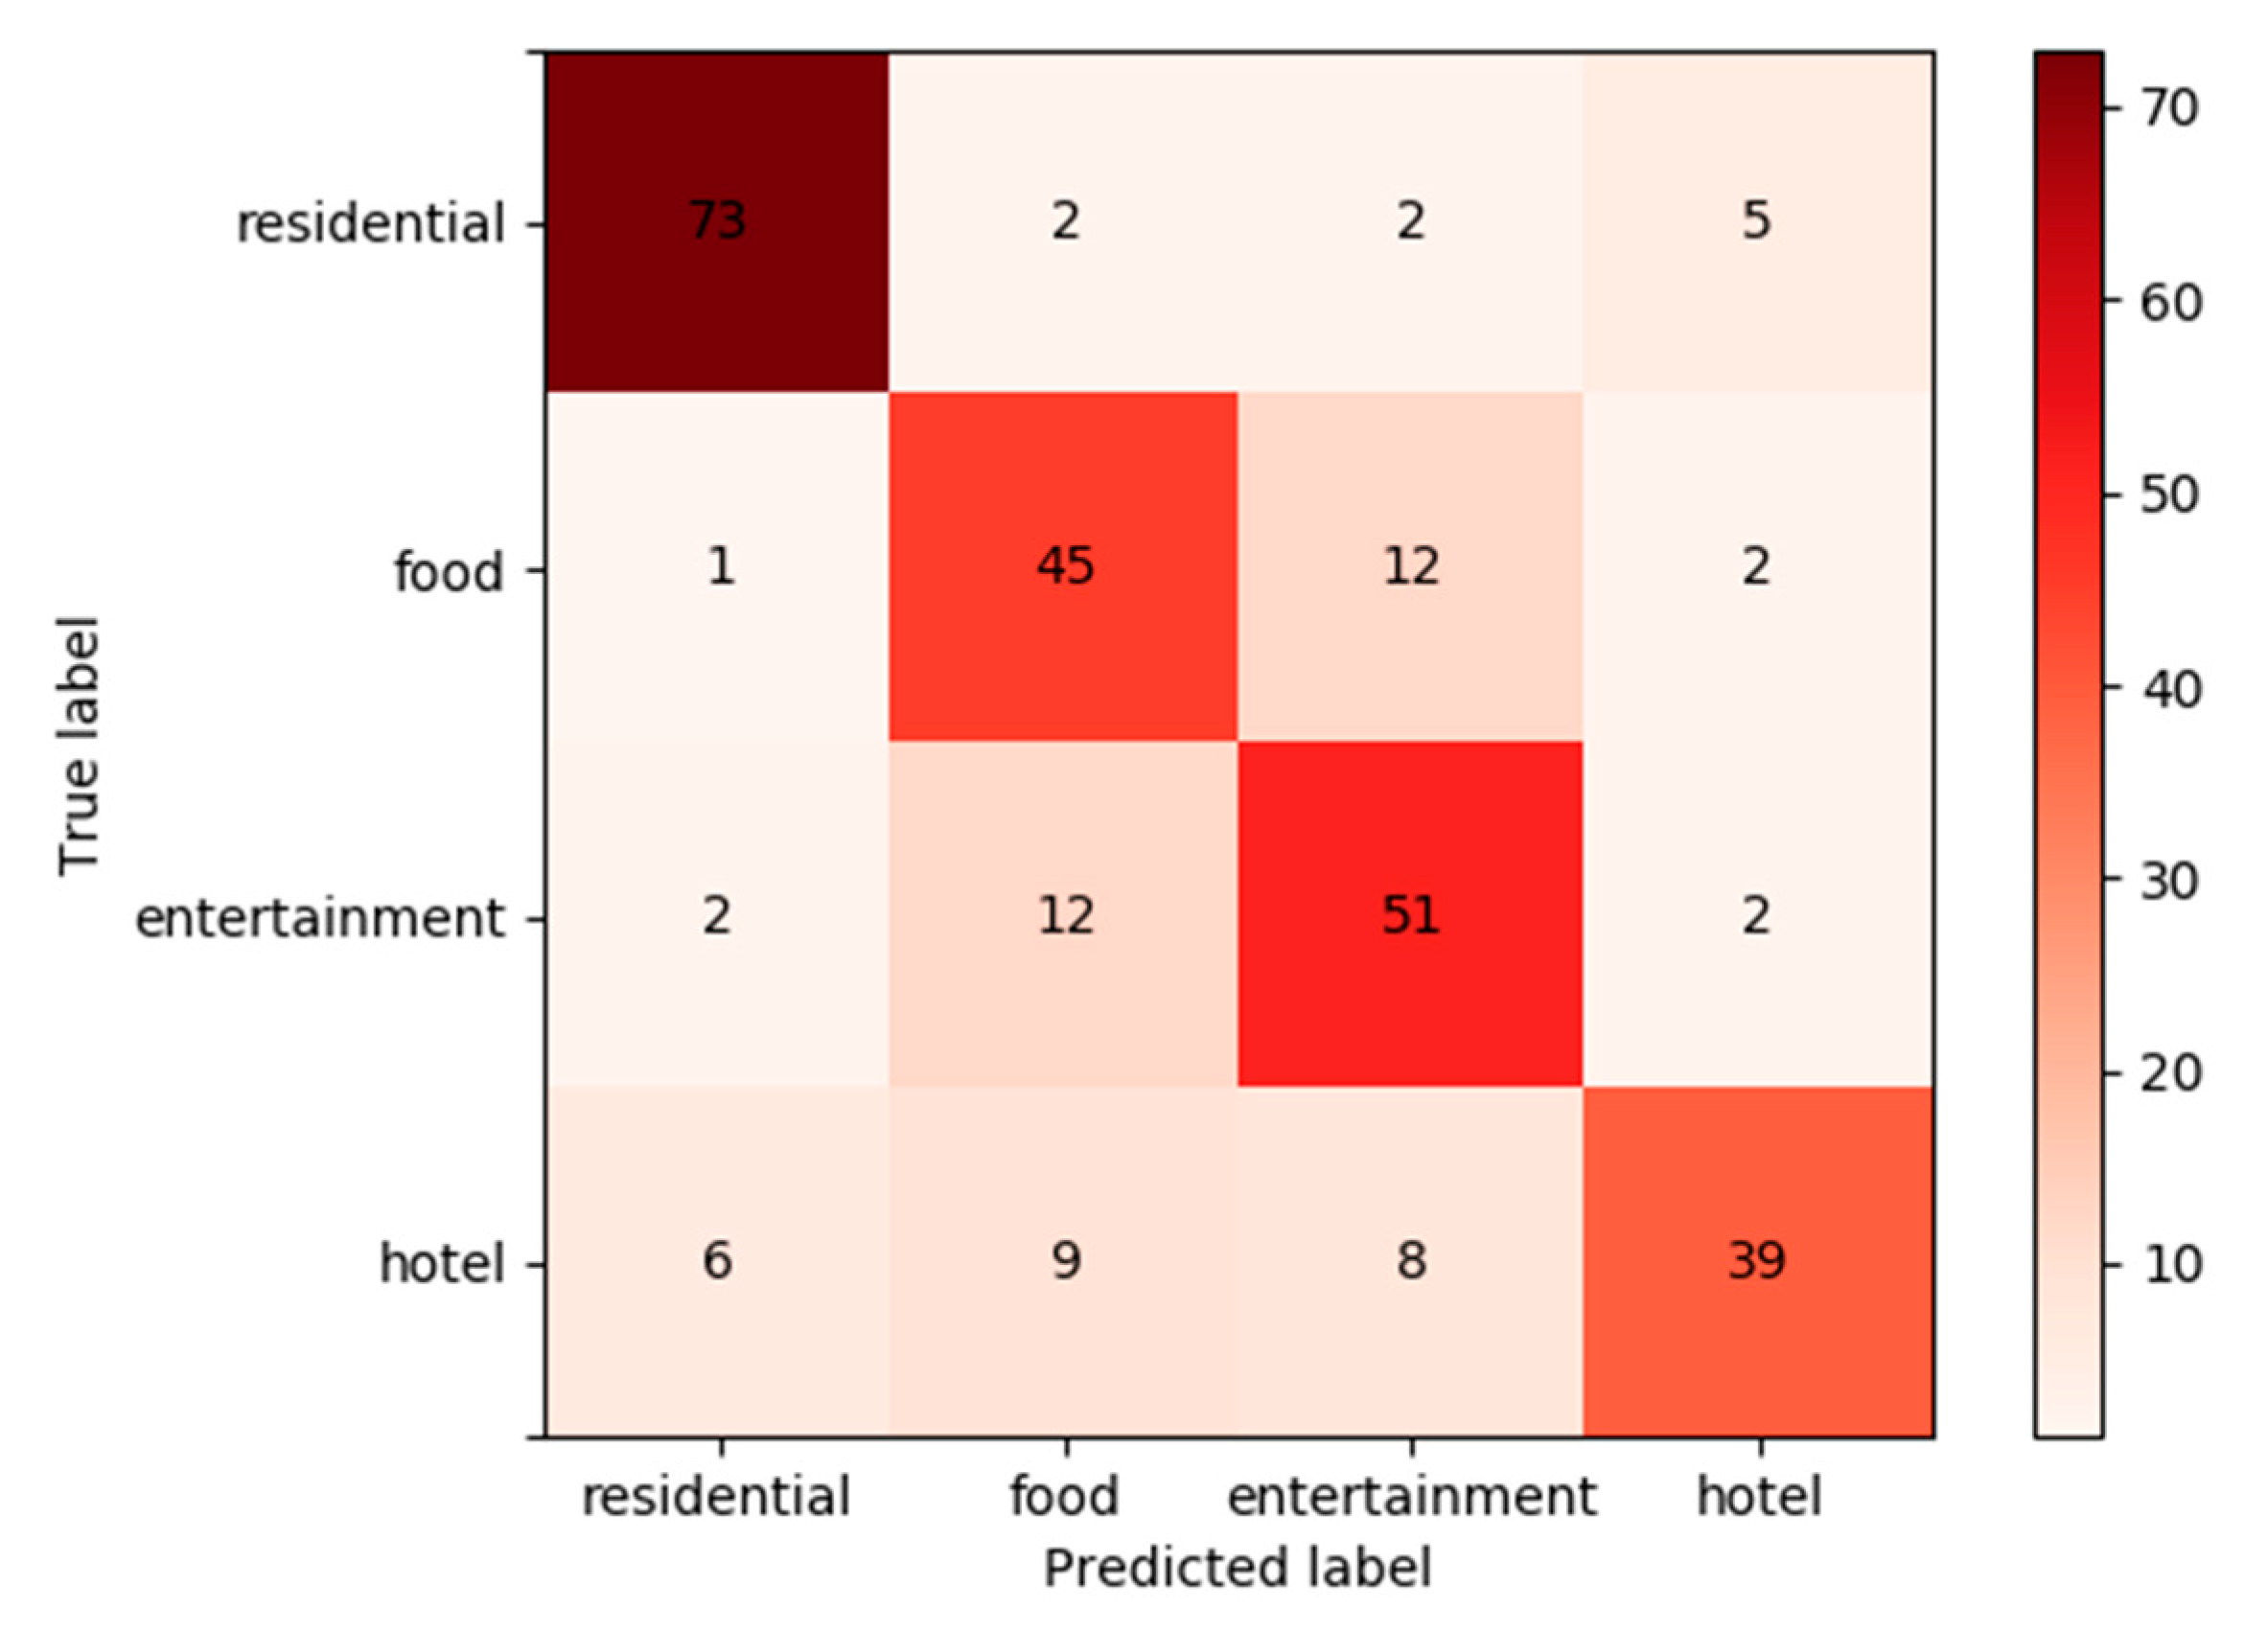
In order to further analyze the prediction results and acquire improvement implications for future works, we output the confusion matrix generated from the RF-based prediction, shown as the Figure 12. It is obvious that residential had a higher R of 89.02%, while food, entertainment, and hotels only had Rs of 75%, 76.12%, and 62.9%, respectively. It is shown that some POIs of hotels were wrongly predicted to residential, food, and entertainment. According to that, we speculate that the reason is hotels are not only similar to residential in users’ check-in behavior patterns but are also similar to food and entertainment in both POIs’ locational characteristics and users’ check-in behavior patterns, because some large hotels own canteens and facilities such as swimming pools and gyms. Therefore, this caused the similarity in spatial and temporal features of check-ins. Moreover, some POIs of food and entertainment were confused with each other. It is presumably because, in the process of initial classification, we classified large shopping centers as entertainment, while there might be a few canteens in a large shopping center. In the future, we can explore other explanatory variables to clearly distinguish these POI categories to improve the model accuracy.
Through the experiment, we can see that the overall accuracy calculated by 10 times prediction achieved 72.21%, and the current highest prediction accuracy could achieve 76.75%. It means that we could precisely predict nearly three-quarters of POI-level land use categories in the study area, Guangzhou. Although the accuracy of a previous study that utilized deep learning exceeded our method [22], our method can gain fine-scale results and obtain needed data with less cost. Our approach has some advantages over other social sensing approaches, including low cost and fine granularity. The urban planner can directly utilize our model to learn about the city structure in a finer scale if they need to understand the urban structure in detail and thus change city policy or structures to meet the demand of urban development. They only need to prepare the variables required by the method, and the method is even flexible enough to replace the check-in data with data such as Global Navigation Satellite System (GNSS)-trajectory or real-time recording locations in their study areas. The other finding during processing (e.g., the different check-in patterns on weekdays and weekends, the different check-in behavior during different periods of the day, and the spatial distribution of check-in) can assist in optimizing the resource allocation to match the spatiotemporal feature of a city. Moreover, this method may provide the opportunity to attain the finer level land use classification in certain districts lacking POI data. However, the deficiency of supervised classification such as RF is the demand of operator intervention [23], which slows the efficiency of processing data in the method. Therefore, in the future, we can develop a model to improve the efficiency of processing data before classification. Moreover, the approach proposed in this study is likely to have potential applicability in classifying building-level land use (i.e., functions of buildings) according to human mobility and activity behavior and buildings’ locational characteristics. Human mobility and activity behavior can be measured by social media data (e.g., check-ins, posts, and images), GNSS trajectories, and mobile phone records. Buildings’ locations can be acquired via some open mapping projects such as OpenStreetMap. Our approach paves a new potential way to identify functions of buildings by using other social sensing data such as GNSS trajectories and mobile phone records and OpenStreetMap’s building data.

5. Conclusions

In the current study, we proposed a random forest method to analyze and predict the categories of POI to refine land use types by using Weibo check-in data in Guangzhou, China. In this random forest method, we proposed a rule considering the features of POI types to filter check-in data for obtaining the relatively representative check-in data of POI. This rule shows a better effect than the rule given few considerations about the features of POI categories. Subsequently, we explored spatial and temporal features of check-in data. The spatial distribution feature found from Section 4 (check-in data are significantly concentrated in main urban areas) reveals the existence of high-level land use mix and the necessity of refining land use types. More detailed information of functional areas rather than land use types is essential to the urban planners for better designing spatial structures and resource allocation of a city. The temporal distribution feature in all times of day during weekdays and weekends illustrates that different POI categories determine different functions and activity types, while different activity types own the special temporal features, through which we can recognize the different POI types. Apart from spatial and temporal distributions of check-ins, we also examined the impacts of model parameters on model performances so we could select a relatively optimal trade-off parameter to achieve a better prediction result. Furthermore, we made a comparison between random forest (RF), support vector machines (SVM), and naïve Bayes model (NBM), and the results illustrate that RF achieved a higher prediction accuracy in this study. In our experiment, our proposed RF achieved the highest accuracy of 76.75% and overall accuracy of 72.21%. This demonstrates that we can identify functional areas at a finer scale by recognizing POI categories in the highly mixed-use areas to achieve the purpose of refining land use types.
Our work fills part of gaps from parcel-level land use classification to finer resolution land use classification, which allows city decision makers to observe the city pattern at a finer land use structure. It provides another way to research the highly mixed prosperous central city districts and complicated urban village. Moreover, the approach proposed in this study can be potentially applied to identifying functions of buildings according to visitors’ mobility and activity behavior and buildings’ locational characteristics.
However, there are some limitations in this study, and we therefore need to consider how to address them and further improve the method in the future. First of all, the relatively low predicted precision of hotel POIs caused our model to achieve a relatively poor performance. Therefore, a better feature should be found to improve the predicted precision of hotel POIs to refine this RF model in the future. Furthermore, our model only works in the four POI categories mentioned above. This is a limitation in highly mixed-use cities, thus the extensibility of our model should be refined in a later work. In other words, the applicability of model can be extended to the classification of more POI categories. Moreover, combining RF with other deep learning models may be a feasible way to improve this methodology. Owing to the lack of the dataset belonging to another city, we cannot verify our model’s ability utilized in other cities. Apart from that, other types of data, such as real-time population distribution data, can be integrated in the future work to enhance the performance of this model. Finally, we would attempt to identify functions of buildings by using other social sensing data such as GNSS trajectories and mobile phone records and OpenStreetMap’s building data in the near future once social sensing data are available.

Author Contributions

Conceptualization, Y.S. and X.Z.; Methodology, Y.S. and X.Z.; Software, X.Z.; Validation, X.Z. and A.Z.; Formal Analysis, X.Z. and Y.S.; Investigation, X.Z. and Y.S.; Resources, X.Z., Y.S., and Y.W.; Data Curation, X.Z. and A.Z.; Writing-Original Draft Preparation, X.Z. and Y.S.; Writing-Review & Editing, X.Z., Y.S., and Y.W.; Visualization, X.Z. and A.Z.; Supervision, Y.S.. All authors have read and agreed to the published version of the manuscript.

Funding

This work is supported by the Fundamental Research Funds for the Central Universities (Grant No. 37000-31610453).

Conflicts of Interest

The authors declare no conflict of interest.

References

  1. Sun, Y.; Fan, H.; Li, M.; Zipf, A. Identifying the city center using human travel flows generated from location-based social networking data. Environ. Plan. B Plan. Des. 2015, 43, 480–498. [Google Scholar] [CrossRef]
  2. Sun, Y.; Fan, H.; Bakillah, M.; Zipf, A. Road-based travel recommendation using geo-tagged images. Comput. Environ. Urban Syst. 2015, 53, 110–122. [Google Scholar] [CrossRef]
  3. Noulas, A.; Scellato, S.; Lathia, N.; Mascolo, C. A Random Walk around the City: New Venue Recommendation in Location-Based Social Networks. In Proceedings of the 2012 International Conference on Privacy, Security, Risk and Trust and 2012 International Conference on Social Computing, Amsterdam, The Netherlands, 3–5 September 2012; Ieee: New York, NY, USA, 2012; pp. 144–153. [Google Scholar]
  4. Liu, C.; Liu, J.; Wang, J.; Xu, S.; Han, H.; Chen, Y. An Attention-Based Spatiotemporal Gated Recurrent Unit Network for Point-of-Interest Recommendation. ISPRS Int. J. Geo-Inf. 2019, 8, 355. [Google Scholar] [CrossRef] [Green Version]
  5. Gan, M.; Gao, L. Discovering Memory-Based Preferences for POI Recommendation in Location-Based Social Networks. ISPRS Int. J. Geo-Inf. 2019, 8, 279. [Google Scholar] [CrossRef] [Green Version]
  6. Sun, Y.; Li, M. Investigation of Travel and Activity Patterns Using Location-based Social Network Data: A Case Study of Active Mobile Social Media Users. ISPRS Int. J. Geo-Infor. 2015, 4, 1512–1529. [Google Scholar] [CrossRef] [Green Version]
  7. Rizwan, M.; Wanggen, W.; Cervantes, O.; Gwiazdzinski, L. Using Location-Based Social Media Data to Observe Check-In Behavior and Gender Difference: Bringing Weibo Data into Play. ISPRS Int. J. Geo-Infor. 2018, 7, 196. [Google Scholar] [CrossRef] [Green Version]
  8. Huang, W.; Li, S. Understanding human activity patterns based on space-time-semantics. ISPRS J. Photogramm. Remote Sens. 2016, 121, 1–10. [Google Scholar] [CrossRef]
  9. Pacifici, F.; Chini, M.; Emery, W.J. A neural network approach using multi-scale textural metrics from very high-resolution panchromatic imagery for urban land-use classification. Remote Sens. Environ. 2009, 113, 1276–1292. [Google Scholar] [CrossRef]
  10. Lu, D.; Weng, Q. Use of impervious surface in urban land-use classification. Remote Sens. Environ. 2006, 102, 146–160. [Google Scholar] [CrossRef]
  11. Hu, S.; Wang, L. Automated urban land-use classification with remote sensing. Int. J. Remote Sens. 2012, 34, 790–803. [Google Scholar] [CrossRef]
  12. Pei, T.; Sobolevsky, S.; Ratti, C.; Shaw, S.-L.; Li, T.; Zhou, C. A new insight into land use classification based on aggregated mobile phone data. Int. J. Geogr. Inf. Sci. 2014, 28, 1988–2007. [Google Scholar] [CrossRef] [Green Version]
  13. Liu, X.; Kang, C.; Gong, L.; Liu, Y. Incorporating spatial interaction patterns in classifying and understanding urban land use. Int. J. Geogr. Inf. Sci. 2015, 30, 334–350. [Google Scholar] [CrossRef]
  14. Liu, X.; He, J.; Yao, Y.; Zhang, J.; Liang, H.; Wang, H.; Hong, Y. Classifying urban land use by integrating remote sensing and social media data. Int. J. Geogr. Inf. Sci. 2017, 31, 1675–1696. [Google Scholar] [CrossRef]
  15. Jokar Arsanjani, J.; Helbich, M.; Bakillah, M.; Hagenauer, J.; Zipf, A. Toward mapping land-use patterns from volunteered geographic information. Int. J. Geogr. Inf. Sci. 2013, 27, 2264–2278. [Google Scholar] [CrossRef]
  16. Hu, T.; Yang, J.; Li, X.; Gong, P. Mapping Urban Land Use by Using Landsat Images and Open Social Data. Remote Sens. 2016, 8, 151. [Google Scholar] [CrossRef]
  17. Long, Y.; Liu, X. Featured Graphic. How Mixed is Beijing, China? A Visual Exploration of Mixed Land Use. Environ. Plan. A Econ. Space 2013, 45, 2797–2798. [Google Scholar] [CrossRef]
  18. Gómez, C.; White, J.C.; Wulder, M.A. Optical remotely sensed time series data for land cover classification: A review. ISPRS J. Photogramm. Remote Sens. 2016, 116, 55–72. [Google Scholar] [CrossRef] [Green Version]
  19. Cheng, L.; Chen, X.; De Vos, J.; Lai, X.; Witlox, F. Applying a random forest method approach to model travel mode choice behavior. Travel Behav. Soc. 2019, 14, 1–10. [Google Scholar] [CrossRef]
  20. Gislason, P.O.; Benediktsson, J.A.; Sveinsson, J.R. Random Forests for land cover classification. Pattern Recognit. Lett. 2006, 27, 294–300. [Google Scholar] [CrossRef]
  21. Thanh Noi, P.; Kappas, M. Comparison of Random Forest, k-Nearest Neighbor, and Support Vector Machine Classifiers for Land Cover Classification Using Sentinel-2 Imagery. Sensors 2017, 18, 18. [Google Scholar] [CrossRef] [Green Version]
  22. Zhang, C.; Sargent, I.; Pan, X.; Li, H.; Gardiner, A.s; Hare, J.; Atkinson, P.M. Joint Deep Learning for land cover and land use classification. Remote Sens. Environ. 2019, 221, 173–187. [Google Scholar] [CrossRef] [Green Version]
  23. Gašparović, M.; Zrinjski, M.; Gudelj, M. Automatic cost-effective method for land cover classification (ALCC). Comput. Environ. Urban Syst. 2019, 76, 1–10. [Google Scholar] [CrossRef]
Figure 1. District map of Guangzhou, China.
Ijgi 09 00124 g001
Figure 2. Frame for obtaining.
Ijgi 09 00124 g002
Figure 3. Quantities of various categories.
Ijgi 09 00124 g003
Figure 4. The workflow of the method.
Ijgi 09 00124 g004
Figure 5. The random forest (RF) working process.
Ijgi 09 00124 g005
Figure 6. The representation of support vector machine (SVM).
Ijgi 09 00124 g006
Figure 7. The space distributions of four POI categories; (a) represents the hotel distribution; (b) represents the food distribution; (c) represents the entertainment distribution, and (d) represents the residential distribution.
Ijgi 09 00124 g007
Figure 8. The distributions of four POI types in check-in quantity: (a) represents the food; (b) represents the hotel; (c) represents the entertainment; (d) represents the residential.
Ijgi 09 00124 g008
Figure 9. Distribution of check-ins among different time periods: (a) represents the temporal distribution of check-ins on weekdays; (b) represents the temporal distribution of check-ins on weekends; (c) denotes the distribution of check-ins among eight time periods (e.g., weekday 6:00–12:00, weekend 6:00–12:00).
Ijgi 09 00124 g009
Figure 10. The performance under the change of parameter; (a) represents the change in number of trees; (b) represents the variety of quantity of variables.
Ijgi 09 00124 g010
Figure 11. Comparison of five indicators between different models.
Ijgi 09 00124 g011
Figure 12. The confusion matrix of prediction.
Ijgi 09 00124 g012
Table 1. Description of dataset selected from different rules.
POI CategoriesNumber of Points of Interest (POIs)
Proposed RuleNo Further ProcessSame Threshold (5)
Residential3361838585
Entertainment242758274
Hotel247710145
Food2581471189
Table 2. Explanatory variables.
Variable TypeVariable (Code)Meaning
Characteristics of check-ins and users The number of users (V1)The number of users who checked in at the POI
The number of check-ins (V2)The total number of check-in at the POI
User entropy (V3)Heterogeneity of users’ contributions to check-in volume
Temporal features of user check-in behaviorProportion of 6–12 weekday (V4)Proportion of check-ins between 06:01–12:00 in weekday
Proportion of 12–18 weekday (V5)Proportion of check-ins between 12:01–18:00 in weekday
Proportion of 18–24 weekday (V6)Proportion of check-ins between 18:01–24:00 in weekday
Proportion of 0–6 weekday (V7)Proportion of check-ins between 00:01–06:00 in weekday
Weekday check-in entropy (V8)Heterogeneity of periods’ contributions to check-in volume in weekday
Proportion of 6–12 weekend (V9)Proportion of check-ins between 06:01–12:00 in weekend
Proportion of 12–18 weekend (V10)Proportion of check-ins between 12:01–18:00 in weekend
Proportion of 18–24 weekend (V11)Proportion of check-ins between 18:01–24:00 in weekend
Proportion of 0–6 weekend (V12)Proportion of check-ins between 00:01–06:00 in weekend
Weekend check-in entropy (V13)Heterogeneity of periods’ contributions to check-in volume in weekend
Number of weekday check-in (V14)The number of check-ins generated in weekday
Number of weekend check-in (V15)The number of check-ins generated in weekend
Built environment features of POIDistance to railway station (V16)The distance to the nearest railway station
Distance to park (V17)The distance to the nearest park
Number of bus station in 400 m (V18)The number of bus stations in the 400-m circular buffer
Distance to primary school (V19)The distance to the nearest primary school
Table 3. Variable importance.
CodeRankImportance
V1311.52%
V2212.53%
V3114.97%
V4123.36%
V5113.48%
V6133.35%
V7181.83%
V885.0%
V9172.15%
V10142.74%
V11152.73%
V12191.33%
V13162.6%
V1447.07%
V1594.54%
V1655.68%
V1775.62%
V18103.83%
V1965.65%

