Article

Spatial Relationship between Natural Wetlands Changes and Associated Influencing Factors in Mainland China

1
School of Geography, South China Normal University, Guangzhou 510000, China
2
International Envirotech Limited, Hong Kong 999077, China
*
Author to whom correspondence should be addressed.
ISPRS Int. J. Geo-Inf. 2020, 9(3), 179; https://0-doi-org.brum.beds.ac.uk/10.3390/ijgi9030179
Submission received: 29 January 2020 / Revised: 5 March 2020 / Accepted: 17 March 2020 / Published: 20 March 2020
(This article belongs to the Special Issue Geo-Informatics in Resource Management)

Abstract

:
Many studies have explored the dynamic change of wetlands distribution which play an important role in wetlands conservation and its sustainable management. However, given an uneven distribution of natural wetland resources in the context of global change, little is known about the spatial relationship between natural wetlands changes and associated influencing factors in mainland China. In this study, Moran-based spatial statistics are an effective methodology to examine the spatial patterns of natural wetlands and associated influencing factors at the province level, and GIS mapping is applied to help visualize spatial patterns. Results show that 1) significant spatial agglomeration and regional differences of natural wetlands distribution have been captured by Moran’s I statistics, and the agglomeration level has increased over the past ten years; 2) Seven of the eight factors show significantly strong and positive spatial autocorrelation except for water consumption, and spatial patterns of them show significant spatial clusters or spatial outliers; 3) Spatial coordination between natural wetlands distribution and the associated influencing factors is higher in the western region than in east China and northeast China. Moreover, spatial coordination between a cultivated area or water consumption and natural wetlands distribution is weaker than that of other factors. Finally, the influences generated by neighboring provinces should not be neglected in the implementation of wetlands conservation. This study could provide a scientific basis for the policy making of wetlands conservation and sustainable management systems.

1. Introduction

Wetlands have value owing to their useful functions to humans [1]. They not only provide goods and ecosystem services for humanity but also habitats for flora and fauna [2,3]. With their fragility and sensitivity to climatic change and anthropogenic activities, wetlands are among the most vulnerable ecosystems around the world [4]. With the increasing awareness of the important role wetlands play in wastewater storage and purification, flood regulation, food supply, wildlife habitat, etc., studies of wetlands have received considerable attention in recent years. Moreover, understanding the dynamics of wetlands is significant for the conservation of wetland biodiversity and its sustainable management [5].
Wetlands changes and their causes have been paid more attention by global environmental change research [6,7]. The dynamic change of wetlands directly reflects on the change of wetland area and landscape pattern and indirectly on the wetland structure and functions [8,9]. Most studies indicate that the area of artificial wetlands is increasing, while natural wetlands are decreasing in the form of wetland degradation and loss [10,11,12,13,14,15,16]. China is rich in wetland resources with the total wetland area ranked the fourth largest in the world [17]. Natural wetlands will occupy 87.37% of the overall wetland area by the end of 2013 [18]. However, wetlands in China have been severely destroyed and degraded since 1950 due to climate change and anthropogenic disturbance [16,19,20,21,22], especially natural wetlands, which has sparked considerable attention from scholars. On one hand, many studies analyzed the status and challenges of wetlands in China and put forward some recommendations for wetland protection and management [21,23,24,25,26]. On the other hand, many studies mapped and quantified wetland changes from the perspective of time and space, based on 3S technologies (remote sensing, geography information systems and global positioning systems). Landscape metrics or models at national, regional or local scales can make the long-term monitoring of wetland changes feasible and build a significant foundation for wetland resources protection and management [15,16,20,27,28,29,30,31].
In sum, in the context of global change, wetlands in China have suffered serious degradation and loss. Research into wetland degradation and loss in China mainly focuses on the dynamic changes of wetlands landscape patterns and their driving forces. The prevalent method is to obtain information on dynamic changes on specific wetlands and to carry out quantitative analysis by using 3S technology on the scale of nation, region or case-by-case. These research results clearly describe the dynamic process of wetlands and their causes on a large or a small scale. However, few researches have been conducted to discover the spatial autocorrelation of wetlands distribution and associated influencing factors, or to explore the spatial relationships between them at the province level. In China, policy formulation and implementation of wetlands management are carried out at the province level. Given an uneven distribution of natural wetlands in China, questions such as how targeted wetlands conservation policy should be conducted based on the local conditions and which influencing factors should be paid great attention by provincial governments remain to be resolved. However, the study of the spatial relationship between natural wetlands distribution and associated influencing factors can discover the spatial uncoordinated provinces and influencing factors that can inform the provincial government of decision-making of targeted and effective wetlands conservation. Therefore, this study explored the spatial pattern of natural wetlands dynamics and the associated influencing factors based on data of the natural wetlands area in 31 provinces, by applying Moran’s I statistics. Plus, the spatial relationship between them was further examined. The objectives of this paper are to: a) explore the spatial pattern and spatial law of natural wetlands distribution; b) explore the spatial patterns of associated influencing factors and the difference in impacts of these factors on natural wetlands dynamics; and c) explore the spatial relationship between natural wetlands changes and associated influencing factors and to identify the uncoordinated provinces.

2. Methods and Data

2.1. Study Area

China’s wetland is the fourth largest in area in the world. There are 26 types of natural wetlands and 9 types of artificial wetlands in China according to the delineation in the Ramsar Convention [23]. Furthermore, some Chinese researchers put forward their own wetland classification for different case areas [6,15,20,25,29]. According to national wetland resources survey reports, 5 types are included in China’s wetlands, covering lake wetlands, riverine wetlands, coastal wetlands, inland marshes/swamp and artificial wetlands, all of which are natural wetlands except for the artificial wetland [18]. Natural wetlands have dominated the overall areas of China’s wetlands with a rate of 3.8% of China’s terrestrial area. The wetlands in China are unevenly distributed among seven regions, including the Northeast China wetland region, the Xinjiang-Inner Mongolia wetland region, the Qinghai-Tibet Plateau wetland region, the Yunnan-Guizhou Plateau wetland region, the Yellow River Mid-down Stream wetland region, the Yangtze River Mid-down Stream wetland region, and the Southeast-South China wetland region [24].
The Chinese government has conducted two national surveys of wetland resources in 1998–2003 and 2009–2013 to understand the status of wetland resources, familiarize themselves with wetland dynamics and strengthen wetland protection policies. While the statistical calibers of wetland resources in the two surveys were different from the area of an independent patch, over 100 ha were included in the first survey and over 8 ha were included in the second survey. According to the two national wetland resources survey reports, the total area of wetlands is 38.49 × 10 6 ha in the first survey and 53.42 × 10 6 ha in the second survey [18]. Compared with the first survey, based on the same statistical caliber, wetlands in the second survey have decreased by 3.40 × 10 6 ha with a loss rate of 8.82%. Among them, natural wetlands have decreased by 3.38 × 10 6 ha with a loss rate of 9.33% [18]. It is very clear that natural wetlands still suffered a great loss and degradation from 2003 to 2013.

2.2. Data Source and Data Processing

According to the two national wetland resources survey reports which were published in 2004 and 2014, the areas of natural wetlands for 31 provinces in mainland China during two periods are obtained. To eliminate the influence of different statistical calibers on data, the area occupation rate (AOR) for each province between the area of different data sources and the total area of similar data sources is adopted to explore the characteristics of the spatial distribution of natural wetlands. The raw data are subjected to statistical and spatial analysis. Then the AOR of natural wetlands is chosen to describe the dynamic change of natural wetlands. The corresponding calculation formula is as follows:
A O R i j = S i j S j ,
where A O R i j is the area occupation rate in province i in the year j; s i j is a natural wetlands area in province i in the year j; s j is the total area of natural wetlands in the year j; and j represents the time at the end of 2003 and 2013 respectively.

2.3. Moran-Based Spatial Autocorrelation Statistics

Tobler’s first law of geography pointed out that everything is related to everything else but near things are more related than distant things [32]. Spatial autocorrelation exists when significant similarity or dissimilarity formed between a value observed at a location and its neighboring locations. Although global spatial autocorrelation describes the global characteristics of the variables over the study area, these measures of global spatial association often hide the interesting local patterns in variables. Generally, these local patterns exist in the form of small spatial clusters or outliers [33]. Thus, local identifications of spatial association (LISA) was suggested to complete the global analysis through the detection of the existence and location with a spatial affinity at the local scale. LISA has been widely applied in the fields of economy, environment, geochemistry, epidemiology, etc. and has been proved be an effective exploratory spatial data analysis approach [34,35,36]. Generally, global Moran’s I is commonly used to examine the spatial autocorrelation of objects under study and local Moran’s I is employed to examine spatial clustering of the objects with high and low value. Formally, global and local Moran’s I are expressed as Equation (1) and Equation (2), respectively [37]:
I = n i = 1 n j = 1 n w i j ( x i x ¯ ) ( x j x ¯ ) / { ( i = 1 n j = 1 n w i j ) i = 1 n ( x i x ¯ ) 2 }
I i = x i x ¯ i ( x i x ¯ ) 2 j w i j ( x j x ¯ ) ,
where n is the number of observations; x i is the value of the variable x at location i and x j is the value of the variable x at all other locations (where ij); x ¯ is the average value of x with the observation number of n; w i j is the weight between locations i and j; w i j is a weight which can be defined as the contiguity between location i and j. A first-order queen contiguity is adopted to calculate the weight w i j . Locations with common edges to the targeted location i are given the same weight, while those without common edges are given the weight of 0. The statistical significance of spatial clusters is tested through the comparison of reference distributions which are generated by the replicated statistic 9999 times [34]. The range of Moran’s I value is [−1,1]. A positive or negative I-value implies the existence of positive or negative spatial autocorrelation over the study area respectively. However, when the I-value is 0, it implies spatial randomness.
LISA is a decomposition of the global statistics of spatial association. It has four types of spatial association: high (low) values associated with high (low) neighboring values, high (low) values associated with low (high) neighboring values. High-high (Low-low) association with a high positive Moran’s I value implies a spatial clustering of similarly high (low) values under study which are generally above (below) the mean. On the contrary, the High-low (Low-high) association is given a high negative Moran’s I value with the value of the object above (below) the mean and the values of its neighbors below (above) the mean. It implies the examples of spatial outliers which are obviously different from the value of their neighbors [36]. In other words, it is a clustering of dissimilar values [37]. Additionally, significant High-low and Low-high associations are regarded as unstable spatial patterns. Moreover, significant High-high spatial clusters are regarded as “regional hotspots” and Low-low clusters are “cool spots” [35].

2.4. Data Treatment with Computer Software

All the data were treated using different software packages. The descriptive statistical parameters were calculated with Microsoft Excel® and SPSS® (version 23.0). Spatial autocorrelation calculations were performed using the software GeoDa (version 1.12, Spatial Analysis Laboratory, 2019); GeoDa: An introduction to spatial data analyses: website https://geodacenter.github.io/ (Last accessed: June 2019). Maps were produced with the GIS software ArcMap® (version 10.5).

3. Results and Discussion

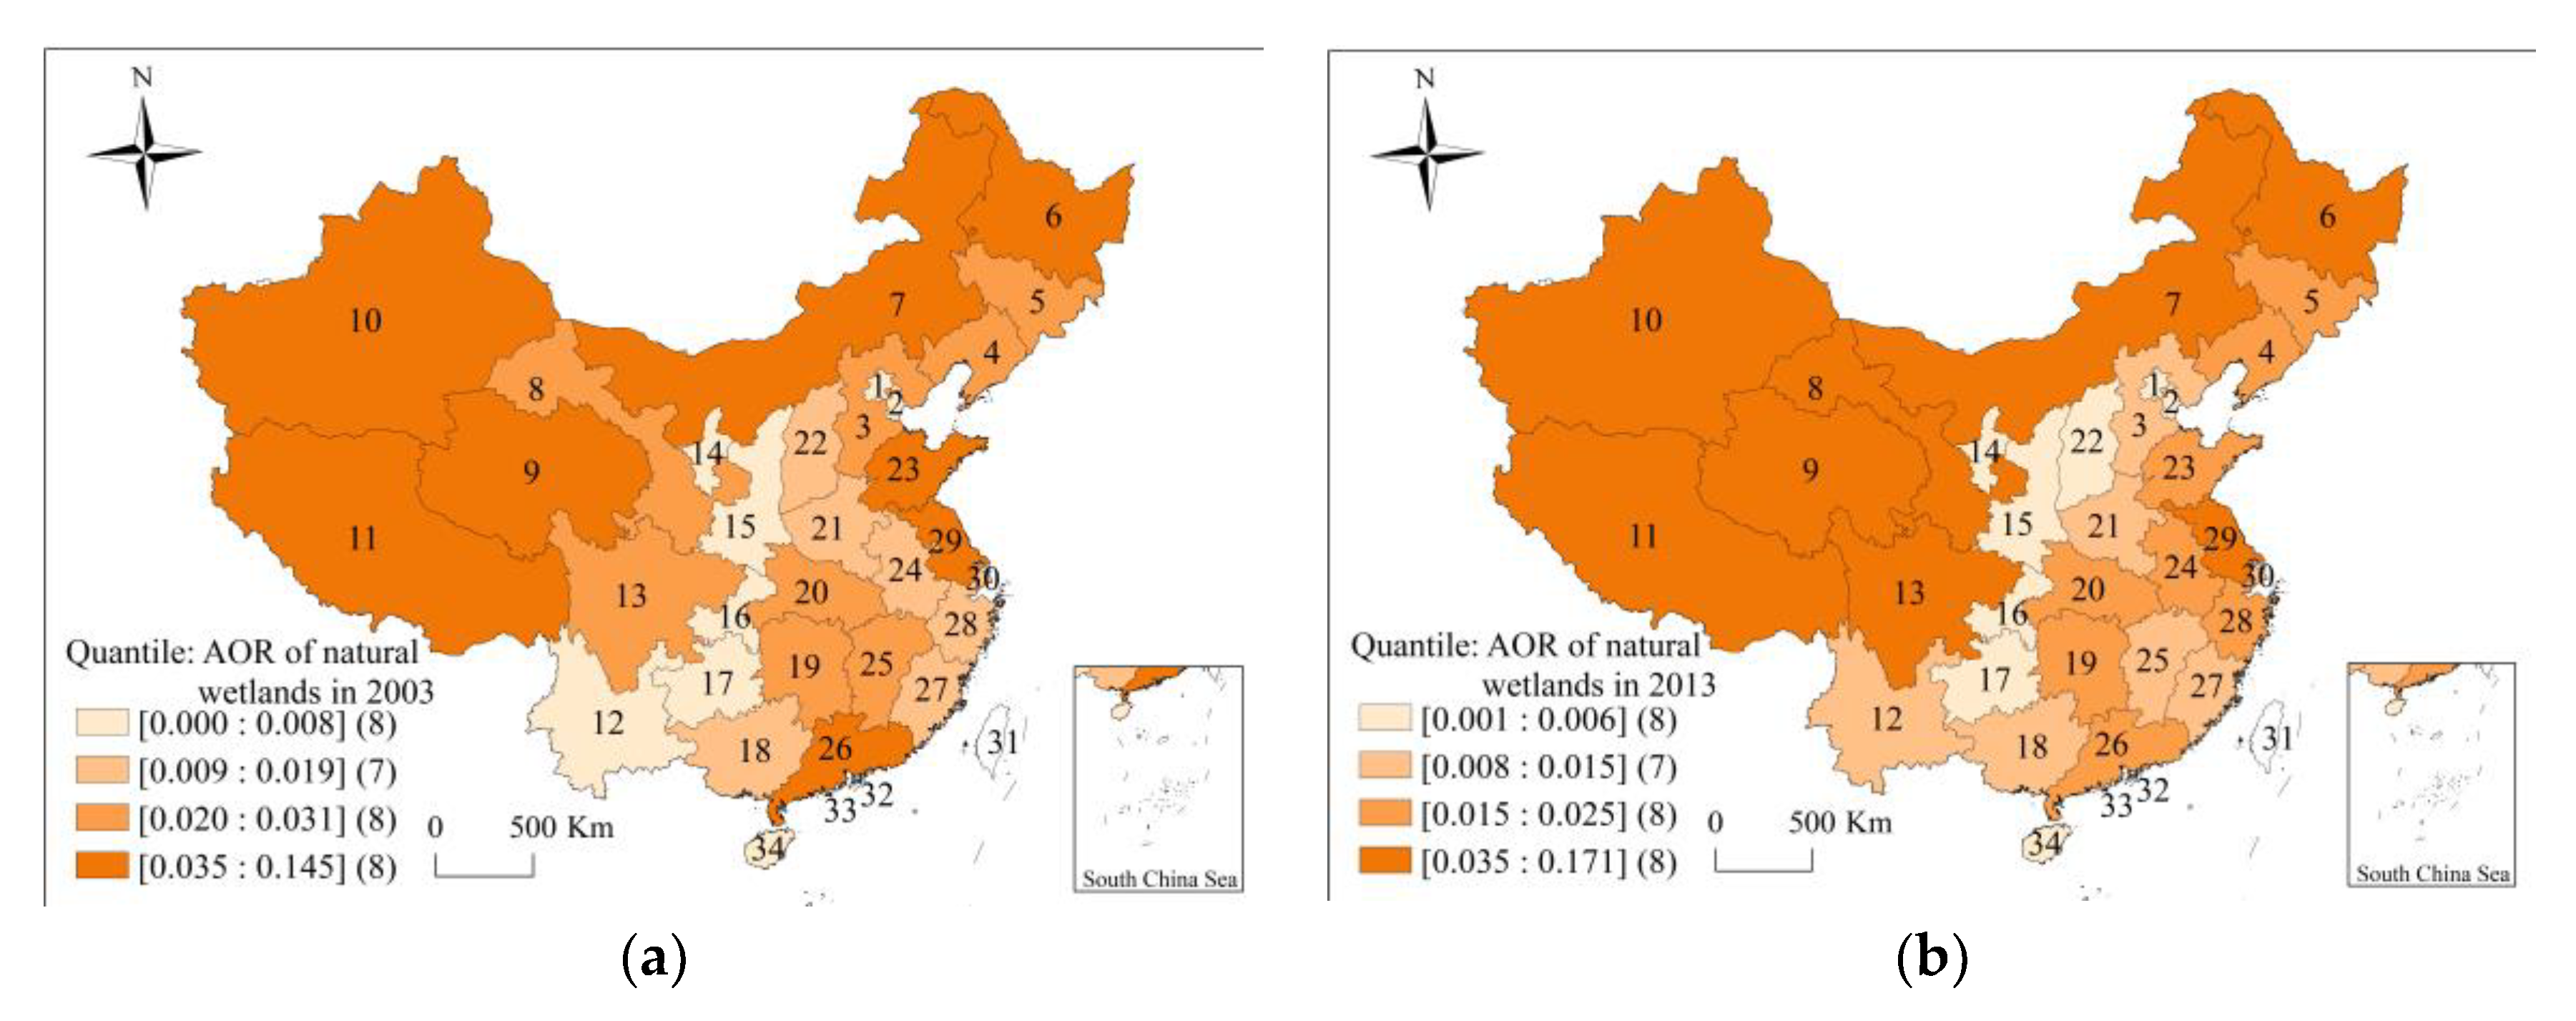
3.1. Statistical Characteristic of Natural Wetlands Area

Table 1 summarizes the descriptive statistics for AOR of natural wetlands of 31 provinces in 2003 and 2013. It is clear that all the statistics values in 2013 have increased compared with those values in 2003, except the mean and the median. AOR of natural wetlands displayed strong variability in 31 provinces in 2003 and 2013, ranging from 0.0001 to 0.1445 and from 0.0005 to 0.1714, respectively. On the other hand, the medians are much lower than the means and the mean value in 2013 was more than twice its median value, indicating a more positively skewed distribution of natural wetlands than that in 2003, which is following the skewness values and suggests the existence of some high values, namely the outliers [38].

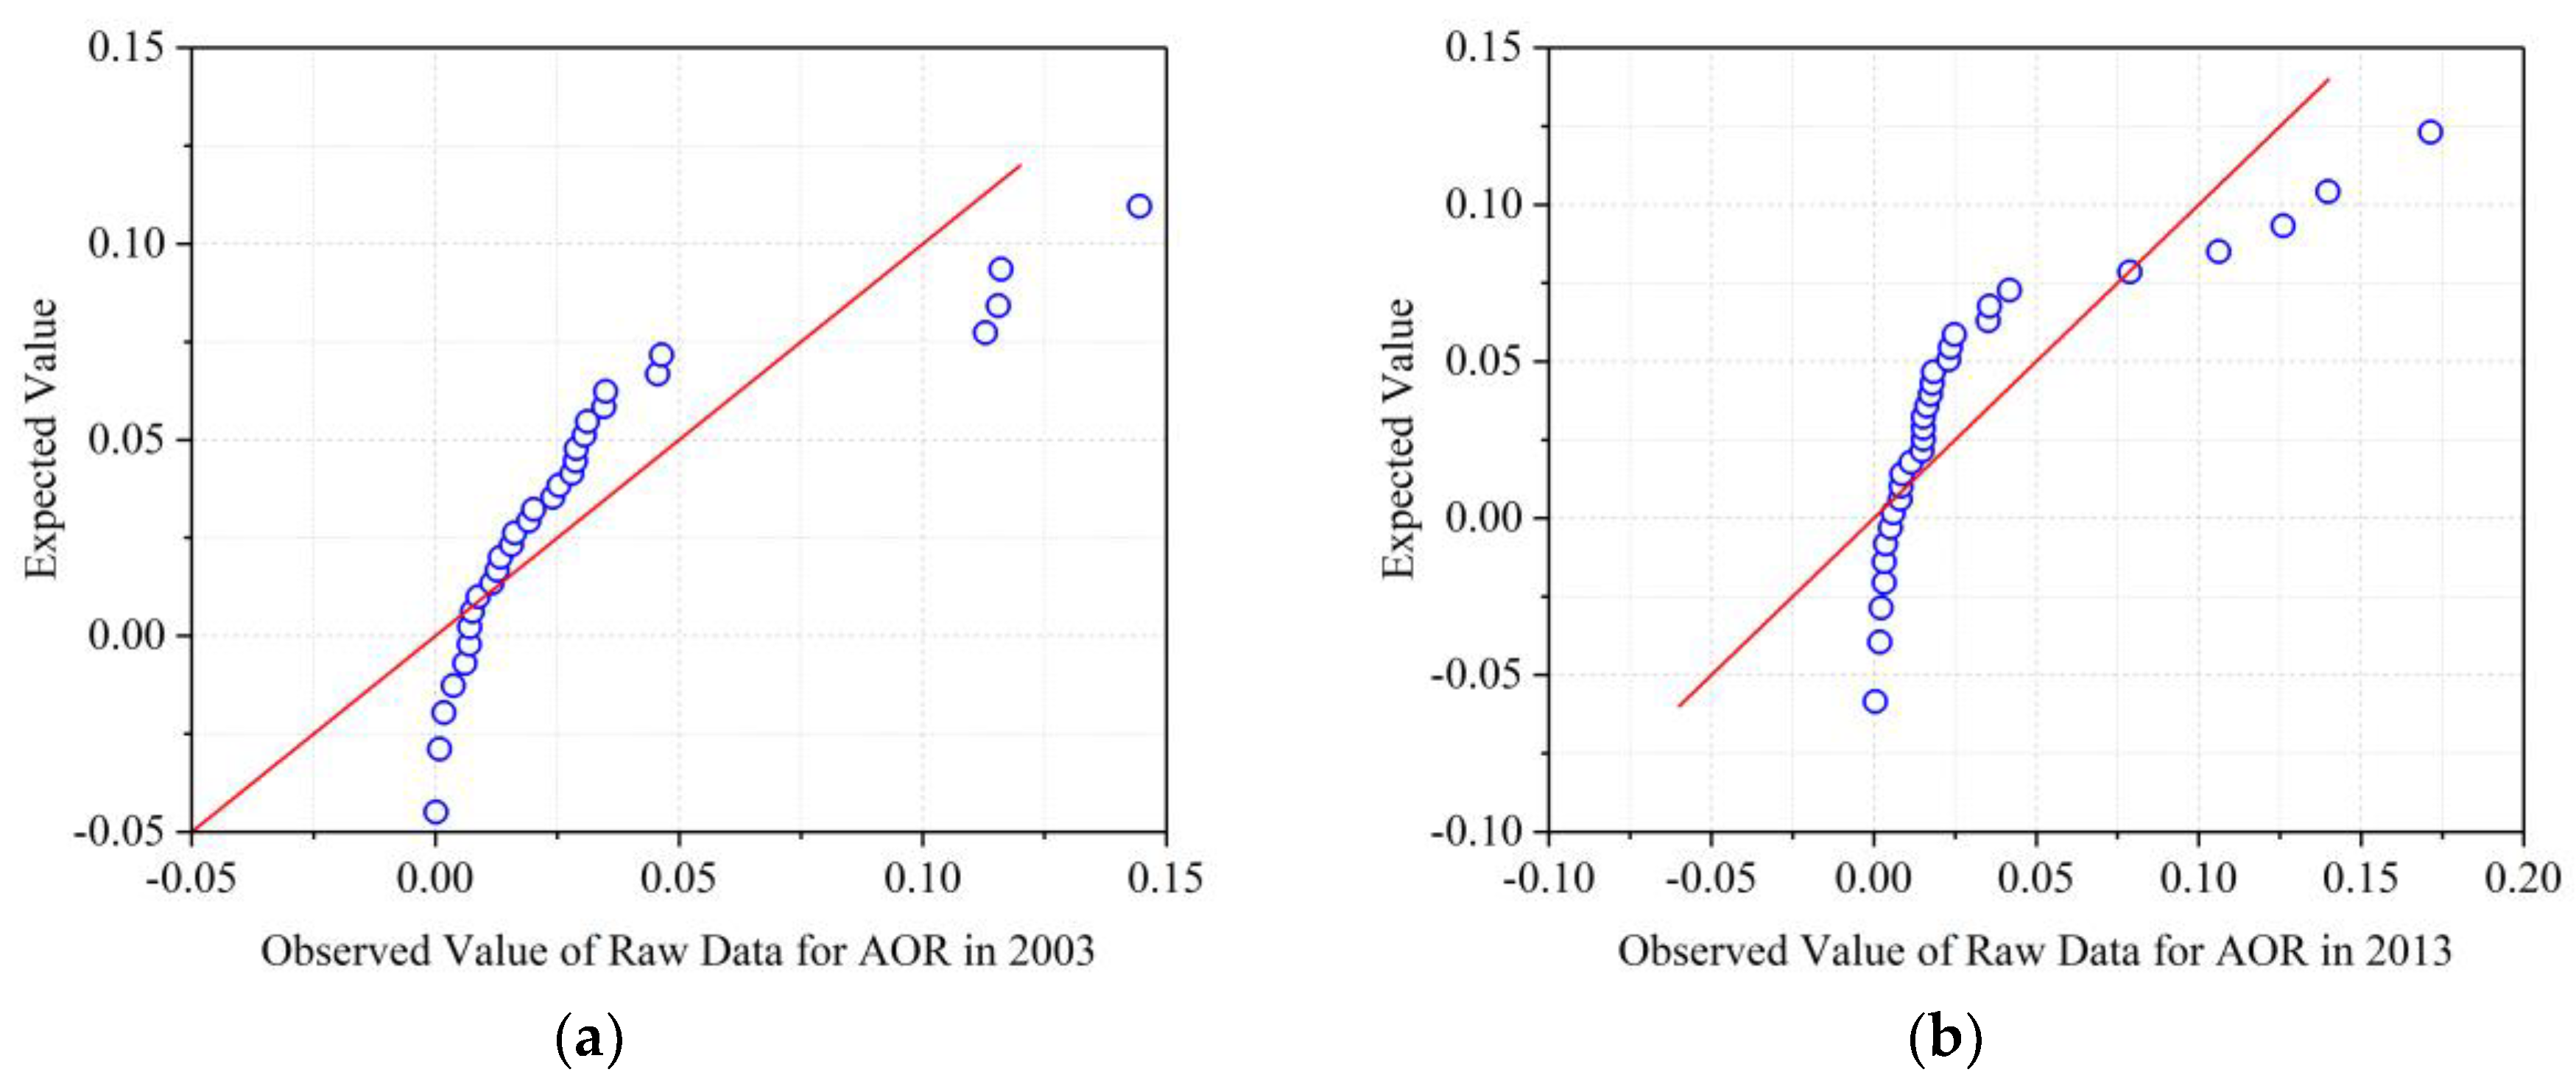
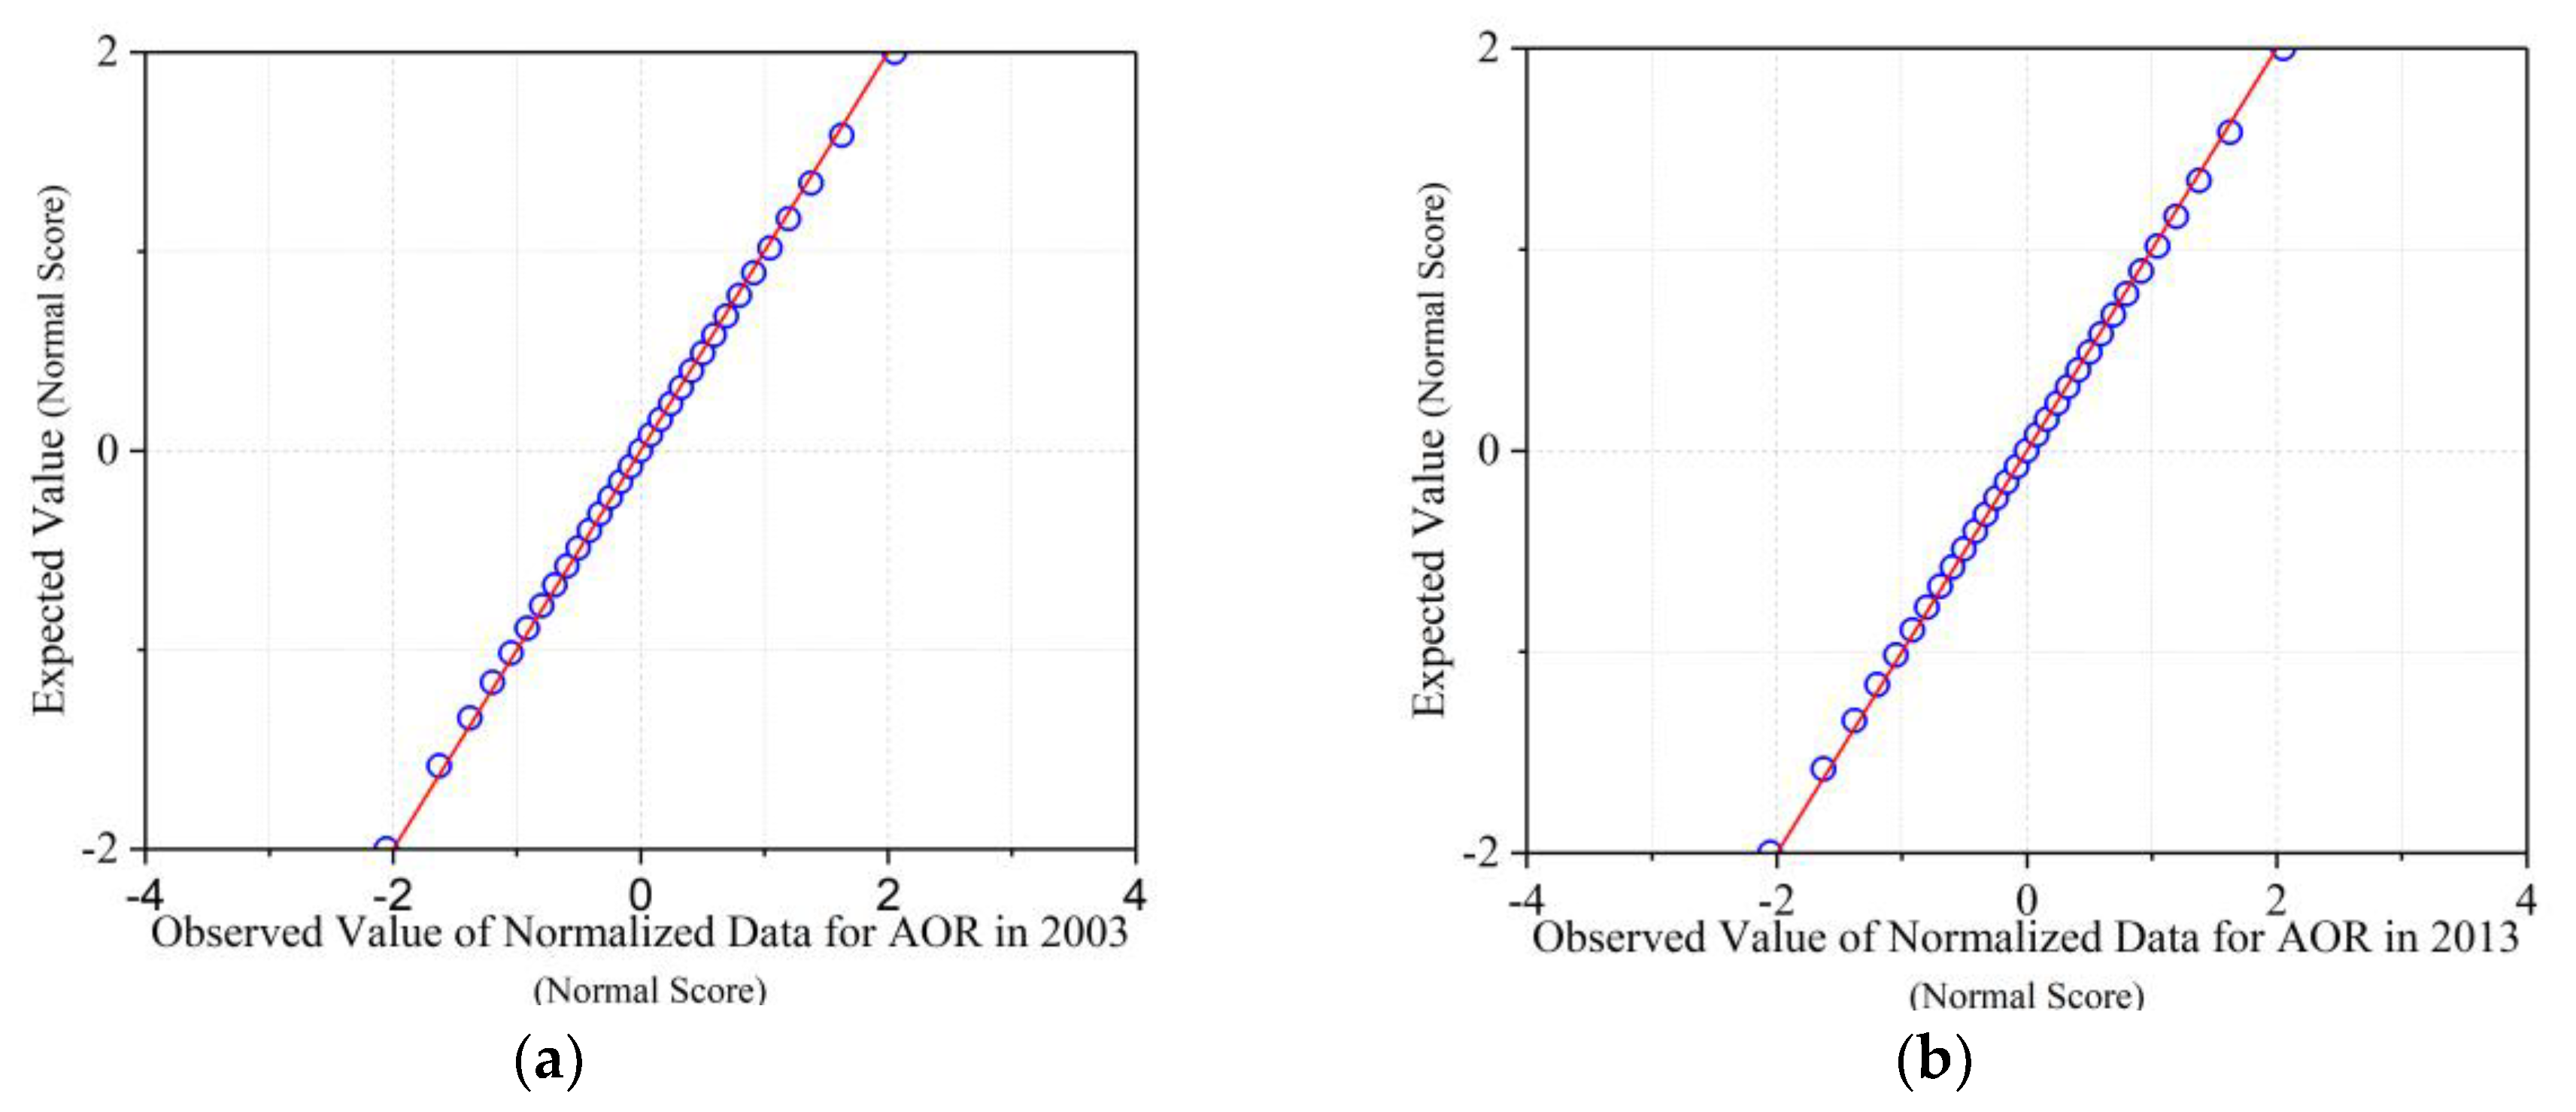
3.2. Data Transformation

In this study, AOR data is used to explore the spatial pattern of natural wetlands distribution changes. Normal Q-Q plots for raw data of AOR are displayed in Figure 1. These graphs plot the accumulative distribution function of the raw data against the empirical accumulative distribution frequency of Gaussian data sets [38]. Normal Q-Q plots show that the AOR does not follow a normal distribution, and these distributions were positively skewed. Besides, there were likely some outliers in the datasets. Therefore, normal score transformation was applied to normalize the data, as well as to weaken the negative effects of potential outliers. Q-Q plots for the normalized data are shown in Figure 2. It indicates that data transformation is helpful to further the distribution to approximate a Gaussian distribution.

3.3. Spatial Autocorrelation of Natural Wetlands Distribution

The choropleths spatial distribution of AOR of natural wetlands from 2003 to 2013 are illustrated in the quartile maps in Figure 3, with the darkest shade corresponding to the highest quartile. The suggestion of spatial clustering of similar values that follows from a visual inspection of these maps is confirmed by the significant and positive Moran’s I values in Table 2, which imply the existence of positive spatial autocorrelation of natural wetlands distribution. The I-value in 2013 is bigger than that in 2003, which implies the spatial association of natural wetlands distribution tends to be more remarkable over the past decade.

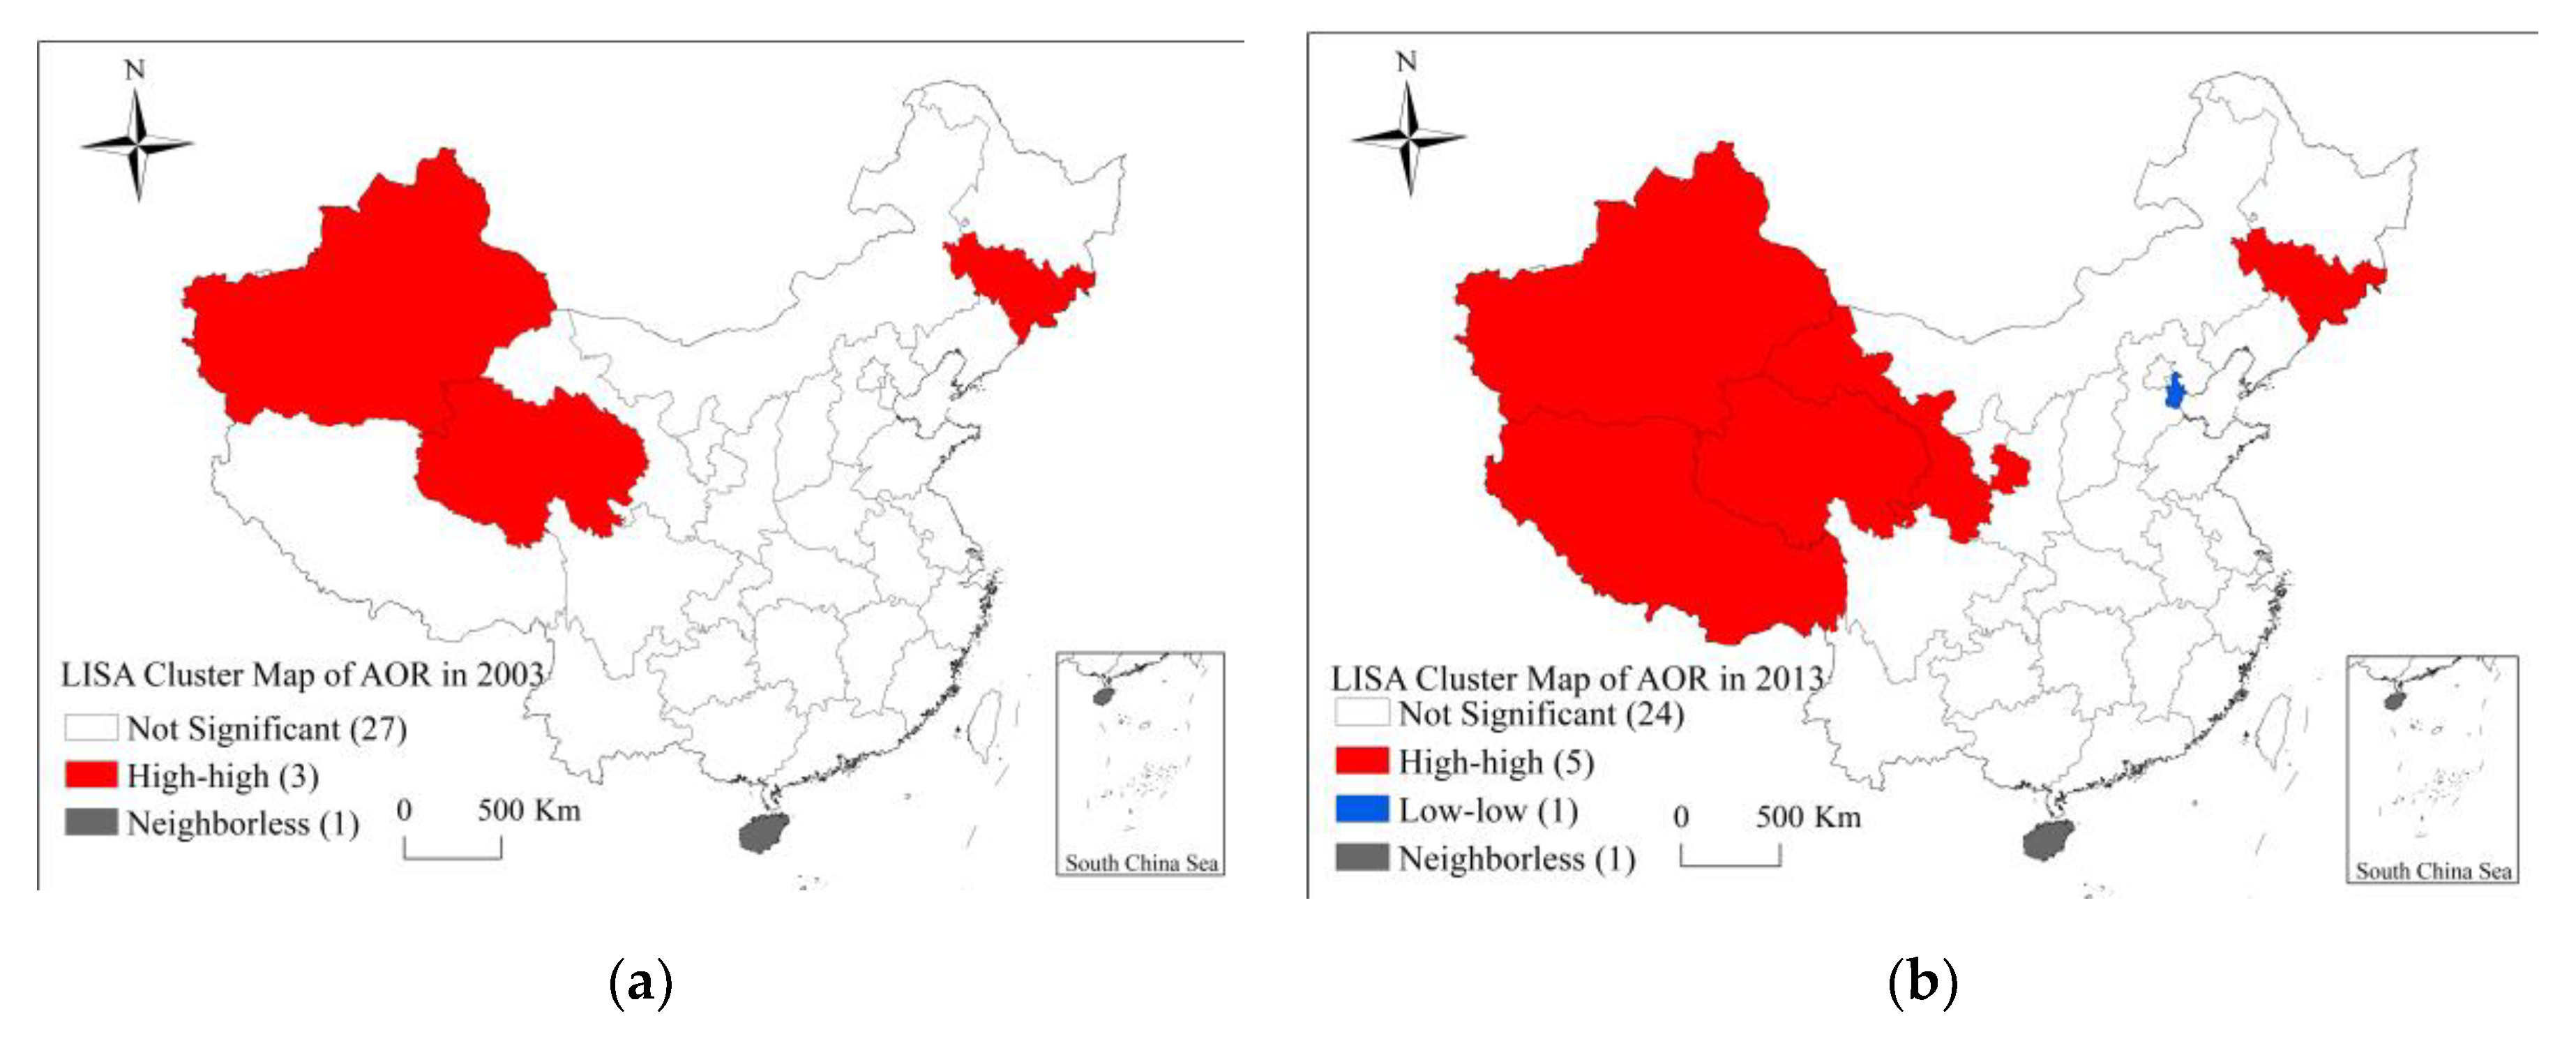
3.4. Spatial Pattern of Natural Wetlands Distribution Based on LISA

In Figure 4, provinces with significant local Moran statistics for the AOR of natural wetlands distribution in 2003 and 2013 are mapped. LISA cluster map highlighted provinces are significantly clustered, which could strongly control the spatial association of natural wetlands distribution. First, LISA cluster maps in 2003 and 2013 suggest that the overall spatial pattern of natural wetlands distribution is stable. The LISA maps highlight one high-high cluster in the west of China and one isolated high value persisting in Jilin within the northeast of China. The region hotspots of natural wetlands distribution are mainly formed by Xinjiang, Qinghai, Gansu, and Tibet. Meanwhile, only one province (Tianjin) is significant for a low value. Although the overall aggregated pattern of natural wetlands distribution is stable, the scope of local hotspots has expanded significantly, with a trend of expanding southward to Tibet and northward to Gansu.
To sum up, the expansion of hotspots and the development of cool spots inform that the spatial association and spatial heterogeneity of natural wetlands distribution tend to be stronger. In addition, natural wetlands distribution in many provinces are still nonsignificant, which means that spatial aggregation of natural wetlands resources mainly occurred in the Xinjiang-Inner Mongolia wetland region, the Qinghai-Tibet Plateau wetland region and the Northeast China wetland region at the local scale, which has a strong influence on the spatial association of natural wetlands distribution in China. Therefore, the development of hotspots and cool spots indicates the existence of spatial dependence and spatial heterogeneity for the natural wetlands distribution, and the spatial spillover effects of these identified significant spatial clusters should be paid great attention when making the policies of wetlands conservation and management in China.

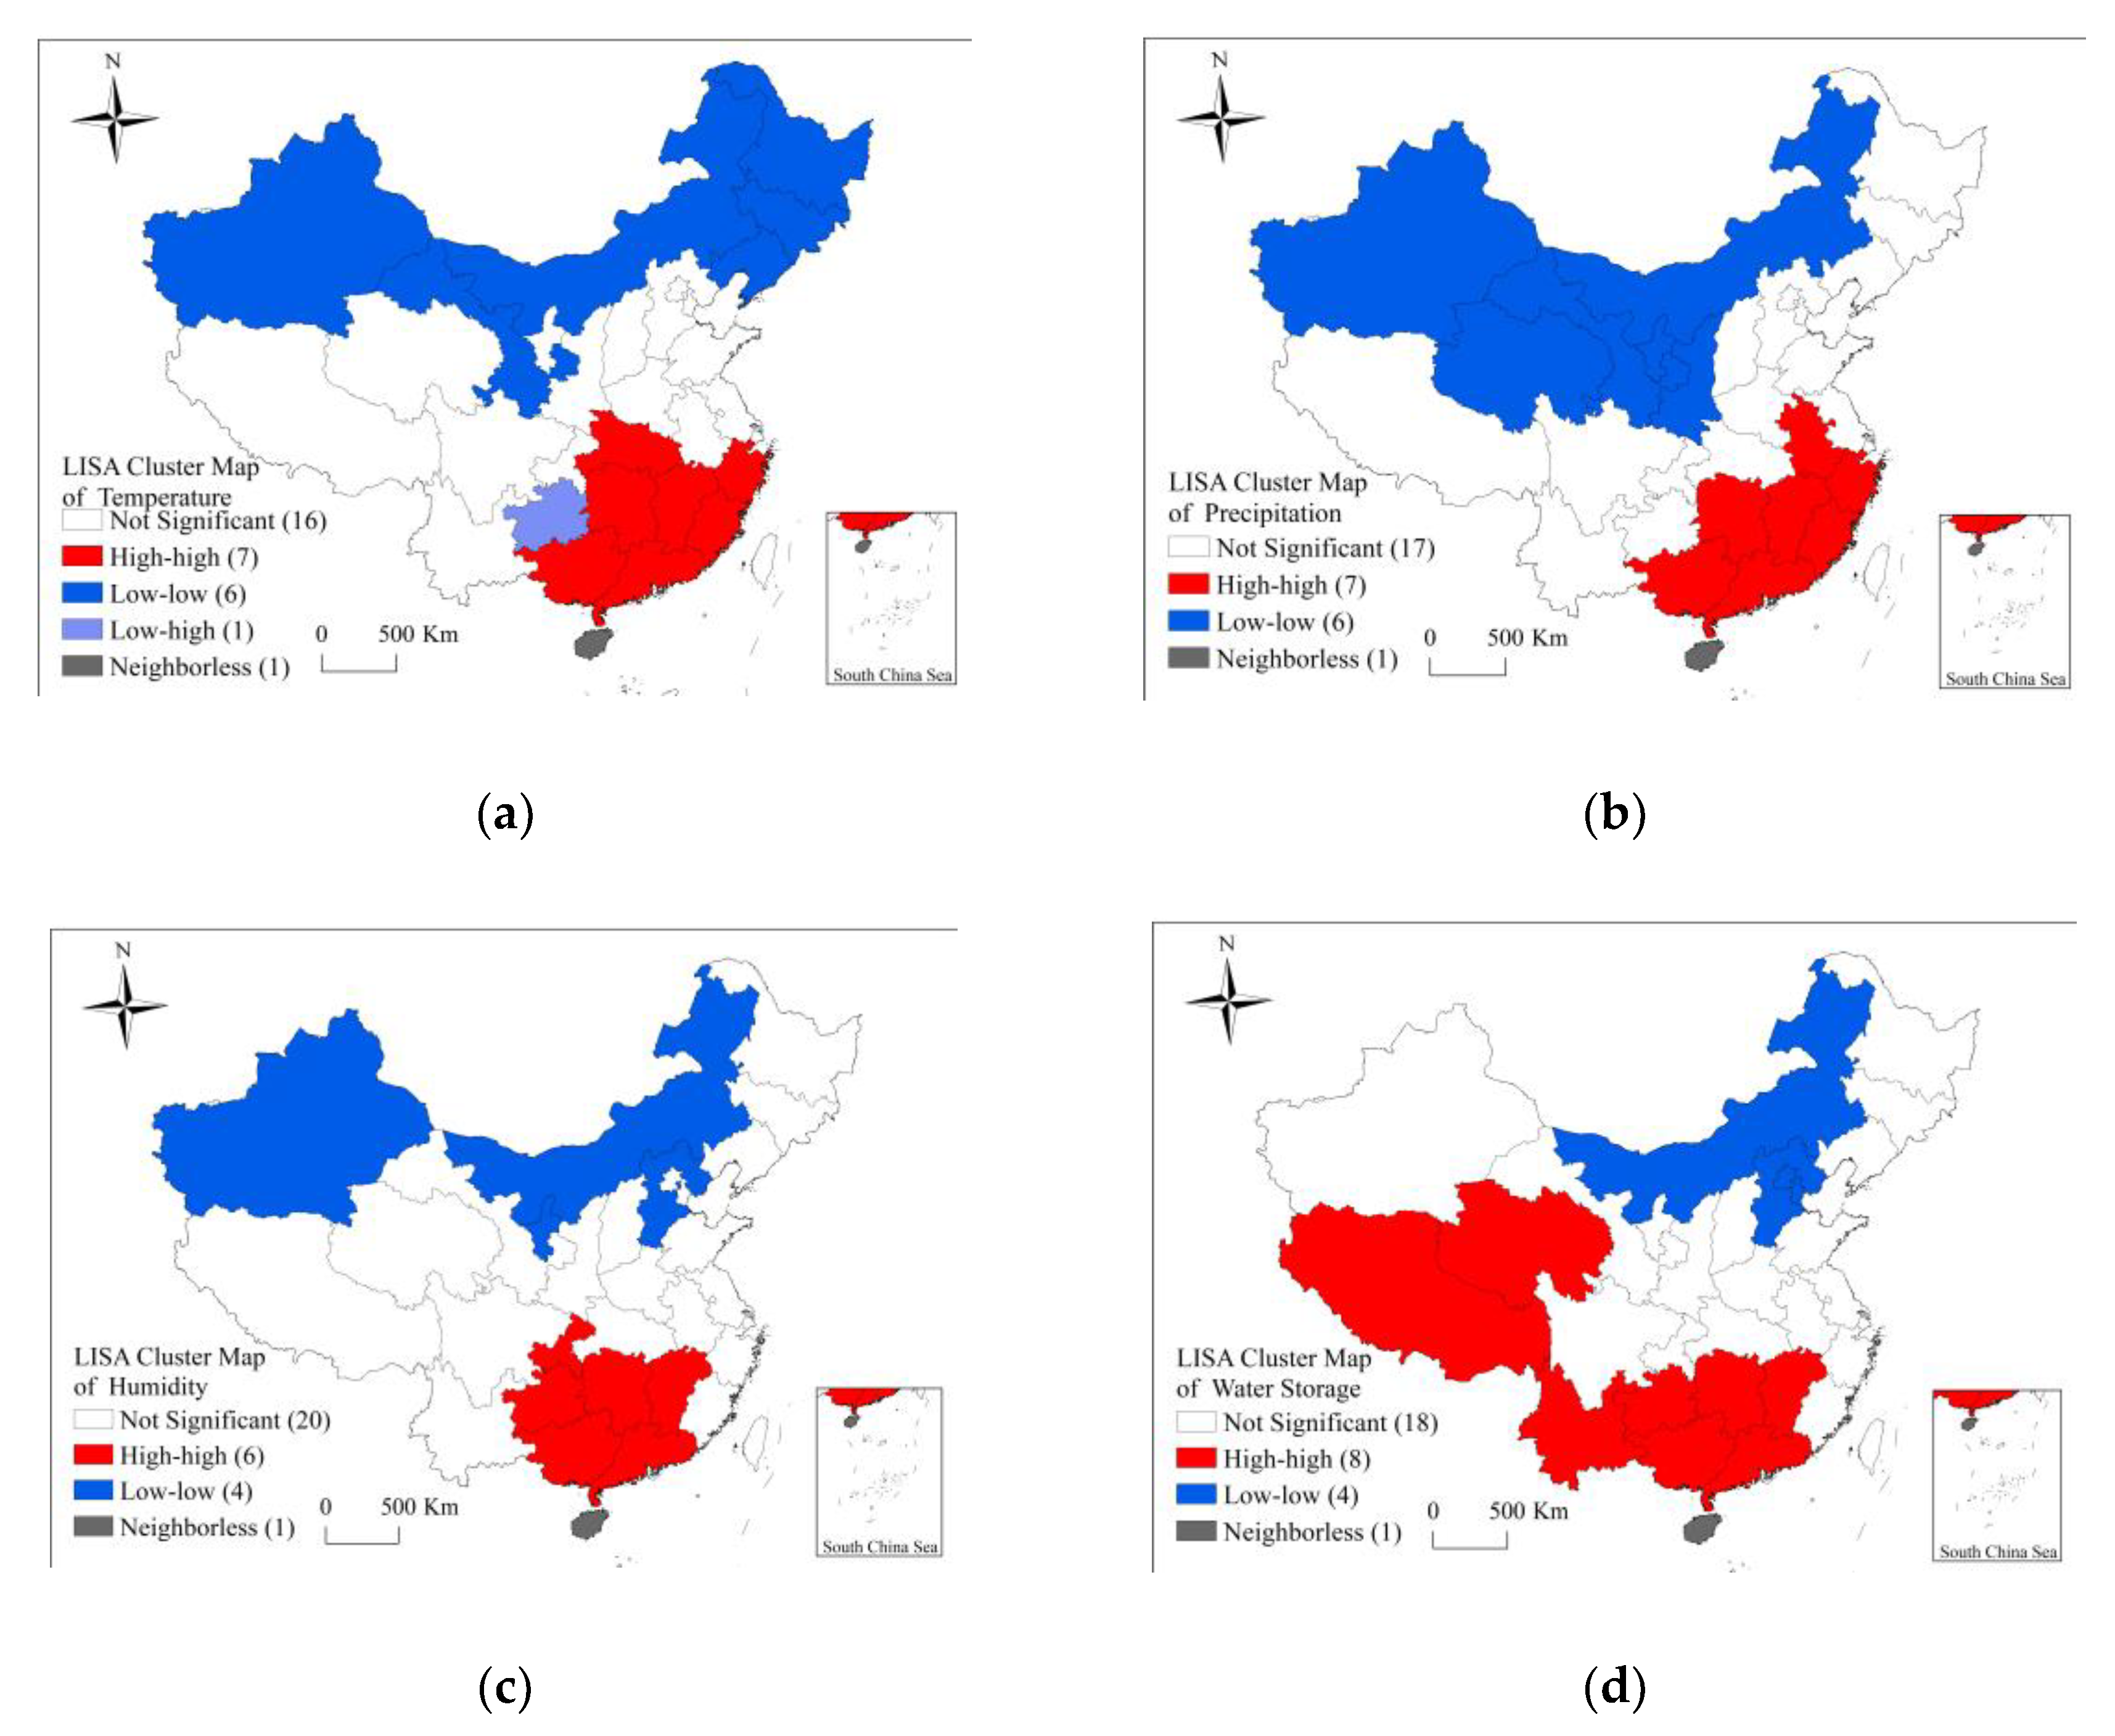
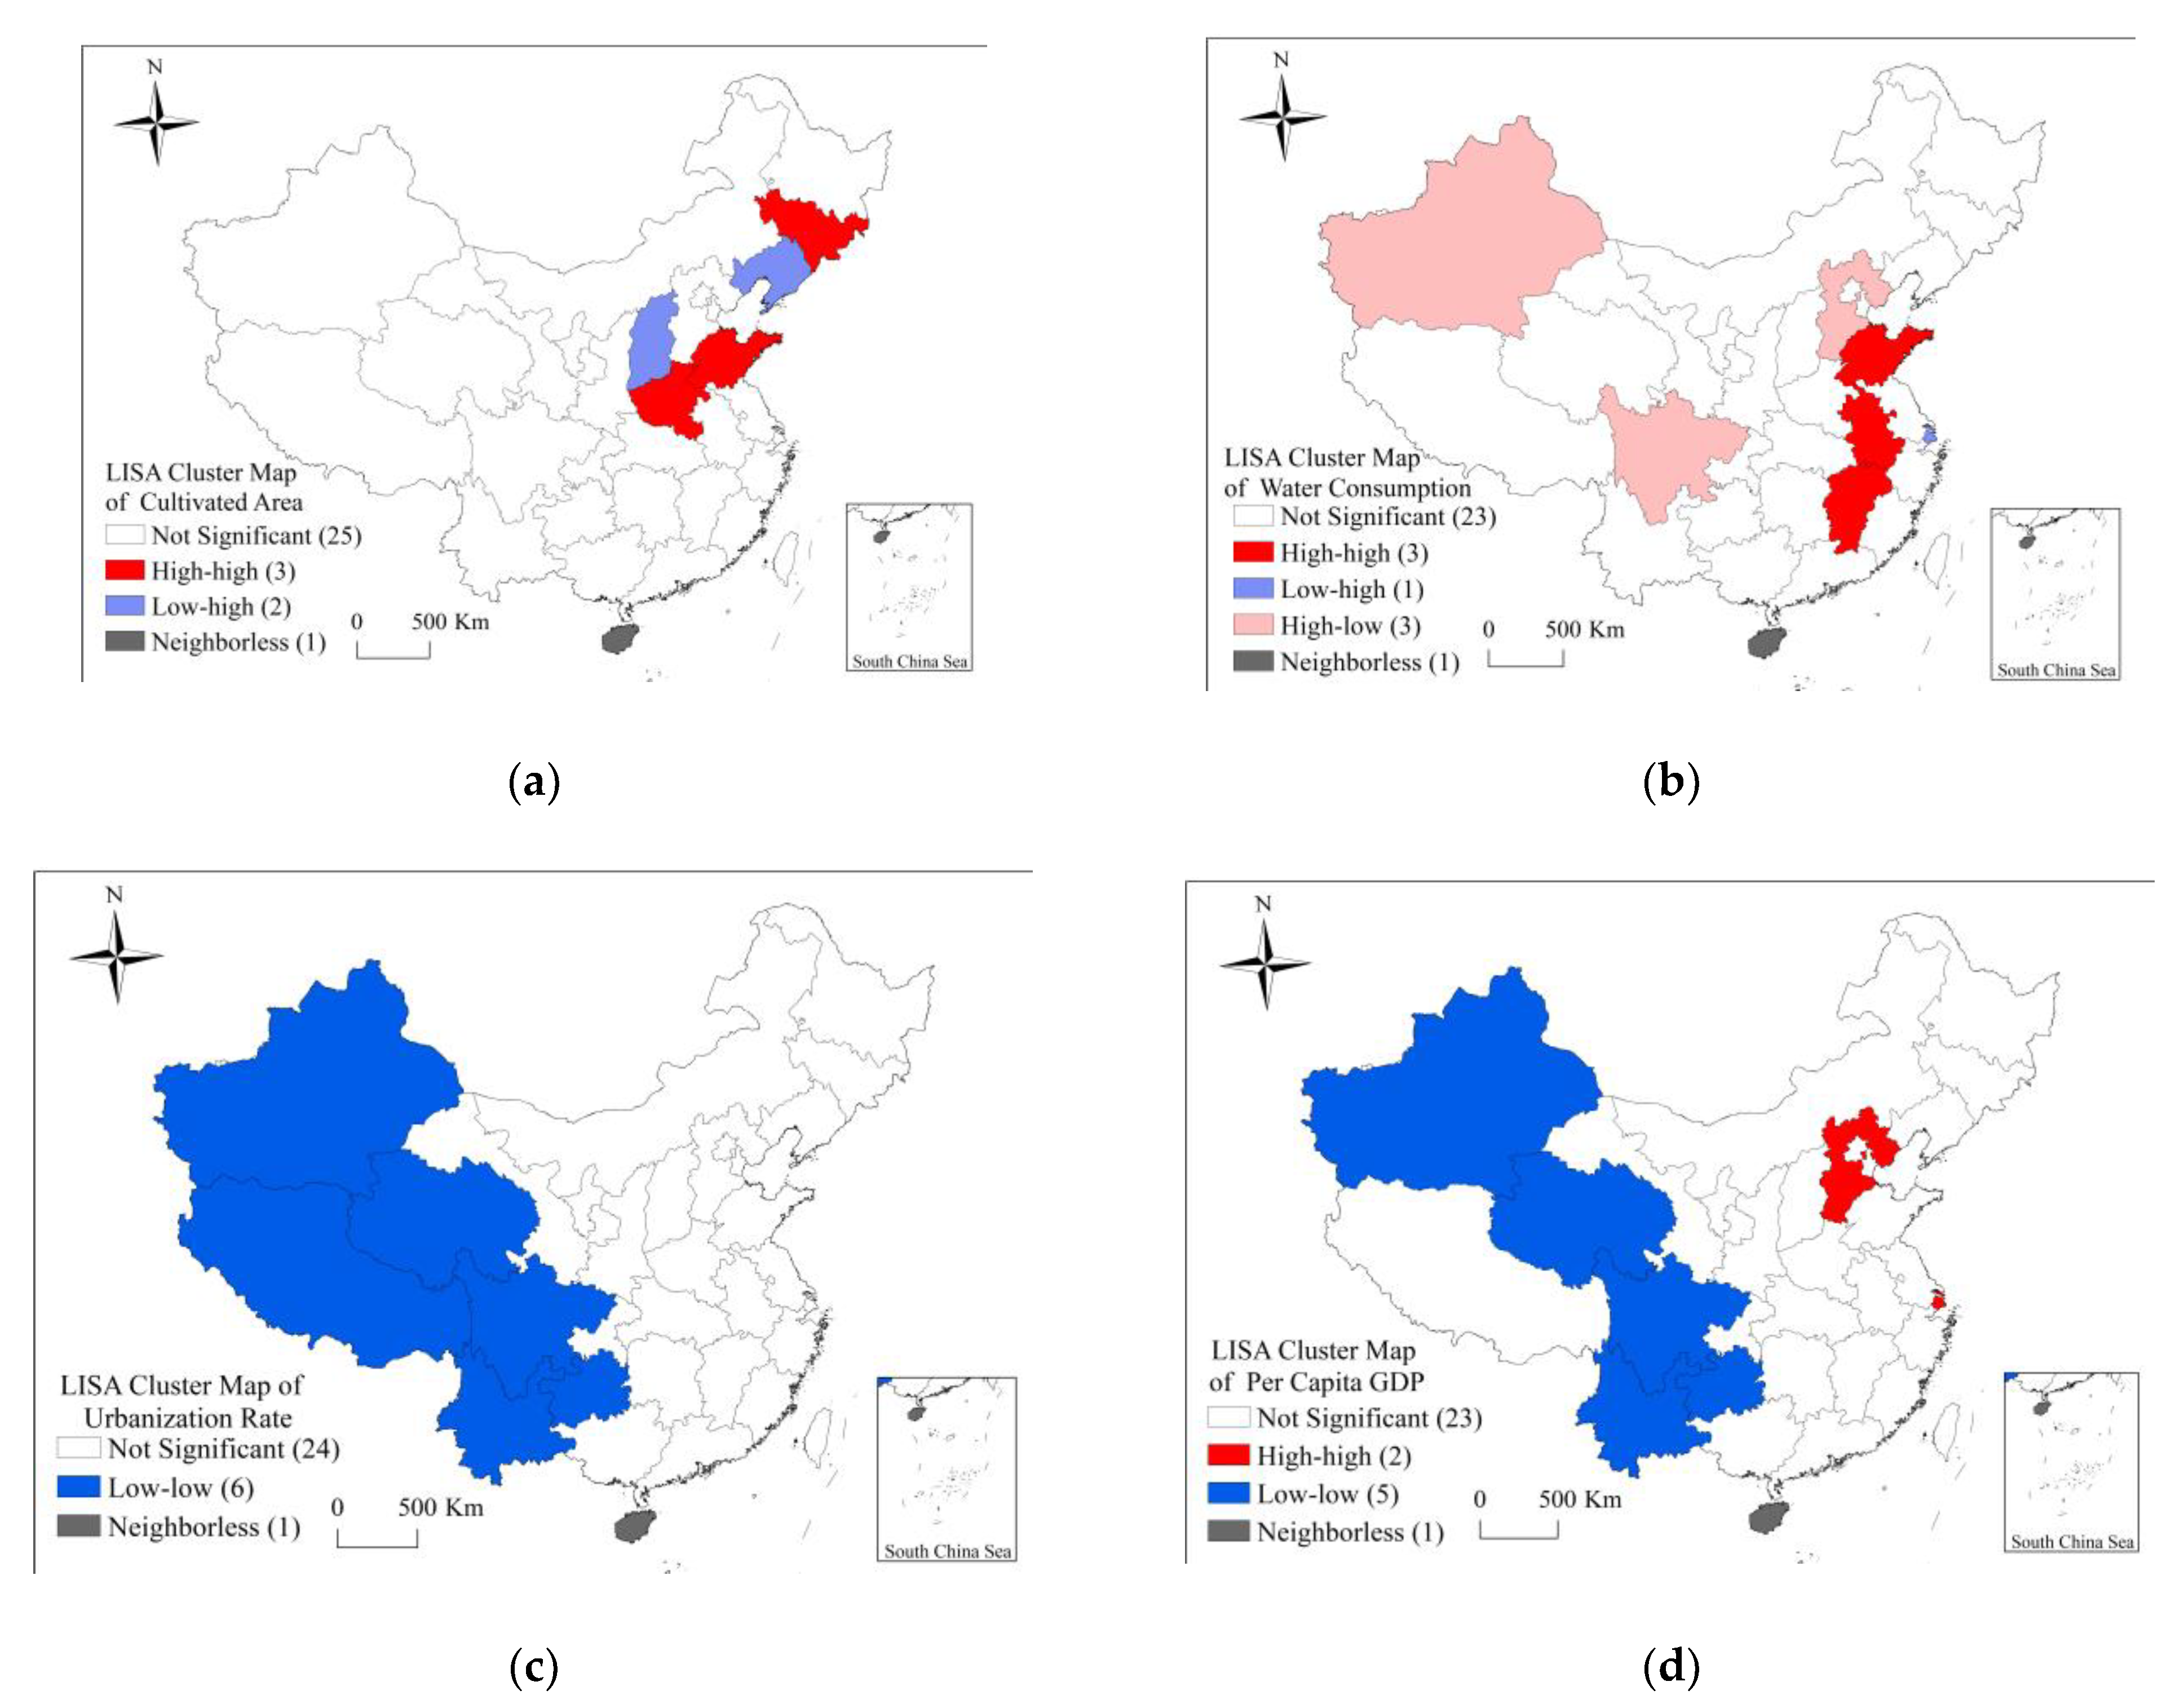
3.5. Spatial Pattern of the Associated Influencing Factors Based on LISA

Spatial distribution and dynamics of natural wetlands are a response to natural and anthropogenic factors. Guo et al. pointed out that natural factors provided the intrinsic drivers for the change of wetlands and human activities intensified the changes, resulting in great wetlands loss and degradation [39]. The formation, development, and evolution of natural wetlands depend on the natural geography and climate, which leads to unevenly distributed spatial patterns. On the other hand, the change of natural wetlands is partly caused by the influence of human activities. Thus, it is worth exploring what spatial pattern of the associated natural and anthropogenic factors will present when they respond to the spatial association of natural wetlands distribution. Here four factors are chosen as a representative of natural factors, including temperature, precipitation, humidity and water storage. The other four factors are chosen as representative of anthropogenic factors, including cultivated area, water consumption, per capita GDP and urbanization rate. Generally, increasing temperature and intensifying anthropogenic factors will result in the degradation of wetlands, even the loss of wetlands. However, the increase in precipitation and humidity will be beneficial to the maintenance of wetlands. Data of these indexes are collected from the China Statistical Yearbooks from 2004 to 2014 and the mean values are calculated.
In order to explore the spatial association of the influencing factors and to reveal the response spatial relationship between the change of natural wetlands distribution and the associated influencing factors, global and local Moran’s I statistics were carried out. Results of the global Moran’s I-values and their associated z-values and p-values are listed in Table 3. Seven of the eight factors show significant strong and positive spatial autocorrelation except for water consumption, and with temperature and precipitation and water storage, extremely significant positive autocorrelation. In addition, the spatial association of natural factors was stronger than anthropogenic factors. To further examine the spatial clustering of natural wetlands distribution at the local scale, the local Moran’s I index of the eight influencing factors is calculated and the results are highlighted through LISA cluster maps in Figure 5 and Figure 6.
Note that LISA maps highlight the existence of a strong local spatial clustering for the associated influencing factors in Figure 5 and Figure 6. For the associated natural factors, significant hotspots and cool spots are mainly distributed in the south and north of China, respectively. Only one outlier is identified in the local spatial association of temperature with a low value of temperature in southwest China. Others are highly spatially homogeneous, whereas spatial patterns of the associated anthropogenic factors are not so homogeneous as those of natural factors. As pointed out above, water consumption exhibits no significant global spatial autocorrelation but shows one spatial cluster and three outliers at the local scale. The regional hotspots are clustering in part of east China, including Shandong, Anhui, and Jiangxi, and the other three outliers with randomness distribution are regarded as an isolated individual hotspot. Spatial patterns of other factors are delineated as follows: the cultivated area shows one regional hotspot, including Henan and Shandong, one isolated hotspot in Jilin, and two outliers in Shanxi and Liaoning (Figure 6a). Both urbanization and per capita GDP show one spatial low-low cluster or so-called cool spot in the west of China, which indicates little human disturbance. Per capita GDP also shows two isolated individual hotspots, one in Hebei and the other one in Shanghai.

3.6. Spatial Relationship Between Natural Wetlands Changes and Associated Influencing Factors

The significant spatial clusters and spatial outliers of eight influencing factors at the local scale indicate the existence of spatial dependence and spatial heterogeneity. Meanwhile, the combination of the LISA cluster maps of natural wetlands distribution (Figure 4) and the associated eight influencing factors (Figure 5 and Figure 6) can inform one that the local spatial associations of the eight influencing factors differ from each other and have different spatial corresponding degrees in the change of natural wetlands distribution, which indicates different potential relationships between them.
Natural wetlands distribution shows two similar spatial clusters, one to the west of China and one in the northeast of China, both associated with a high area of wetland. These two clusters only partially match the spatial clusters with low temperature, high precipitation, high humidity, high water storage, low cultivated area, low water consumption, low urbanization rate, and low per capita GDP, which indicates the existence of a coordinated spatial relationship between them. Overall, spatial coordination between natural wetlands distribution and the associated influencing factors is higher in the western region than in east China and northeast China.
First, natural wetlands with high area value in Xinjiang are characterized by a statistically high value of water consumption. Wetlands in the Xinjiang-Inner Mongolia wetland region are dominated by saline lakes and swamps in a dry climate. In the context of dry climate wetlands sustainability develops a heavy dependence on water supplies. Therefore, great attention should be paid to the phenomenon why water consumption is so high in Xinjiang and how to manage water allocation in the case of a great demand for water. Natural wetlands in Qinghai and Tibet belong to the Qinghai-Tibet Plateau wetland region. This wetland region is known as the shelter of ecological security in Asia and plays an important role in China’s wetland ecosystem, while it is a sensitive region of global climate change [40]. Although these two provinces are only characterized by a statistically high value of water storage and low value of urbanization rate, which show the existence of a coordinated spatial relationship between them, they are also associated with high values of water consumption in neighbors of Xinjiang and Sichuan. Hence based on Tobler’s first law of geography, although no significantly negative influencing factors are revealed in Qinghai and Tibet, natural wetlands conservation here should protect themselves from the impacts from their neighbors with high values of water consumption. Additionally, drivers of changes in Qinghai-Tibet Plateau wetlands are dominated by natural factors, especially climate change, and anthropogenic factors are also regarded as the important influencing factors which also play a leading role in some areas [40,41]. Climate change will affect the hydrology of individual wetland ecosystems mostly through changes in precipitation and temperature regimes with great global variability [42]. Thus, the result obtained in this study supplements that impacts of human activities from the neighbors should be focused on together, which is suitable for natural wetlands conservation and management in Gansu. Furthermore, the success of wetlands conservation depends on the incorporation of climate change and wetland management [42,43].
Second, natural wetlands with high area value in Jilin are characterized by a statistically high value of cultivated area. A high area of cultivation will compete with wetlands for the use of water supplies and create pressures on wetlands, leading to a consequence of the weakened ecological function of wetlands, decreased biodiversity, increased rates and magnitudes of pollutant loading, etc. [42]. Jilin, one of the main agricultural bases, has converted part of its wetlands into arable land during 2008–2012, due to the task of increasing grain output by millions of tons [44]. Thus, under this circumstance, effective management of cultivation lands should be carried out to reduce the impacts from arable land on natural wetlands in Jilin. Similarly, Shandong and Henan, which are characterized by statistically high values of cultivated area, should also pay attention to this kind of problem.
Third, natural wetlands in Tianjin are characterized by a statistically low value of water storage. Most wetlands in Tianjin are located along the northeast coastal region. Tianjin is a typical industrial city with a large number of pollution emissions; pollution is one of the major threats to coastal wetlands [24]. Moreover, maps in Figure 6b,d show that natural wetlands in Hebei, the neighbor of Tianjin, are characterized by a statistically high value of water consumption and high value of per capita GDP, respectively. Thus, the environment in Tianjin and its surroundings are not conducive to the sustainability of wetlands. Note that Tianjin not only belongs to the circle of economy around the capital, which includes Beijing, Hebei, and Tianjin, but also plays a vital role in the circle of the ecology around the capital [45]. Hence, conservation of natural wetlands in Tianjin should receive great attention to deal with the uncoordinated spatial relationship.
In summary, uncoordinated spatial relationships have been revealed within provinces; furthermore, the impacts resulting from the neighbors have been highlighted. Thus, it implies that wetland sustainable conservation and management across provinces or regions [13,24,46] should be considered, especially the neighboring provinces.

4. Conclusions and Recommendations

4.1. Conclusions

Wetland loss and degradation pose great challenges for biodiversity protection in China. This study can provide some scientific references for the decision-making of effective and targeted wetlands conservation and sustainable management at national and provincial scales. Moran’s I statistics are a useful tool for effectively identifying the spatial autocorrelation and spatial hotspots of natural wetlands distribution and associated influencing factors at the province level. Regional differences of the uncoordinated spatial relationship between natural wetlands changes and associated influencing factors are significant, which should be given considerable attention. GIS mapping is helpful to visually illustrate the spatial distribution of natural wetlands and associated influencing factors and to study the spatial relationship between them. To expand and advance GIS applications in wetlands research, more detailed data or case collection is important.

4.2. Recommendations

(1) Implement cross-province or cross-region wetland protection and management. As described above, the hotspot cluster is formed by two provinces in 2003 and four provinces in 2013. Although natural wetlands in different provinces that belong to different wetland regions have different dominant characteristics [23], the expansion of spatial hotspot implies the existence of a spatial diffusion effect. The aggregated provinces have strong radiation to the neighboring provinces of their wetland protection and management. Hence strengthening protection, management and cooperation cross-provinces, cross-region, or cross-sector and cross-nation are critical and necessary for the protection of wetland and biodiversity.
(2) Wetland activities should incorporate climate change, wetland restoration, management and conservation planning. Climate factors, the major part of natural factors, play a vital role in wetland sustainability. Attention to climate change and variability could make the difference between success and failure for wetlands conservation.
(3) Reduce human activity stressors on wetland ecosystems. Spatial analysis of the associated influencing factors revealed that spatial autocorrelations of anthropogenic factors are weaker than those of natural factors, which implies stronger spatial randomness of anthropogenic activities, making them hard to be controlled and managed. Negative impacts resulting from human activities should be reduced or minimized on wetland ecosystems.

Author Contributions

Conceptualization, Ting Zhou and Anyi Niu; methodology, Ting Zhou and Songjun Xu; software, Jiaojiao Ma and Anyi Niu; data curation, Zhanpeng Huang, Jiaojiao Ma; writing—original draft preparation, Ting Zhou.; writing—review and editing, Songjun Xu and Zhanpeng Huang; supervision, Songjun Xu; funding acquisition, Songjun Xu. All authors have read and agreed to the published version of the manuscript.

Funding

This research was funded by the National Natural Science Foundation of China, Grant No.41271060, 41877411. And the work was supported by the Fund for studying abroad of South China Normal University.

Acknowledgments

The authors would like to acknowledgment the guidance from Dr. Chaosheng Zhang, who is Director of International Network for Environment and Health, and head of Research Cluster of Environmental Change at Discipline of Geography, National University of Ireland, Galway, Ireland.

Conflicts of Interest

The authors declare no conflict of interest.

References

  1. Mitsch, W.J.; Gosselink, J.G. The value of wetlands: Importance of scale and landscape setting. Ecol. Econ. 2000, 35, 25–33. [Google Scholar] [CrossRef]
  2. Brander, L.M.; Florax, R.J.G.M.; Vermaat, J.E. The Empirics of Wetland Valuation: A Comprehensive Summary and a Meta-Analysis of the Literature. Environ. Res. Econ. 2006, 33, 223–250. [Google Scholar] [CrossRef] [Green Version]
  3. Dudgeon, D.; Arthington, A.H.; Mark, O.G.; Kawabata, Z.I.; Knowler, D.J.; Lévêque, C.; Naiman, R.J.; Richard, A.H.P.; Soto, D.; Stiassny, M.L.J.; et al. Freshwater biodiversity: Importance, threats, status and conservation challenges. Biol. Rev. 2006, 81, 163–182. [Google Scholar] [CrossRef] [PubMed]
  4. Foti, R.; Jesus, M.D.; Rinaldo, A.; Iturbe, I.R. Signs of critical transition in the Everglades wetlands in response to climate and anthropogenic changes. Proc. Natl. Acad. Sci. USA 2013, 110, 6296–6300. [Google Scholar] [CrossRef] [PubMed] [Green Version]
  5. Carreño, M.F.; Eateve, M.A.; Martinez, J.; Palazón, J.A.; Pardo, M.T. Habitat changes in coastal wetlands associated to hydrological changes in the watershed. Estuar. Coast. Shelf Sci. 2008, 77, 475–483. [Google Scholar] [CrossRef]
  6. Liu, H.Y.; Zhang, S.K.; Li, Z.F.; Lu, X.G.; Yang, Q. Impacts on wetlands on wetlands of large-scale land-use changes by agricultural development: The small Sanjiang Plain, China. Ambio 2004, 33, 306–310. [Google Scholar] [CrossRef]
  7. Liu, Y.; Zha, Y.; Gao, J.; Ni, S. Assessment of grassland degradation near Lake Qinghai, West China, using Landsat TM and in situ reflectance spectra data. Int. J. Remote Sens. 2004, 25, 4177–4189. [Google Scholar] [CrossRef]
  8. Han, D.Y.; Yang, Y.; Yang, Y.; Li, K. Recent advances in wetland degradation research. Acta Ecol. Sin. 2012, 32, 1293–1307. [Google Scholar]
  9. Shen, G.; Yang, X.C.; Jin, Y.X.; Xu, B.; Zhou, Q.B. Remote sensing and evaluation of the wetland ecological degradation process of the Zoige Plateau wetland in China. Ecol. Indic. 2019, 104, 48–58. [Google Scholar] [CrossRef]
  10. Hu, S.J.; Niu, Z.G.; Chen, Y.F.; Li, L.F.; Zhang, H.Y. Global wetlands: Potential distribution, wetland loss, and status. Sci. Total Environ. 2016, 586, 319–327. [Google Scholar] [CrossRef]
  11. Bedford, B.L.; Preston, E.M. Developing the scientific basis for assessing cumulative effects of wetland loss and degradation on landscape functions: Status, perspectives, and prospects. Environ. Manag. 1988, 12e, 751–771. [Google Scholar] [CrossRef]
  12. Holland, C.C.; Honea, J.; Gwin, S.E.; Kentula, M.E. Wetland degradation and loss in the rapidly urbanizing area of Portland, Oregon. Wetlands 1995, 15, 336–345. [Google Scholar] [CrossRef]
  13. Davis, J.A.; Froend, R. Loss and degradation of wetlands in southwestern Australia: Underlying causes, consequences and solutions. Wetl. Ecol. Manag. 1999, 7, 13–23. [Google Scholar] [CrossRef]
  14. Gibbs, J.P. Wetland loss and biodiversity conservation. Conserv. Biol. 2000, 14, 314–317. [Google Scholar] [CrossRef] [Green Version]
  15. Zhou, D.M.; Gong, H.L.; Wang, Y.Y.; Khan, S.; Zhao, K.Y. Driving forces for the Marsh Wetland Degradation in the Honghe National Nature Reserve in Sanjiang Plain, Northeast China. Environ. Model. Assess. 2009, 14, 101–111. [Google Scholar] [CrossRef]
  16. Niu, Z.G.; Zhang, H.Y.; Wang, X.W.; Wen, B.; Yao, D.M.; Zhou, K.Y.; Zhao, H.; Li, N.N.; Huang, H.B.; Li, C.C.; et al. Mapping wetland changes in China between 1978 and 2008. Chin. Sci. Bull. 2012, 57, 2813–2823. [Google Scholar] [CrossRef] [Green Version]
  17. Chen, Y.Y.; Lü, X.G. The wetland function and research tendency of wetland science. Wetl. Sci. 2003, 1, 7–11. [Google Scholar]
  18. Wetland China. The Second National Wetland Recourses Survey. Available online: http://www.shidi.org/zt/2014xwfbh/ (accessed on 21 January 2014).
  19. Sica, Y.V.; Quintana, R.D.; Radeloff, V.C.; Gavier, G.I. Wetland loss due to land use change in the Lower Paraná River Delta, Argentina. Sci. Total Environ. 2016, 568, 967–978. [Google Scholar] [CrossRef]
  20. Gong, P.; Niu, Z.G.; Cheng, X.; Zhao, K.Y.; Zhou, D.M.; Guo, J.H.; Lu, L.; Wang, X.F.; Li, D.D.; Huang, H.B.; et al. China’s wetland change (1990–2000) determined by remote sensing. Sci. China Earth Sci. 2010, 53, 1036. [Google Scholar] [CrossRef]
  21. Meng, W.Q.; He, M.X.; Hu, B.B.; Mo, X.Q.; Liu, B.Q.; Wang, Z.L. Status of wetlands in China: A review of extent, degradation, issues and recommendations for improvement. Ocean Coast. Manag. 2017, 146, 50–59. [Google Scholar] [CrossRef]
  22. Sun, R.; Yao, P.P.; Wang, W.; Yue, B.; Liu, G. Assessment of wetland ecosystem health in the Yangtze and Amazon River Basins. ISPRS Int. J. Geo-Inf. 2017, 6, 81. [Google Scholar] [CrossRef] [Green Version]
  23. An, S.Q.; Li, H.; Guan, B.H.; Zhou, C.F.; Wang, Z.S.; Deng, Z.F.; Zhi, Y.B.; Liu, Y.H.; Xu, C.; Fang, S.B.; et al. China’s natural wetlands: Past problems, current status, and future challenges. Ambio 2007, 36, 335–342. [Google Scholar] [CrossRef] [Green Version]
  24. Sun, Z.G.; Sun, W.G.; Tong, C.; Zeng, C.S.; Yu, X.; Mou, X.J. China’s coastal wetlands: Conservation history, implementation efforts, existing issues and strategies for future improvement. Environ. Int. 2015, 79, 25–41. [Google Scholar] [CrossRef] [PubMed]
  25. Yang, X.X.; Wang, X.L.; Qin, F.Y. Analysis of dynamic changes and influencing factors of wetland in Dalinur Nature Reserve in recent 30 years. J. Northwest For. Univ. 2019, 34, 171–178, 222. [Google Scholar]
  26. Liu, Z.W.; Li, S.N.; Wei, W.; Song, X.J. Research progress on alpine wetland changes and driving forces in Qinghai-Tibet Plateau during the last three decades. Chin. J. Ecol. 2019, 38, 856–862. [Google Scholar]
  27. Niu, Z.G.; Gong, P.; Cheng, X.; Guo, J.H.; Wang, L.; Huang, S.B.; Shen, S.Q.; Wu, J.Z.; Wang, X.W.; Ying, Q.; et al. Geographical characteristics of China’s wetlands derived from remotely sensed data. Sci. China Earth Sci. 2009, 52, 723–738. [Google Scholar] [CrossRef]
  28. Zhang, S.Q.; Na, X.D.; Kong, B.; Wang, Z.M.; Jiang, H.X.; Yu, H.; Zhao, Z.C.; Li, X.F.; Liu, C.Y.; Dale, P. Identifying wetland change in China’s Sanjiang Plain using remote sensing. Wetlands 2009, 29, 302–313. [Google Scholar] [CrossRef] [Green Version]
  29. Liu, G.L.; Zhang, L.C.; Zhang, Q.; Musyimi, Z.; Jiang, Q.H. Spatio-temporal dynamics of wetland landscape patterns based on remote sensing in Yellow River Delta, China. Wetlands 2014, 34, 787–801. [Google Scholar] [CrossRef]
  30. Xue, Z.S.; Lü, X.G.; Chen, Z.K.; Zhang, Z.S.; Jiang, M.; Zhang, K.; Lü, Y.L. Spatial and temporal changes of wetlands on the Qinghai-Tibetan Plateau from the 1970s to 2010s. Chin. Geogr. Sci. 2018, 28, 935–945. [Google Scholar] [CrossRef] [Green Version]
  31. Zhao, Y. Analysis of dynamic change and driving force of wetland landscape pattern in Dalian. Environ. Sci. Surv. 2019, 38, 49–52, 69. [Google Scholar]
  32. Tobler, W. On the first law of geography: A replay. Ann. Assoc. Am. Geogr 2004, 94, 304–310. [Google Scholar] [CrossRef]
  33. Talen, E.; Anselin, L. Assessing spatial equity: An evaluation of measures of accessibility to public playgrounds. Environ. Plan. A 1998, 30, 595–613. [Google Scholar] [CrossRef] [Green Version]
  34. Jia, P.; Joyner, A. Human brucellosis occurrences in Inner Mongolia, China: A spatio-temporal distribution and ecological niche modeling approach. BMC Infect. Dis. 2015, 15, 1–16. [Google Scholar] [CrossRef] [PubMed] [Green Version]
  35. Zhang, C.S.; Luo, L.; Xu, W.L.; Ledwith, V. Use of local Moran’s I and GIS to identify pollution hotspots of Pb in urban soils of Galway, Ireland. Sci. Total Environ. 2008, 398, 212–221. [Google Scholar] [CrossRef]
  36. Lalor, G.; Zhang, C.S. Multivariate outlier detection and remediation in geochemical databases. Sci. Total Environ. 2001, 281, 99–109. [Google Scholar] [CrossRef]
  37. Anselin, L. Local indicators of spatial association—LISA. Geogr. Anal. 1995, 27, 93–114. [Google Scholar] [CrossRef]
  38. Silva, E.F.; Zhang, C.S.; Pinto, L.S.; Reis, P. Hazard assessment on arsenic and lead in soils of Castromil gold mining area, Portugal. Appl. Geochem. 2004, 19, 887–898. [Google Scholar] [CrossRef]
  39. Guo, Y.D.; He, Y.F. The dynamics of wetland landscape and its driving forces in Songnen Plain. Wetl. Sci. 2005, 3, 54–59. [Google Scholar]
  40. Zhao, Z.L.; Zhang, Y.L.; Liu, L.S.; Liu, F.G.; Zhang, H.F. Advances in research on wetlands of the Tibetan Plateau. Prog. Geogr. 2014, 33, 1218–1230. [Google Scholar]
  41. Lang, Q.; Niu, Z.G.; Hong, F.Q.; Yang, X.Y. Remote Sensing Monitoring and Change Analysis of the Tibet Plateau Wetlands. Geomatics and Information Science of Wuhan University. Available online: http://kns.cnki.net.scnu.vpn358.com/KCMS/detail/42.1676.TN.20190912.1340.001.html (accessed on 12 September 2019).
  42. Erwin, K.L. Wetlands and global climate change: The role of wetland restoration in a changing world. Wetlands Ecol. Manag. 2009, 17, 71–84. [Google Scholar] [CrossRef]
  43. Finlayson, C.M.; Davis, J.A.; Gell, P.A.; Kingsford, R.T.; Parton, K.A. The status of wetlands and the predicted effects of global climate change: The situation in Australia. Aquat. Sci. 2013, 75, 73–93. [Google Scholar] [CrossRef]
  44. Lu, C.Y.; Wang, Z.M.; Liu, M.Y.; Ou, Y.L.; Jia, M.M.; Mao, D.H. Analysis of conservation effectiveness of wetland protected areas based on remote sensing in West Songnen Plain. Chin. Environ. Sci. 2015, 35, 599–609. [Google Scholar]
  45. Min, Q.W.; Liu, W.W.; Xie, G.D.; Sun, X.P.; Li, N. Capital eco-sphere and its natural ecological conditions. Resour. Sci. 2015, 37, 1504–1512. [Google Scholar]
  46. Bawa, K.S.; Koh, L.P.; Lee, T.M.; Liu, J.G.; Ramakrishnan, P.S.; Yu, D.W.; Zhang, Y.P.; Raven, P.H. China, India, and the environment. Science 2010, 327, 1457–1459. [Google Scholar] [CrossRef] [PubMed]
Figure 1. Normal Q-Q plots: (a) raw data for AOR of natural wetlands in 2003; (b) raw data for AOR of natural wetlands in 2013.
Ijgi 09 00179 g001
Figure 2. Normal Q-Q plots: (a) AOR of natural wetlands in 2003 after normal score transformation; (b) AOR of natural wetlands in 2013 after normal score transformation.
Ijgi 09 00179 g002
Figure 3. Quantile maps: (a) spatial distribution of AOR of natural wetlands in 2003; (b) spatial distribution of AOR of natural wetlands in 2013. Note: there are 34 provinces in China, including 1 = Beijing, 2 = Tianjin, 3 = Hebei, 4 = Liaoning, 5 = Jilin, 6 = Heilongjiang, 7 = Inner Mongolia, 8 = Gansu, 9 = Qinghai, 10 = Xinjiang, 11 = Tibet, 12 = Yunnan, 13 = Sichuan, 14 = Ningxia, 15 = Shaanxi, 16 = Chongqing, 17 = Guizhou, 18 = Guangxi, 19 = Hunan, 20 = Hubei, 21 = Henan, 22 = Shanxi, 23 = Shandong, 24 = Anhui, 25 = Jiangxi, 26 = Guangdong, 27 = Fujian, 28 = Zhejiang, 29 = Jiangsu, 30 = Shanghai, 31 = Taiwan, 32 = Hong Kong, 33 = Macau, 34 = Hainan.
Ijgi 09 00179 g003
Figure 4. Local identifications of spatial association (LISA) cluster map: (a) AOR of natural wetlands in 2003; (b) AOR of natural wetlands in 2013.
Ijgi 09 00179 g004
Figure 5. T LISA cluster maps for natural factors: (a) temperature; (b) precipitation; (c) humidity; and (d) water storage.
Ijgi 09 00179 g005
Figure 6. LISA cluster maps for anthropogenic factors: (a) cultivated area; (b) water consumption; (c) urbanization rate; and (d) per capita GDP.
Ijgi 09 00179 g006
Table 1. Descriptive statistics of area occupation rate (AOR) of natural wetlands in 31 provinces in 2003 and 2013.
MeanMinQ1MedianQ3MaxStd-DevSkewness
AOR in 20030.03230.00010.00770.02020.03460.14450.03761.925
AOR in 20130.03230.00050.00590.01530.03520.17140.04422.058
Table 2. Moran’s I test for global associations.
Izp
AOR in 20030.2482.3830.015
AOR in 20130.3563.3000.001
Table 3. Moran’s I test for global association.
Natural FactorsIzpAnthropogenic FactorsIzp
Temperature0.7096.3240.000Cultivated area0.2322.2780.018
Precipitation0.7306.5400.000Water consumption0.1051.1860.123
Humidity0.4904.4430.000Per Capita GDP0.4644.2510.000
Water storage0.5434.8980.000Urbanization rate0.4343.9990.000

