Spatiotemporal Variation of NDVI in the Vegetation Growing Season in the Source Region of the Yellow River, China

Abstract
:
1. Introduction
2. Data and Methods
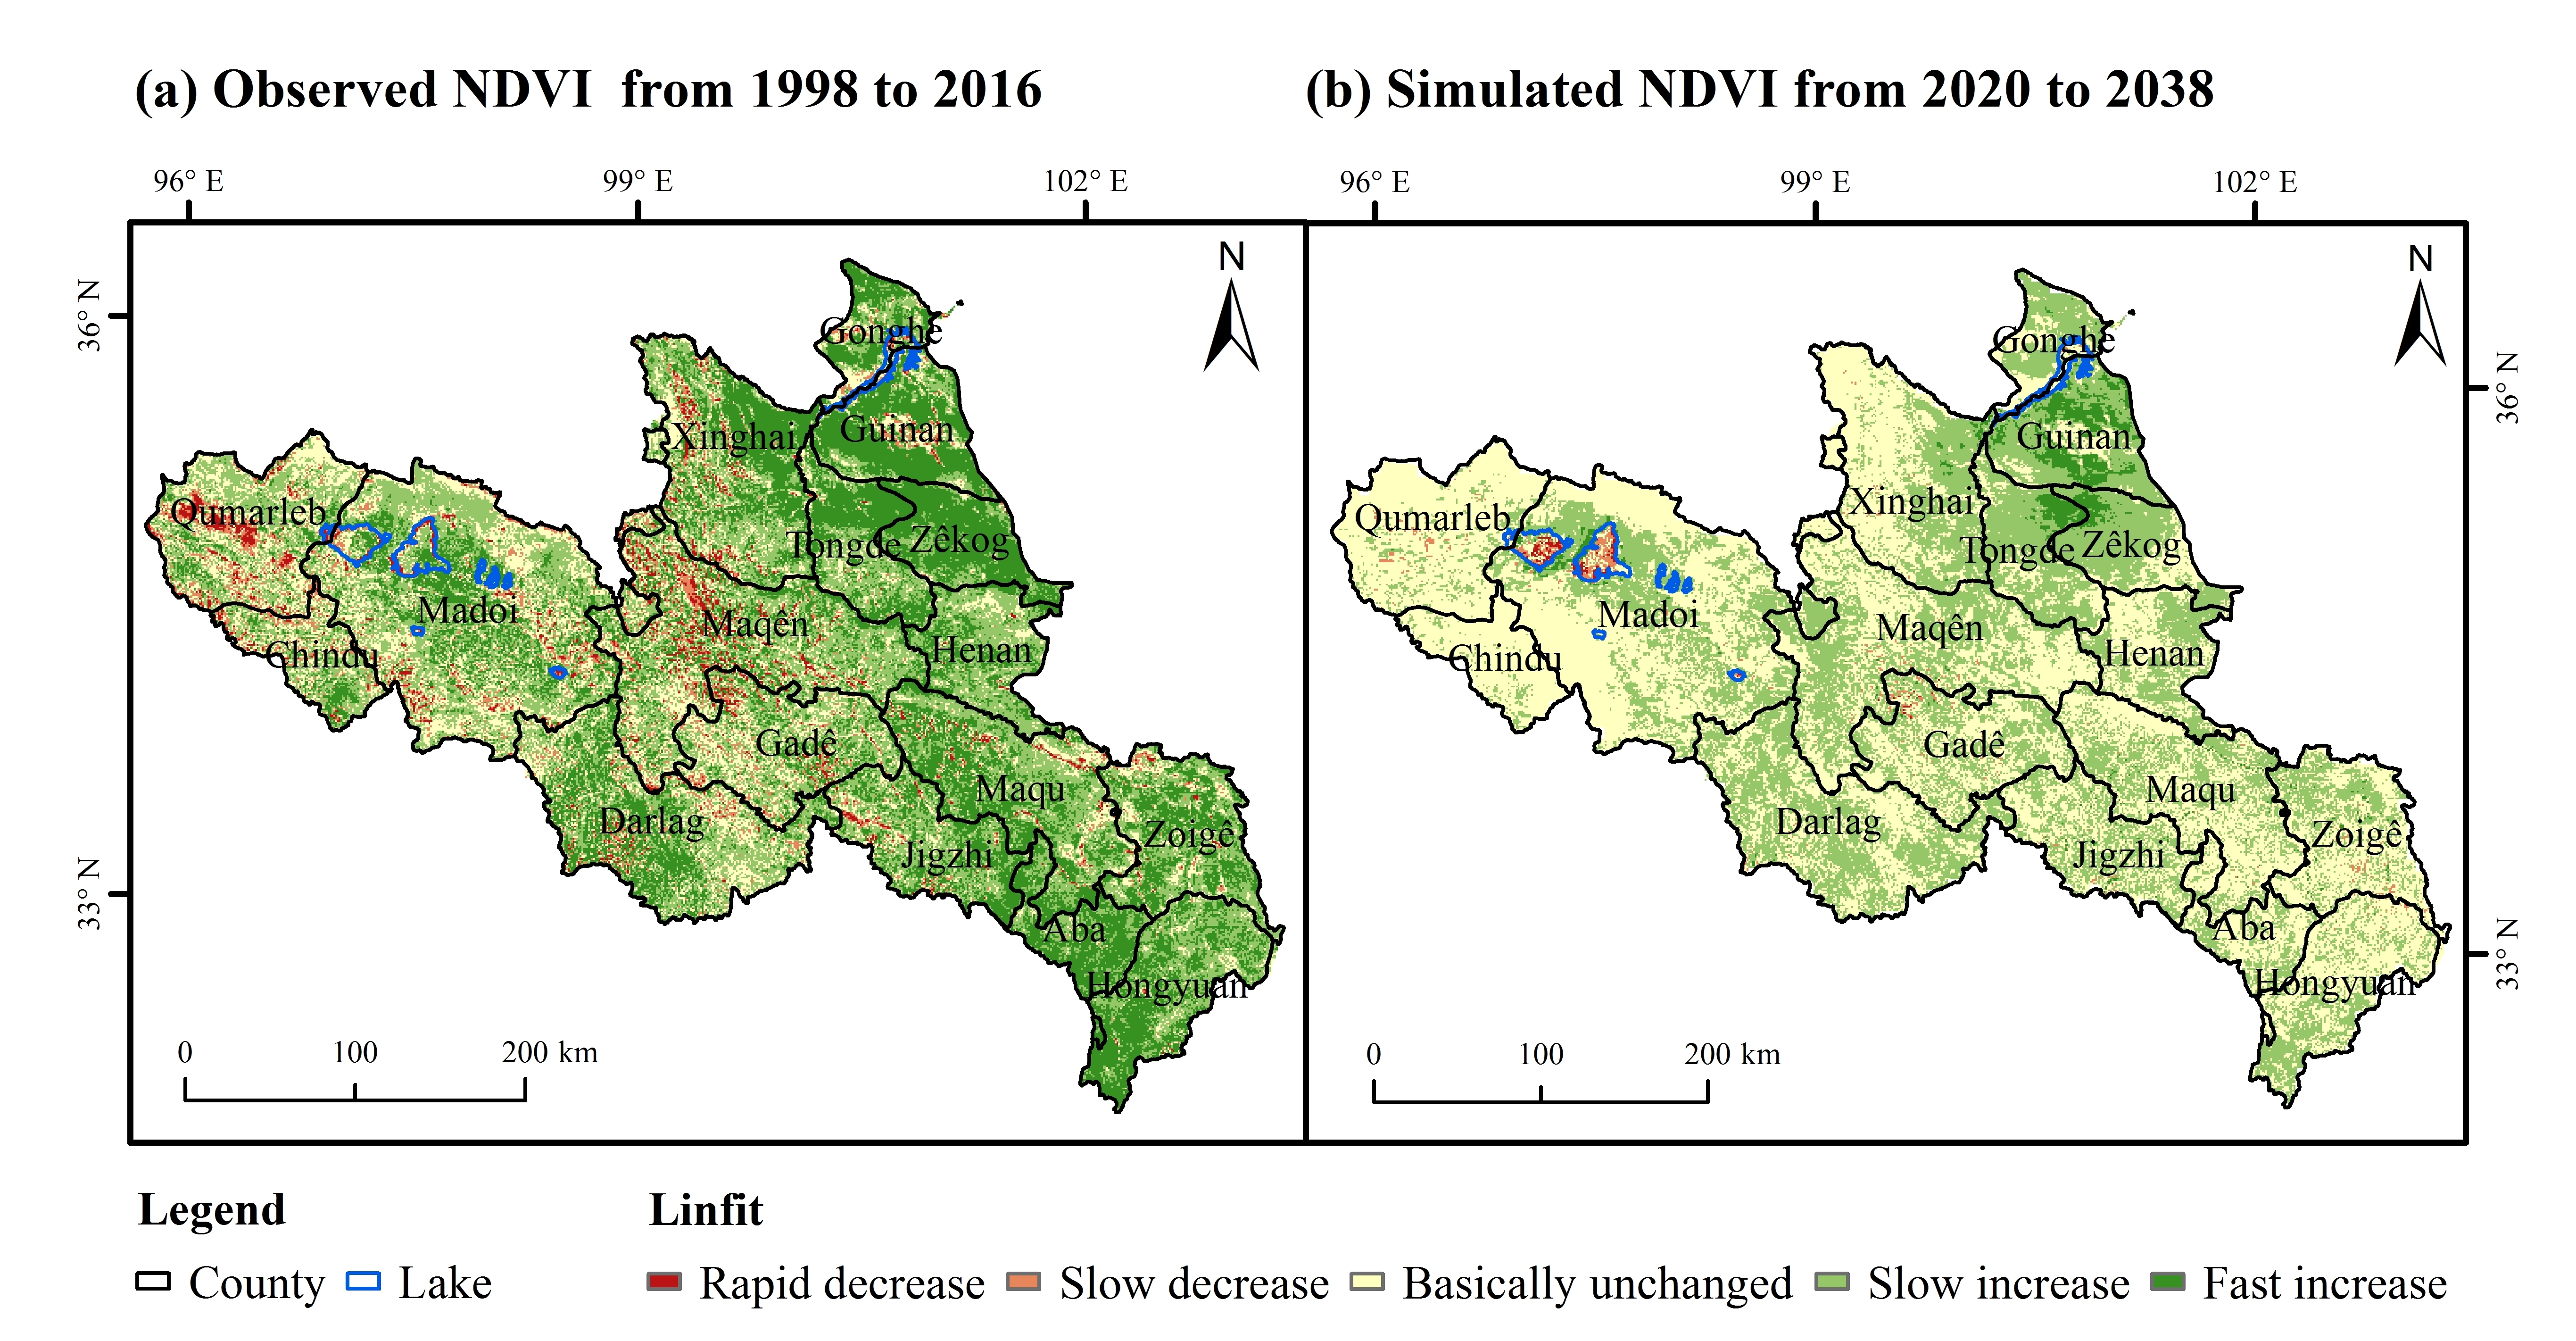
2.1. Study Area
2.2. Data
2.3. Methods
3. Results and Analysis
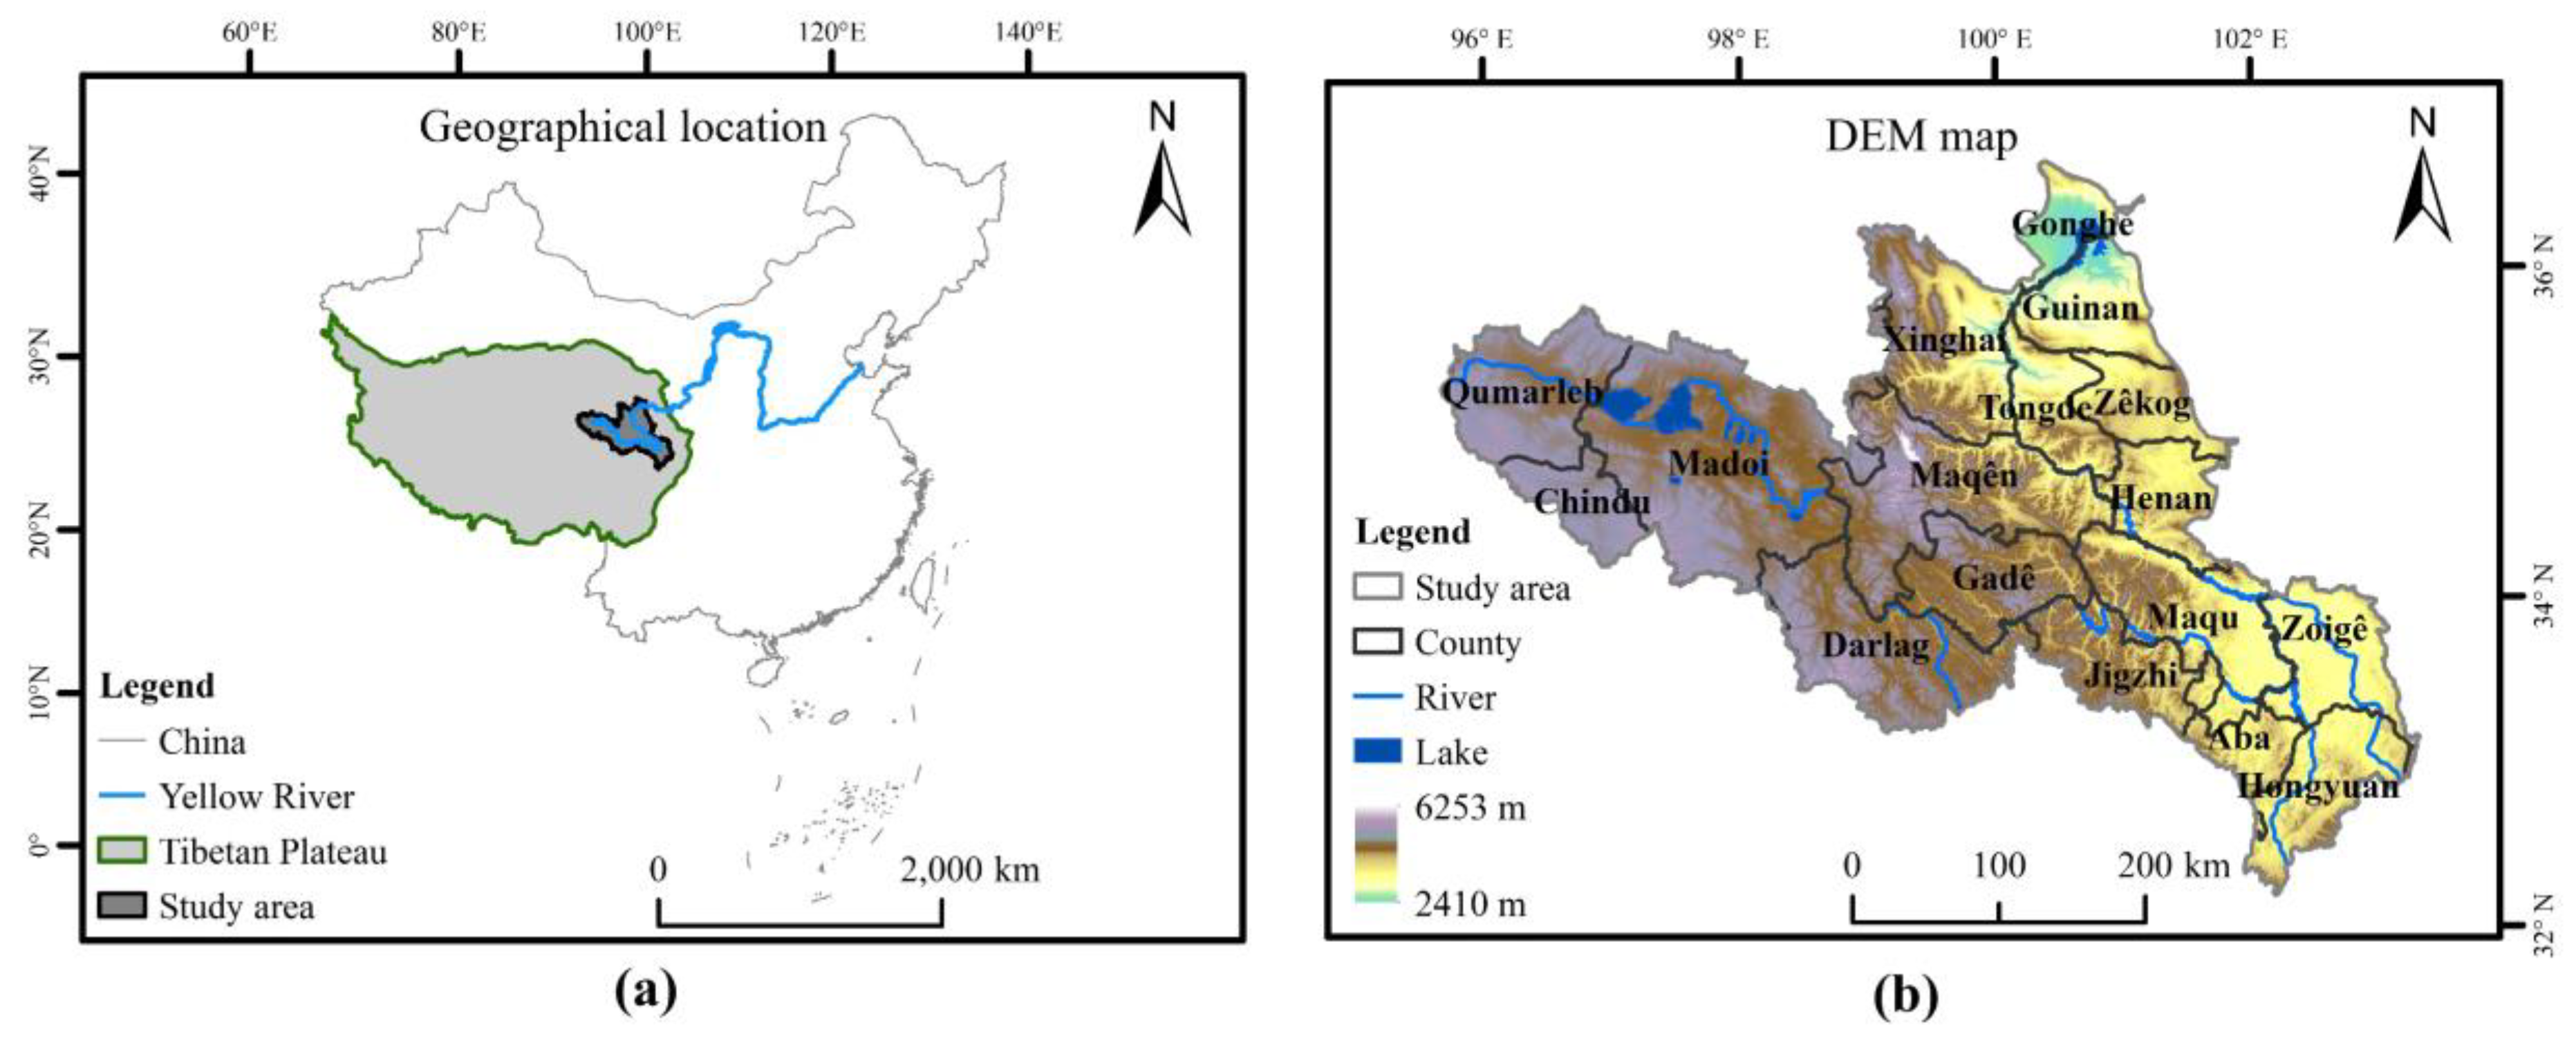
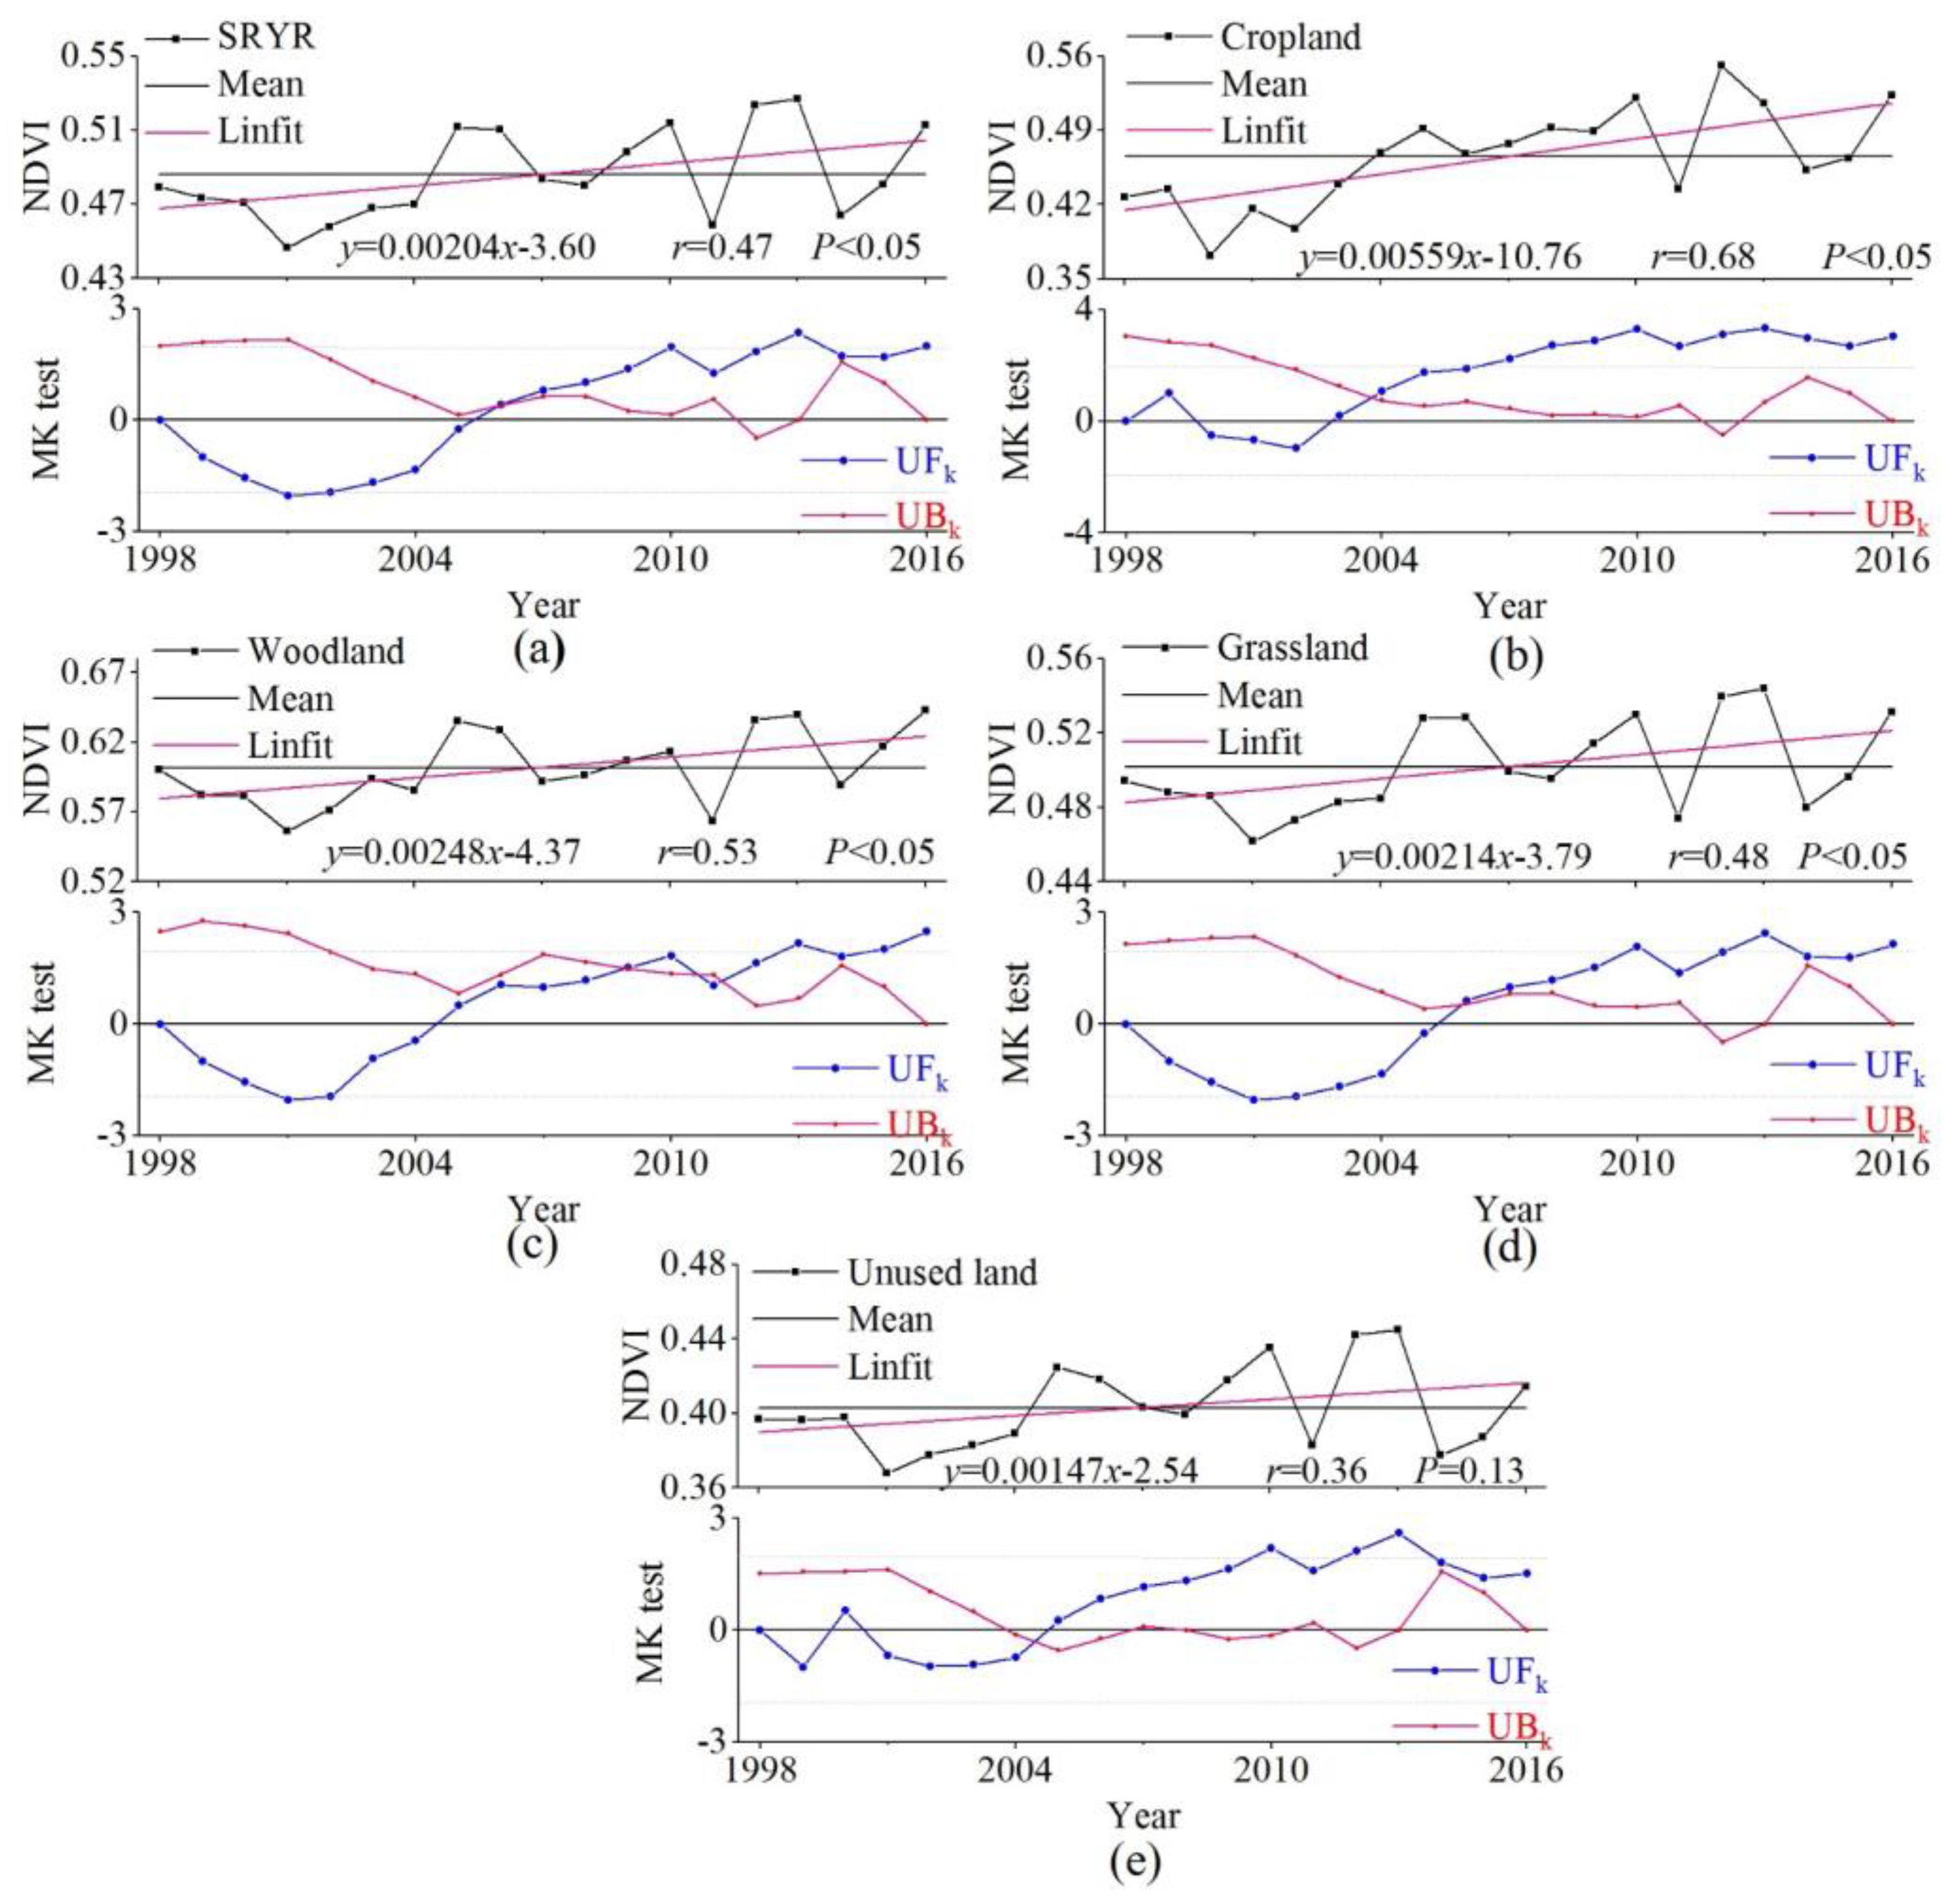
3.1. Spatiotemporal Variation in Normalized Difference Vegetation Index (NDVI)
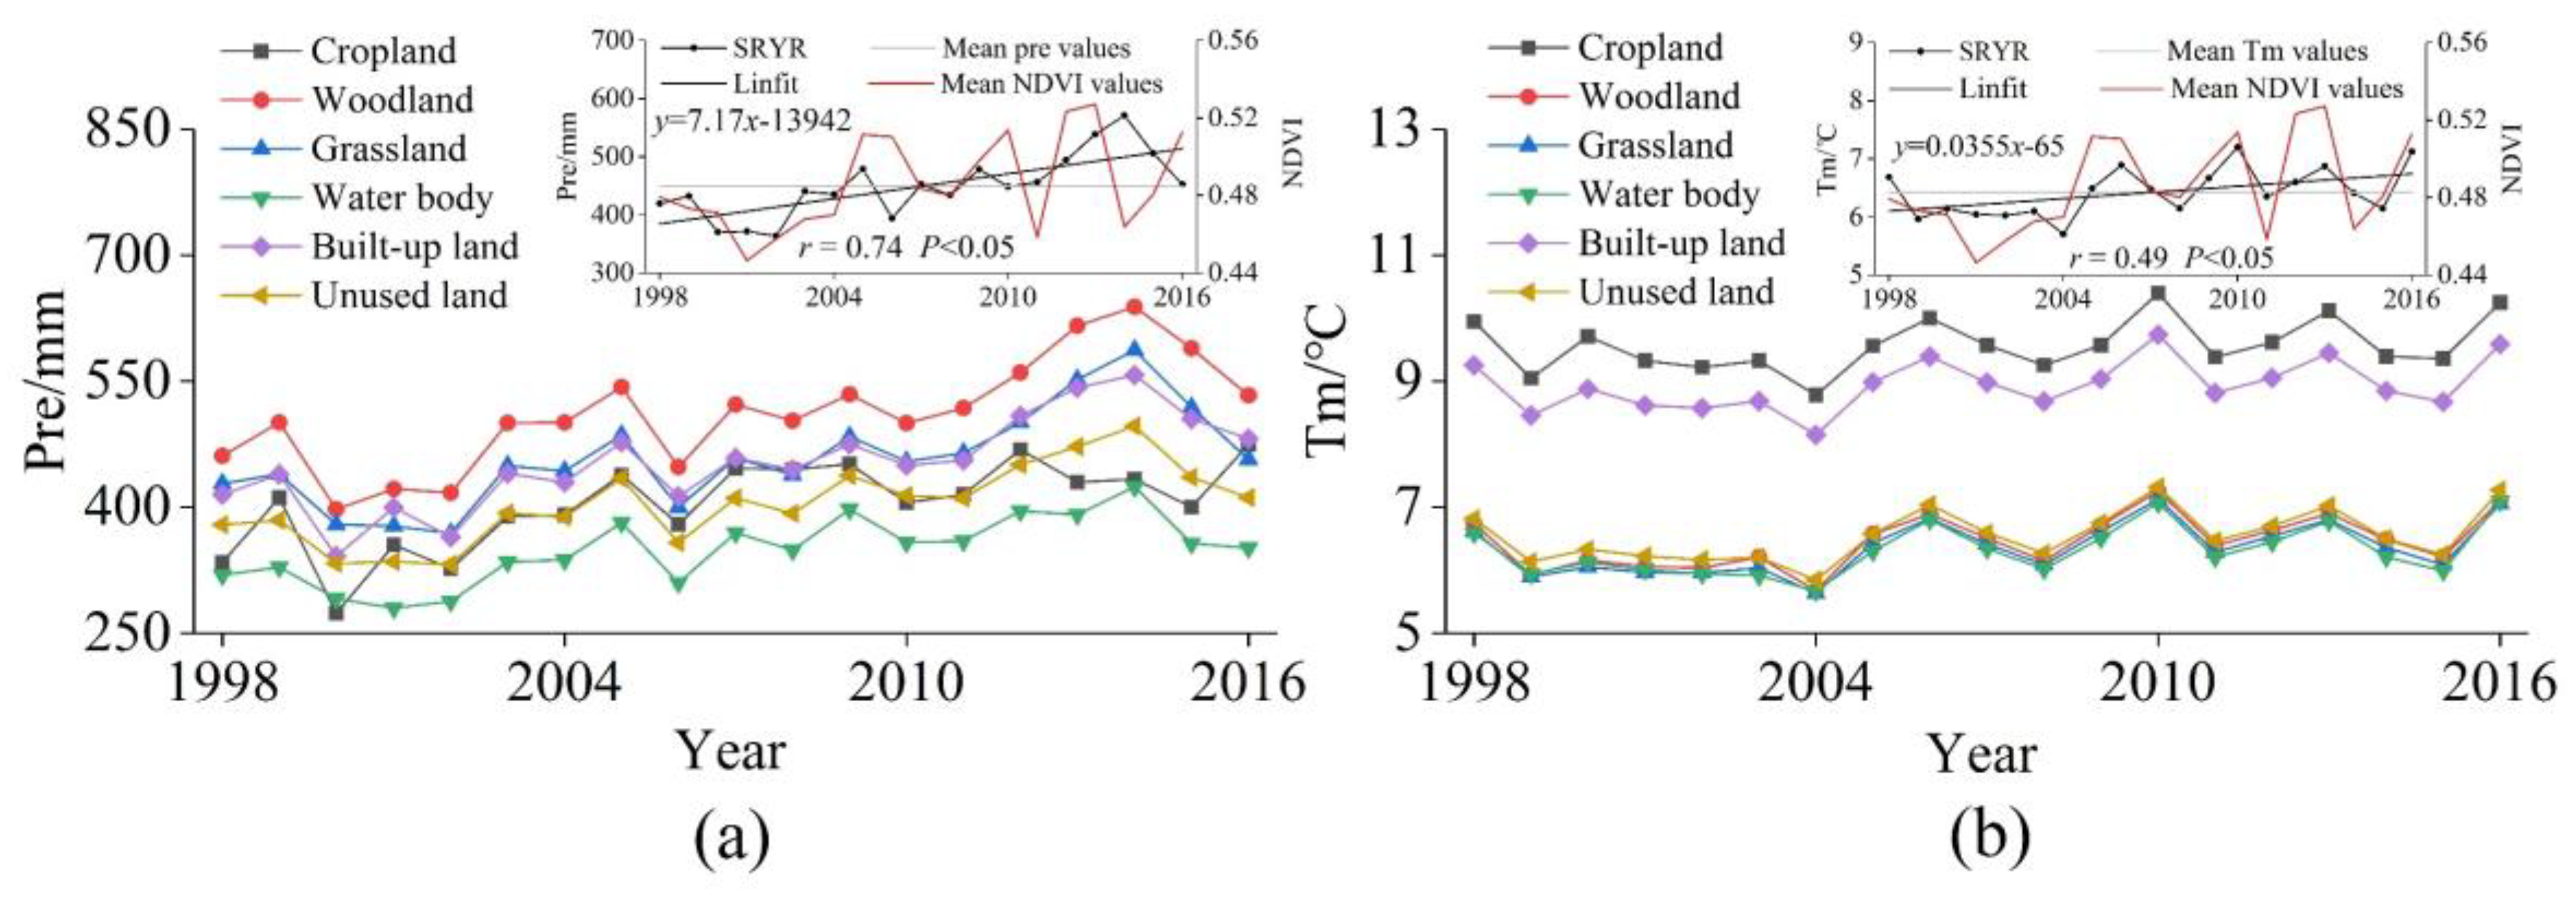
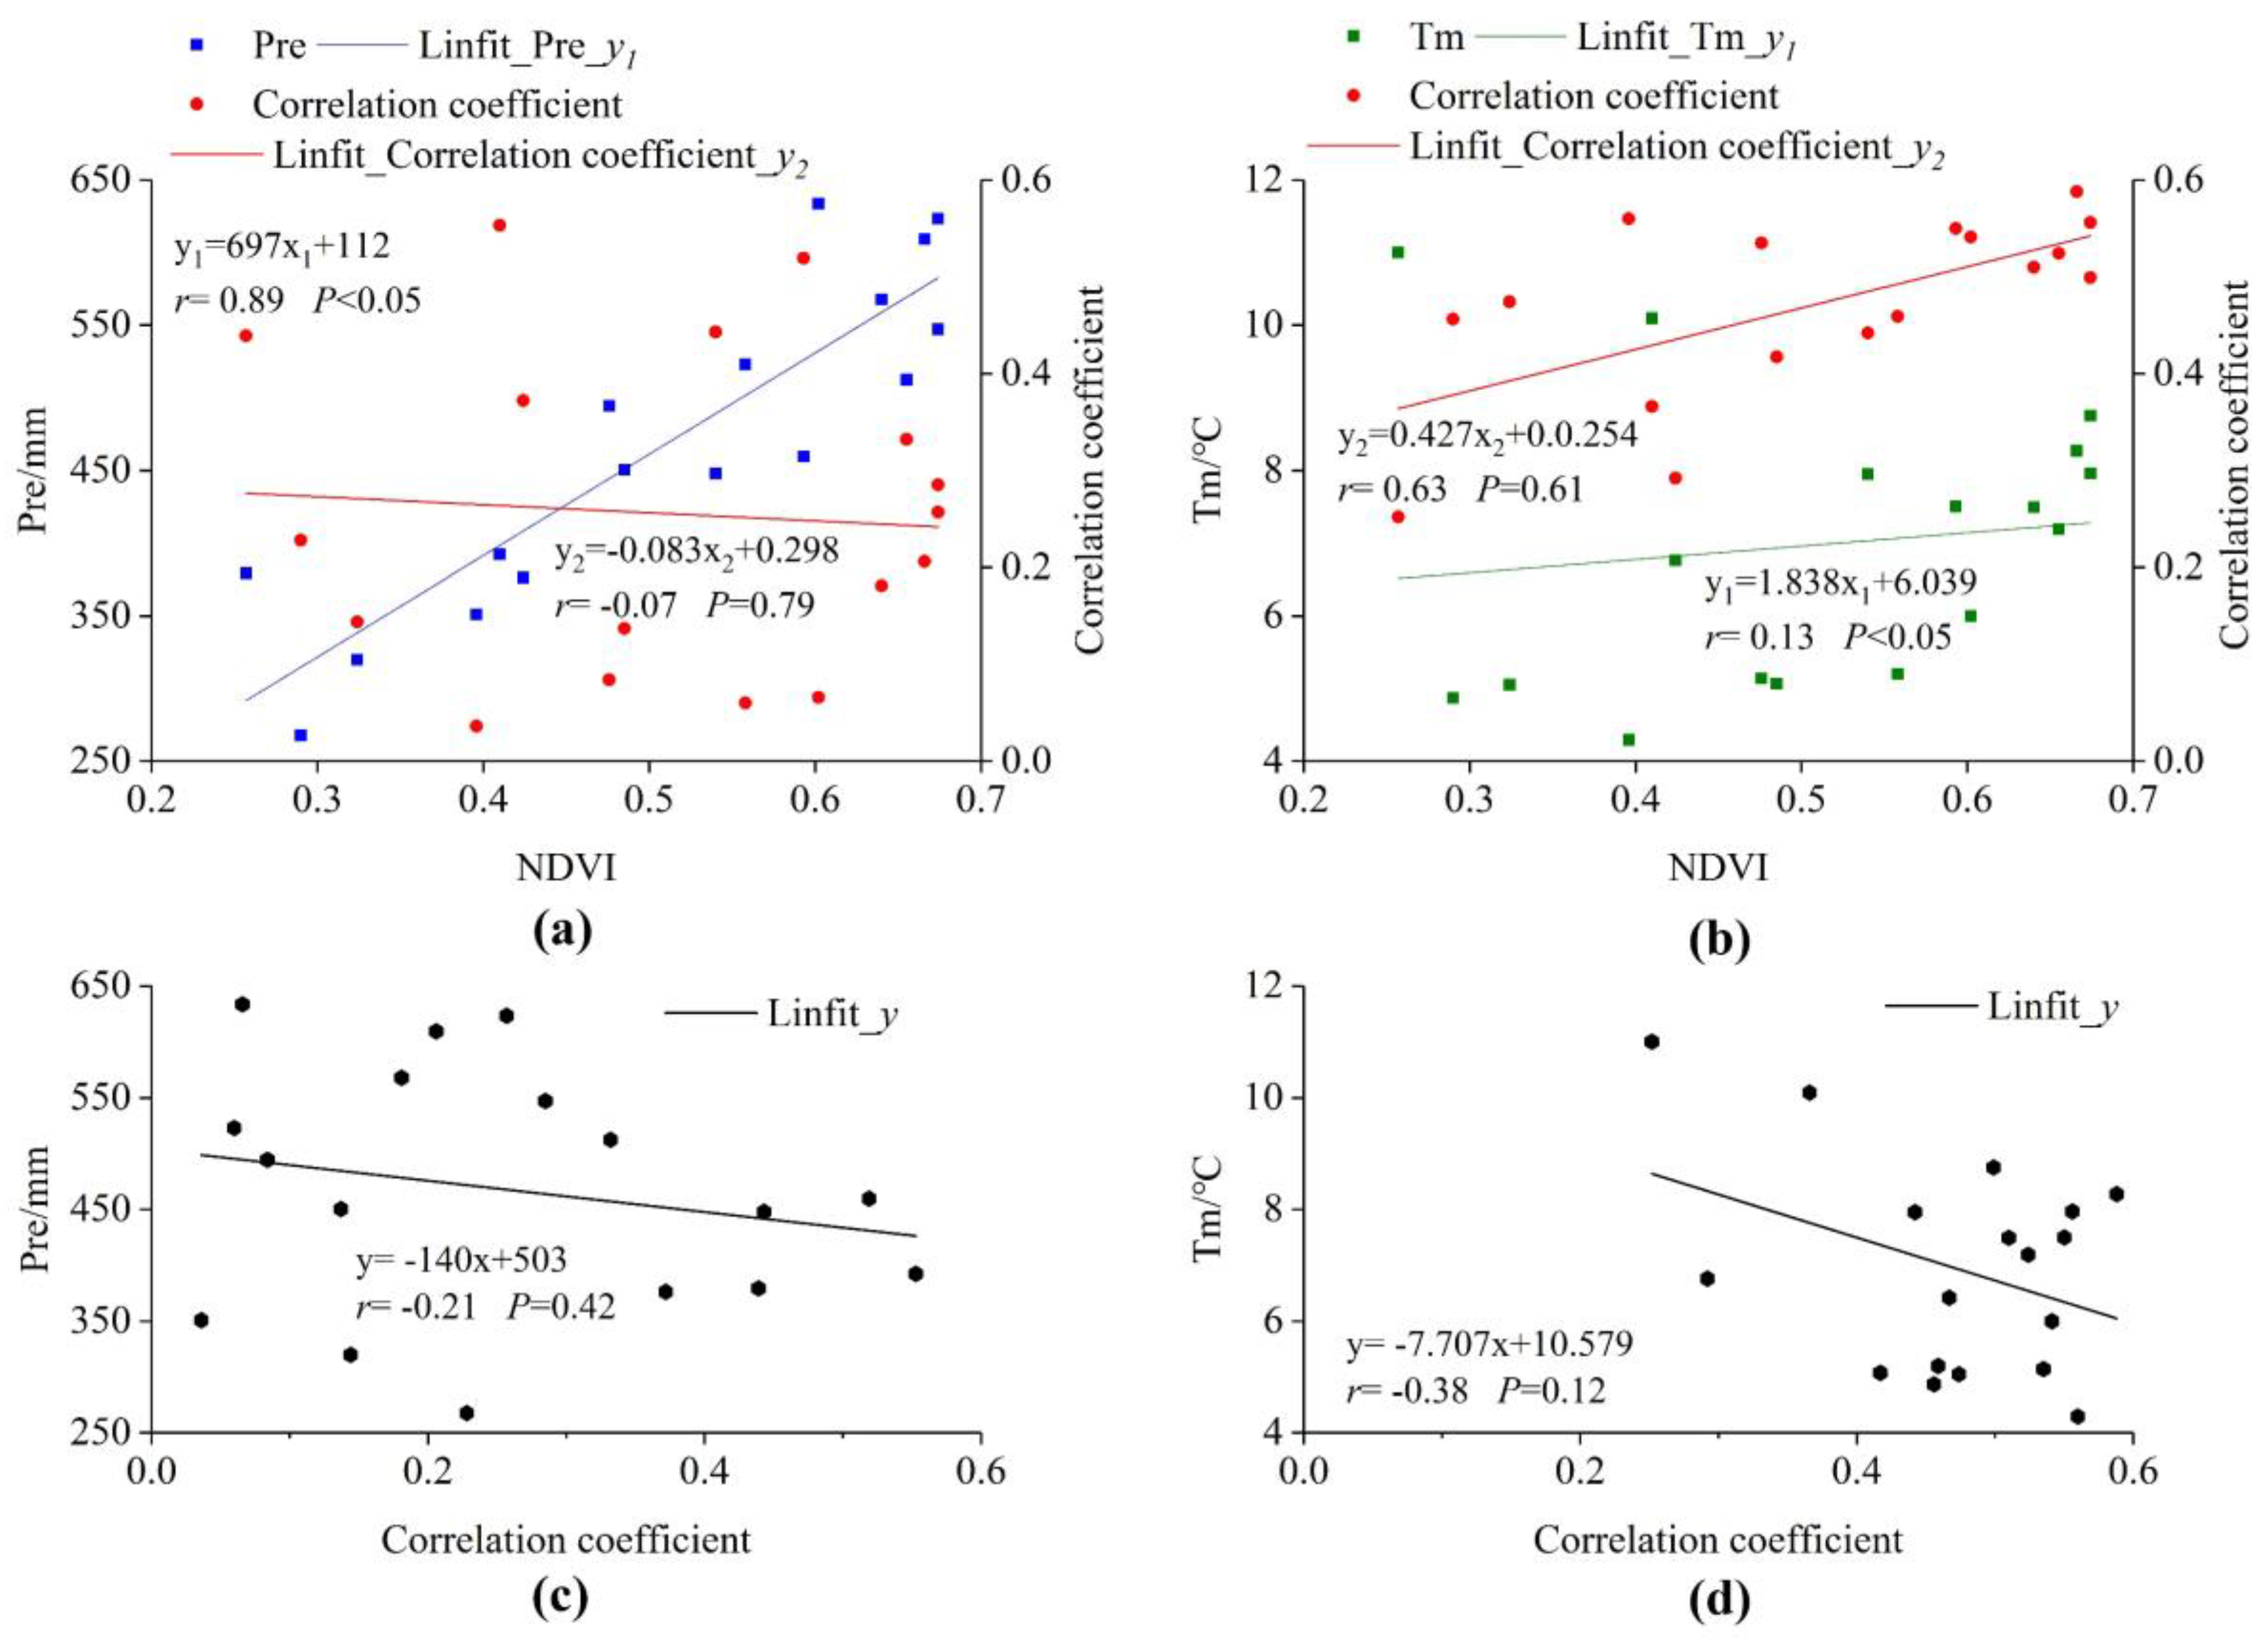
3.2. Impact of Meteorological Elements on the NDVI
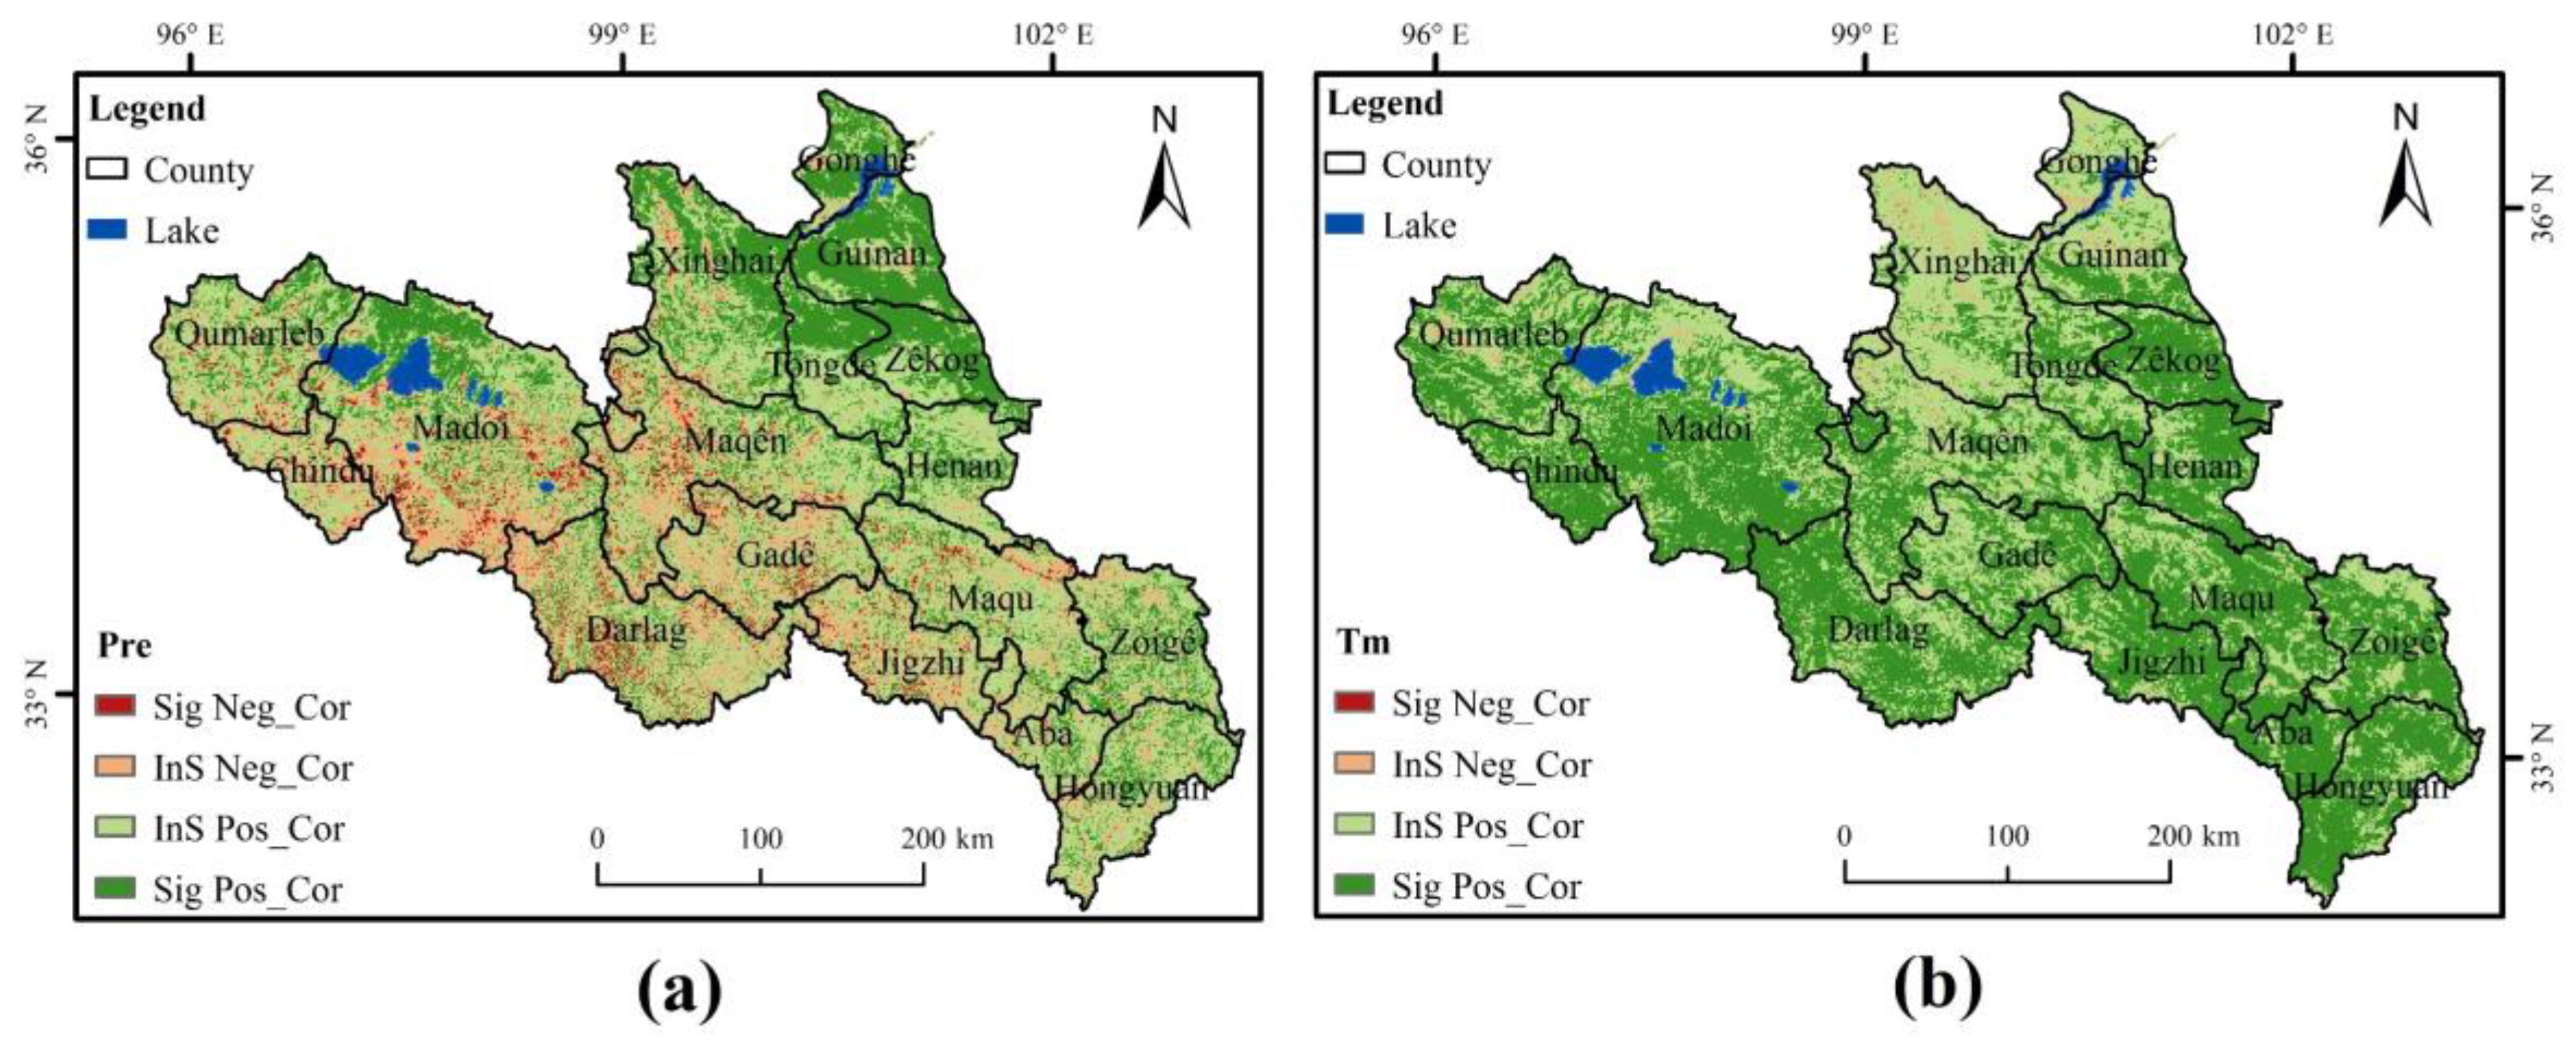
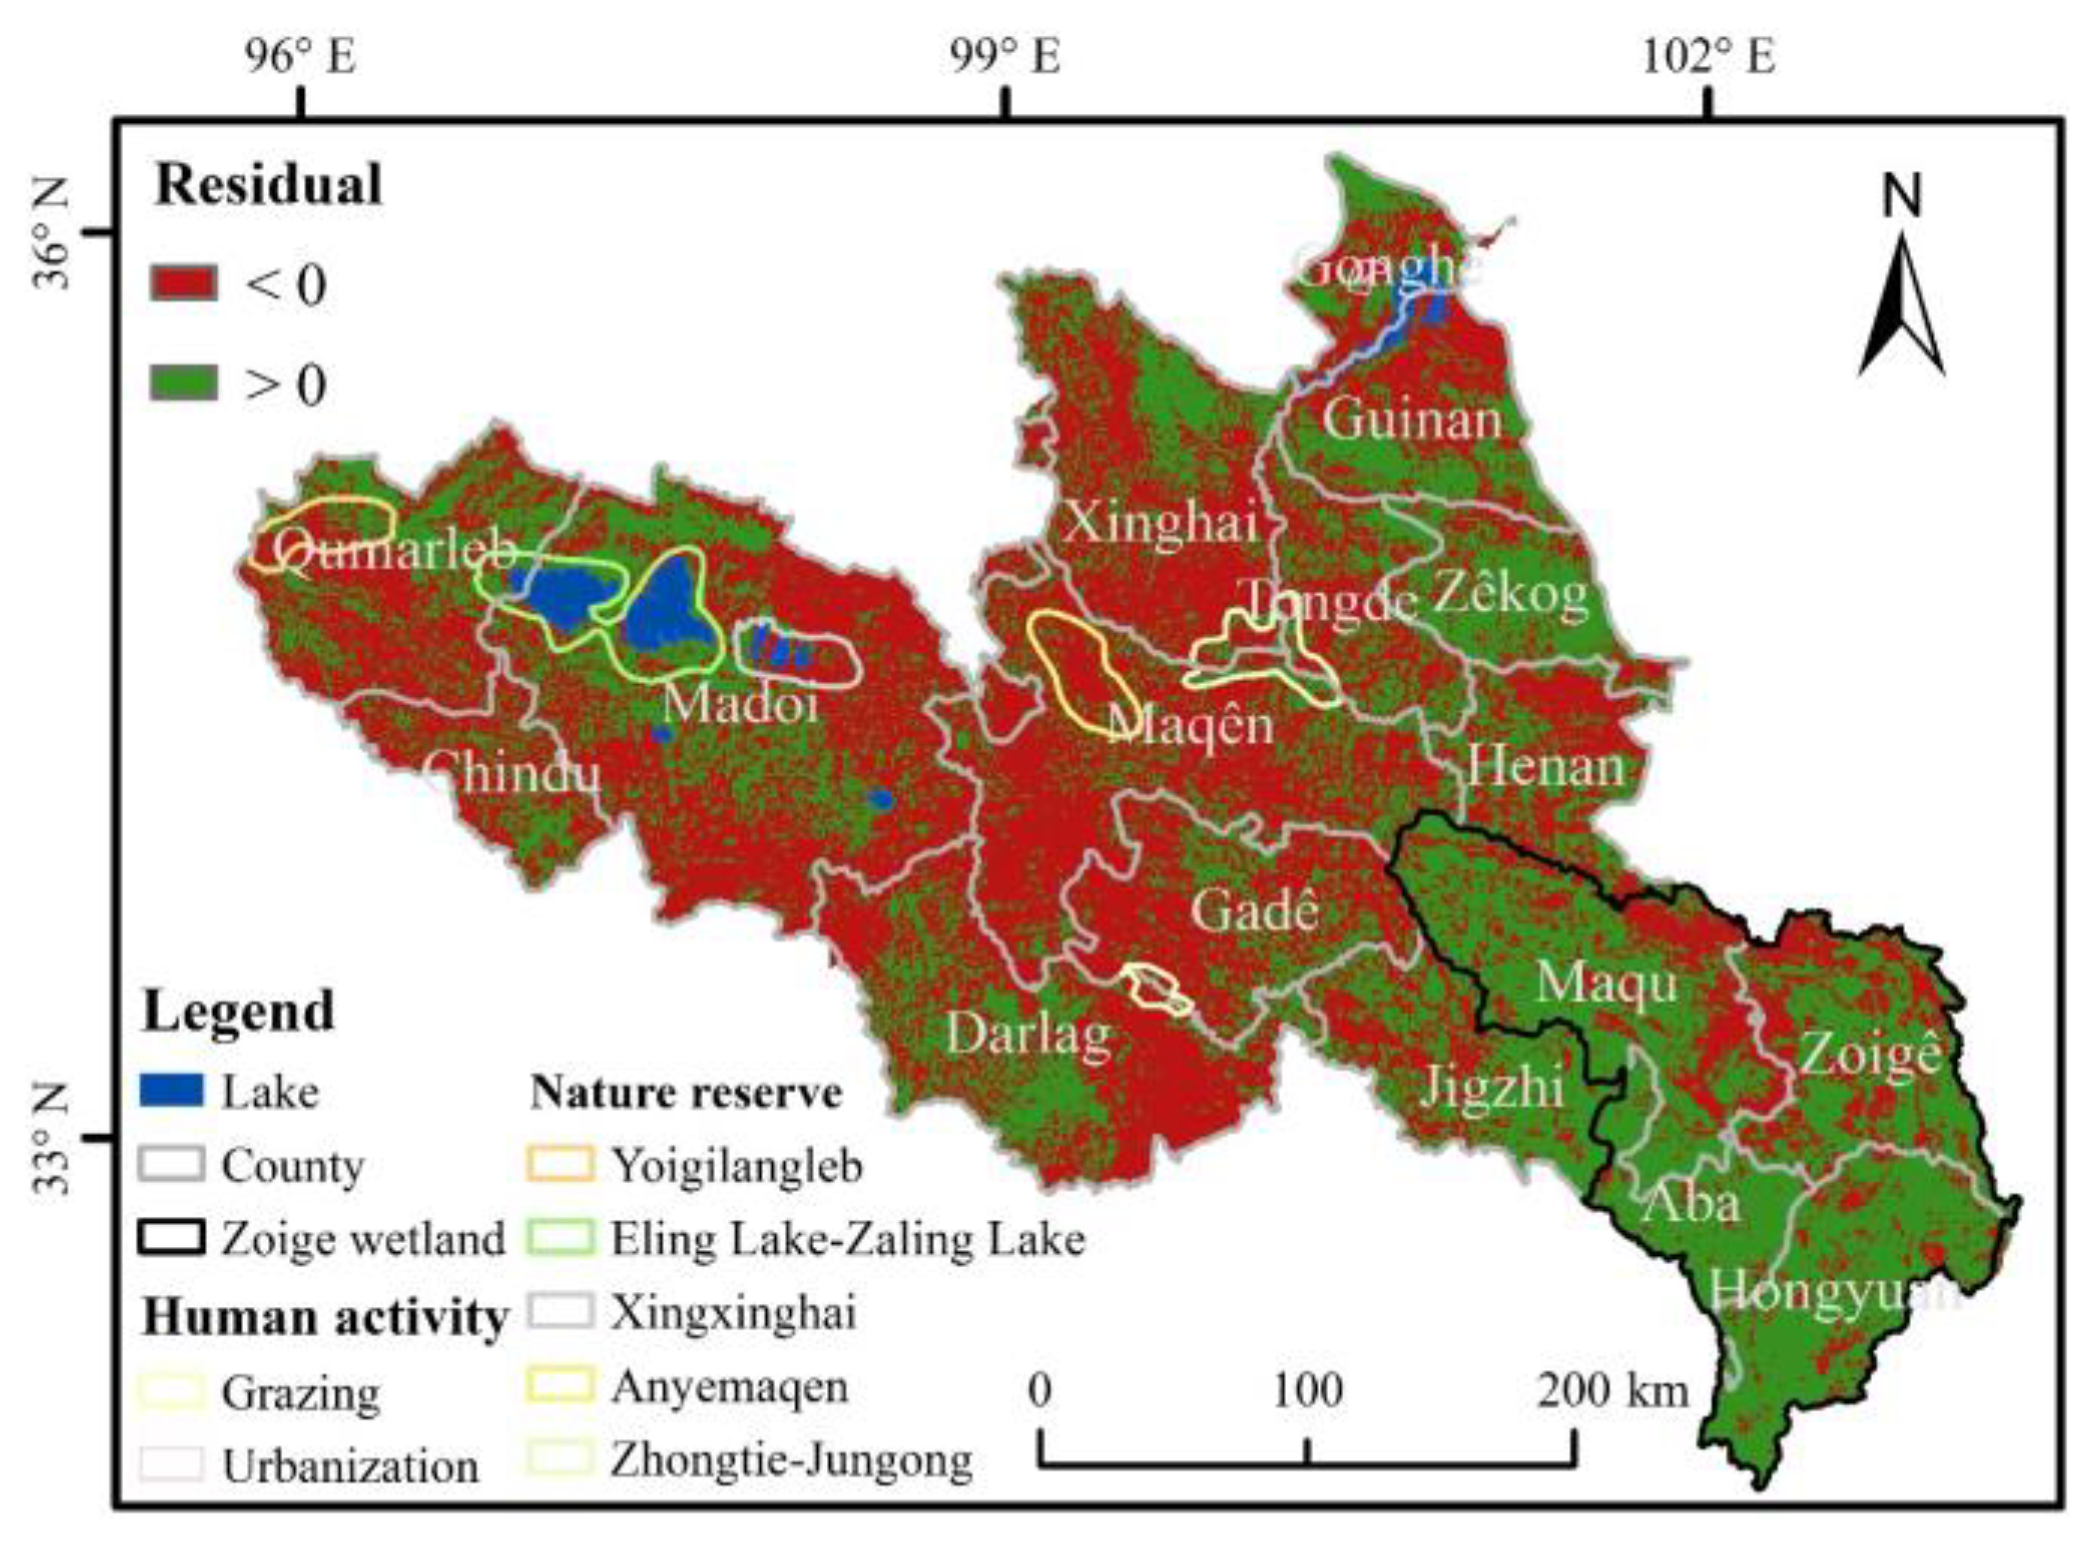
3.3. Impact of Human Activities on NDVI
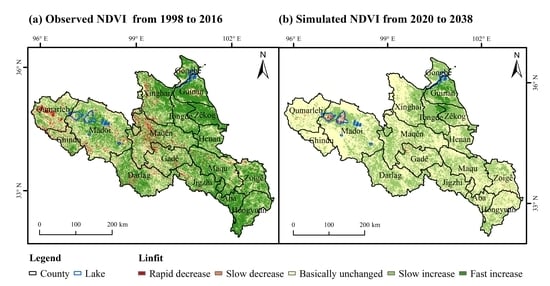
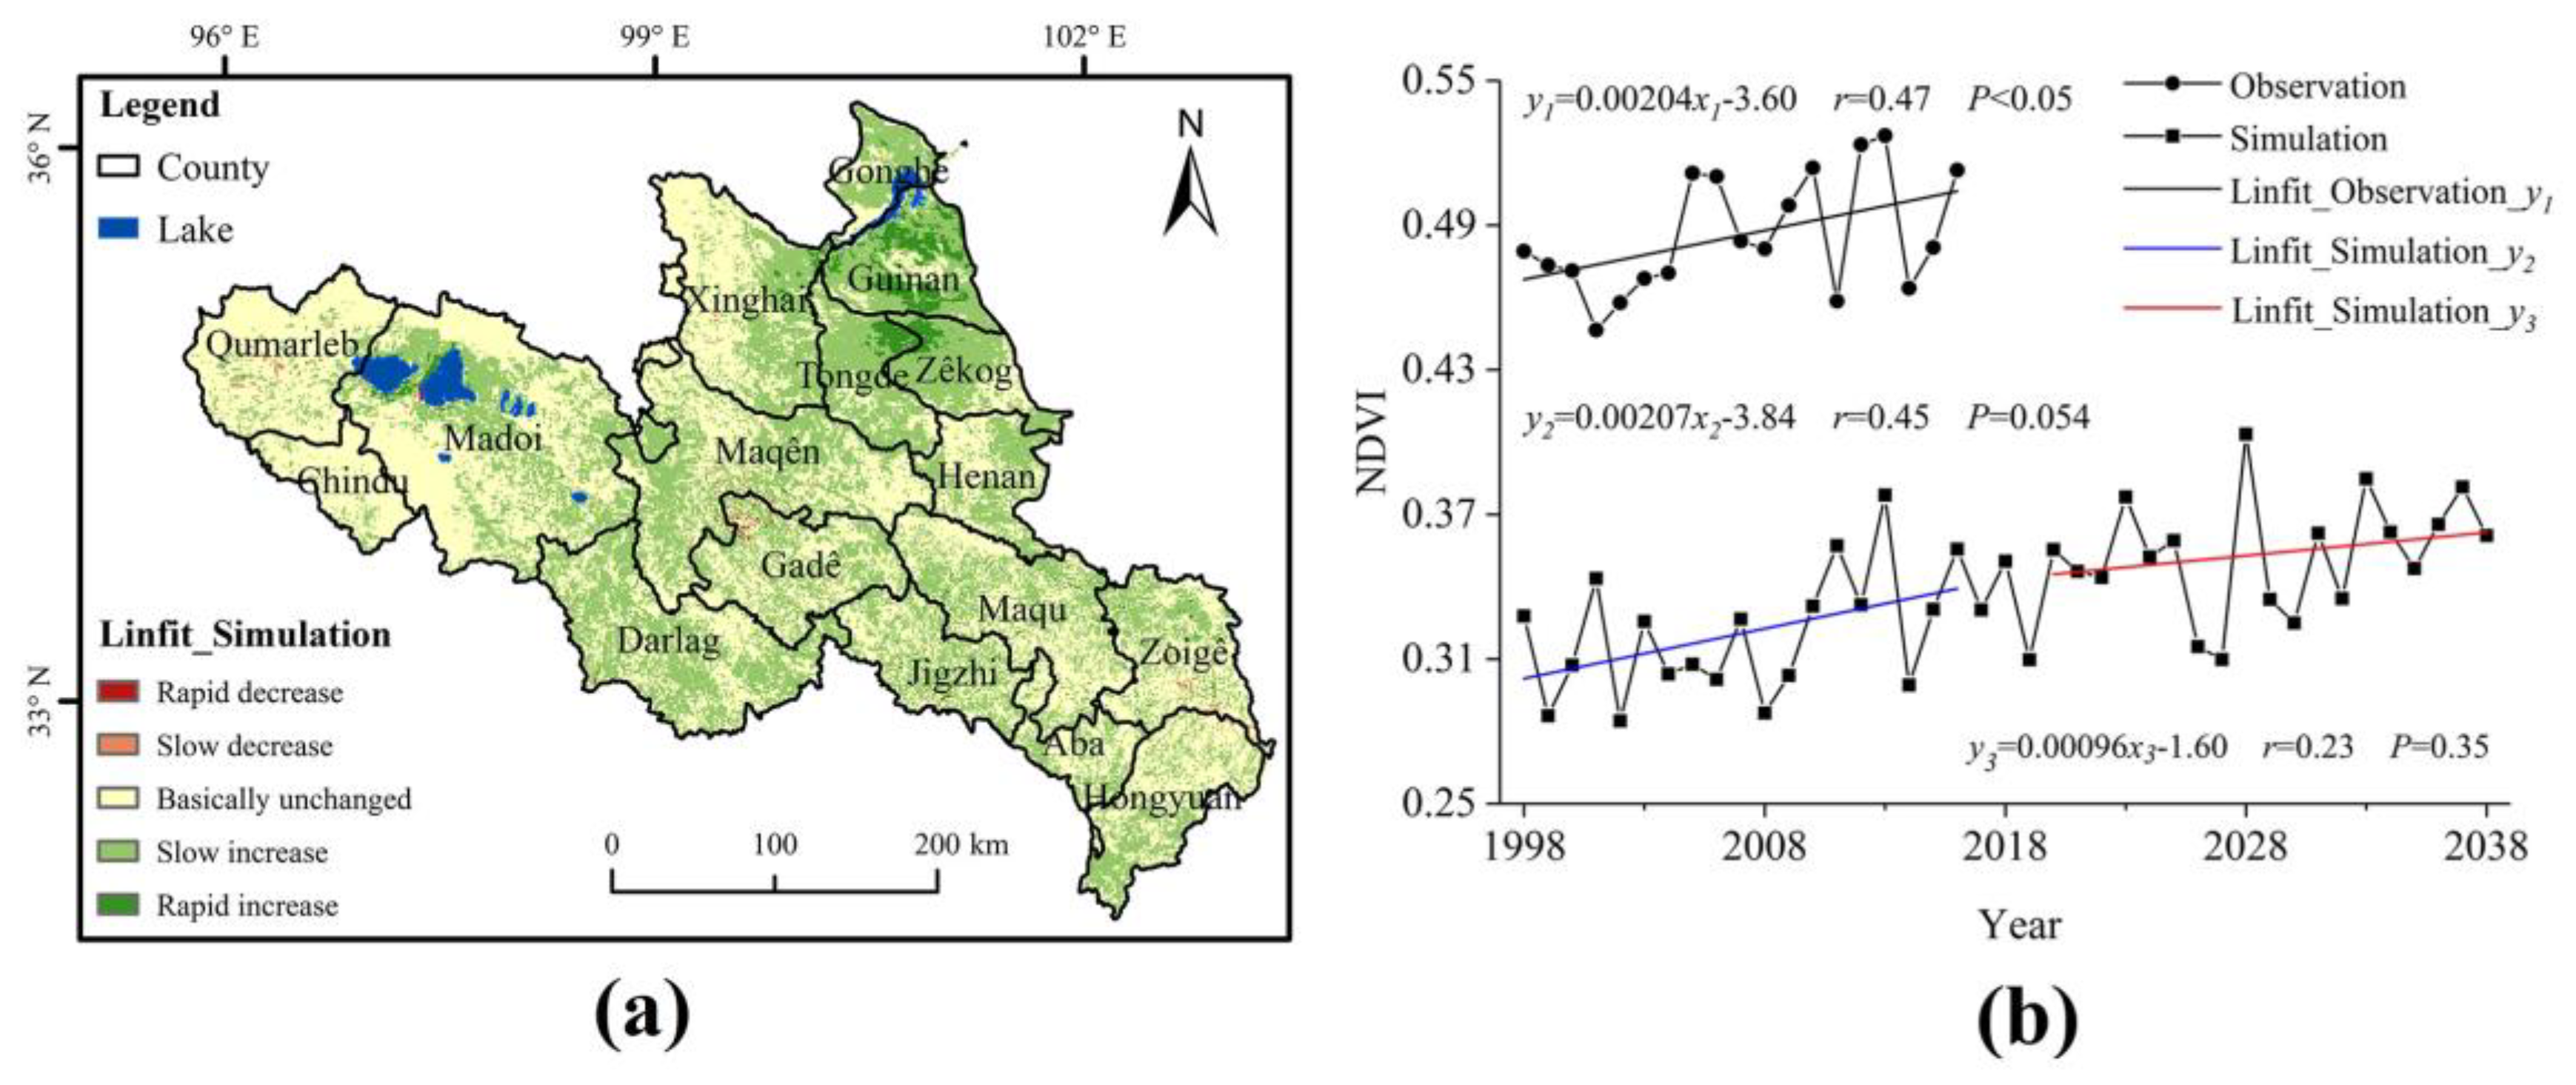
3.4. Trend Prediction
4. Discussion
5. Conclusions
- (1)
- The average NDVI in the growing season was 0.486, which decreased from northwest to southeast and showed obvious regional differences. The NDVI values were concentrated between 0.3 and 0.6 over 50.77% of the total area. The NDVI showed a trend of “increasing overall and decreasing locally”, and 71.40% of the area showed an increasing trend. Among the different land-use types, woodland had the highest NDVI value, and the grassland NDVI trend coincided best with the overall NDVI trend.
- (2)
- From 1998 to 2016, both precipitation and temperature showed an increasing trend. These conditions may be the main reason for the warm and humid climate in the SRYR in recent years. This trend was conducive to the improvement of vegetation. The sensitivity of vegetation and temperature was higher than that of precipitation. Among the different counties, the effects on vegetation were more obvious under unfavourable climate conditions than under suitable ones. The results of the residual analysis indicated that human activities had a positive impact on 46.42% of the SRYR. However, 53.58% of the area was still negatively affected by human activities, which proves that the trend of grassland degradation had not been effectively contained.
- (3)
- The trend simulation results suggested that the NDVI showed a slight upward trend from 2020 to 2038. The NDVI has been increasing rapidly in the areas of Guinan, Zêkog and Tongde. The past and future NDVI trends in the SRYR both demonstrate climate warming and wetting trends, which should arouse attention.
Author Contributions
Funding
Acknowledgments
Conflicts of Interest
References
- Hughes, T.P.; Kerry, J.T.; Connolly, S.R.; Baird, A.H.; Eakin, C.M.; Heron, S.F.; Hoey, A.S.; Hoogenboom, M.O.; Jacobson, M.; Liu, G.; et al. Ecological memory modifies the cumulative impact of recurrent climate extremes. Nat. Clim. Chang. 2019, 9, 40–43. [Google Scholar] [CrossRef]
- Walther, G.R.; Post, E.; Convey, P.; Menzel, A.; Parmesan, C.; Beebee, J.C.; Fromentin, J.M.; Ove, H.G.; Bairlein, F. Ecological responses to recent climate change. Nature 2002, 416, 389–395. [Google Scholar] [CrossRef] [PubMed]
- Wang, C.; Sun, Y.; Li, L.; Zhang, Q. Quantitative evaluation of regional vegetation ecological environment quality by using remotely sensed data over Qingjiang, Hubei. In Proceedings of the SPIE Second International Conference on Space Information Technology, Wuhan, China, 10 November 2007; Volume 6795. [Google Scholar]
- Zhong, B.X.; Jiong, X.X.; Wei, Z. Spatiotemporal variations of vegetation cover on the Chinese Loess Plateau (1981–2006): Impacts of climate changes and human activities. Sci. China Ser. D Earth Sci. 2008, 51, 67–78. [Google Scholar]
- Qin, Z.H.; Zhu, Y.X.; Li, W.J.; Xu, B. Mapping vegetation cover of grassland ecosystem for desertification monitoring in Hulun Buir of Inner Mongolia, China. In Proceedings of the Remote Sensing for Agriculture, Ecosystems, and Hydrology, Cardiff, Wales, UK, 16–18 September 2008; Volume 7104. [Google Scholar]
- Xu, C.; Li, Y.T.; Hu, J.; Yang, X.J.; Sheng, S.; Liu, M.S. Evaluating the difference between the normalized difference vegetation index and net primary productivity as the indicators of vegetation vigor assessment at landscape scale. Environ. Monit. Assess. 2011, 184, 1275–1286. [Google Scholar] [CrossRef] [PubMed]
- Kawabata, A.; Ichii, K.; Yamaguchi, Y. Global monitoring of interannual changes in vegetation activities using NDVI and its relationships to temperature and precipitation. Int. J. Remote Sens. 2001, 22, 1377–1382. [Google Scholar] [CrossRef]
- Liu, X.F.; Zhu, X.F.; Pan, Y.Z.; Li, Y.Z.; Zhao, A.Z. Spatiotemporal changes in vegetation coverage in China during 1982–2012. Acta Ecol. Sin. 2015, 35, 5331–5342. (In Chinese) [Google Scholar]
- Piao, S.L.; Fang, J.Y. Dynamic vegetation cover change over the last 18 years in China. Quat. Sci. 2001, 4, 294–302. (In Chinese) [Google Scholar]
- Xu, G.C.; Zhang, J.X.; Li, P.; Li, Z.B.; Lu, K.X.; Wang, X.K.; Wang, F.C.; Cheng, Y.T.; Wang, B. Vegetation restoration projects and their influence on runoff and sediment in China. Ecol. Indic. 2018, 95, 233–241. [Google Scholar] [CrossRef]
- Zhang, D.D.; Yan, D.H.; Wang, Y.C.; Lu, F.; Wu, D. Changes in extreme precipitation in the Huang-Huai-Hai River basin of China during 1960–2010. Theor. Appl. Climatol. 2015, 120, 195–209. [Google Scholar] [CrossRef]
- Cui, L.F.; Wang, L.C.; Singh, R.P.; Lai, Z.P.; Jiang, L.L.; Yao, R. Association analysis between spatiotemporal variation of vegetation greenness and precipitation/temperature in the Yangtze River Basin (China). Environ. Sci. Pollut. Res. 2018, 25, 21867–21878. [Google Scholar] [CrossRef]
- Xu, W.X.; Liu, X.D. Response of Vegetation in the Qinghai-Tibet Plateau to Global Warming. Chin. Geogr. Sci. 2007, 17, 151–159. [Google Scholar] [CrossRef]
- Hou, W.J.; Gao, J.B.; Wu, S.H.; Dai, E.F. Interannual Variations in Growing-Season NDVI and Its Correlation with Climate Variables in the Southwestern Karst Region of China. Remote Sens. 2015, 7, 11105–11124. [Google Scholar] [CrossRef] [Green Version]
- Jin, H.; He, R.; Cheng, G.; Wu, Q.; Wang, S.; Lü, L.; Chang, X. Changes in frozen ground in the Source Area of the Yellow River on the Qinghai–Tibet Plateau, China, and their eco-environmental impacts. Environ. Res. Lett. 2009, 4, 45206. [Google Scholar] [CrossRef]
- Li, J.; Sheng, Y.; Wu, J.C.; Feng, Z.L.; Ning, Z.J.; Hu, X.Y.; Zhang, X.M. Landform-related permafrost characteristics in the source area of the Yellow River, eastern Qinghai-Tibet Plateau. Geomorphology 2016, 269, 104–111. [Google Scholar] [CrossRef]
- Hu, G.Y.; Jin, H.J.; Dong, Z.B.; Lu, J.F.; Yan, C.Z. Driving forces of aeolian desertification in the source region of the Yellow River: 1975–2005. Environ. Earth Sci. 2013, 70, 3245–3254. [Google Scholar] [CrossRef]
- Zhang, H.W. Ecological protectionand high-quality development in the yellow river basin are guaranteed by scientific management methods. Yellow River 2020, 42, 148–155. (In Chinese) [Google Scholar]
- Qin, Y.; Yang, D.; Gao, B.; Wang, T.; Chen, J.; Chen, Y.; Zheng, G. Impacts of climate warming on the frozen ground and eco-hydrology in the Yellow River source region, China. Sci. Total Environ. 2017, 605, 830–841. [Google Scholar] [CrossRef] [Green Version]
- Mudassar, I.; Wen, J.; Wang, S.P.; Tian, H.; Muhammad, A. Variations of precipitation characteristics during the period 1960–2014 in the Source Region of the Yellow River, China. J. Arid Land 2018, 10, 388–401. [Google Scholar]
- Yang, J.P. Studies on eco-environmental change in source regions of the Yangtze and Yellow Rivers of China: Present and future. Sci. Cold Arid Reg. 2019, 11, 173–183. [Google Scholar]
- Jiang, C.; Zhang, L.B. Climate Change and Its Impact on the Eco-Environment of the Three-Rivers Headwater Region on the Tibetan Plateau, China. Int. J. Environ. Res. Public Health 2015, 12, 12057–12081. [Google Scholar] [CrossRef] [Green Version]
- Guo, W.Q.; Yang, T.B.; Dai, J.G.; Shi, L.; Lu, Z.Y. Vegetation cover changes and their relationship to climate variation in the source region of the Yellow River, China, 1990–2000. Int. J. Remote Sens. 2008, 29, 2085–2103. [Google Scholar] [CrossRef]
- Liang, S.H.; Ge, S.M.; Wan, L.; Xu, D.W. Characteristics and causes of vegetation variation in the source regions of the Yellow River, China. Int. J. Remote Sens. 2012, 33, 1529–1542. [Google Scholar] [CrossRef]
- Adnani, A.E.; Habib, A.; Khalidi, K.E.; Zourarah, B. Spatio-Temporal Dynamics and Evolution of Land Use Land Cover Using Remote Sensing and GIS in Sebou Estuary, Morocco. J. Geogr. Inf. Syst. 2019, 11, 551–566. [Google Scholar] [CrossRef] [Green Version]
- Iqbal, M.; Wen, J.; Lan, Y.C.; Anjum, M.N.; Adnan, M.; Wang, X.; Tian, H. Assessment of Air Temperature Trends in the Source Region of Yellow River and Its Sub-Basins, China. Asia-Pac. J. Atmos. Sci. 2018, 54, 111–123. [Google Scholar] [CrossRef]
- Hu, Y.R.; Maskey, S.; Uhlenbrook, S.; Zhao, H.L. Streamflow trends and climate linkages in the source region of the Yellow River, China. Hydrol. Process. 2011, 25, 3399–3411. [Google Scholar] [CrossRef]
- Li, L.; Shen, H.Y.; Dai, S.; Xiao, J.S.; Shi, X.H. Response of runoff to climate change and its future tendency in the source region of Yellow River. J. Geogr. Sci. 2012, 22, 431–440. [Google Scholar] [CrossRef]
- Xu, X.L. China Monthly Vegetation Index (NDVI) spatial distribution data set. In Data Registration and Publishing System of the Resource and Environmental Data Cloud Platform Centre of the Chinese Academy of Sciences; Resource and Environmental Data Cloud Platform Centre of the Chinese Academy of Sciences: Beijing, China, 2020. (In Chinese) [Google Scholar]
- Xu, Y.; Gao, X.J.; Shen, Y.; Xu, C.H.; Shi, Y.; Giorgi, F. A Daily Temperature Dataset over China and Its Application in Validating a RCM Simulation. Adv. Atmos. Sci. 2009, 26, 763–772. [Google Scholar] [CrossRef]
- Wu, J.; Gao, X.J. Simulation of tropical cyclones over the western north pacific and landfalling in China by REGCM4. J. Trop. Meteorol. 2019, 25, 437–447. [Google Scholar]
- Chu, L.; Huang, C.; Liu, G.H.; Liu, Q.S.; Zhao, J. Analysis on vegetation changes of Maqu alpine wetlands in the Yellow River source region. In Proceedings of the Land Surface Remote Sensing II, Beijing, China, 13–16 October 2014; Volume 9260. [Google Scholar]
- Pirnia, A.; Darabi, H.; Choubin, B.; Omidvar, E.; Onyutha, C.; Haghighi, A.T. Contribution of climatic variability and human activities to stream flow changes in the Haraz River basin, northern Iran. J. Hydro-Environ. Res. 2019, 25, 12–24. [Google Scholar] [CrossRef]
- Evans, J.; Geerken, R. Discrimination between climate and human-induced dryland degradation. J. Arid Environ. 2004, 57, 535–554. [Google Scholar] [CrossRef]
- Chen, H.; Liu, X.N.; Ding, C.; Huang, F. Phenology-Based Residual Trend Analysis of MODIS-NDVI Time Series for Assessing Human-Induced Land Degradation. Sensors 2018, 18, 3676. [Google Scholar] [CrossRef] [PubMed] [Green Version]
- Yuan, L.H.; Chen, X.Q.; Wang, X.Y.; Xiong, Z.; Song, C.Q. Spatial associations between NDVI and environmental factors in the Heihe River Basin. J. Geogr. Sci. 2019, 29, 1548–1564. [Google Scholar] [CrossRef] [Green Version]
- Morecroft, M.D.; Paterson, J.S. Effects of temperature and precipitation changes on plant communities. Plant Growth Clim. Chang. 2006, 16, 146–164. [Google Scholar]
- Nemani, R.; Keeling, C.; Hashimoto, H.; Jolly, W.; Piper, S.; Tucker, C.; Myneni, R.; Running, S. Climate-driven increases in global terrestrial net primary production from1982 to 1999. Science 2003, 300, 1560–1563. [Google Scholar] [CrossRef] [Green Version]
- Liu, S.L.; Zhao, H.D.; Su, X.K.; Deng, L.; Dong, S.K.; Zhang, X. Spatio-temporal variability in rangeland conditions associated with climate change in the Altun Mountain National Nature Reserve on the Qinghai-Tibet Plateau over the past 15 years. Rangel. J. 2015, 37, 67. [Google Scholar] [CrossRef]
- McGuire, A.D.; Sturm, M.; Chapin, F.S., III. Arctic Transitions in the Land–Atmosphere System (ATLAS): Background, objectives, results, and future directions. J. Geophys. Res.-Atmos. 2003, 108. [Google Scholar] [CrossRef]
- Peng, J.F.; Gou, X.H.; Chen, F.H.; Li, J.B.; Liu, P.B.; Zhang, Y. Altitudinal variability of climate–tree growth relationships along a consistent slope of Anyemaqen Mountains, northeastern Tibetan Plateau. Dendrochronologia 2008, 26, 87–96. [Google Scholar] [CrossRef]
- Liu, L.S.; Zhang, Y.L.; Bai, W.Q.; Yan, J.Z.; Ding, M.J.; Shen, Z.X.; Li, S.C.; Zheng, D. Characteristics of grassland degradation and driving forces in the source region of the Yellow River from 1985 to 2000. J. Geogr. Sci. 2006, 16, 131–142. [Google Scholar] [CrossRef]
- Shao, Q.Q.; Liu, J.Y.; Huang, L.; Fan, J.W.; Xu, X.L.; Wang, J.B. Integrated assessment on the effectiveness of ecological conservation in Sanjiangyuan National Nature Reserve. Geogr. Res. 2013, 32, 1645–1656. (In Chinese) [Google Scholar]
- Anderson, K.; Fawcett, D.; Cugulliere, A.; Benford, S.; Jones, D.; Leng, R. Vegetation expansion in the subnival Hindu Kush Himalaya. Glob. Chang. Biol. 2020, 26, 1608–1625. [Google Scholar] [CrossRef] [Green Version]
- He, H.; Li, H.; Zhu, J.; Mao, S.; Li, Y.; Yang, Y.; Zhang, F. Effects of Grazing Exclusion on Soil Properties in Maqin Alpine Meadow, Tibetan Plateau, China. Pol. J. Environ. Stud. 2016, 25, 1583–1587. [Google Scholar]
- Li, Q.; Yang, M.X.; Wan, G.N.; Wang, X.J. Spatial and temporal precipitation variability in the source region of the Yellow River. Environ. Earth Sci. 2016, 75, 594. [Google Scholar] [CrossRef]
- Hu, Y.; Maskey, S.; Uhlenbrook, S. Trends in temperature and rainfall extremes in the Yellow River source region, China. Clim. Chang. 2012, 110, 403–429. [Google Scholar] [CrossRef] [Green Version]
- Chen, L.; Chang, J.X.; Wang, Y.M. Assessing runoff sensitivities to precipitation and temperature changes under global climate-change scenarios. Hydrol. Res. 2018, 50, 24–42. [Google Scholar] [CrossRef]
- Du, Q.Q.; Zhang, M.J.; Wang, S.J. Changes in air temperature over China in response to the recent global warming hiatus. Acta Geogr. Sin. 2019, 29, 496–516. [Google Scholar] [CrossRef] [Green Version]
- Chen, F.; Zhang, Y.; Shao, X.M.; Li, M.Q.; Yin, Z.Y. A 2000-year temperature reconstruction in the Animaqin Mountains of the Tibet Plateau, China. Holocene 2016, 26, 1904–1913. [Google Scholar] [CrossRef]
- Yang, Z.P.; Gao, J.X.; Zhou, C.P.; Shi, P.L.; Zhao, L.; Shen, W.S.; Ouyang, H. Spatio-temporal changes of NDVI and its relation with climatic variables in the source regions of the Yangtze and Yellow rivers. J. Geogr. Sci. 2011, 21, 979–993. [Google Scholar] [CrossRef]


| Countie | Mean NDVI Value | Land-Use Types/% | |||||
|---|---|---|---|---|---|---|---|
| Crop- Land | Wood- Land | Grass- Land | Water Body | Built-Up Land | Unused Land | ||
| The source region of the Yellow River (SRYR) | 0.486 | 0.94 | 6.77 | 74.45 | 2.27 | 0.13 | 15.44 |
| Zoigê | 0.674 | 0.03 | 0.75 | 70.44 | 1.07 | 0.27 | 27.44 |
| Hongyuan | 0.674 | 0.03 | 7.26 | 79.62 | 0.03 | 0.23 | 12.83 |
| Aba | 0.666 | / | 8.37 | 85.57 | 0.09 | / | 5.98 |
| Henan | 0.655 | / | 15.75 | 78.45 | 0.80 | 0.12 | 4.87 |
| Maqu | 0.640 | / | 8.10 | 73.75 | 1.72 | 0.09 | 16.34 |
| Jigzhi | 0.602 | / | 10.18 | 86.04 | 0.71 | 0.03 | 3.03 |
| Zêkog | 0.593 | 1.49 | 2.90 | 78.88 | 0.44 | 0.05 | 16.24 |
| Gadê | 0.558 | / | 12.72 | 82.55 | 0.62 | 0.03 | 4.08 |
| Tongde | 0.540 | 7.91 | 22.89 | 58.34 | 1.08 | 0.17 | 9.61 |
| Maqên | 0.485 | 0.02 | 16.29 | 68.29 | 1.88 | 0.12 | 13.40 |
| Darlag | 0.476 | / | 2.23 | 88.94 | 0.95 | 0.01 | 7.88 |
| Xinghai | 0.424 | 0.50 | 10.98 | 67.47 | 0.87 | 0.08 | 20.11 |
| Guinan | 0.410 | 11.14 | 2.43 | 65.73 | 3.00 | 0.21 | 17.49 |
| Chindu | 0.396 | / | / | 84.65 | 1.44 | / | 13.91 |
| Madoi | 0.324 | / | 0.20 | 74.21 | 7.22 | 0.01 | 18.36 |
| Qumarleb | 0.290 | / | / | 62.51 | 1.50 | 0.01 | 35.98 |
| Gonghe | 0.257 | 3.70 | 1.20 | 63.47 | 7.57 | 2.50 | 21.56 |
| Climate Elements | SRYR | Cropland | Woodland | Grassland | Unused Land |
|---|---|---|---|---|---|
| Pre | 0.221 | 0.669 * | 0.276 | 0.216 | 0.230 |
| Tm | 0.467 | 0.363 | 0.471 | 0.490 | 0.411 |
| Counties | Pre | Tm | ||||
|---|---|---|---|---|---|---|
| Mean Value/mm | Correlation Coefficients | Significant Correlation Proportion/% | Mean Value/°C | Correlation Coefficients | Significant Correlation Proportion/% | |
| SRYR | 449.52 | 0.221 | 31.01 | 6.42 | 0.467 | 56.40 |
| Zoigê | 547.11 | 0.285 | 30.79 | 8.75 | 0.499 | 64.41 |
| Hongyuan | 623.22 | 0.257 | 24.30 | 7.96 | 0.556 | 75.39 |
| Aba | 609.28 | 0.206 | 19.24 | 8.27 | 0.588 * | 83.15 |
| Henan | 512.34 | 0.332 | 28.92 | 7.19 | 0.524 | 72.32 |
| Maqu | 567.74 | 0.181 | 19.97 | 7.49 | 0.510 | 66.48 |
| Jigzhi | 633.57 | 0.066 | 17.13 | 6.00 | 0.541 | 74.71 |
| Zêkog | 459.47 | 0.519 | 62.79 | 7.50 | 0.550 * | 81.04 |
| Gadê | 522.78 | 0.060 | 16.72 | 5.20 | 0.459 | 52.45 |
| Tongde | 447.81 | 0.443 | 45.50 | 7.95 | 0.442 | 47.50 |
| Maqên | 450.46 | 0.137 | 24.35 | 5.07 | 0.417 | 44.27 |
| Darlag | 494.39 | 0.084 | 24.02 | 5.14 | 0.535 | 70.44 |
| Xinghai | 376.10 | 0.372 | 46.62 | 6.76 | 0.292 | 16.94 |
| Guinan | 392.23 | 0.553 | 71.08 | 10.09 | 0.366 | 34.68 |
| Chindu | 350.83 | 0.036 | 11.72 | 4.29 | 0.560 | 72.07 |
| Madoi | 319.84 | 0.144 | 31.09 | 5.05 | 0.474 | 58.37 |
| Qumarleb | 267.72 | 0.228 | 27.97 | 4.87 | 0.456 | 53.48 |
| Gonghe | 379.30 | 0.439 | 54.92 | 11.00 | 0.252 | 10.80 |
© 2020 by the authors. Licensee MDPI, Basel, Switzerland. This article is an open access article distributed under the terms and conditions of the Creative Commons Attribution (CC BY) license (http://creativecommons.org/licenses/by/4.0/).
Share and Cite
Wang, M.; Fu, J.; Wu, Z.; Pang, Z. Spatiotemporal Variation of NDVI in the Vegetation Growing Season in the Source Region of the Yellow River, China. ISPRS Int. J. Geo-Inf. 2020, 9, 282. https://0-doi-org.brum.beds.ac.uk/10.3390/ijgi9040282
Wang M, Fu J, Wu Z, Pang Z. Spatiotemporal Variation of NDVI in the Vegetation Growing Season in the Source Region of the Yellow River, China. ISPRS International Journal of Geo-Information. 2020; 9(4):282. https://0-doi-org.brum.beds.ac.uk/10.3390/ijgi9040282
Chicago/Turabian StyleWang, Mingyue, Jun’e Fu, Zhitao Wu, and Zhiguo Pang. 2020. "Spatiotemporal Variation of NDVI in the Vegetation Growing Season in the Source Region of the Yellow River, China" ISPRS International Journal of Geo-Information 9, no. 4: 282. https://0-doi-org.brum.beds.ac.uk/10.3390/ijgi9040282