Damage Signature Generation of Revetment Surface along Urban Rivers Using UAV-Based Mapping


Abstract
:1. Introduction
2. Study Area and Materials
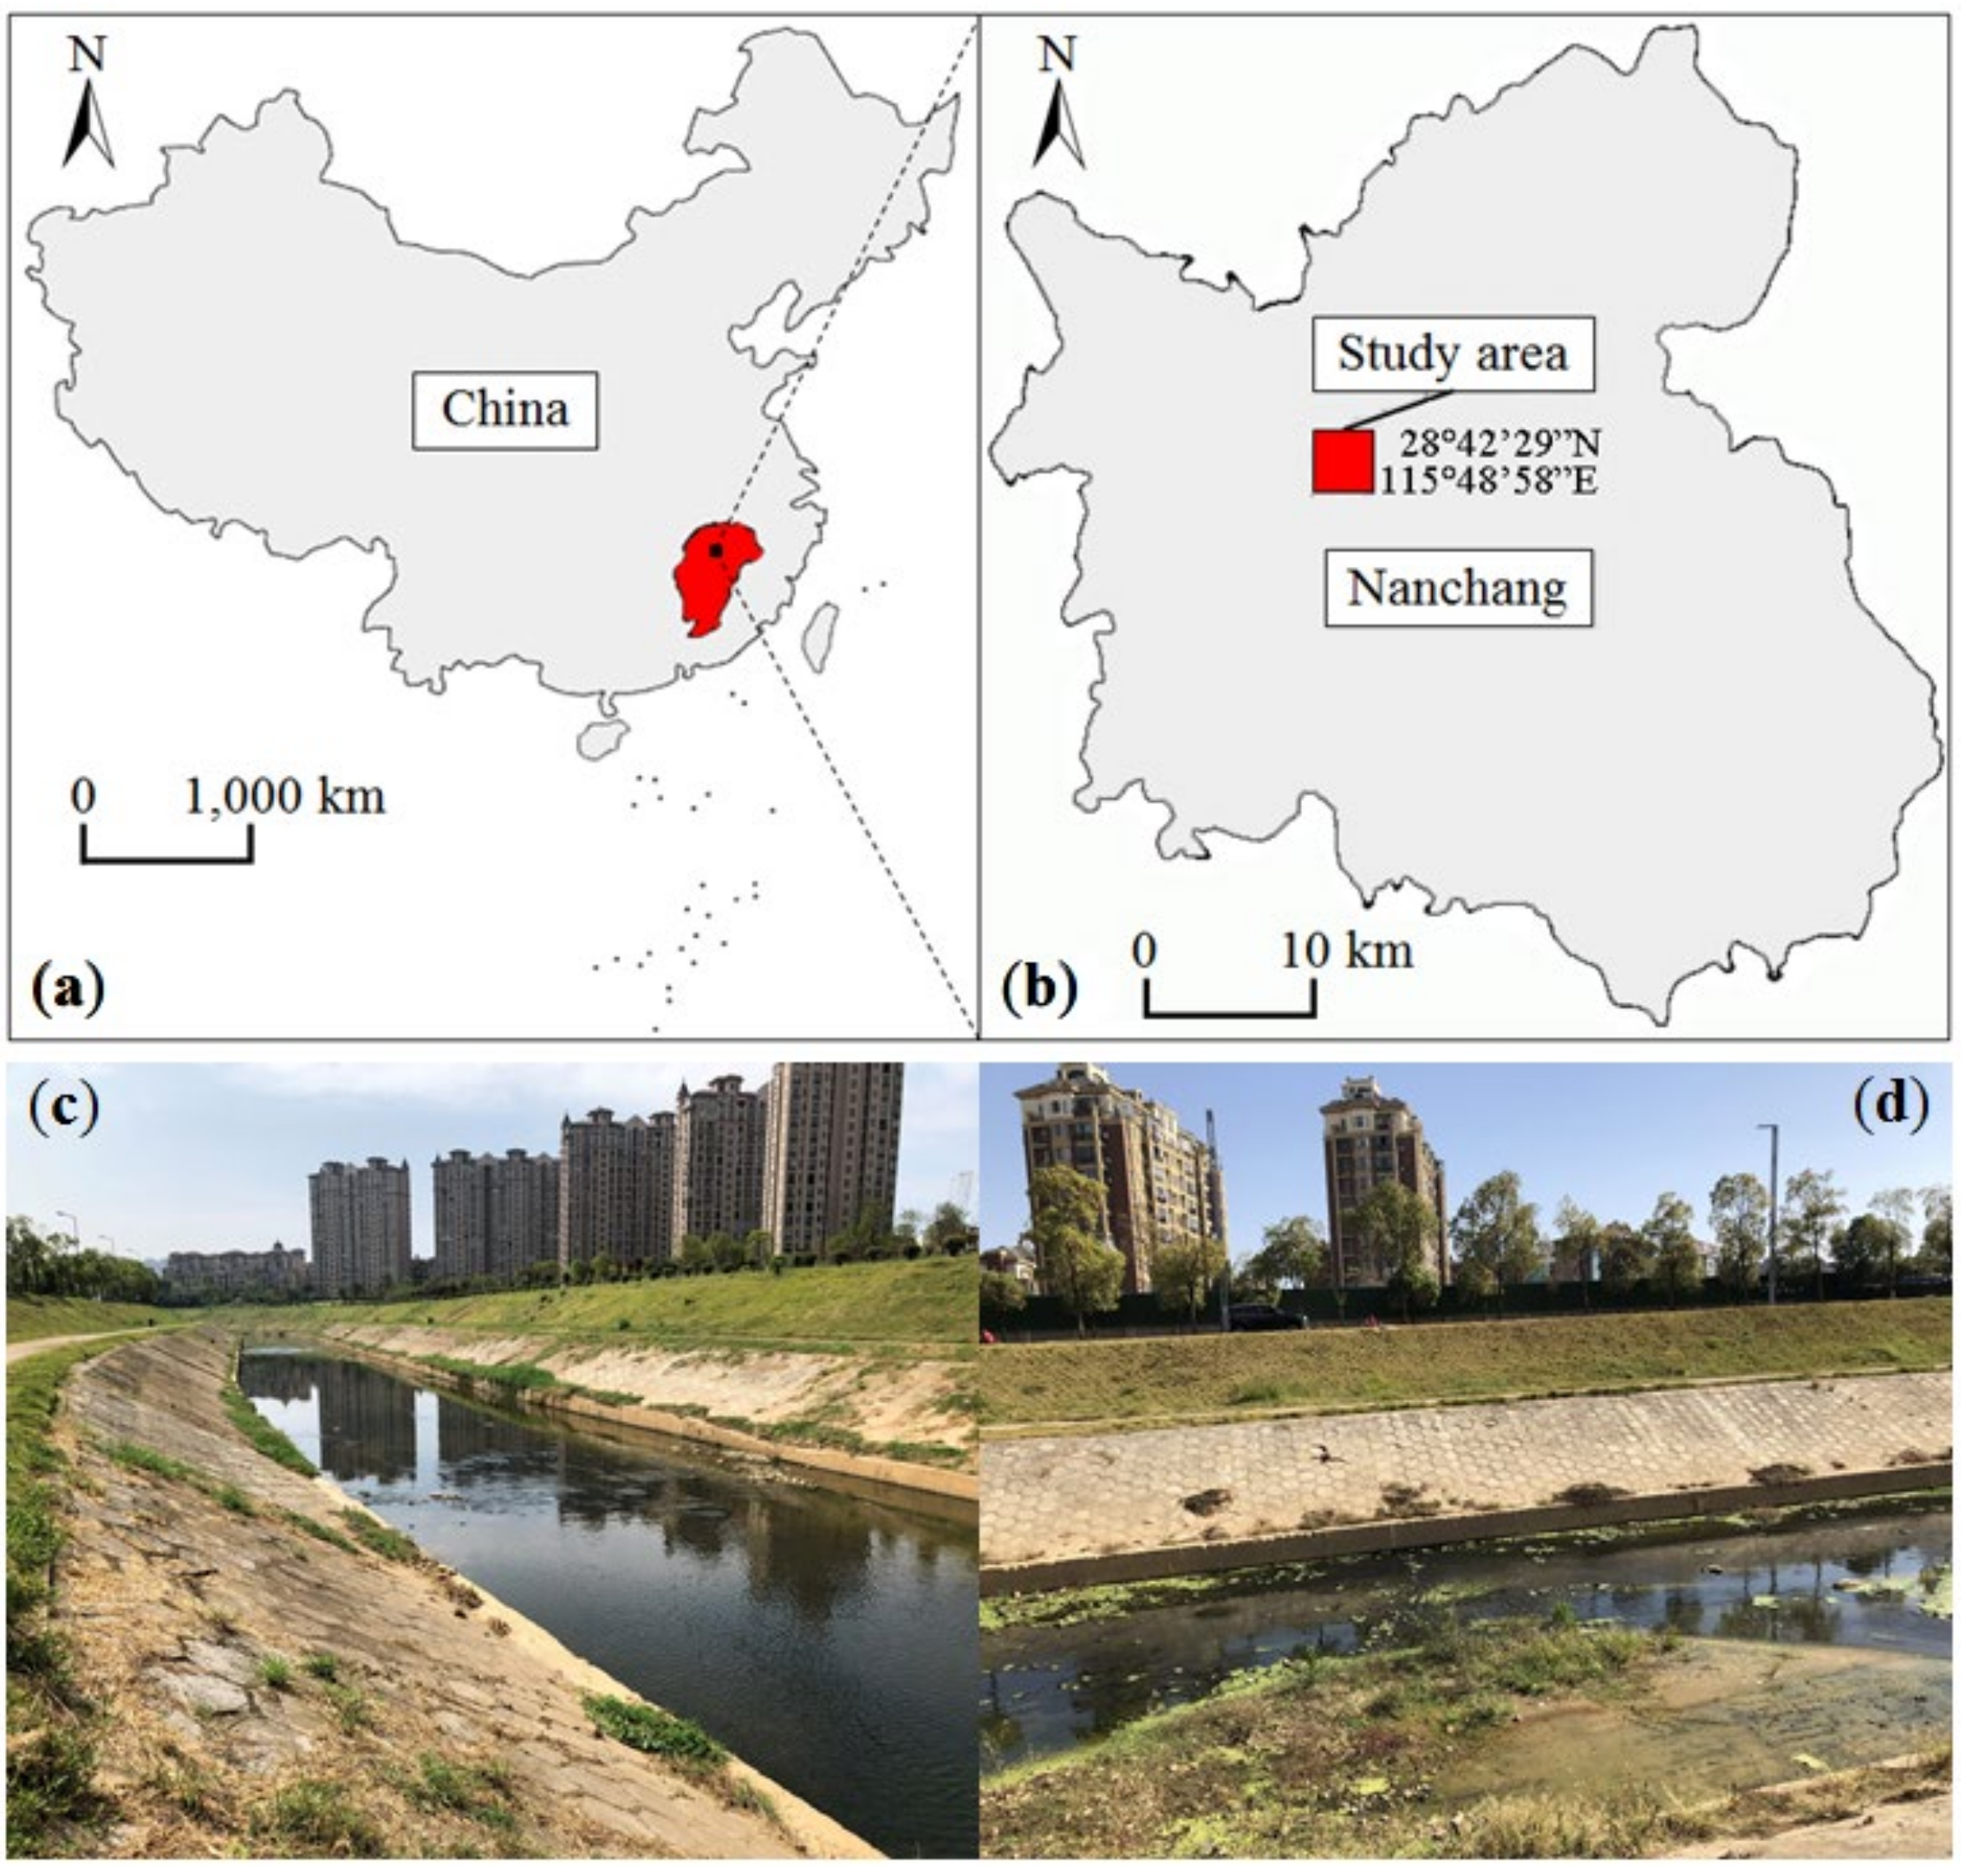
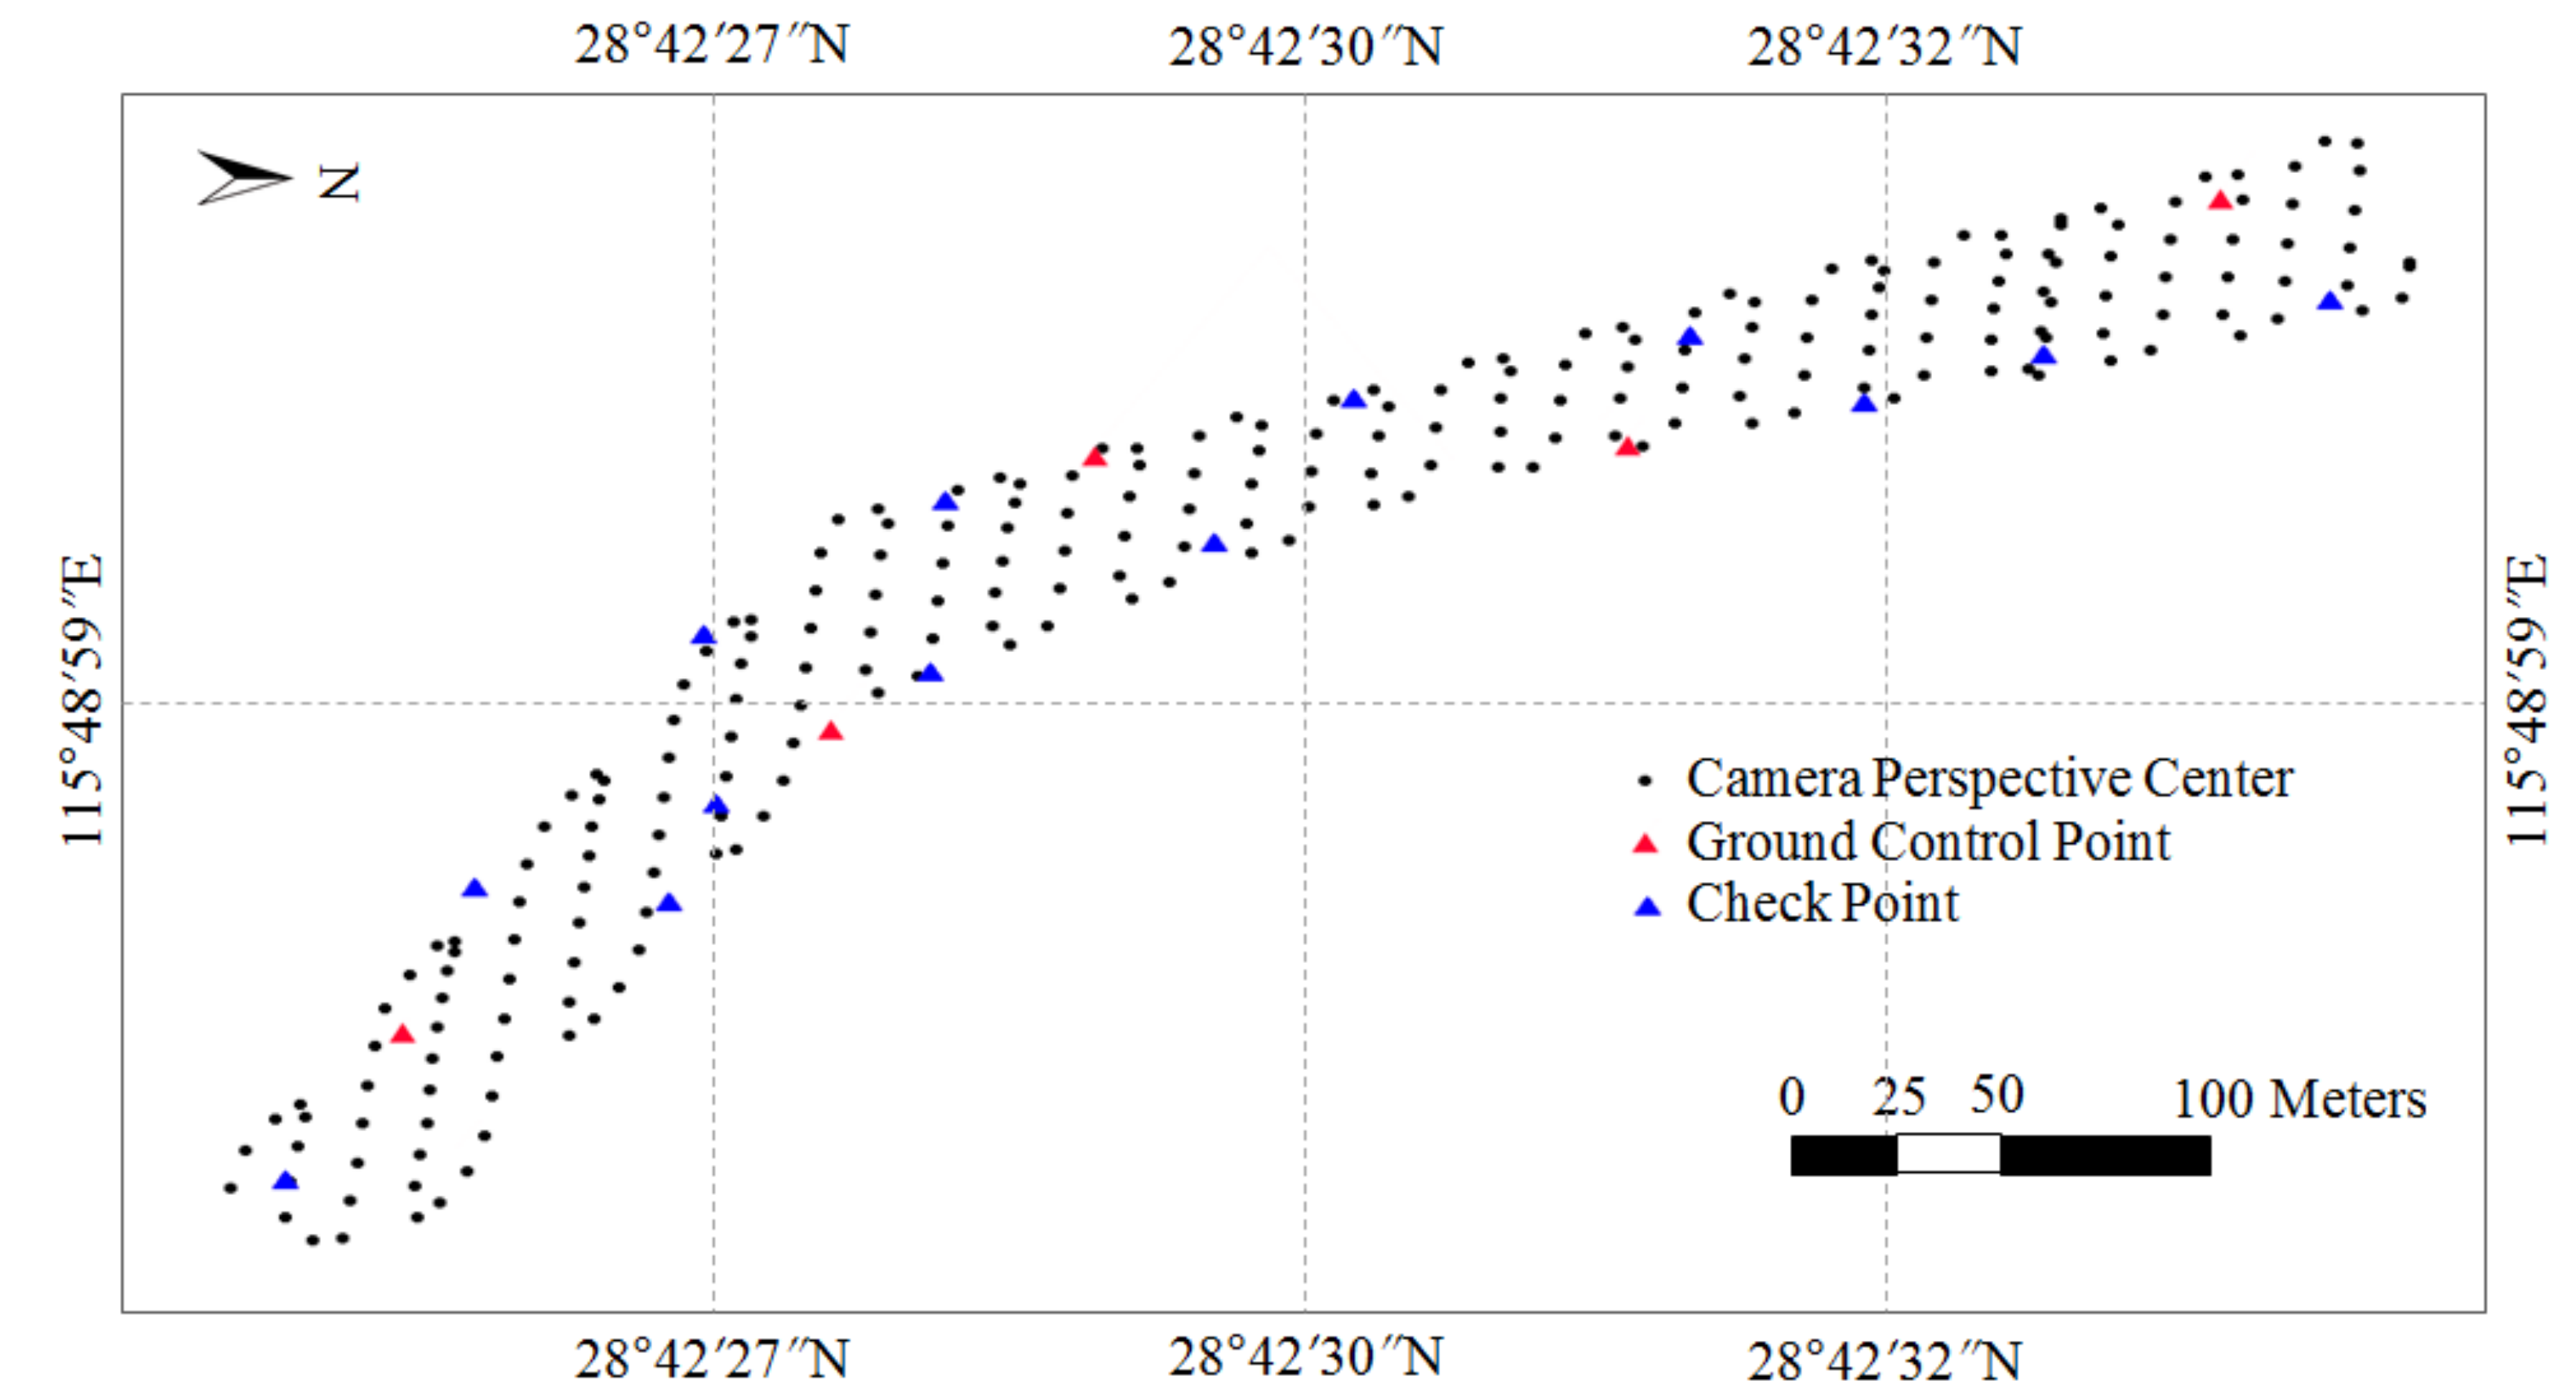
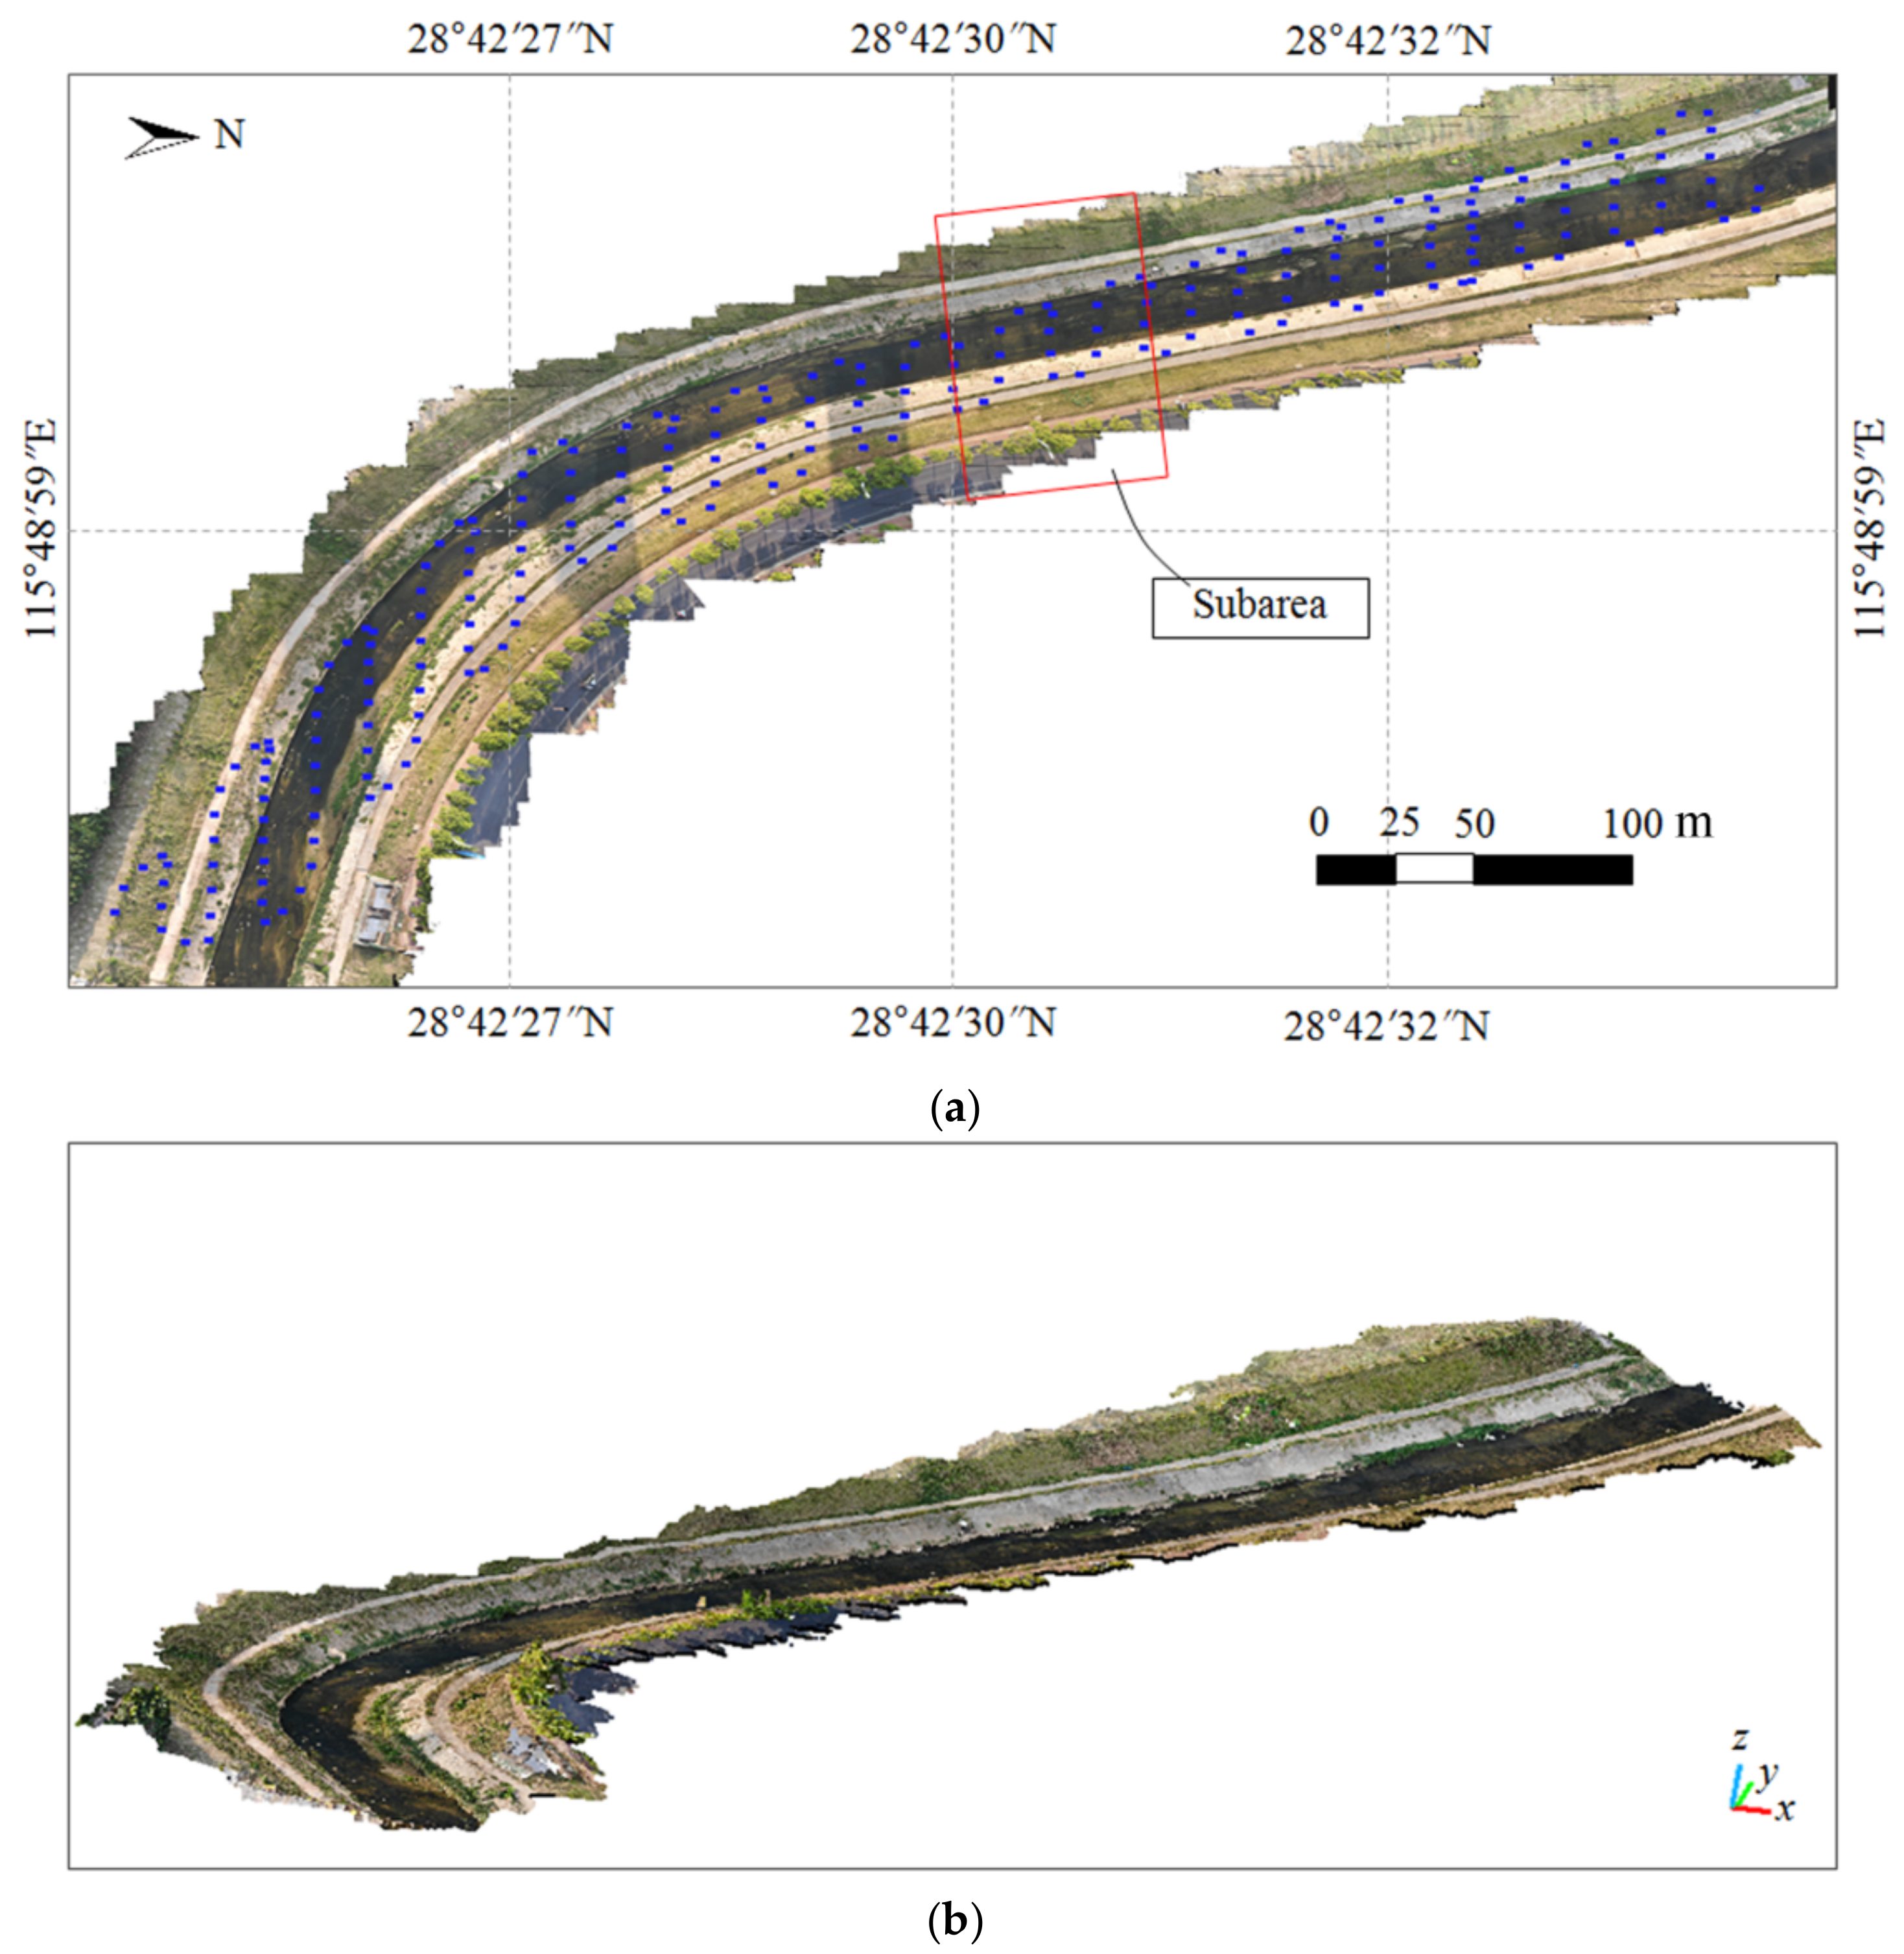
2.1. Test Site
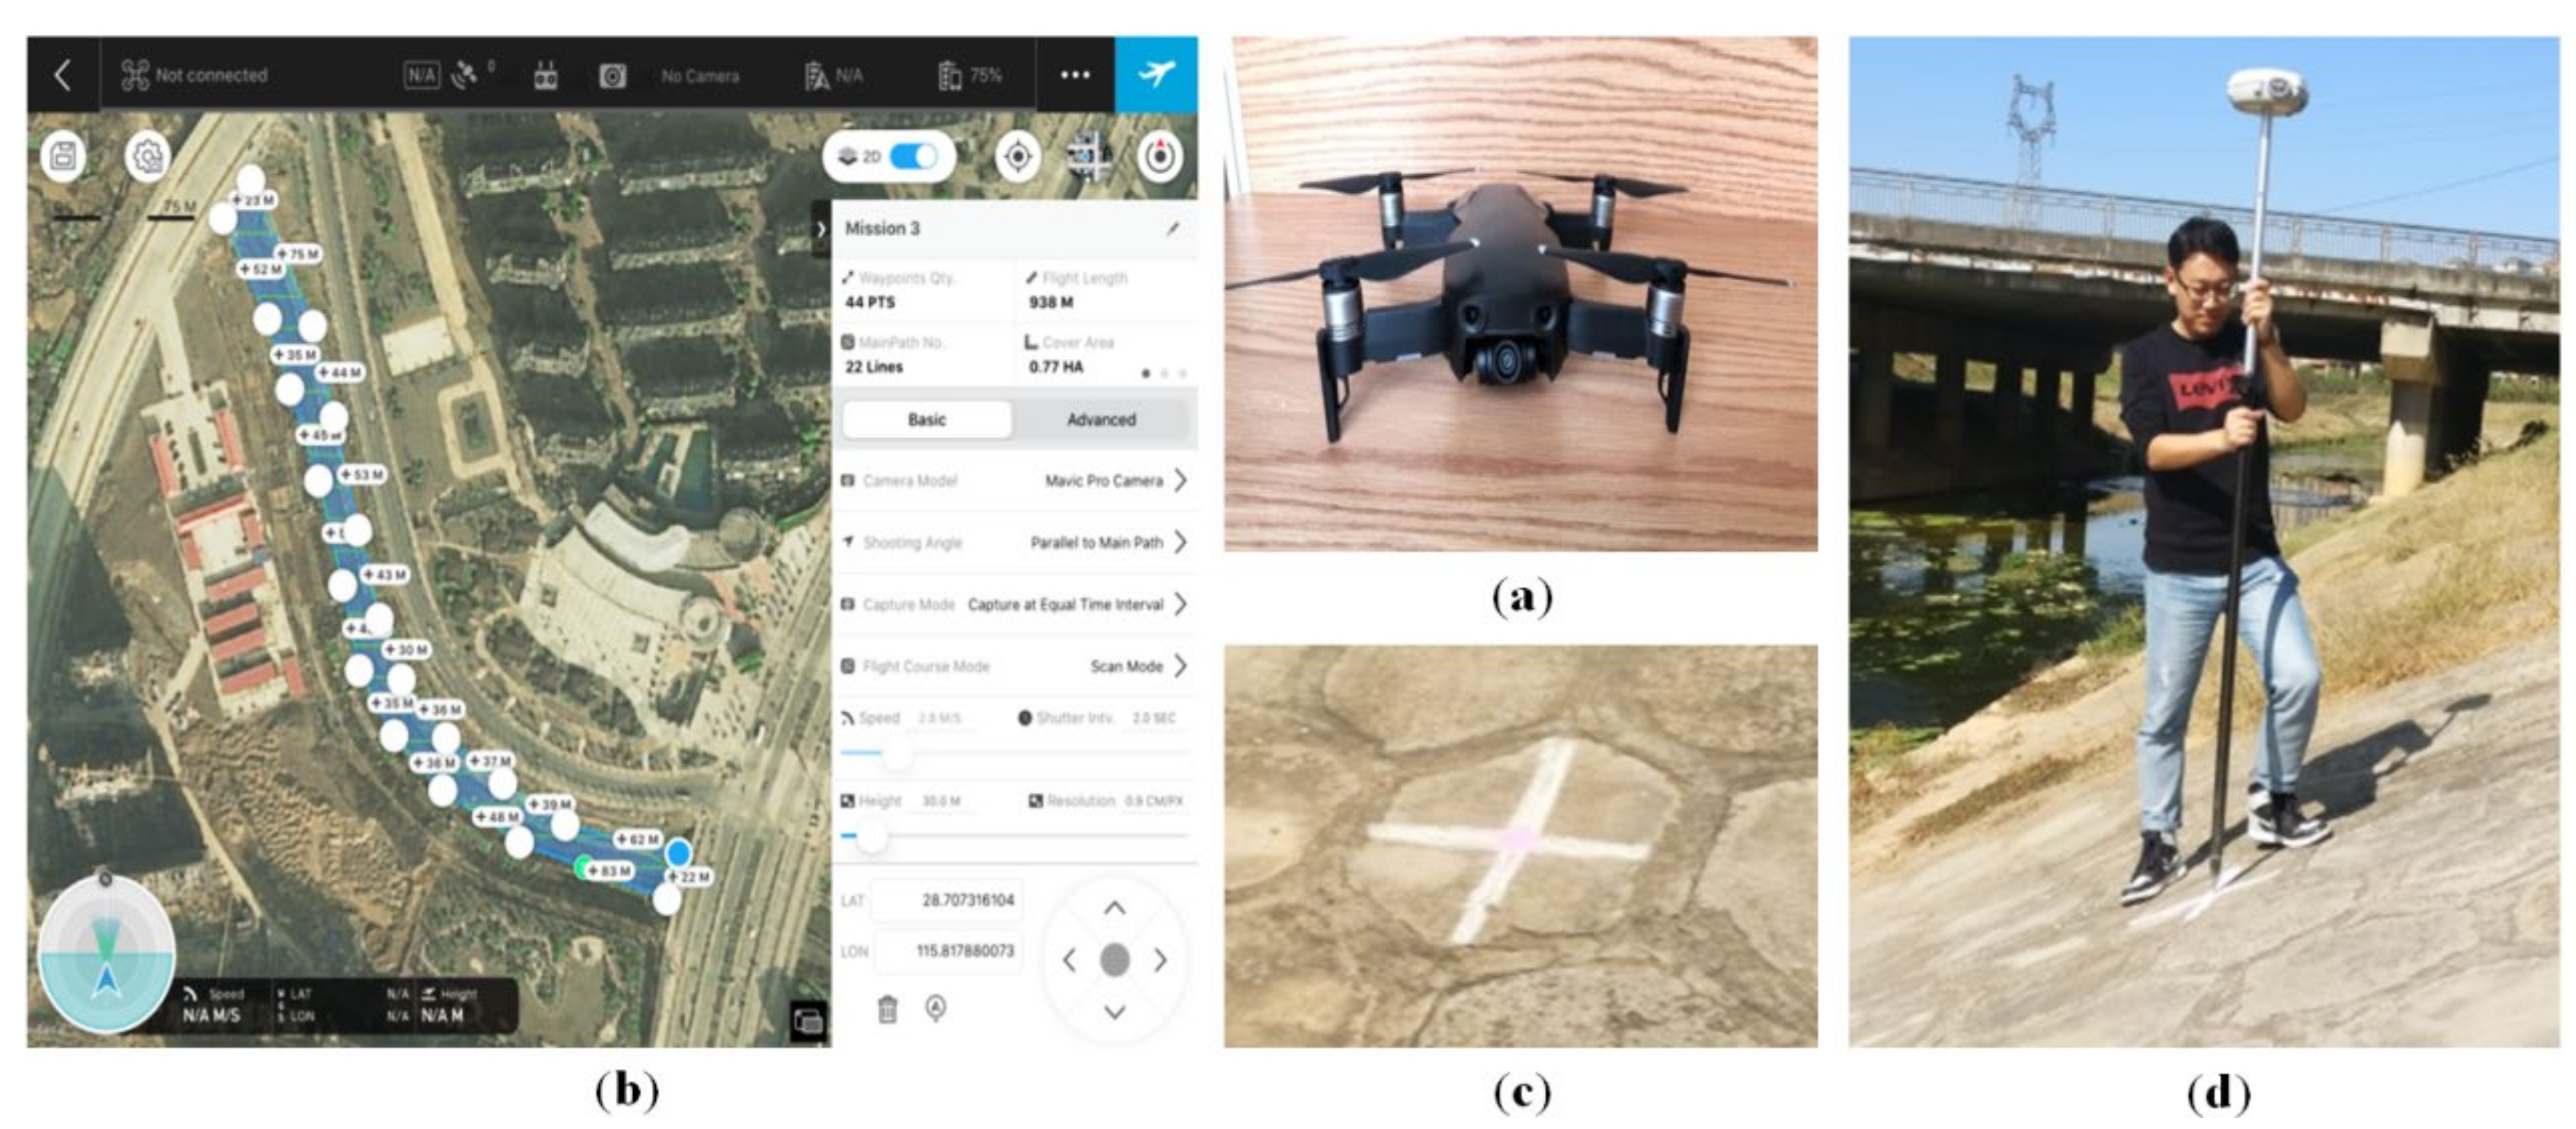
2.2. Acquisition of UAV Remote-Sensed Images and Measurement of Ground Control Points (GCPs)
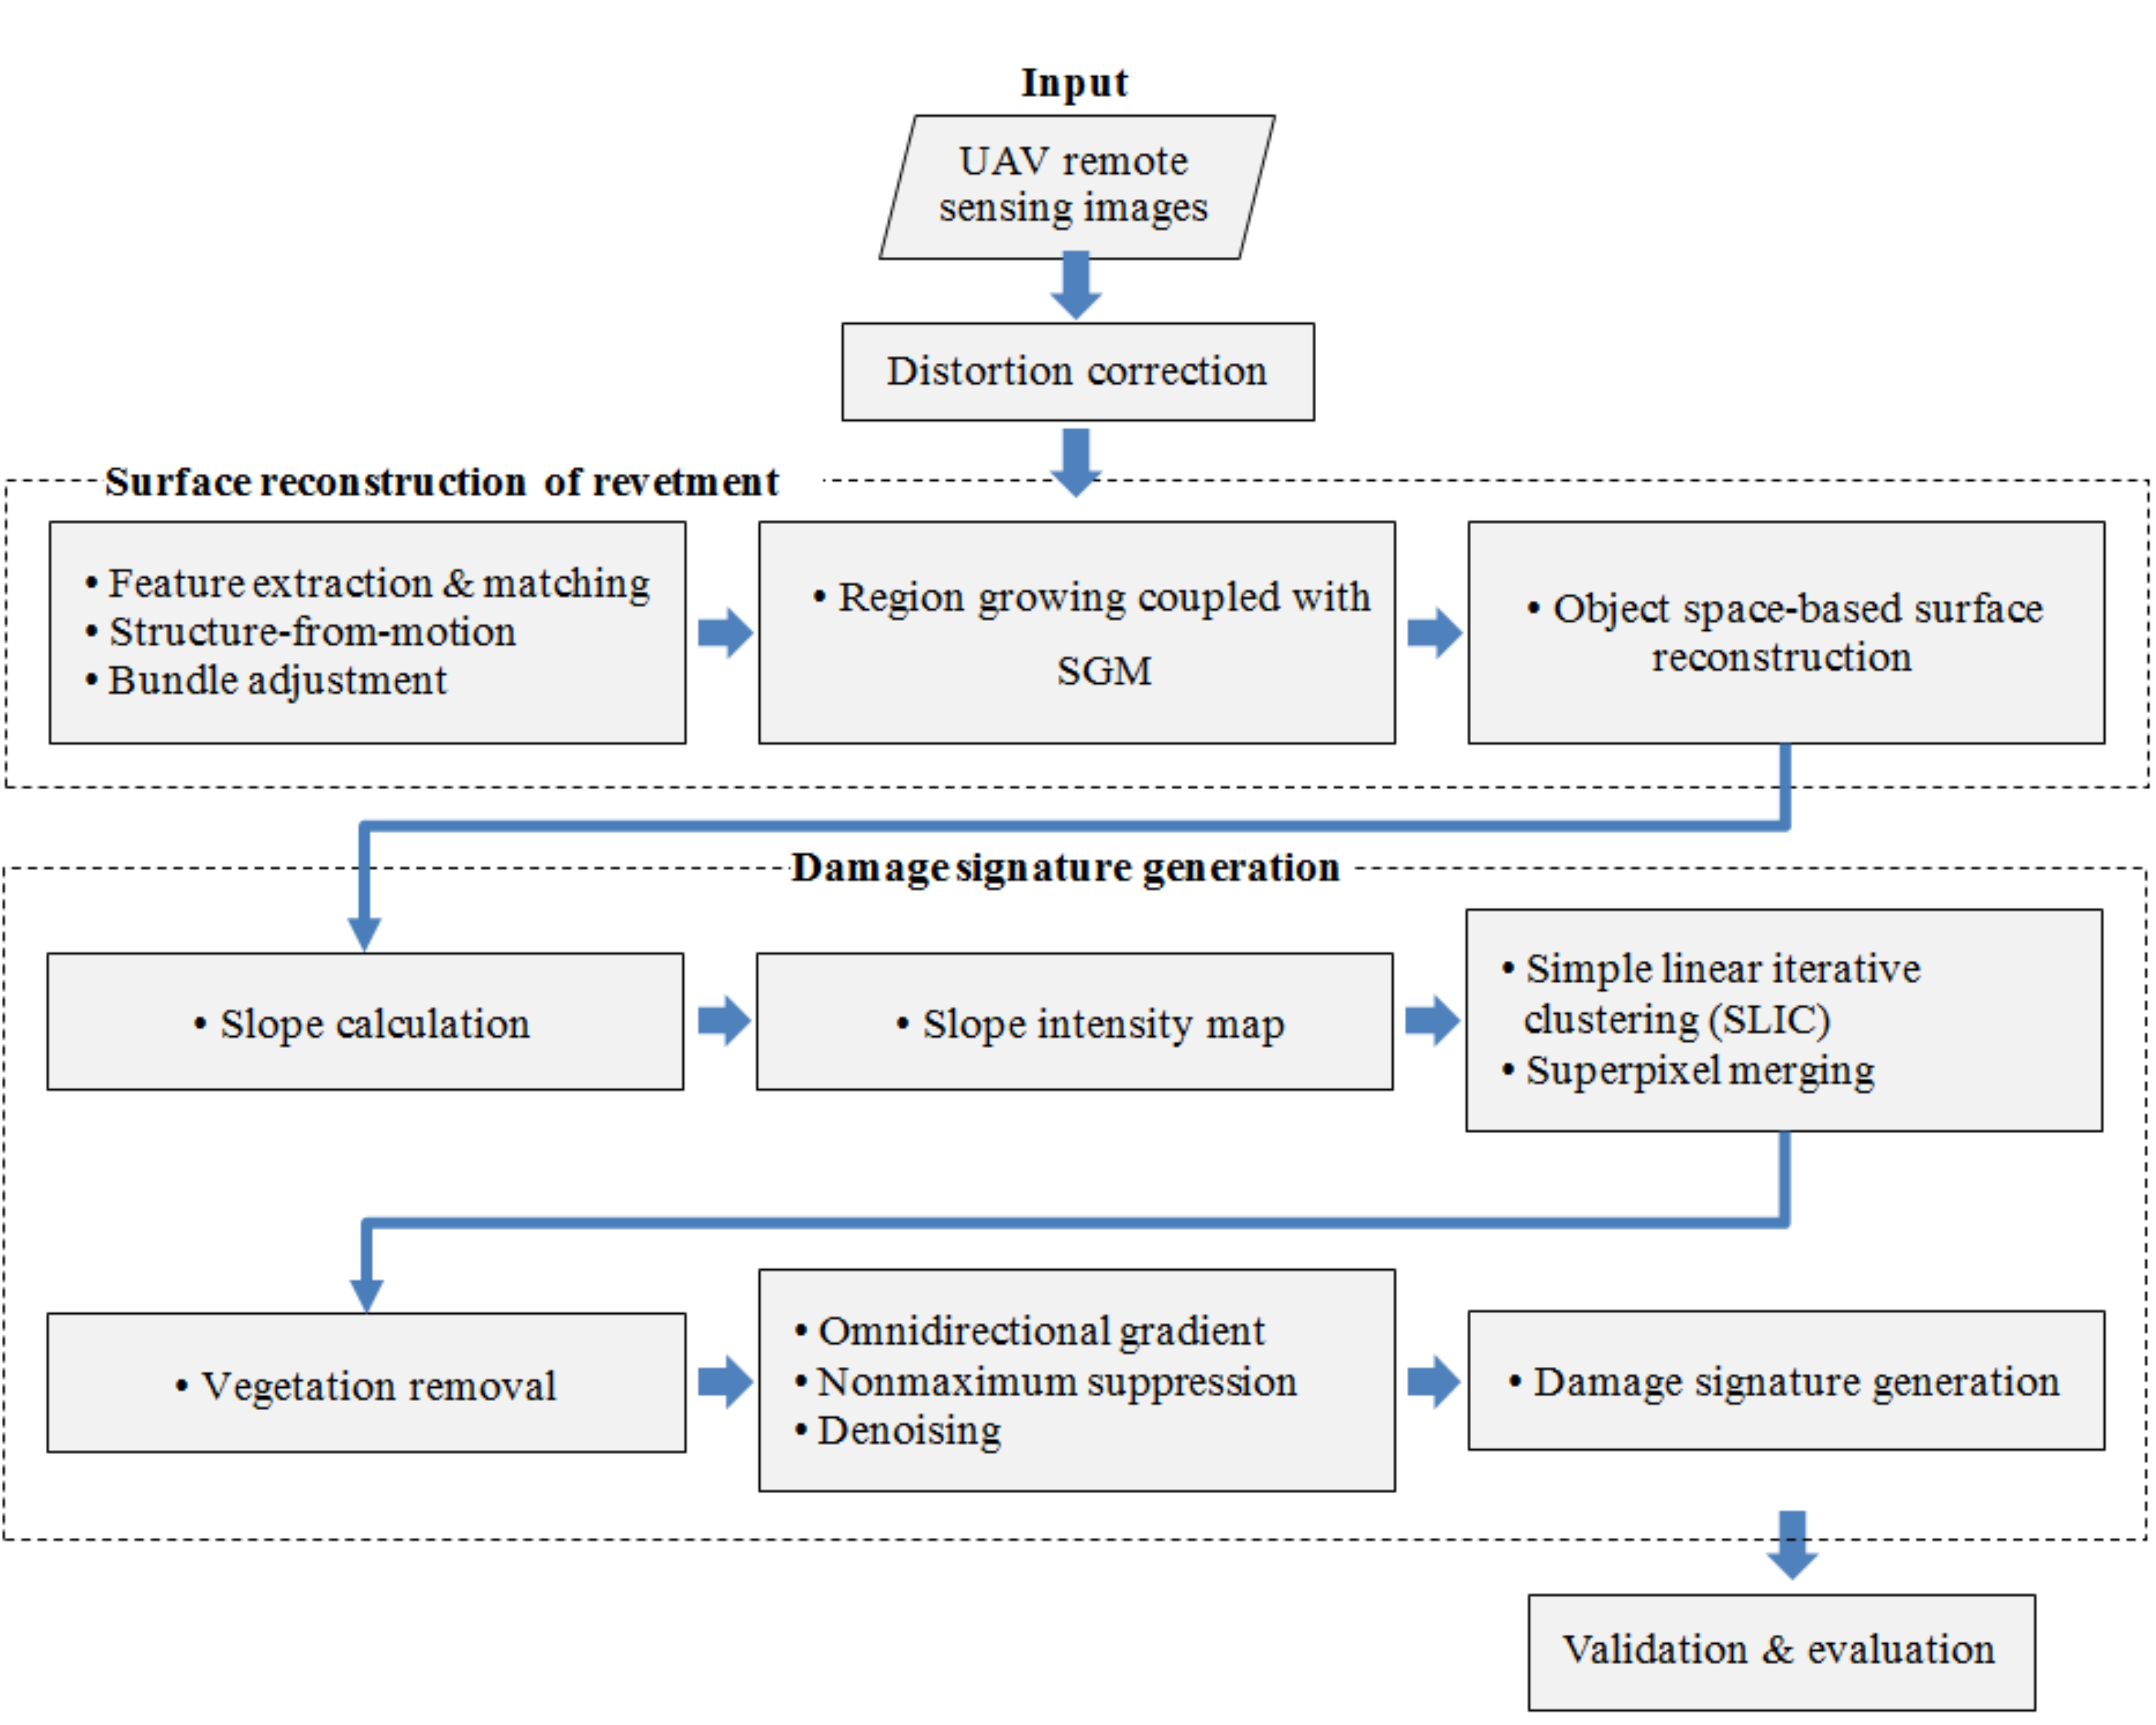
3. Method
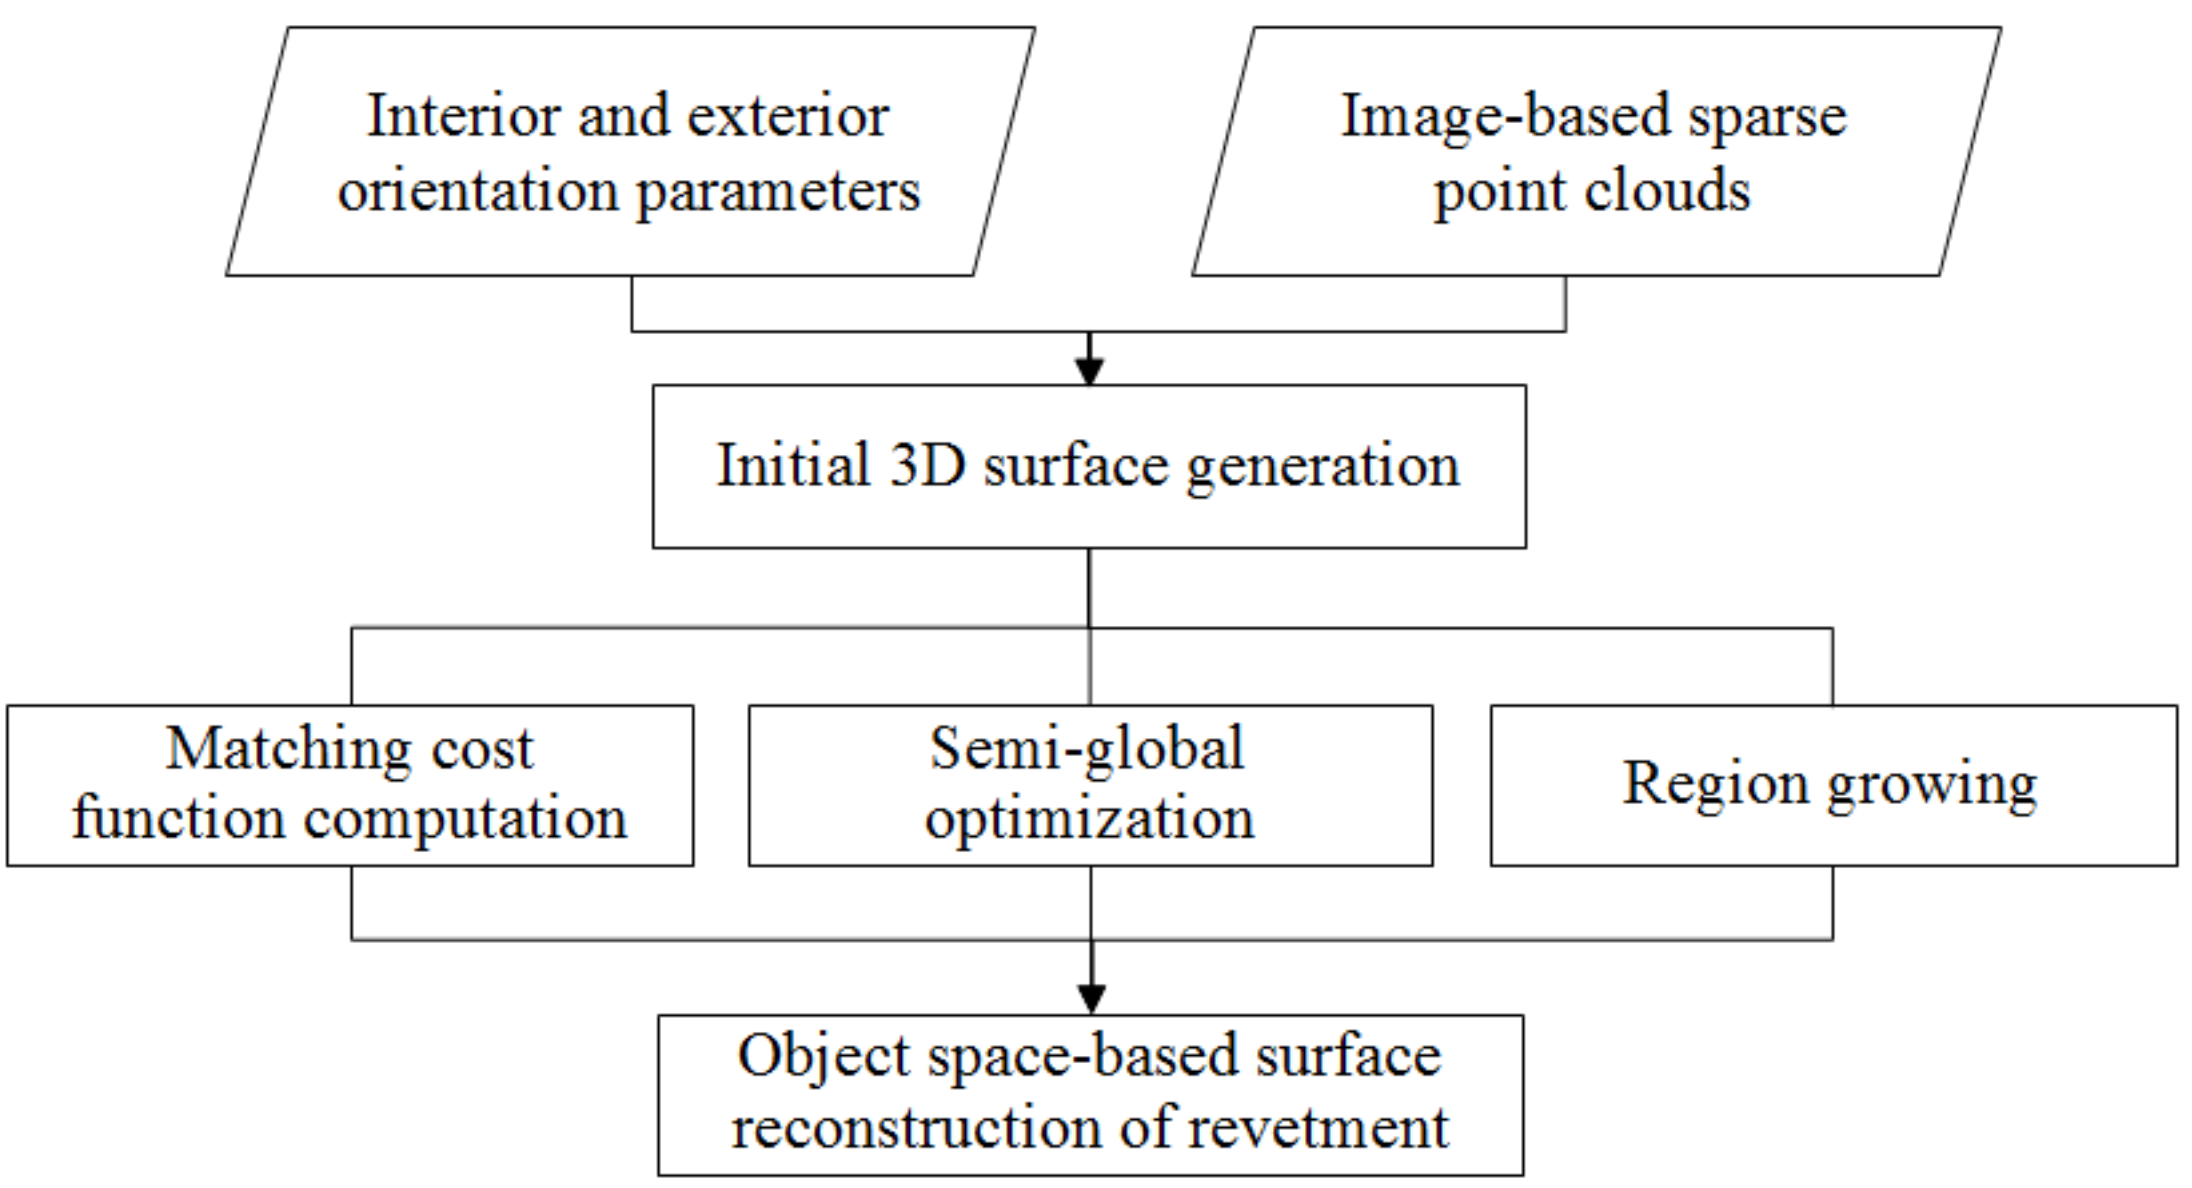
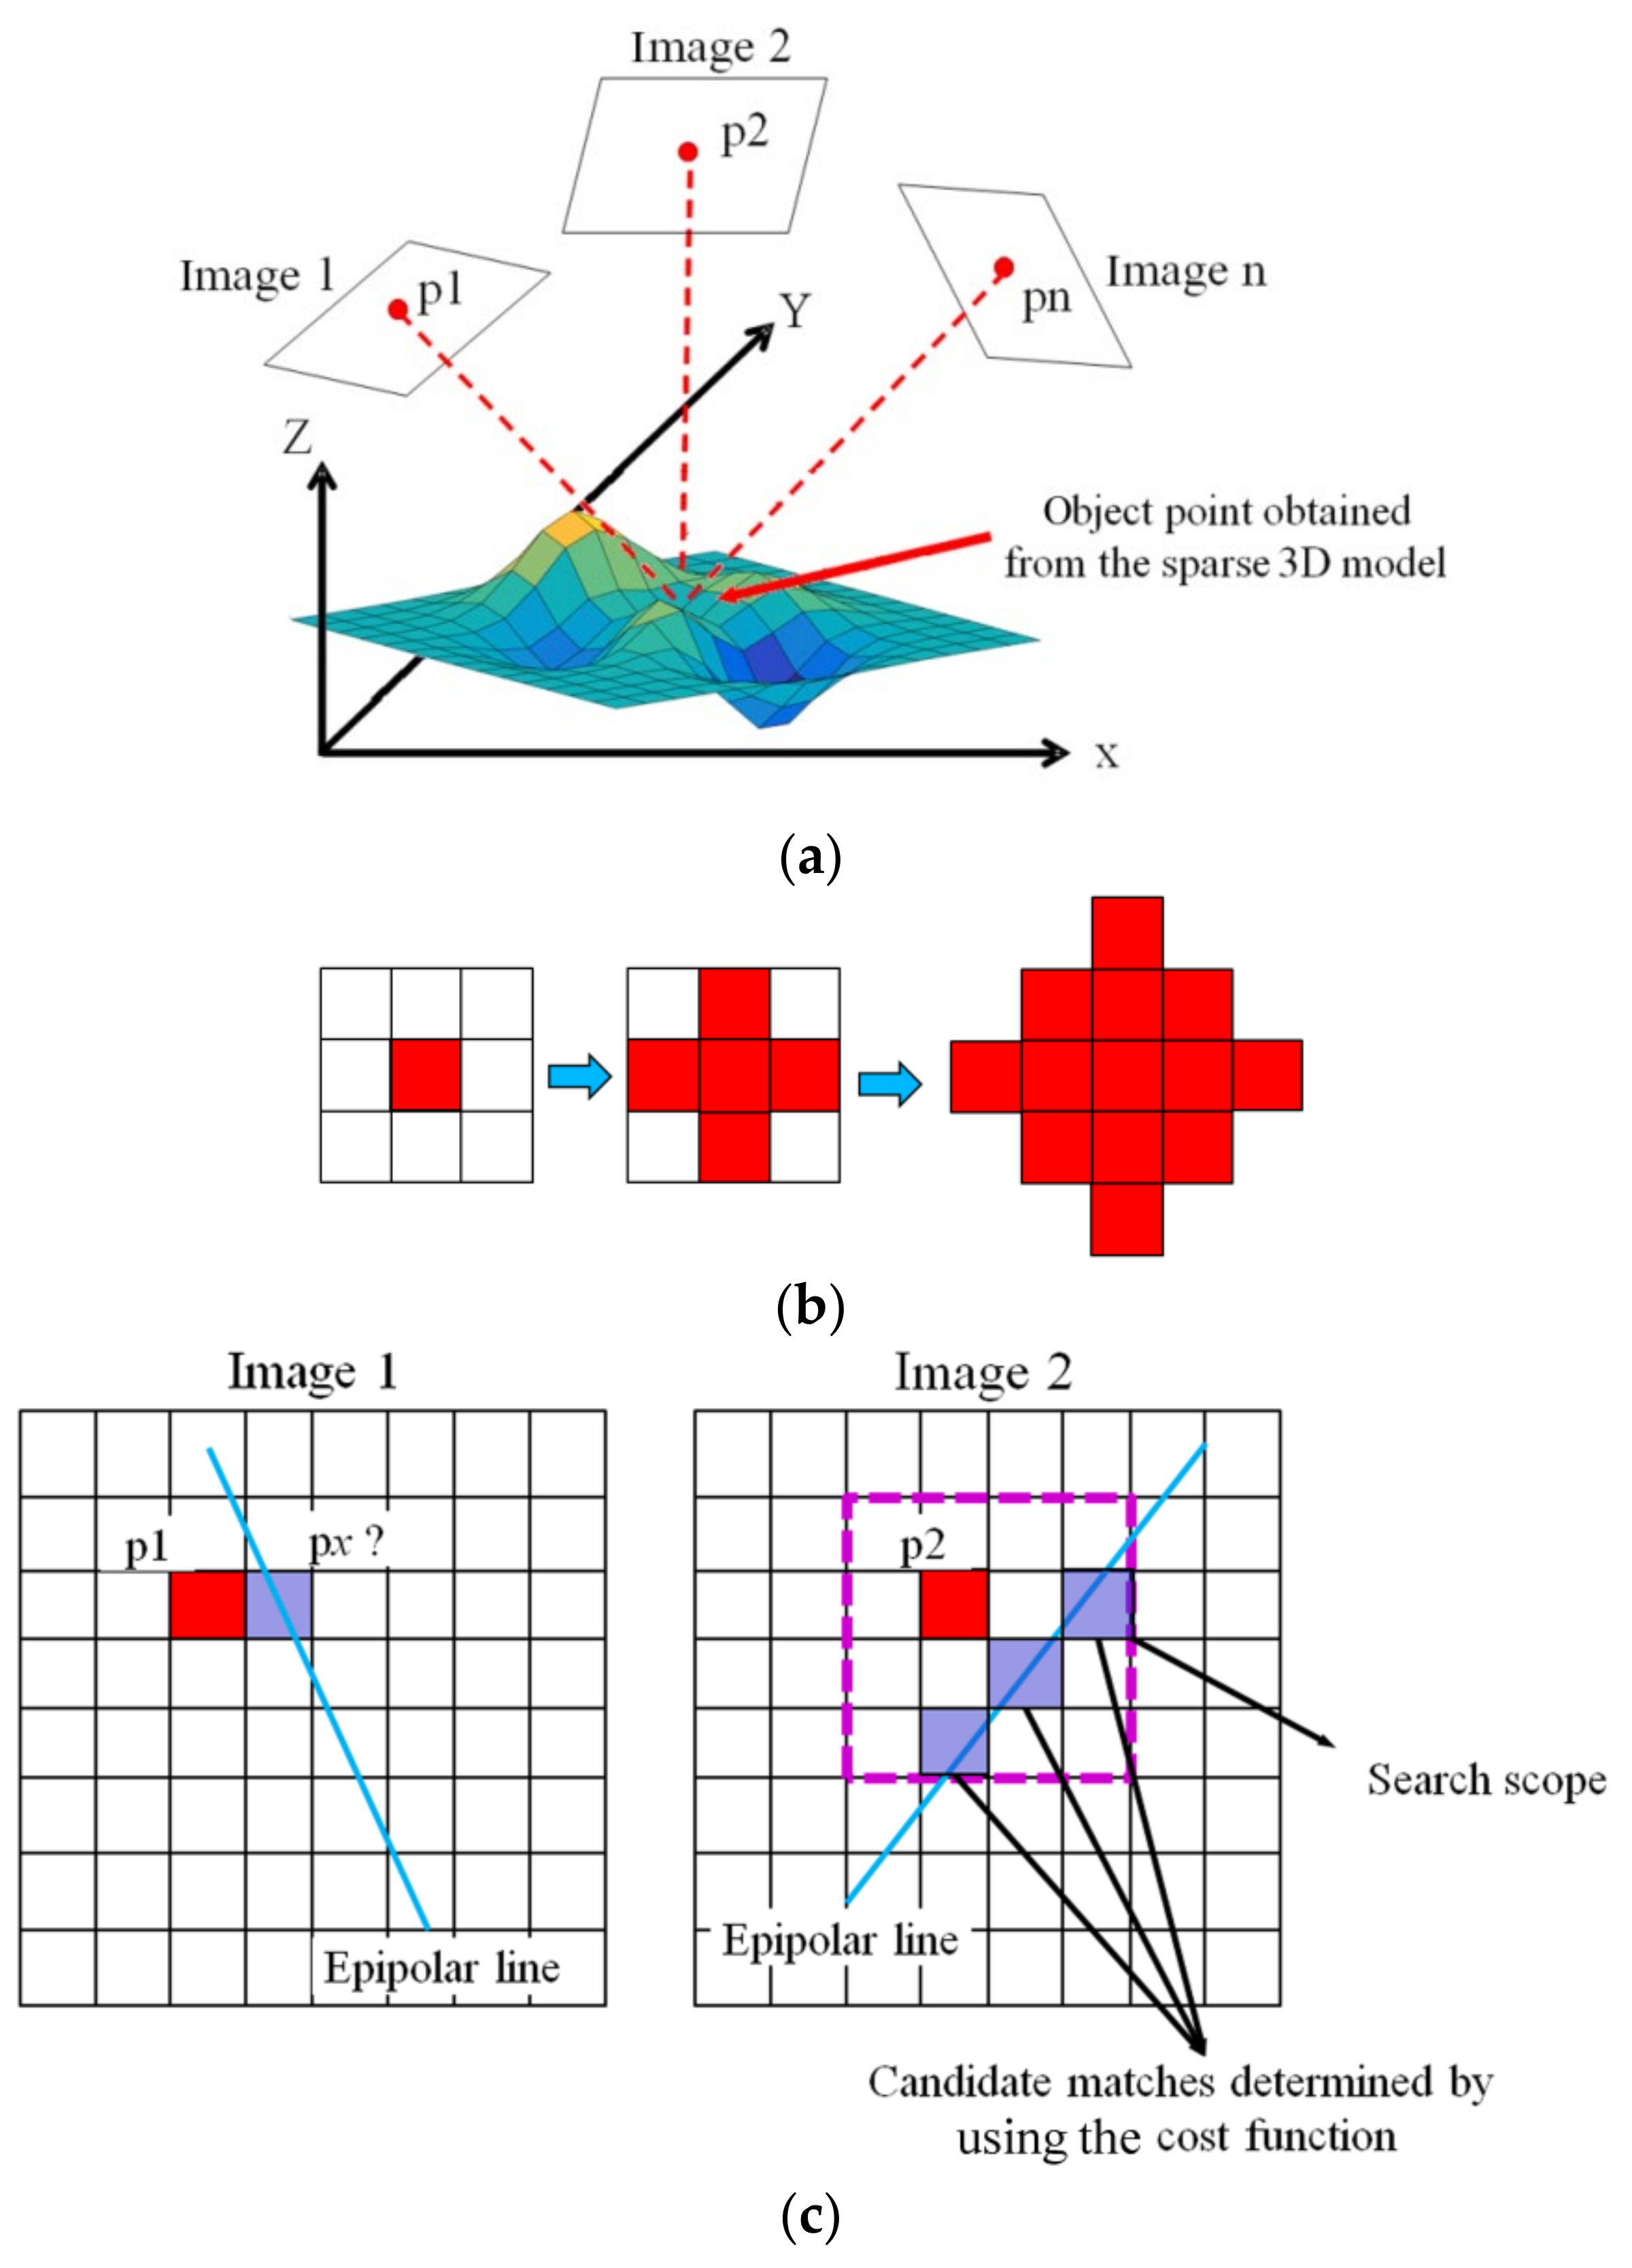
3.1. Surface Reconstruction of Revetment
| Algorithm 1: Region growing coupled with SGM |
| Input: 3D sparse points , exterior orientation parameters , and UAV remote sensing images. |
| Parameters: 3D dense points , four neighborhoods , query point , relevant images , disparity , minimum cost path , new 3D point , and unknown 3D points . |
| Initialize . |
| repeat |
| for each 3D point in set do |
| Assign as a seed. |
| Reproject onto . |
| Compute epipolar geometry based on . |
| for k = 1 to do |
| Calculate corresponding to in with known epipolar geometry. |
| end for |
| Compute the coordinate of using SGM and aerial triangulation. |
| Update by adding the new 3D point. |
| end for |
| until no 3D point need to be added. |
| Find in the local areas that have not been reconstructed well. |
| Establish TIN. |
| for each 3D point in do |
| Compute the coordinate of the 3D point by inverse distance weighted interpolation. |
| Update by adding the 3D point. |
| end for |
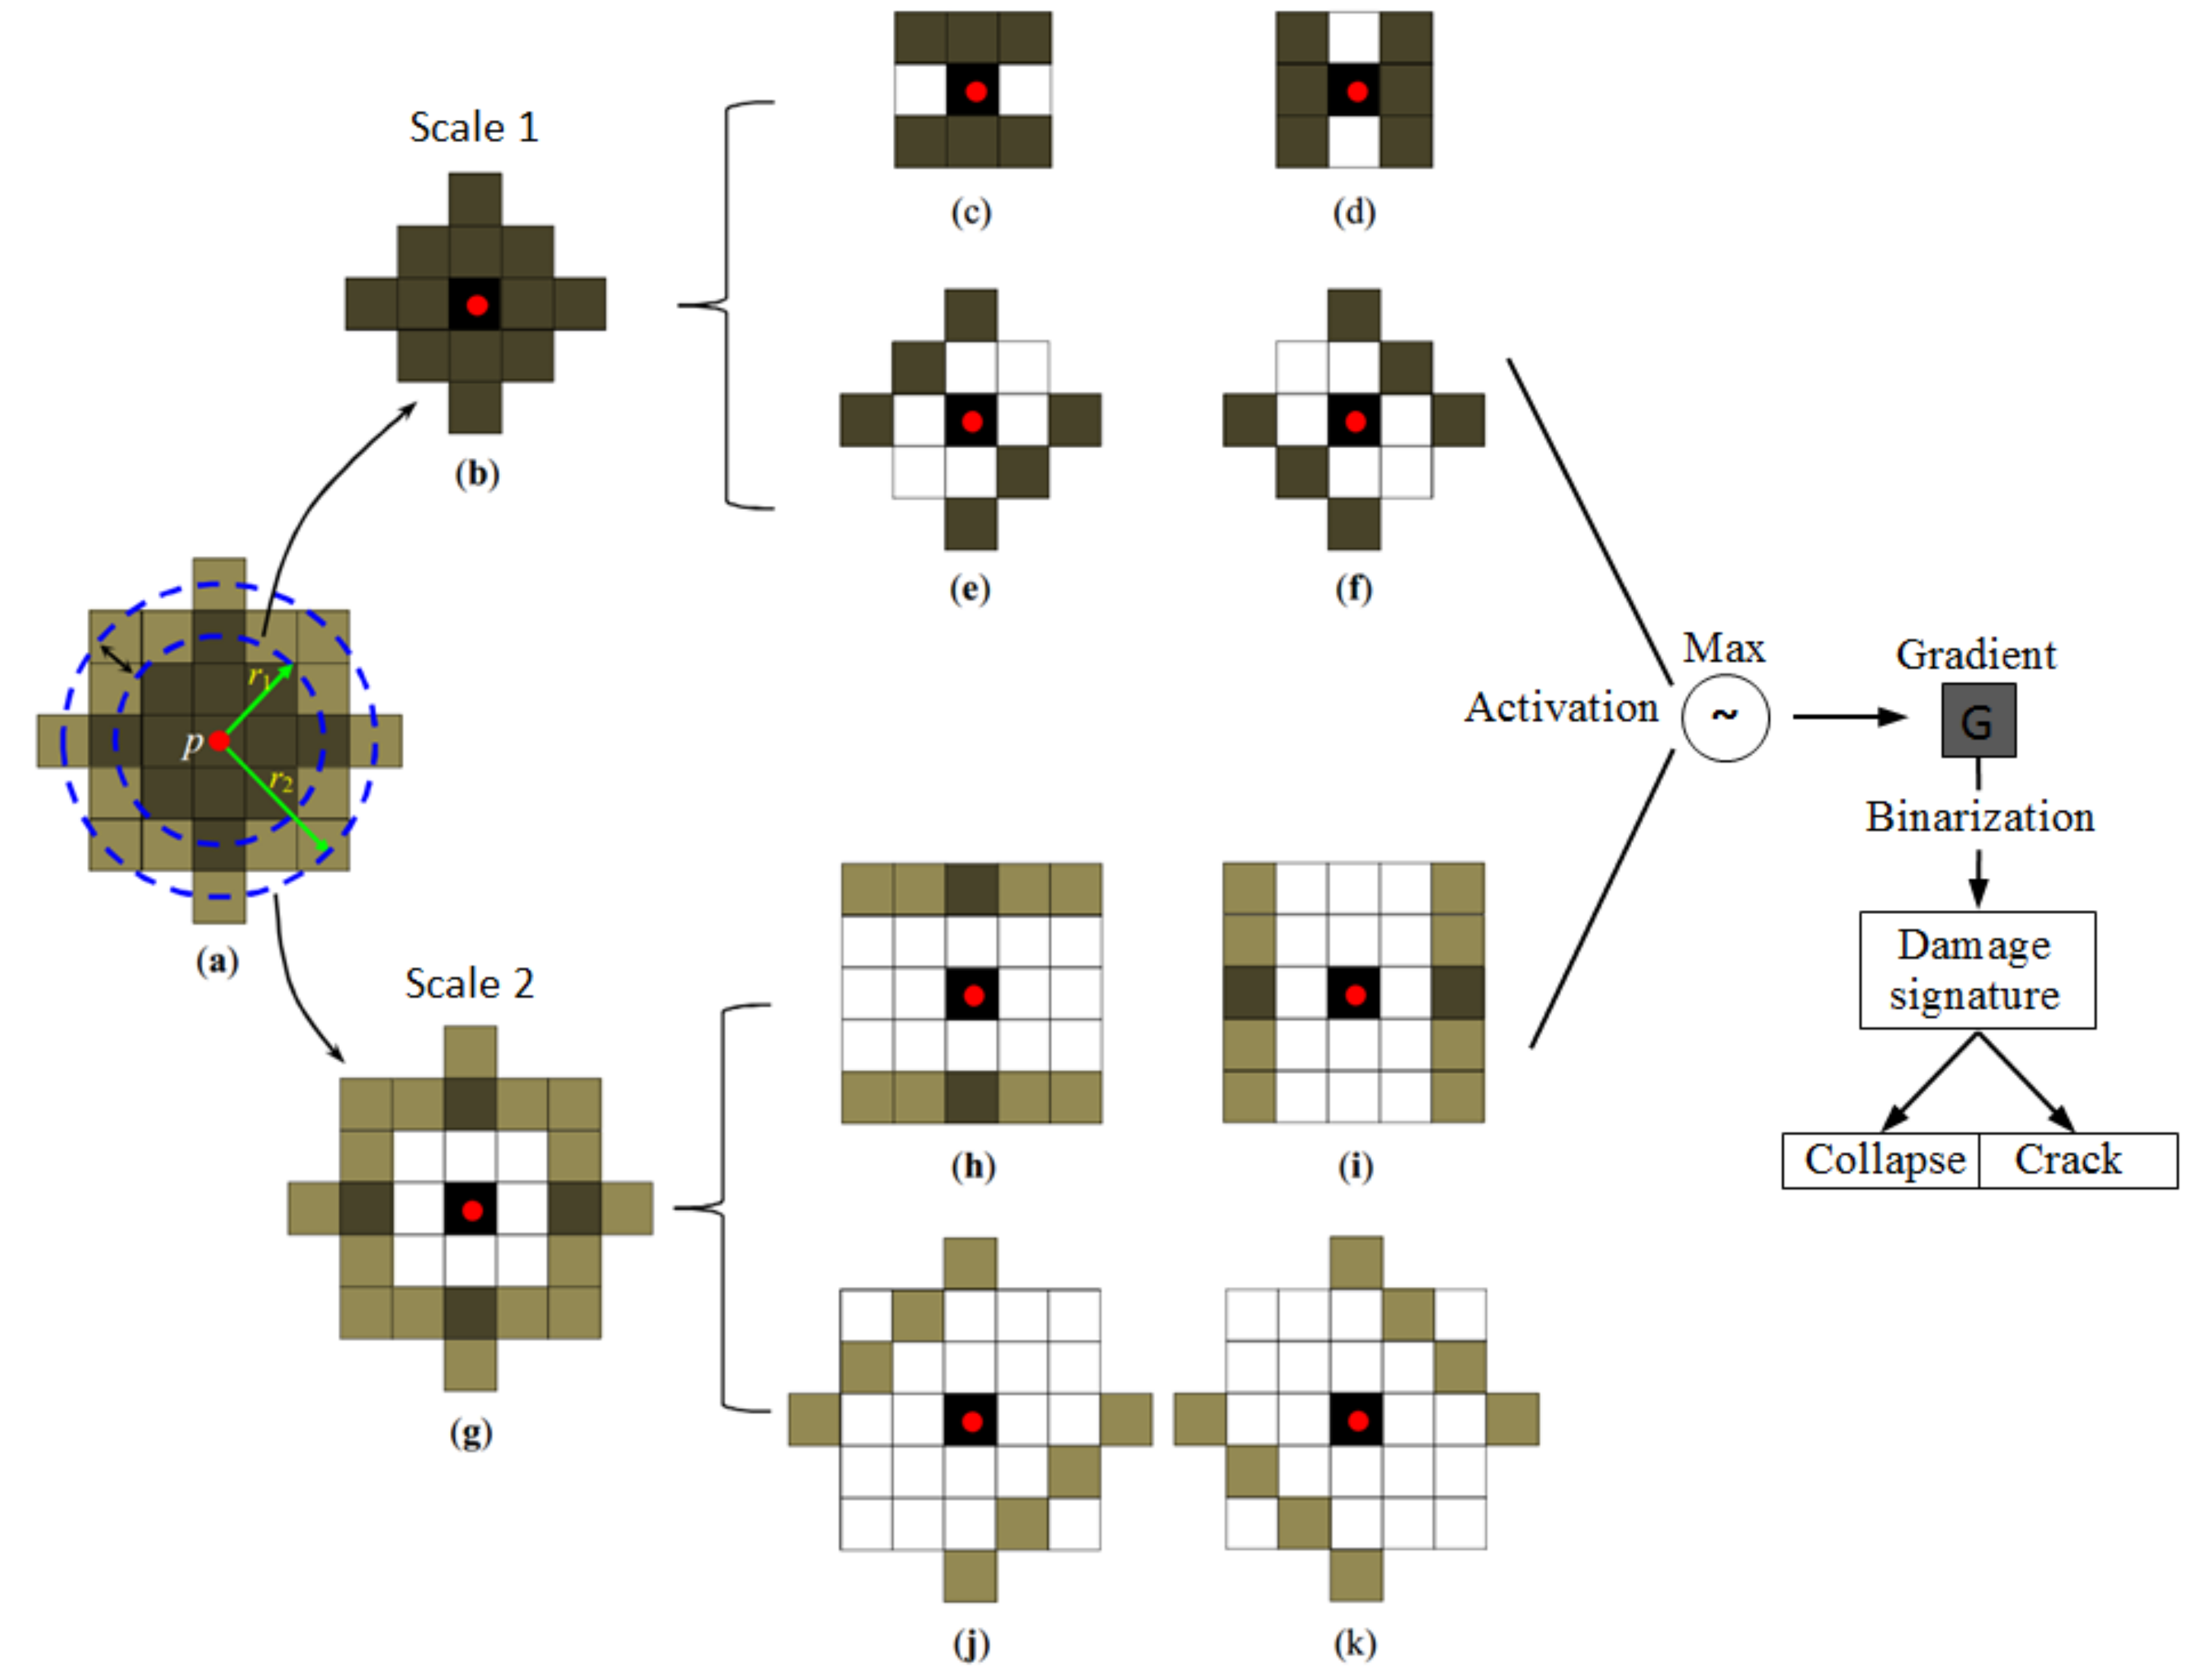
3.2. Damage Signature Generation
| Algorithm 2: Gradient calculation using SMGO |
| Input: intensity image with width W and height H, constant value , and gradient threshold . |
| Parameters: multiple factor and radius of the area surrounding the cell . |
| forcol = 1 to W do |
| for row = 1 to H do |
| repeat |
| suboperators |
| Compute the gradients using suboperators. |
| Gradient located in . |
| . |
| until gradient and . |
| end for |
| end for |
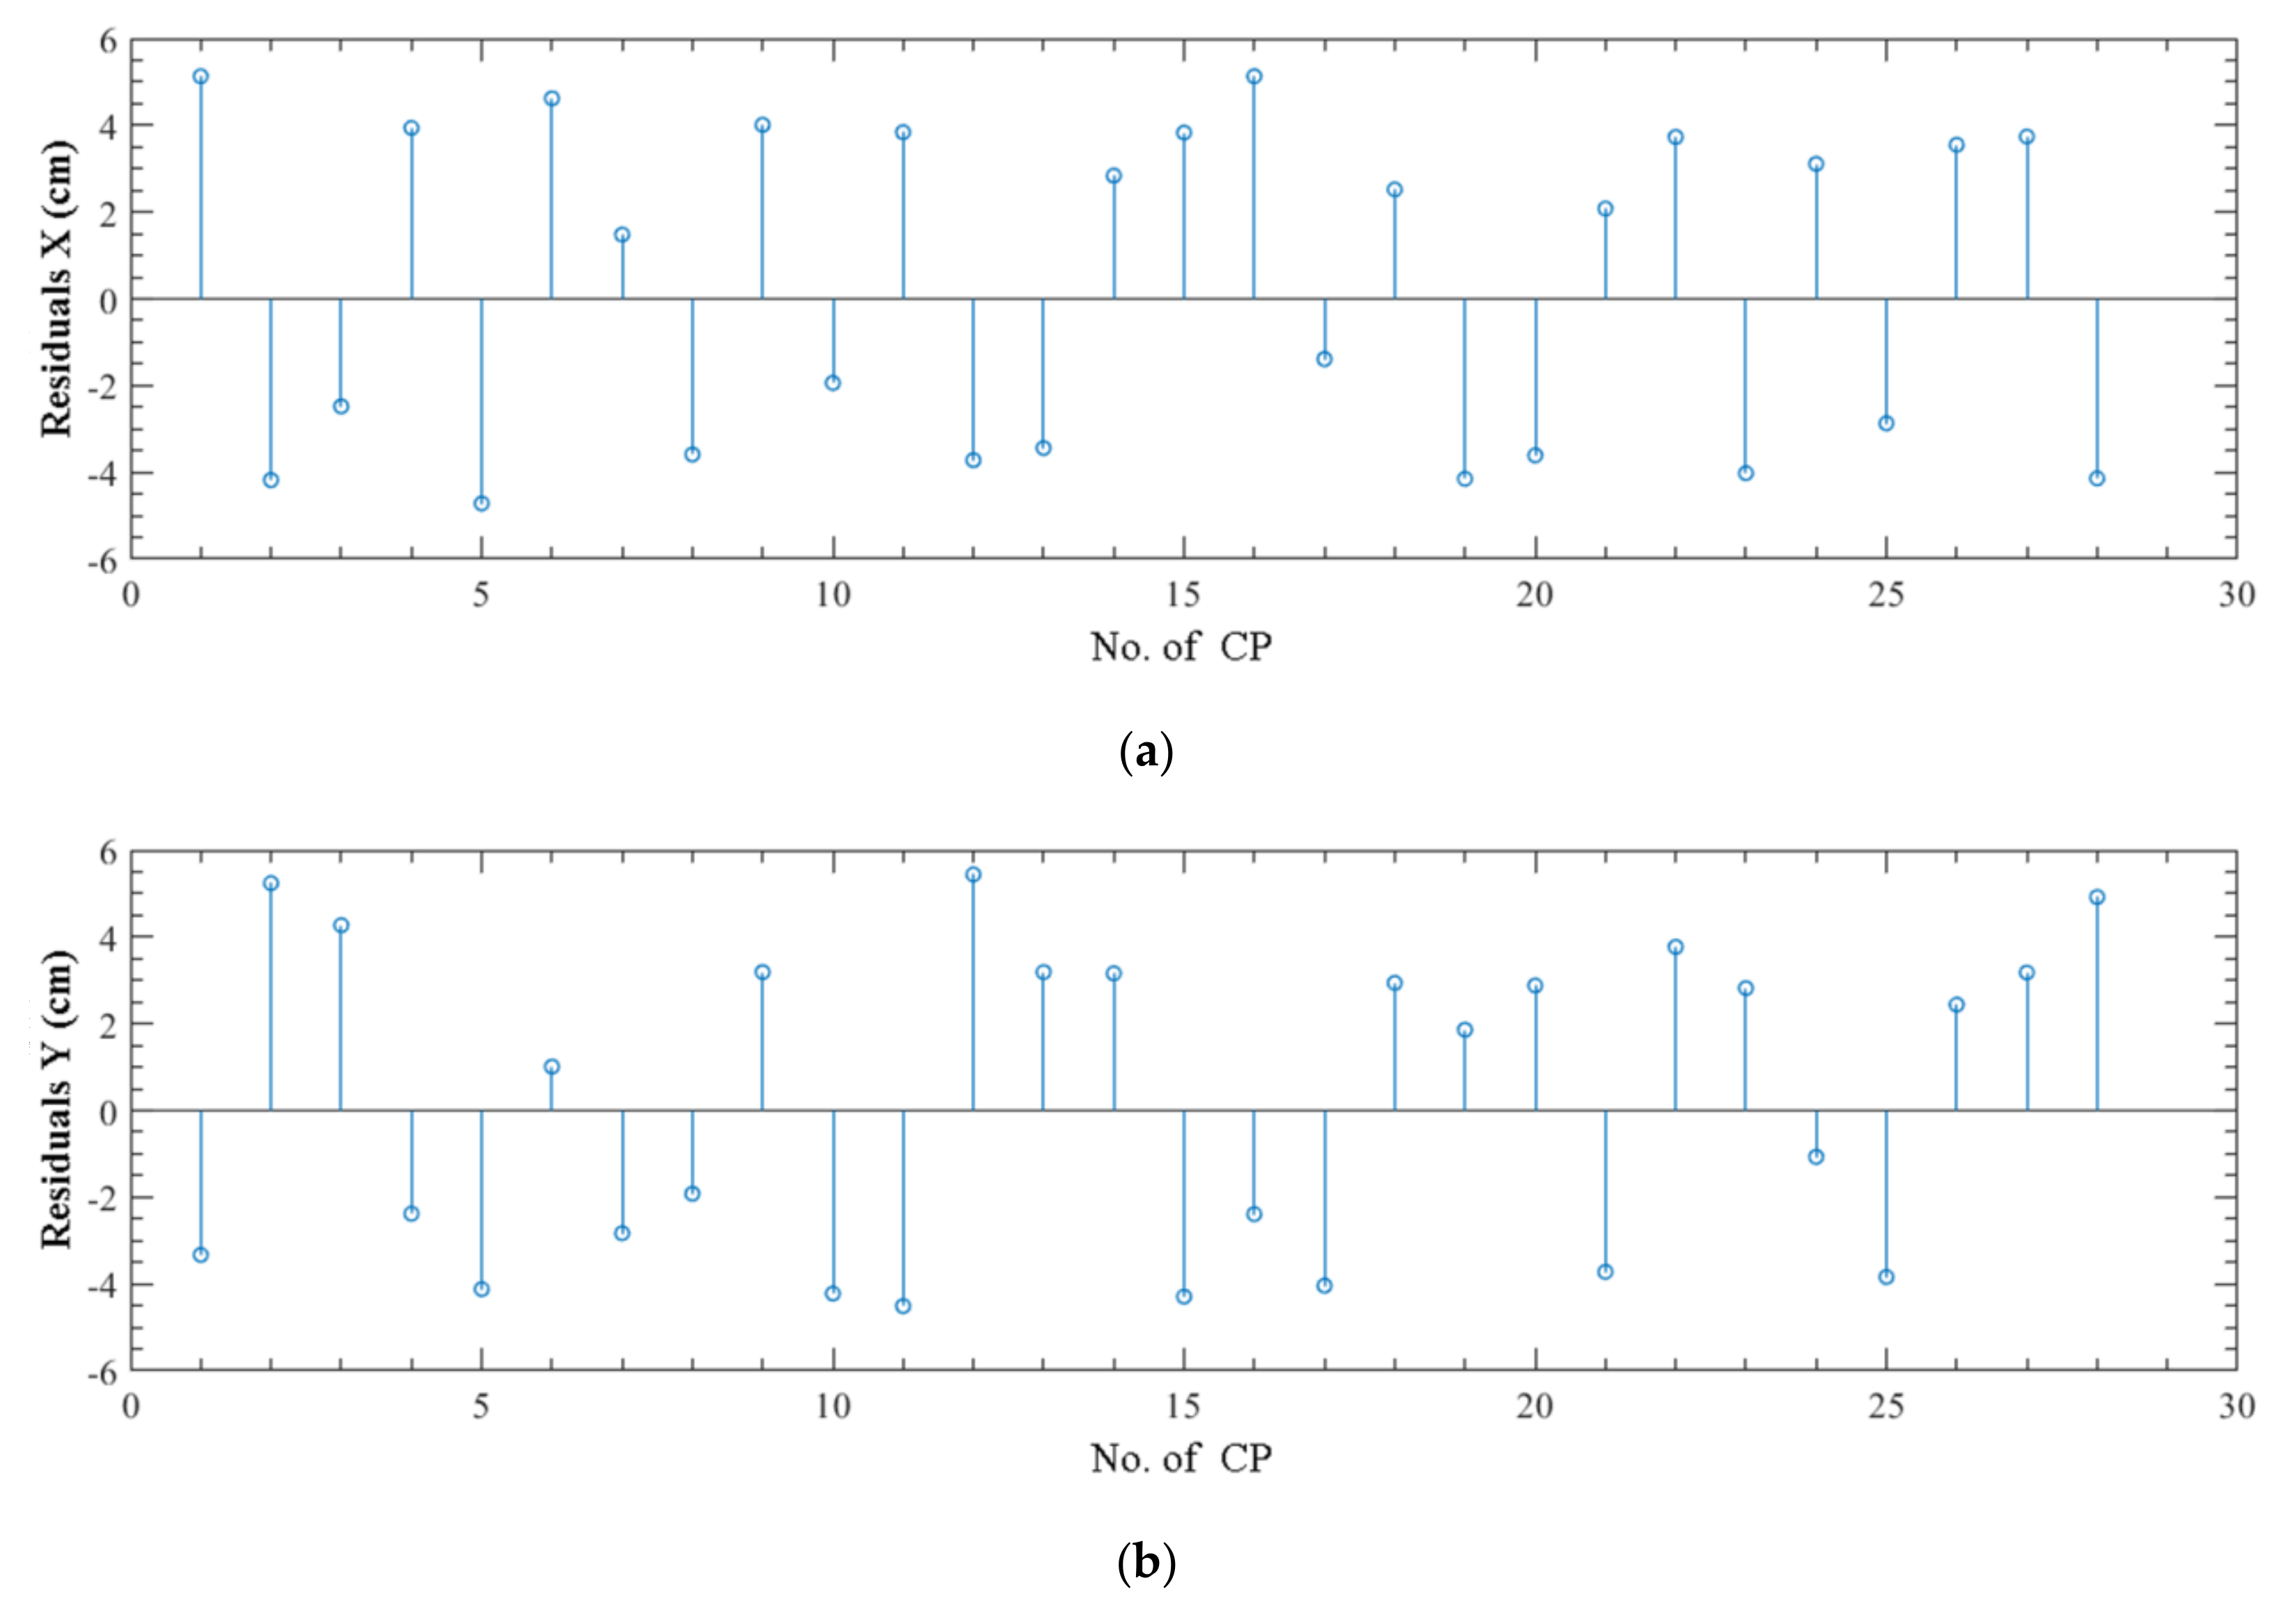
4. Results
5. Discussion
6. Conclusions
Author Contributions
Funding
Acknowledgments
Conflicts of Interest
References
- Chibana, T. Urban river management: Harmonizing river ecosystem conservation. In Urban Environmental Management Technology; Springer: Tokyo, Japan, 2008; pp. 47–66. [Google Scholar]
- Osman, A.M.; Thorne, C.R. Riverbank stability analysis. I: Theory. J. Hydraul. Eng. 1988, 114, 134–150. [Google Scholar] [CrossRef]
- Hesp, P. Foredunes and blowouts: Initiation, geomorphology and dynamics. Geomorphology 2002, 48, 245–268. [Google Scholar] [CrossRef]
- Tarrant, O.; Hambidge, C.; Hollingsworth, C.; Normandale, D.; Burdett, S. Identifying the signs of weakness, deterioration, and damage to flood defense infrastructure from remotely sensed data and mapped information. J. Flood Risk Manag. 2017, 11, 317–330. [Google Scholar] [CrossRef] [Green Version]
- Baghdadi, N.; Gratiot, N.; Lefebvre, J.-P.; Oliveros, C.; Bourguignon, A. Coastline and mudbank monitoring in French Guiana: Contributions of radar and optical satellite imagery. Can. J. Remote Sens. 2004, 30, 109–122. [Google Scholar] [CrossRef]
- Royet, P. Rapid and Cost-Effective Dike Condition Assessment Methods: Geophysics and Remote Sensing. FloodProbe. 2012. Available online: http://www.floodprobe.eu/partner/assets/documents/Floodprobe-D3.2_V1_3Dec2012.pdf (accessed on 1 September 2019).
- Hagenaars, G.; Luijendijk, A.; de Vries, S.; de Boer, W. Long term coastline monitoring derived from satellite imagery. Coast. Dyn. 2017, 122, 1551–1562. [Google Scholar]
- Choi, C.E.; Cui, Y.; Au, K.Y.K.; Liu, H.; Wang, J.; Liu, D.; Wang, H. Case study: Effects of a partial-debris dam on riverbank erosion in the Parlung Tsangpo river, China. Water 2018, 10, 250. [Google Scholar] [CrossRef] [Green Version]
- Rosser, N.J.; Petley, D.N.; Lim, M.; Dunning, S.A.; Allison, R.J. Terrestrial laser scanning for monitoring the process of hard rock coastal cliff erosion. Q. J. Eng. Geol. Hydrogeol. 2005, 38, 363–375. [Google Scholar] [CrossRef]
- Longoni, L.; Papini, M.; Brambilla, D.; Barazzetti, L.; Roncoroni, F.; Scaioni, M.; Ivanov, V.I. Monitoring riverbank erosion in mountain catchments using terrestrial laser scanning. Remote Sens. 2016, 8, 241. [Google Scholar] [CrossRef] [Green Version]
- Cheng, Y.-J.; Qiu, W.; Lei, J. Automatic extraction of tunnel lining cross-sections from terrestrial laser scanning point clouds. Sensors 2016, 16, 1648. [Google Scholar] [CrossRef]
- Thoma, D.P.; Gupta, S.C.; Bauer, M.E.; Kirchoff, C.E. Airborne laser scanning for riverbank erosion assessment. Remote Sens. Environ. 2005, 95, 493–501. [Google Scholar] [CrossRef]
- Yang, B.; Hwang, C.; Cordell, H.K. Use of LiDAR shoreline extraction for analyzing revetment rock beach protection: A case study of Jekyll island state park, USA. Ocean Coast. Manag. 2012, 69, 1–15. [Google Scholar] [CrossRef]
- Pye, K.; Blott, S.J. Assessment of beach and dune erosion and accretion using LiDAR: Impact of the stormy 2013-14 winter and longer term trends on the Sefton coast, UK. Geomorphology 2016, 266, 146–167. [Google Scholar] [CrossRef]
- Ternate, J.R.; Celeste, M.I.; Pineda, E.F.; Tan, F.J.; Uy, F.A.A. Floodplain modelling of Malaking-ilog river in southern Luzon, Philippines using LiDAR digital elevation model for the design of water-related structures. In Proceedings of the 2nd International Conference on Civil Engineering and Materials Science, Seoul, Korea, 26–28 May 2017; pp. 1–9. [Google Scholar]
- Drummond, H.; Weiner, H.M.; Kaminsky, G.M.; McCandless, D.; Hacking, A. Assessing bulkhead removal and shoreline restoration using boat-based lidar. In Proceedings of the Salish Sea Ecosystem Conference, Seattle, WA, USA, 5 April 2018. [Google Scholar]
- Cook, K.L. An evaluation of the effectiveness of low-cost UAVs and structure from motion for geomorphic change detection. Geomorphology 2017, 278, 195–208. [Google Scholar] [CrossRef]
- He, H.; Chen, T.; Zeng, H.; Huang, S. Ground control point-free unmanned aerial vehicle-based photogrammetry for volume estimation of stockpile carried on barges. Sensors 2019, 19, 3534. [Google Scholar] [CrossRef] [PubMed] [Green Version]
- Pitman, S.J.; Hart, D.E.; Katurji, M.H. Application of UAV techniques to expand beach research possibilities: A case study of coarse clastic beach cusps. Cont. Shelf Res. 2019, 184, 44–53. [Google Scholar] [CrossRef]
- Hemmelder, S.; Marra, W.; Markies, H.; De Jong, S.M. Monitoring river morphology & bank erosion using UAV imagery-a case study of the river Buёch, Hautes-Alpes, France. Int. J. Appl. Earth Obs. Geoinf. 2018, 73, 428–437. [Google Scholar]
- Hallermann, N.; Morgenthal, G.; Rodehorst, V. Vision-based deformation monitoring of large scale structures using unmanned aerial systems. IABSE Symp. Rep. 2014, 102, 2852–2859. [Google Scholar] [CrossRef]
- Nakagawa, M.; Yamamoto, T.; Tanaka, S.; Noda, Y.; Kashimoto, K.; Ito, M.; Miyo, M. Location-based infrastructure inspection for sabo facilities. In Proceedings of the International Archives of the Photogrammetry, Remote Sensing and Spatial Information Sciences, Volume XL-3/W3, ISPRS Geospatial Week, La Grande Motte, France, 28 September–3 October 2015; pp. 257–262. [Google Scholar]
- Kubota, S.; Kawai, Y.; Kadotani, R. Accuracy validation of point clouds of UAV photogrammetry and its application for river management. In Proceedings of the International Archives of the Photogrammetry, Remote Sensing and Spatial Information Sciences, Volume XLII-2/W6, International Conference on Unmanned Aerial Vehicles in Geomatics, Bonn, Germany, 4–7 September 2017; pp. 195–199. [Google Scholar]
- Starek, M.J.; Giessel, J. Fusion of UAS-based structure-from-motion and optical inversion for seamless topo-bathymetric mapping. In Proceedings of the IEEE International Geoscience and Remote Sensing Symposium (IGARSS), Fort Worth, TX, USA, 23–28 July 2017; pp. 2999–3002. [Google Scholar]
- Jayson, P.-N.; Appeaning Addo, K.; Amisigo, B.; Wiafe, G. Assessment of short-term beach sediment change in the Volta Delta coast in Ghana using data from Unmanned Aerial Vehicles (Drone). Ocean Coast. Manag. 2019, 182, 104952. [Google Scholar] [CrossRef]
- Pires, A.; Chaminé, H.I.; Piqueiro, F.; Pérez-Alberti, A.; Rocha, F. Combing coastal geoscience mapping and photogrammetric surveying in maritime environments (Northwestern Iberian Peninsula): Focus on methodology. Environ. Earth Sci. 2016, 75, 196. [Google Scholar] [CrossRef]
- DJI. Mavic Air User Manual. 2018. Available online: https://dl.djicdn.com/downloads/phantom_4_pro/Phantom+4+Pro+Pro+Plus+User+Manual+v1.0.pdf (accessed on 15 December 2018).
- He, H.; Yan, Y.; Chen, T.; Cheng, P. Tree height estimation of forest plantation in mountainous terrain from bare-earth points using a DoG-coupled radial basis function neural network. Remote Sens. 2019, 11, 1271. [Google Scholar] [CrossRef] [Green Version]
- Puliti, S.; Ørka, H.O.; Gobakken, T.; Næsset, E. Inventory of small forest areas using an unmanned aerial system. Remote Sens. 2015, 7, 9632–9654. [Google Scholar] [CrossRef] [Green Version]
- He, H.; Chen, X.; Liu, B.; Lv, Z. A sub-Harris operator coupled with SIFT for fast images matching in low-altitude photogrammetry. Int. J. Signal Process. Image Process. Pattern Recognit. 2014, 7, 395–406. [Google Scholar] [CrossRef]
- Hamshaw, S.D.; Bryce, T.; Rizzo, D.M.; O’Neil-Dunne, J.; Frolik, J.; Dewoolkar, M.M. Quantifying streambank movement and topography using unmanned aircraft system photogrammetry with comparison to terrestrial laser scanning. River Res. Appl. 2017, 33, 1354–1367. [Google Scholar] [CrossRef]
- Wu, C. Towards linear-time incremental structure from motion. In Proceedings of the 3DV-Conference, International Conference on IEEE Computer Society, Seattle, WA, USA, 29 June–1 July 2013; pp. 127–134. [Google Scholar]
- Schönberger, J.L.; Frahm, J.M. Structure-from-motion revisited. In Proceedings of the IEEE Conference on Computer Vision and Pattern Recognition (CVPR), Las Vegas, NV, USA, 27–30 June 2016; pp. 4104–4113. [Google Scholar]
- Sba: A Generic Sparse Bundle Adjustment C/C++ Package. 2018. Available online: http://users.ics.forth.gr/~{}lourakis/sba/ (accessed on 5 August 2019).
- Bhattacharya, A.; Arora, M.; Sharma, M. Usefulness of adaptive filtering for improved digital elevation model generation. J. Geol. Soc. India 2013, 82, 153–161. [Google Scholar] [CrossRef]
- Hirschmuller, H. Accurate and efficient stereo processing by semi-global matching and mutual information. In Proceedings of the IEEE Computer Society Conference on Computer Vision and Pattern Recognition (CVPR’05), San Diego, CA, USA, 20–25 June 2005; pp. 807–814. [Google Scholar]
- Humenberger, M.; Engelke, T.; Kubinger, W. A census-based stereo vision algorithm using modified semi-global matching and plane fitting to improve matching quality. In Proceedings of the IEEE Computer Society Conference on Computer Vision and Pattern Recognition (CVPR), San Francisco, CA, USA, 13–18 June 2010; pp. 77–84. [Google Scholar]
- Viola, P.; Wells, W.M. Alignment by maximization of mutual information. Int. J. Comput. Vis. 1997, 24, 137–154. [Google Scholar] [CrossRef]
- He, H.; Zhou, J.; Chen, M.; Chen, T.; Li, D.; Cheng, P. Building extraction from UAV images jointly using 6D-SLIC and multiscale Siamese convolutional networks. Remote Sens. 2019, 11, 1040. [Google Scholar] [CrossRef] [Green Version]


| Area | Method | RMSE X (cm) | RMSE Y (cm) | RMSE Z (cm) | Total RMSE (cm) |
|---|---|---|---|---|---|
| Part 1 | Pix4Dmapper | 3.85 | 3.84 | 5.70 | 4.56 |
| Agisoft Metashape | 5.08 | 4.53 | 6.59 | 5.47 | |
| object space-based | 3.76 | 3.72 | 5.67 | 4.48 | |
| Part 2 | Pix4Dmapper | 3.83 | 4.27 | 5.07 | 4.42 |
| Agisoft Metashape | 4.89 | 4.63 | 6.43 | 5.38 | |
| object space-based | 3.49 | 3.30 | 5.31 | 4.13 |
| Area | Method | RMSE (Pixel) |
|---|---|---|
| Part 1 | Pix4Dmapper | 0.611 |
| Agisoft Metashape | 0.679 | |
| object space-based | 0.597 | |
| Part 2 | Pix4Dmapper | 0.752 |
| Agisoft Metashape | 0.783 | |
| object space-based | 0.730 |
| Site | Category | Number | Indicator (%) | Method | ||
|---|---|---|---|---|---|---|
| Field Visual Inspection | NMGO-Based | Our Method | ||||
| Part 1 | Collapse | 14 | Precision | 86.67 | 73.33 | 92.85 |
| Recall | 92.85 | 78.57 | 92.85 | |||
| F1_score | 89.66 | 75.86 | 92.85 | |||
| Crack | 36 | Precision | 91.18 | 79.41 | 89.18 | |
| Recall | 86.11 | 75.00 | 91.67 | |||
| F1_score | 88.57 | 77.14 | 90.41 | |||
| Part 2 | Collapse | 18 | Precision | 84.21 | 73.68 | 89.47 |
| Recall | 88.89 | 77.78 | 94.44 | |||
| F1_score | 86.49 | 75.67 | 91.89 | |||
| Crack | 54 | Precision | 88.46 | 82.97 | 90.91 | |
| Recall | 85.18 | 72.22 | 92.59 | |||
| F1_score | 86.79 | 77.23 | 91.74 | |||
© 2020 by the authors. Licensee MDPI, Basel, Switzerland. This article is an open access article distributed under the terms and conditions of the Creative Commons Attribution (CC BY) license (http://creativecommons.org/licenses/by/4.0/).
Share and Cite
Chen, T.; He, H.; Li, D.; An, P.; Hui, Z. Damage Signature Generation of Revetment Surface along Urban Rivers Using UAV-Based Mapping. ISPRS Int. J. Geo-Inf. 2020, 9, 283. https://0-doi-org.brum.beds.ac.uk/10.3390/ijgi9040283
Chen T, He H, Li D, An P, Hui Z. Damage Signature Generation of Revetment Surface along Urban Rivers Using UAV-Based Mapping. ISPRS International Journal of Geo-Information. 2020; 9(4):283. https://0-doi-org.brum.beds.ac.uk/10.3390/ijgi9040283
Chicago/Turabian StyleChen, Ting, Haiqing He, Dajun Li, Puyang An, and Zhenyang Hui. 2020. "Damage Signature Generation of Revetment Surface along Urban Rivers Using UAV-Based Mapping" ISPRS International Journal of Geo-Information 9, no. 4: 283. https://0-doi-org.brum.beds.ac.uk/10.3390/ijgi9040283