Article

Multisensorial Close-Range Sensing Generates Benefits for Characterization of Managed Scots Pine (Pinus sylvestris L.) Stands

1
School of Forest Sciences, University of Eastern Finland, 80101 Joensuu, Finland
2
Department of Forest Sciences, University of Helsinki, 00014 Helsinki, Finland
3
Department of Remote Sensing and Photogrammetry, Finnish Geospatial Research Institute, National Land Survey of Finland (NLS), 02431 Masala, Finland
4
Natural Resources Institute Finland (Luke), 00790 Helsinki, Finland
*
Author to whom correspondence should be addressed.
ISPRS Int. J. Geo-Inf. 2020, 9(5), 309; https://0-doi-org.brum.beds.ac.uk/10.3390/ijgi9050309
Submission received: 25 March 2020 / Revised: 24 April 2020 / Accepted: 5 May 2020 / Published: 7 May 2020
(This article belongs to the Special Issue UAV in Smart City and Smart Region)

Abstract

:
Terrestrial laser scanning (TLS) provides a detailed three-dimensional representation of surrounding forest structures. However, due to close-range hemispherical scanning geometry, the ability of TLS technique to comprehensively characterize all trees, and especially upper parts of forest canopy, is often limited. In this study, we investigated how much forest characterization capacity can be improved in managed Scots pine (Pinus sylvestris L.) stands if TLS point clouds are complemented with photogrammetric point clouds acquired from above the canopy using unmanned aerial vehicle (UAV). In this multisensorial (TLS+UAV) close-range sensing approach, the used UAV point cloud data were considered especially suitable for characterizing the vertical forest structure and improvements were obtained in estimation accuracy of tree height as well as plot-level basal-area weighted mean height (Hg) and mean stem volume (Vmean). Most notably, the root-mean-square-error (RMSE) in Hg improved from 0.8 to 0.58 m and the bias improved from −0.75 to −0.45 m with the multisensorial close-range sensing approach. However, in managed Scots pine stands, the mere TLS also captured the upper parts of the forest canopy rather well. Both approaches were capable of deriving stem number, basal area, Vmean, Hg, and basal area-weighted mean diameter with the relative RMSE less than 5.5% for all the sample plots. Although the multisensorial close-range sensing approach mainly enhanced the characterization of the forest vertical structure in single-species, single-layer forest conditions, representation of more complex forest structures may benefit more from point clouds collected with sensors of different measurement geometries.

1. Introduction

Trees are among the most important plants for the terrestrial biosphere [1,2]. For improving our understanding of tree populations at varying scales, improvements in methodologies and technologies are needed for characterizing individual trees and forests. This methodological knowledge gap is also listed among the most important ecological research topics according to Sutherland et al. [3]. Remote and close-range sensing techniques provide the state-of-the-art in mapping and characterizing trees and forests [4,5]. Laser scanning is an active remote sensing technique recording three-dimensional (3D) environment providing billions of 3D points. It has been the main driving force behind the development of characterization of trees in the last two decades [6,7,8]. An alternative to laser scanning are image matching approaches [9,10,11,12] that can also be used to derive dense point clouds with high geometric accuracies. Dense point clouds acquired with aircrafts or from unmanned aerial vehicles (UAVs) using laser scanning or photogrammetric image matching can be used to detect single trees [13], reconstruct 3D crown structures [14], derive height and stem dimensions [15], and predict tree attributes such as species, biomass and stem volume [16,17,18,19].
However, due to the incomplete tree detection and inaccurate tree characterization, some of the tree attributes (e.g., stem diameters) have been challenging to reliably obtain with remote and close-range sensing techniques [20,21]. In varying forest conditions, only part of trees have been detected from point clouds collected above a canopy, as suppressed trees have most often been occluded [20,22,23]. The use of the whole point cloud information, instead of canopy height model (CHM)-based techniques (see, e.g., [24]) has improved the detection of suppressed trees [6] but a robust solution is still missing. A greater part of the trees can be detected from terrestrial point clouds acquired below a canopy [4,7]. Terrestrial laser scanning (TLS) provides a detailed 3D representation of surrounding forest structures, enabling an automated characterization of trees and stands [4,25,26]. Compared with conventional forest inventory methods, such as the use of clinometers for measuring height and calipers or measurement tapes for measuring stem diameters [27], the use of TLS point clouds enable non-destructive approaches to estimate stem profile and volume [28,29,30] and to characterize a branching structure of trees [31,32] which can further improve the modelling of tree biomass [33,34]. However, the close-range hemispherical scanning geometry often limits the ability of TLS techniques to comprehensively characterize upper parts of a forest canopy [4,21,35]. Therefore, several meters of error in TLS-based tree height estimates are common [21]. Furthermore, errors in tree height estimates lead to erroneous estimates for stem volume and mean tree height at plot level. In addition, occlusion due to dense undergrowth vegetation, branches and other trees, hinder the automatic detection of all trees (e.g., [21]).
To overcome the challenges with detecting suppressed trees, characterizing an upper canopy, and occlusion, terrestrial and aerial point cloud data could be combined for an improved forest characterization [21,36,37,38]. While better capturing the upper canopy structure for more reliable tree height measurement, the multisensorial approach could also enable improved tree detection due to the different measurement geometries of the used sensors. Theoretically, a more complete set of forest observations should lead to improved estimates for a forest structure. In recent years, the use of UAVs has become an attainable option for small-scale forest monitoring [18,39,40,41]. A detailed 3D information on a forest canopy structure can be acquired even by a consumer-grade UAV equipped with an RGB camera [42] and subsequent point cloud extraction using image processing techniques such as Structure-from-Motion photogrammetry [43]. Low-cost UAV imaging systems could provide complementary information for TLS-based forest monitoring at an affordable price [37]. In previous studies, UAV photogrammetry has been successfully integrated with point clouds from terrestrial photogrammetry [38] and laser scanning [37]. However, the benefits of using the combination of TLS and aerial point cloud data instead of using TLS data alone in characterizing varying forest structures has not previously been examined.
The objective of this study is to investigate the advantages of combining photogrammetric UAV and TLS point clouds (i.e., multisensorial close-range sensing approach) to improve the accuracy of detecting trees, measuring tree height, and estimating forest structural attributes on 27 sample plots located in managed boreal forests. We hypothesize that the differing measurement geometries between TLS and UAV point cloud data will lead to a more complete characterization of individual trees and therefore, to a more complete characterization of the vertical and horizontal structures of the plots. We assess the performance of the multisensorial approach in the vertical and horizontal forest characterization by using the most common forest structural attributes. Number of trees per hectare (TPH), basal area (G), and basal-area weighted mean diameter (Dg) are used as measures for characterizing the horizontal structure whereas basal-area weighted mean height (Hg) is a measure describing the vertical structure of the plots. Mean stem volume (Vmean) is a forest structural attribute that is affected by both the vertical and the horizontal forest structure. We compare the performance of the multisensorial approach (TLS+UAV) with the performance obtained with mere TLS point clouds to assess whether it is beneficial to complement TLS with dense aerial point clouds.

2. Materials and Methods

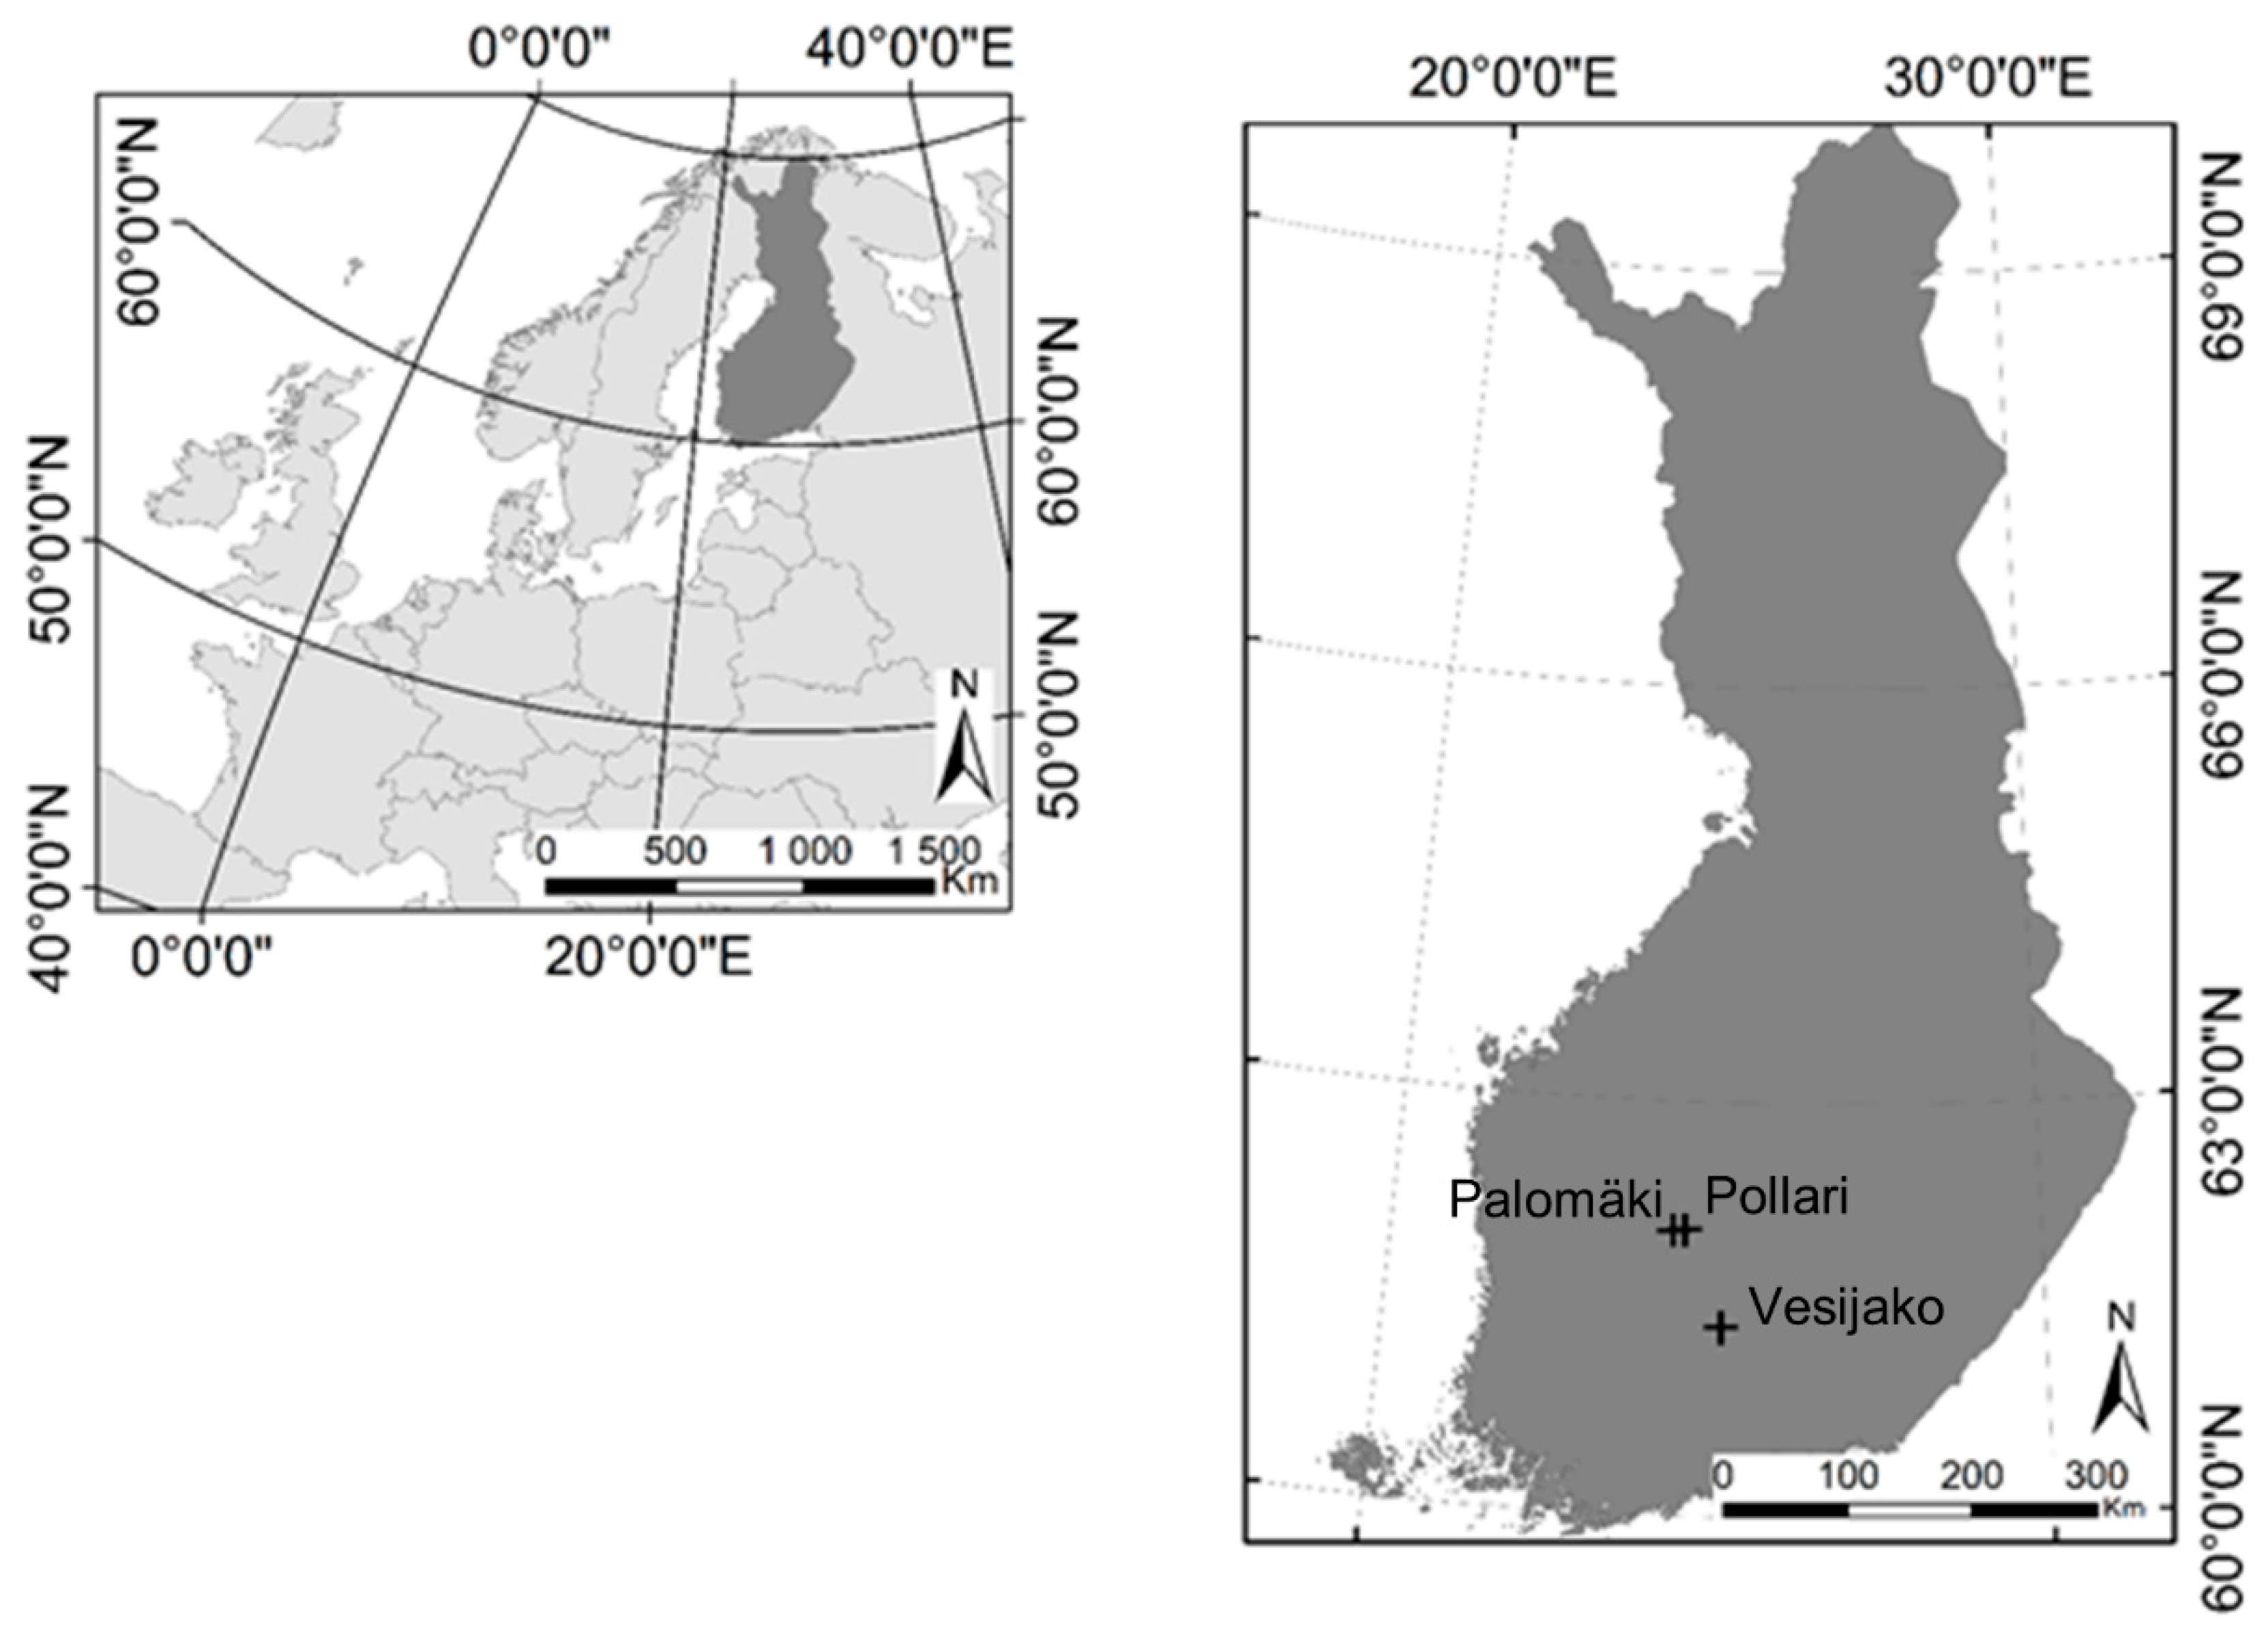
2.1. Study Area and Measurements of Forest Structural Attributes

The study materials consisted of a tree-level field inventory, TLS data, and aerial images collected from 27 sample plots (900–1200 m2) located in pure Scots pine (Pinus sylvestris L.) stands in three study sites in southern Finland: Palomäki and Pollari located in Vilppula (62°02′ N 24°29′ E) and Vesijako in Padasjoki (61°21′ N 25°06′ E) (Figure 1). The elevation varies between 120 and 150 m above sea level as the typical temperature sum in the study areas is around 1200 d.d. Site fertility for all the sample plots is mesic heath. The tree-level field inventory data consisted of 2102 Scots pine trees that were measured using callipers and clinometers [27,44] with an expected precision of 0.3 cm for diameter-at-breast height (dbh) and 0.5 m for tree height [27]. The plot-level forest structural attributes were computed based on tree species and the measured dbh and tree height. Basal area for each tree was computed by considering the cross-sectional area of a tree to be circular. Stem volume for each tree was estimated using the nationwide species-specific volume equation by Laasasenaho [45], where dbh and tree height are used as explanatory variables. Then, the plot-level forest structural attributes, in other words, TPH, G, Dg, Hg and Vmean were computed as a sum or basal area-weighted mean of single tree variables according to the following:
T P H = n A
G = i = 1 n g i A
V m e a n = i = 1 n v i A
D g = i = 1 n d i g i i = 1 n g i
H g = i = 1 n h i g i i = 1 n g i
where n is the number of trees in a sample plot, A is the area of the sample plot in hectares, gi is the basal area of the ith tree, vi is the stem volume of the ith tree, di is the dbh of the ith tree, and hi is the height for the ith tree. Based on the field inventory, the sample plots represented managed, even-aged Scots pine stands where G ranged between 13.3 and 43.3 m2/ha, indicating a large variation in the forest horizontal structure (Table 1). Respectively, Hg, characterizing the vertical structure, varied from 16.9 to 24.6 m.

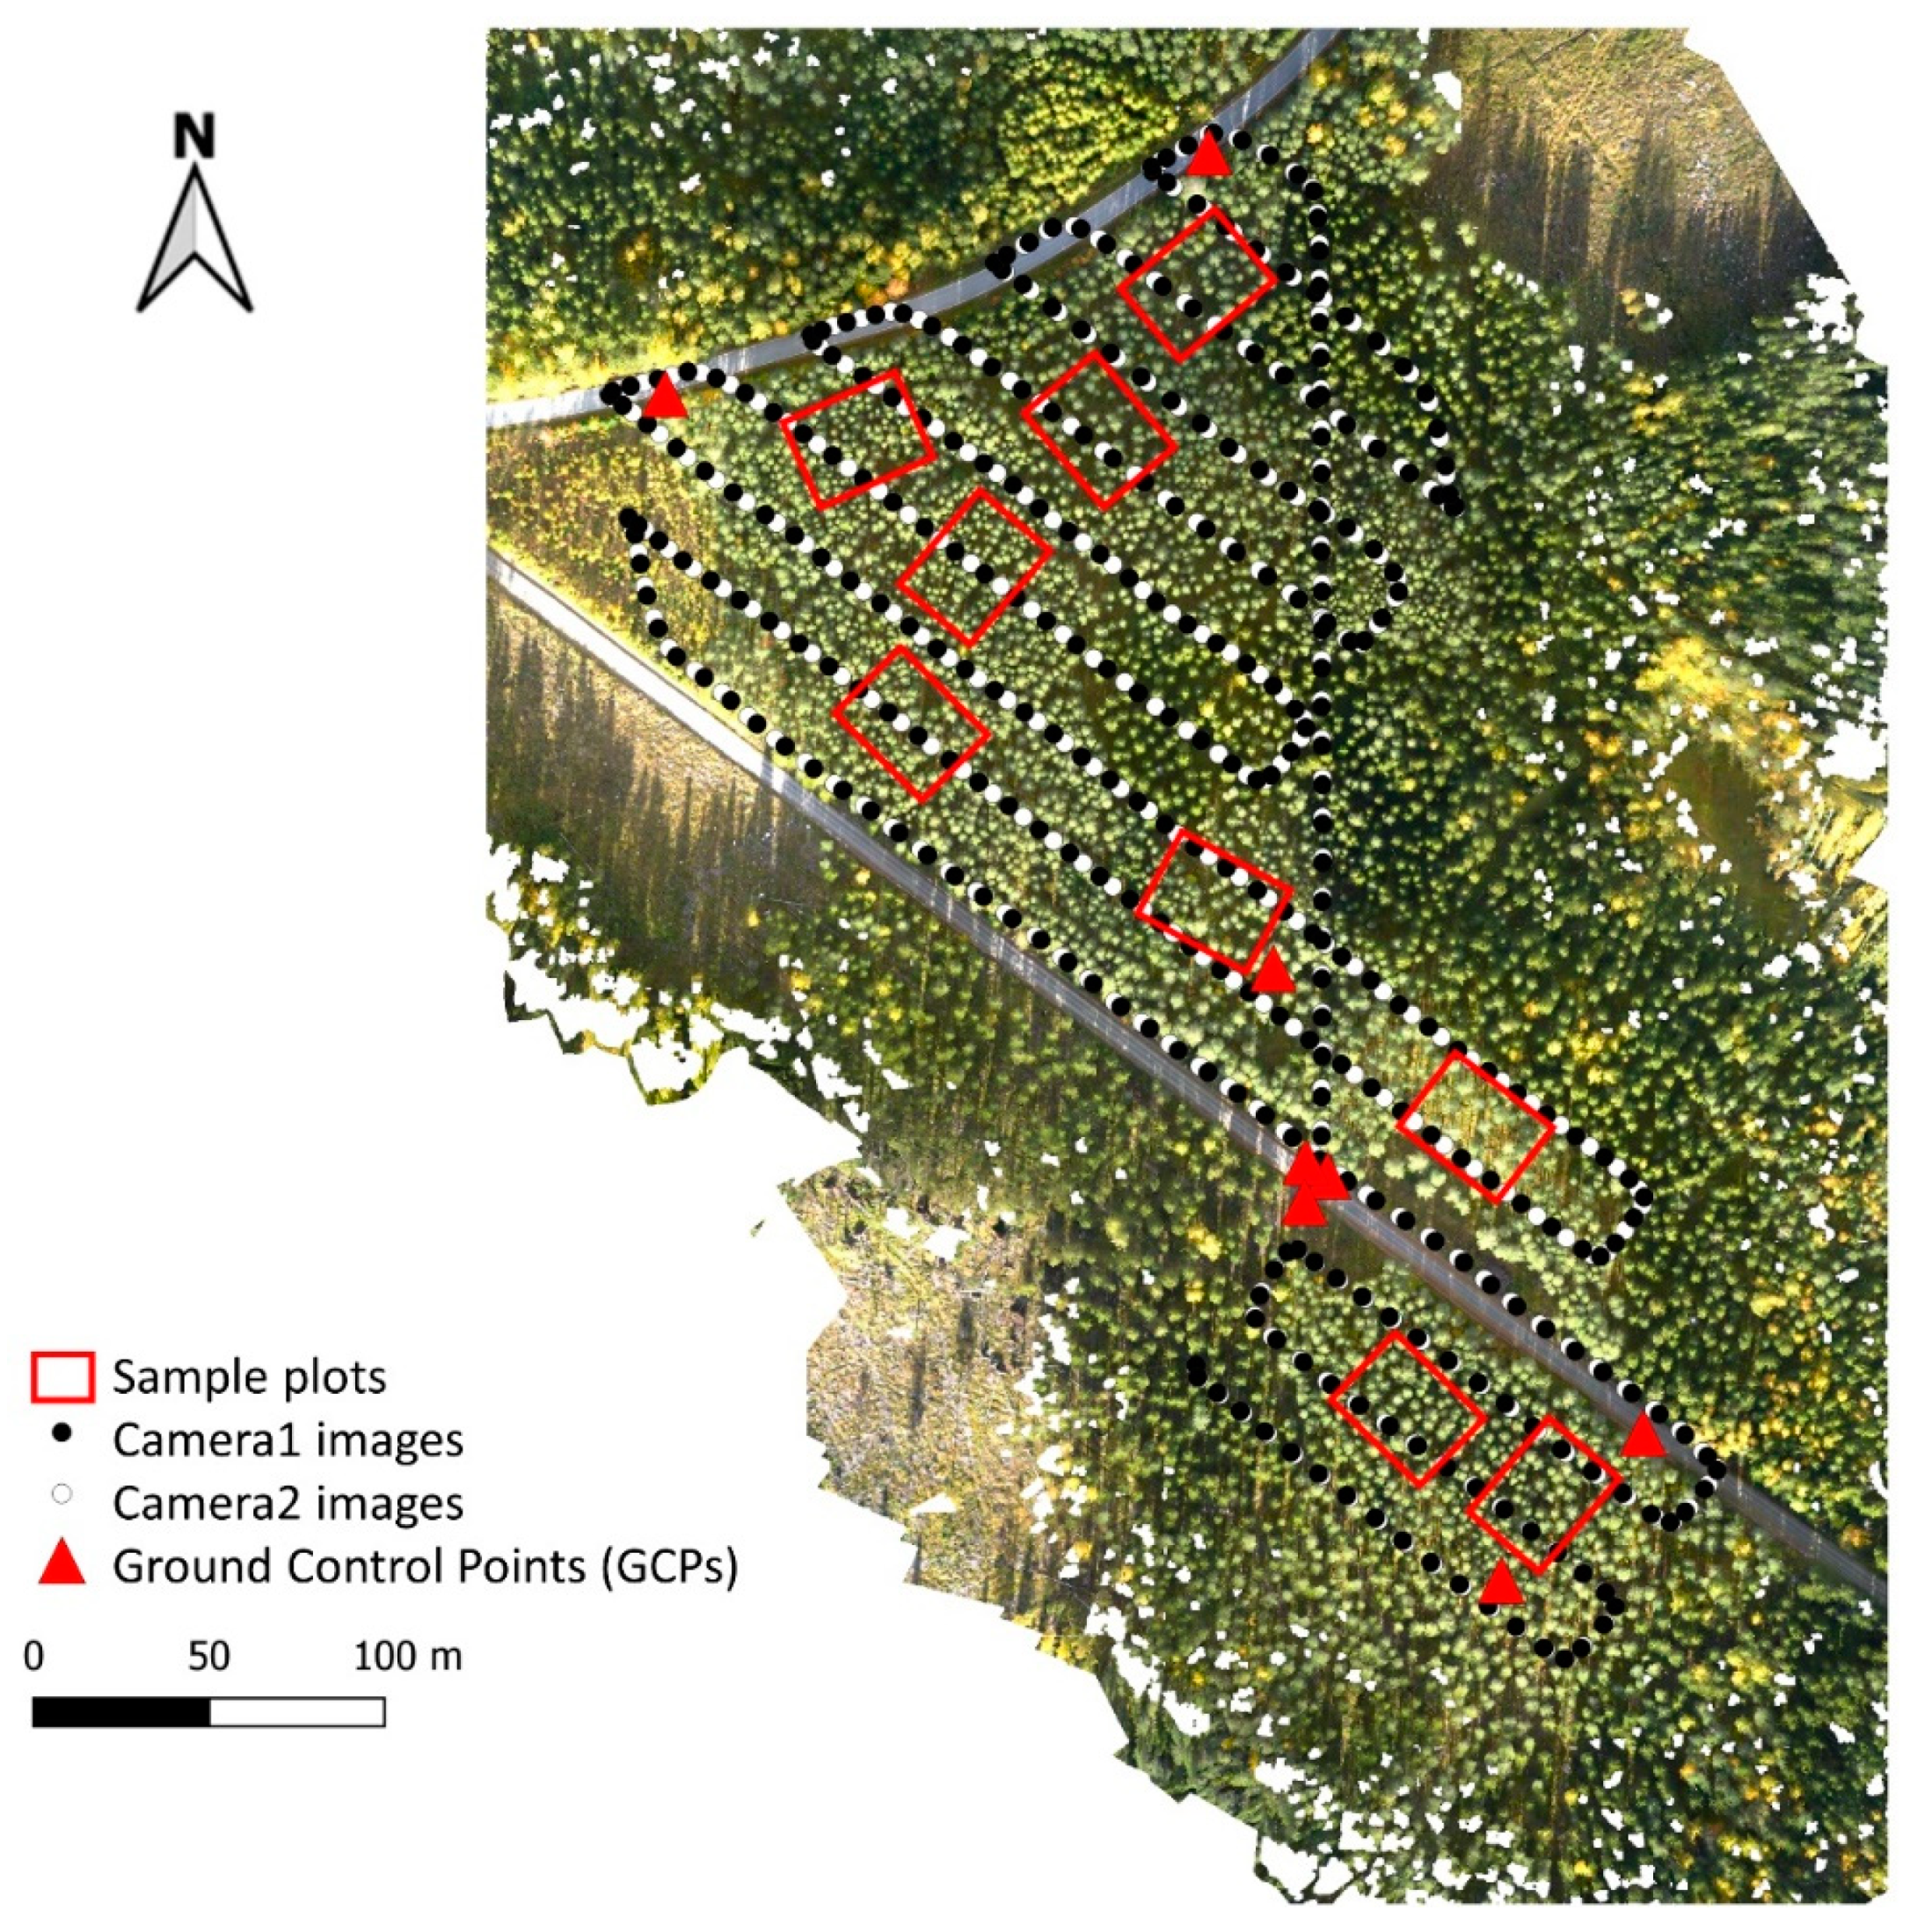
2.2. Acquisition and Preprocessing of Terrestrial Laser Scanning and Photogrammetric Point Clouds

The multisensorial point cloud data consisted of TLS point clouds and photogrammetric UAV point clouds. The TLS data acquisition was carried out with a Trimble TX5 3D laser scanner (Trimble Navigation Limited, USA) for all three study sites between September and October 2018 (see [44]). Eight scans were placed to each sample plot and a scan resolution of the point distance approximately 6.3 mm at 10-m distance was used. Artificial constant sized spheres (i.e., diameter of 198 mm) were placed around the sample plots and used as reference objects for registering the eight scans onto a single, aligned coordinate system. The registration was carried out with the FARO Scene software (version 2018) with a mean distance error of 2.9 mm and a standard deviation of 1.2 mm, the mean horizontal error was 1.3 mm (standard deviation 0.4 mm) and the mean vertical error 2.3 mm (standard deviation 1.2 mm).
The UAV point clouds were acquired using a Gryphon Dynamics quadcopter equipped with an Applanix APX-15-EI UAV positioning system consisting of a multiband GNSS, an Inertial Measurement Unit (IMU), a Harxon HX-CHX600A Antenna, and two Sony A7R II digital cameras that had CMOS sensors of 42.4 MP with Sony FE 35 mm f/2.8 ZA Carl Zeiss Sonnar T* lenses. To enhance the 3D digitization of trees [46] and inclusion of more ground control points (GCPs) [47], the two cameras were mounted on +15° and −15° oblique zenith angles in a stabilized rack with the APX-15 EI UAV. Images were triggered via a Sony Timelapse software in every two seconds and camera hot shoe output signals were sent to the Applanix APX-15-EI UAV to get the image locations for each capture. Furthermore, we calculated Post Processed Kinematic (PPK) GNSS solutions and angles for each camera in an Applanix POSPac UAV (version 8.2, Applanix, Canada) software, using a RINEX service of the National Land Survey of Finland (NLS), which offers observation data from the FinnRef stations. Flight paths were from southeast to northwest in the Palomäki (see Figure 2) and the Pollari study sites and from northeast to southwest in the Vesijako study site to ensure that the sun angle remained consistent with respect to the flight path direction. With a flying altitude of 140 m and a flying speed of 5 m/s, a total of 1916 images were captured, resulting in 1.42 to 1.87 cm ground sampling distance (GSD), 87% to 90% forward and 78% to 83% side overlaps at the ground level, depending on the study site. At treetops, the variation in GSD as well as forward and side overlaps were 1.21 to 1.57 cm, 84% to 89%, and 74% to 82%, respectively. Eight GCPs were precisely measured for each study site using the Topcon Hiper HR RTK GNSS receiver (Topcon, Tokyo, Japan). The photogrammetric processing was carried out using an Agisoft Metashape Professional software [48], following a similar processing workflow as presented in [49]. Photogrammetric point clouds were generated using the quality setting “high” (i.e., using images with two-times magnified pixel size) and the depth filtering setting “mild” to reduce erroneous points while retaining small features of interest as much as possible, such as treetops (see, e.g., [47,50]). In the bundle adjustment, the root-mean–square–errors (RMSEs) were 0.29–1.75 cm for the X-, Y- and Z-coordinates. As a result, the dense UAV point clouds were obtained with a reprojection error of 0.65–0.70 pixels, point cloud resolution of 3.11–3.53 cm/pixel, and a point density of 804–1030 points/m2, depending on the study site.
The TLS and UAV point clouds were normalized and registered to obtain the multisensorial dataset (Figure 3). The point cloud normalization was conducted separately for the TLS and UAV point clouds using a LAStools software [51]. The TLS point clouds were normalized following a similar procedure presented in [52], whereas a publicly available 2 × 2 m digital terrain model (DTM) with an expected vertical accuracy of 30 cm (National Land Survey of Finland) was utilized when normalizing the UAV point clouds. The normalized datasets were then registered and merged using a 3D rigid transformation where a transformation matrix was computed based on the coordinates of tie points manually extracted for each sample plot.

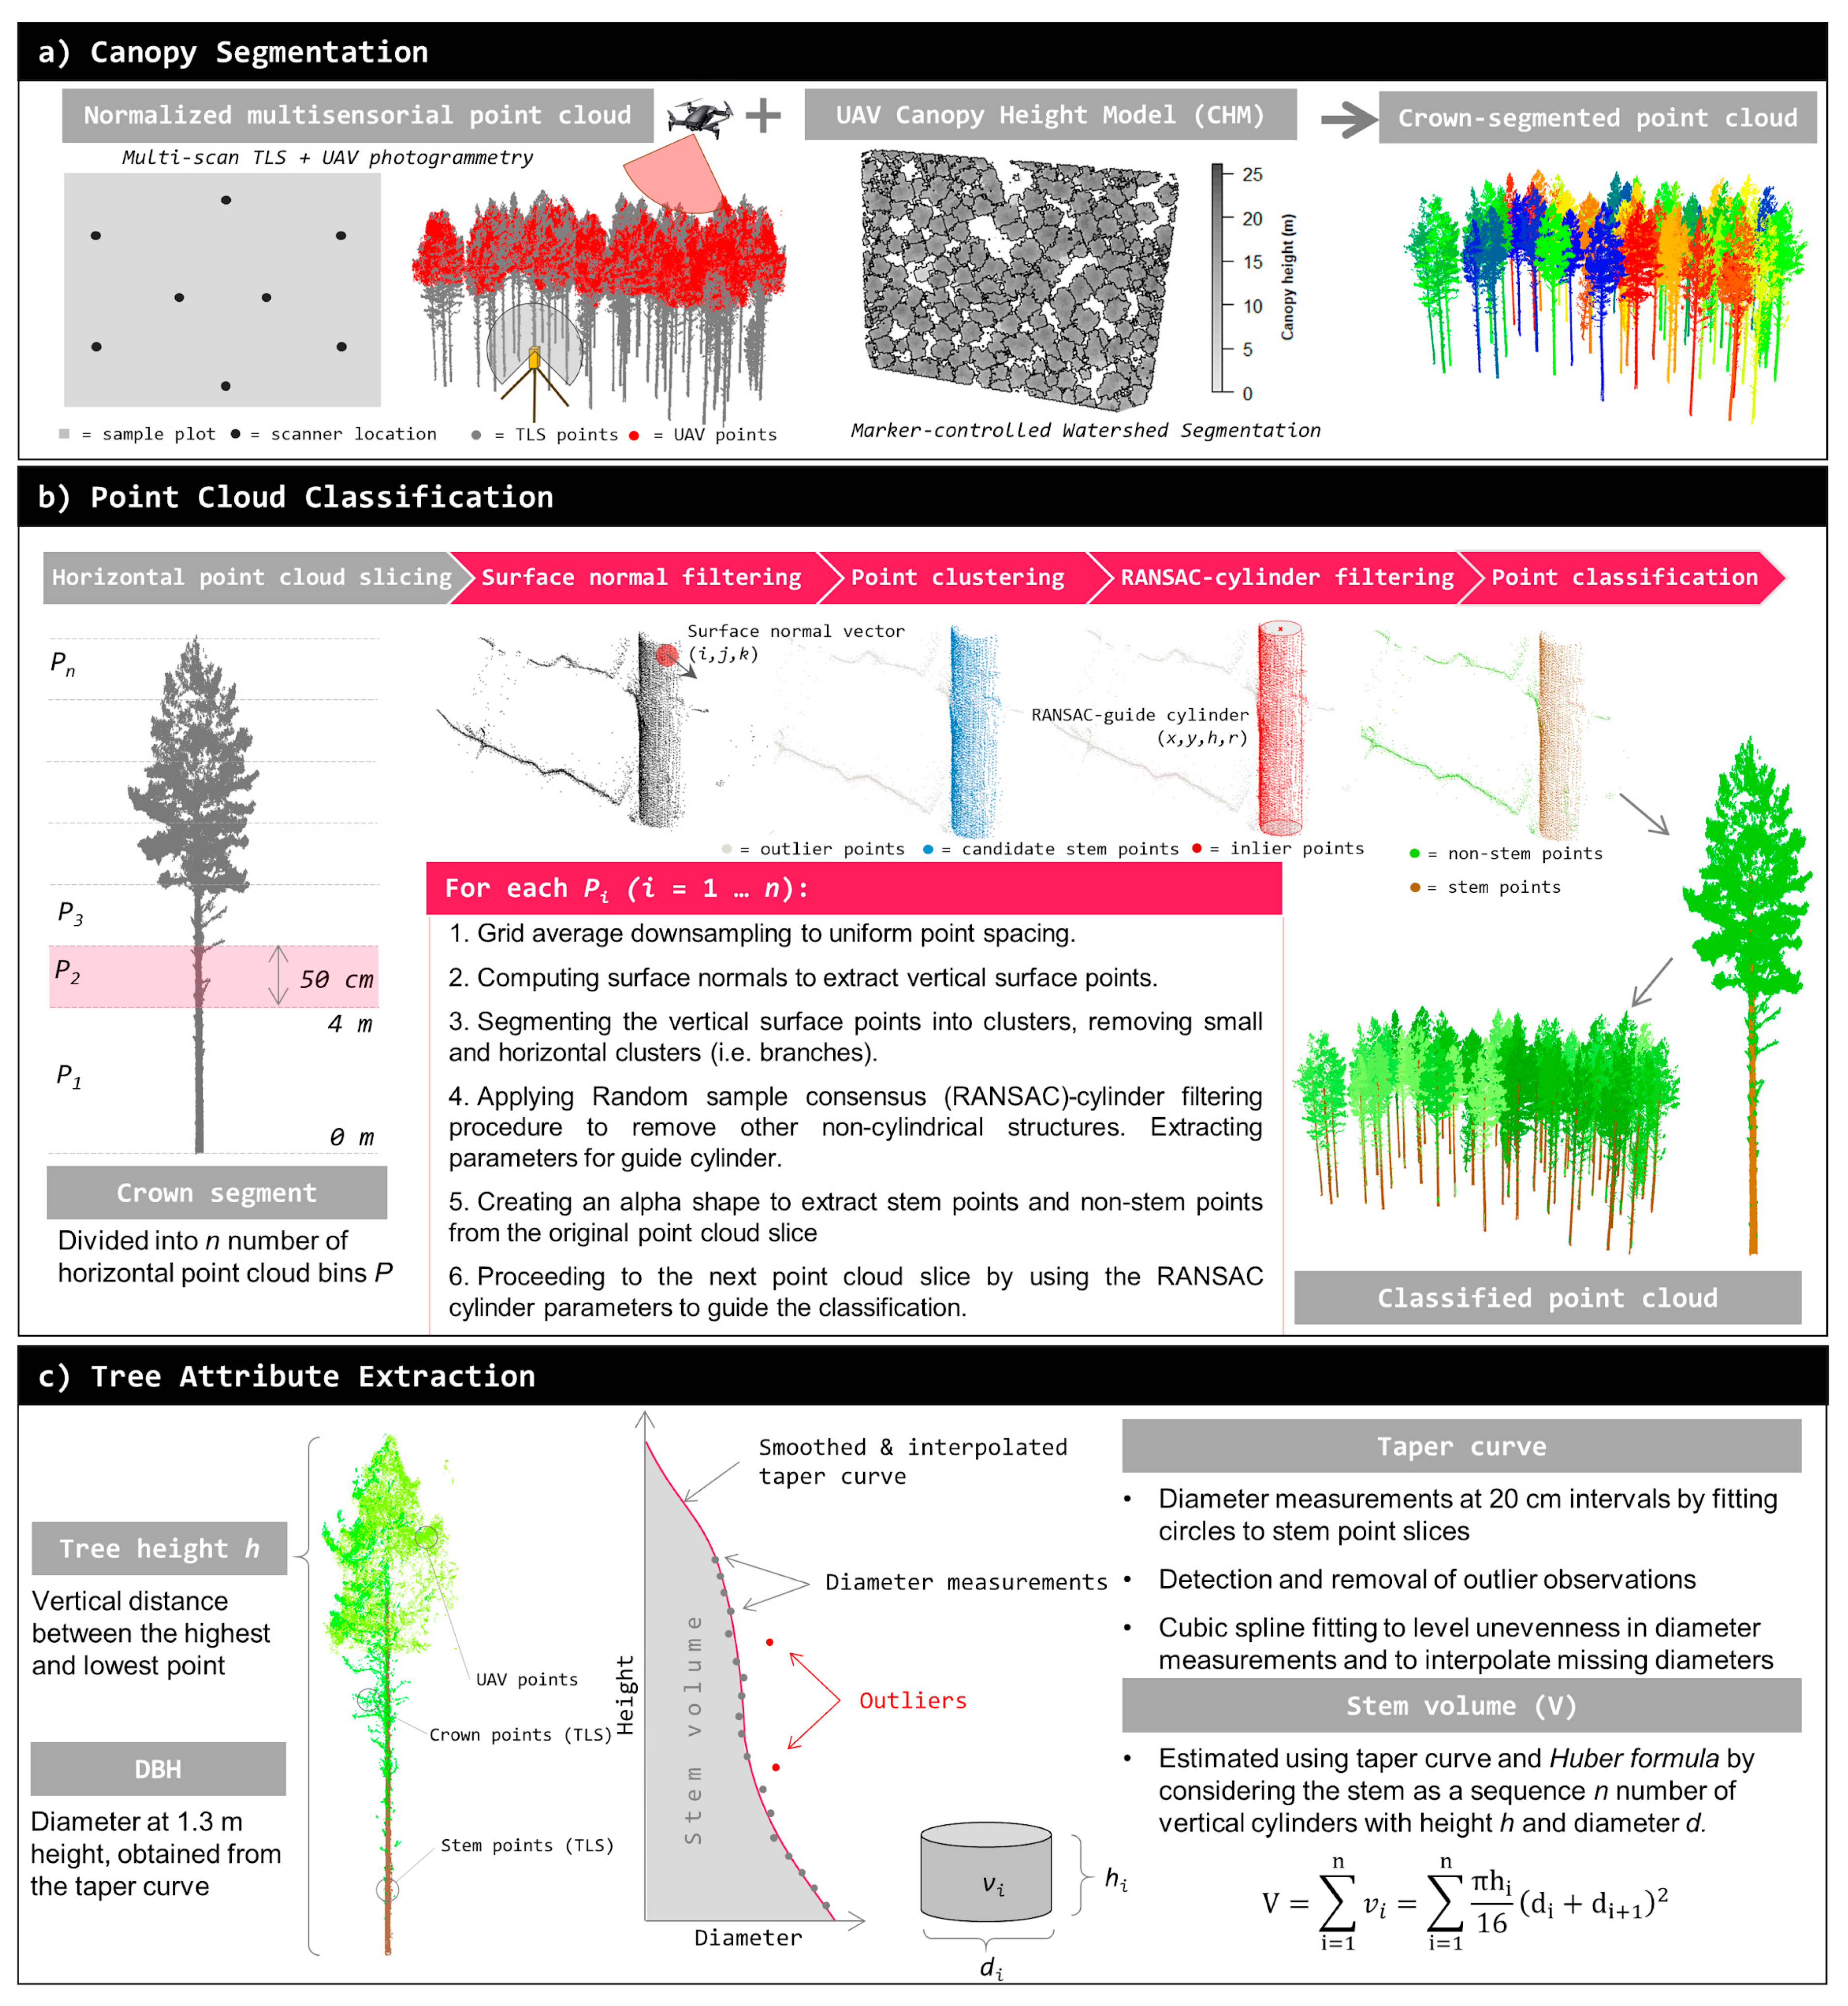
2.3. Deriving Forest Structural Attributes Using Terrestrial Laser Scanning and Multisensorial Point Clouds

A point cloud processing method presented in [53] was used in this study to segment trees, classify the point clouds into stem and crown points, and measure tree attributes from the point clouds (Figure 3). It should be noted that the same processing workflow was used for the TLS as for the multisensorial (TLS+UAV) point clouds. After the single tree attributes were derived, the forest structural attributes were aggregated from the tree attributes using the Equations 1–5. The method is explained in detail below.
First, a raster-based canopy segmentation was carried out to partition the point clouds into smaller areas to speed up the computations in further stages of the processing workflow (Figure 3a). CHMs at a 20-cm resolution were generated from the normalized point clouds using the LAStools software [51]. The UAV point clouds were used when generating the CHMs in the multisensorial approach. A Variable Window Filter approach [54] was used to identify the local maxima from the CHMs and a Marker-Controlled Watershed Segmentation [55] was then applied to delineate canopy segments. Finally, the point clouds were split according to the extracted crown segments using a point-in-polygon approach.
At this point it was assumed that each crown segment may contain multiple trees if crowns of adjacent trees were overlapping. These trees were separated from each other and the segmented point clouds were further classified into stem points and non-stem points using a point cloud classification approach (Figure 3b). The classification of points was based on the general assumption that stem points have more planar, vertical, and cylindrical characteristics than points representing branches and foliage [30,52]. These characteristics were distinguished by applying a surface normal filtering, a point cloud clustering, and a Random Sample Consensus (RANSAC)-cylinder filtering to horizontal point cloud slices. A more detailed description of the separating possible several trees within crown segments and the point cloud classification procedure can be found in [53].
The tree attributes, namely dbh, tree height, and stem volume, were extracted from the classified point clouds as follows (see Figure 3c): tree height was determined as the vertical distance between the lowest and the highest point for each tree. A stem taper curve was estimated by measuring diameters by fitting a circle at 20-cm vertical intervals to the stem points. Outliers in the diameter-height observations were filtered out by comparing the measured diameters to the mean of the three previous (or the three closest at the bottom of a stem) diameters. Then a cubic spline curve was fitted to the diameter-height observations to level unevenness in the diameter measurements and to interpolate the missing diameters as in [29]. A dbh was then defined as the diameter at 1.3-m height from the taper curve. A stem volume was estimated by considering the stem as a sequence of vertical cylinders with a height of 10 cm and aggregating them. Finally, the plot-level forest structural attributes, TPH, G, Vmean, Dg, Hg, were computed from tree attributes according to Equations (1)–(5).

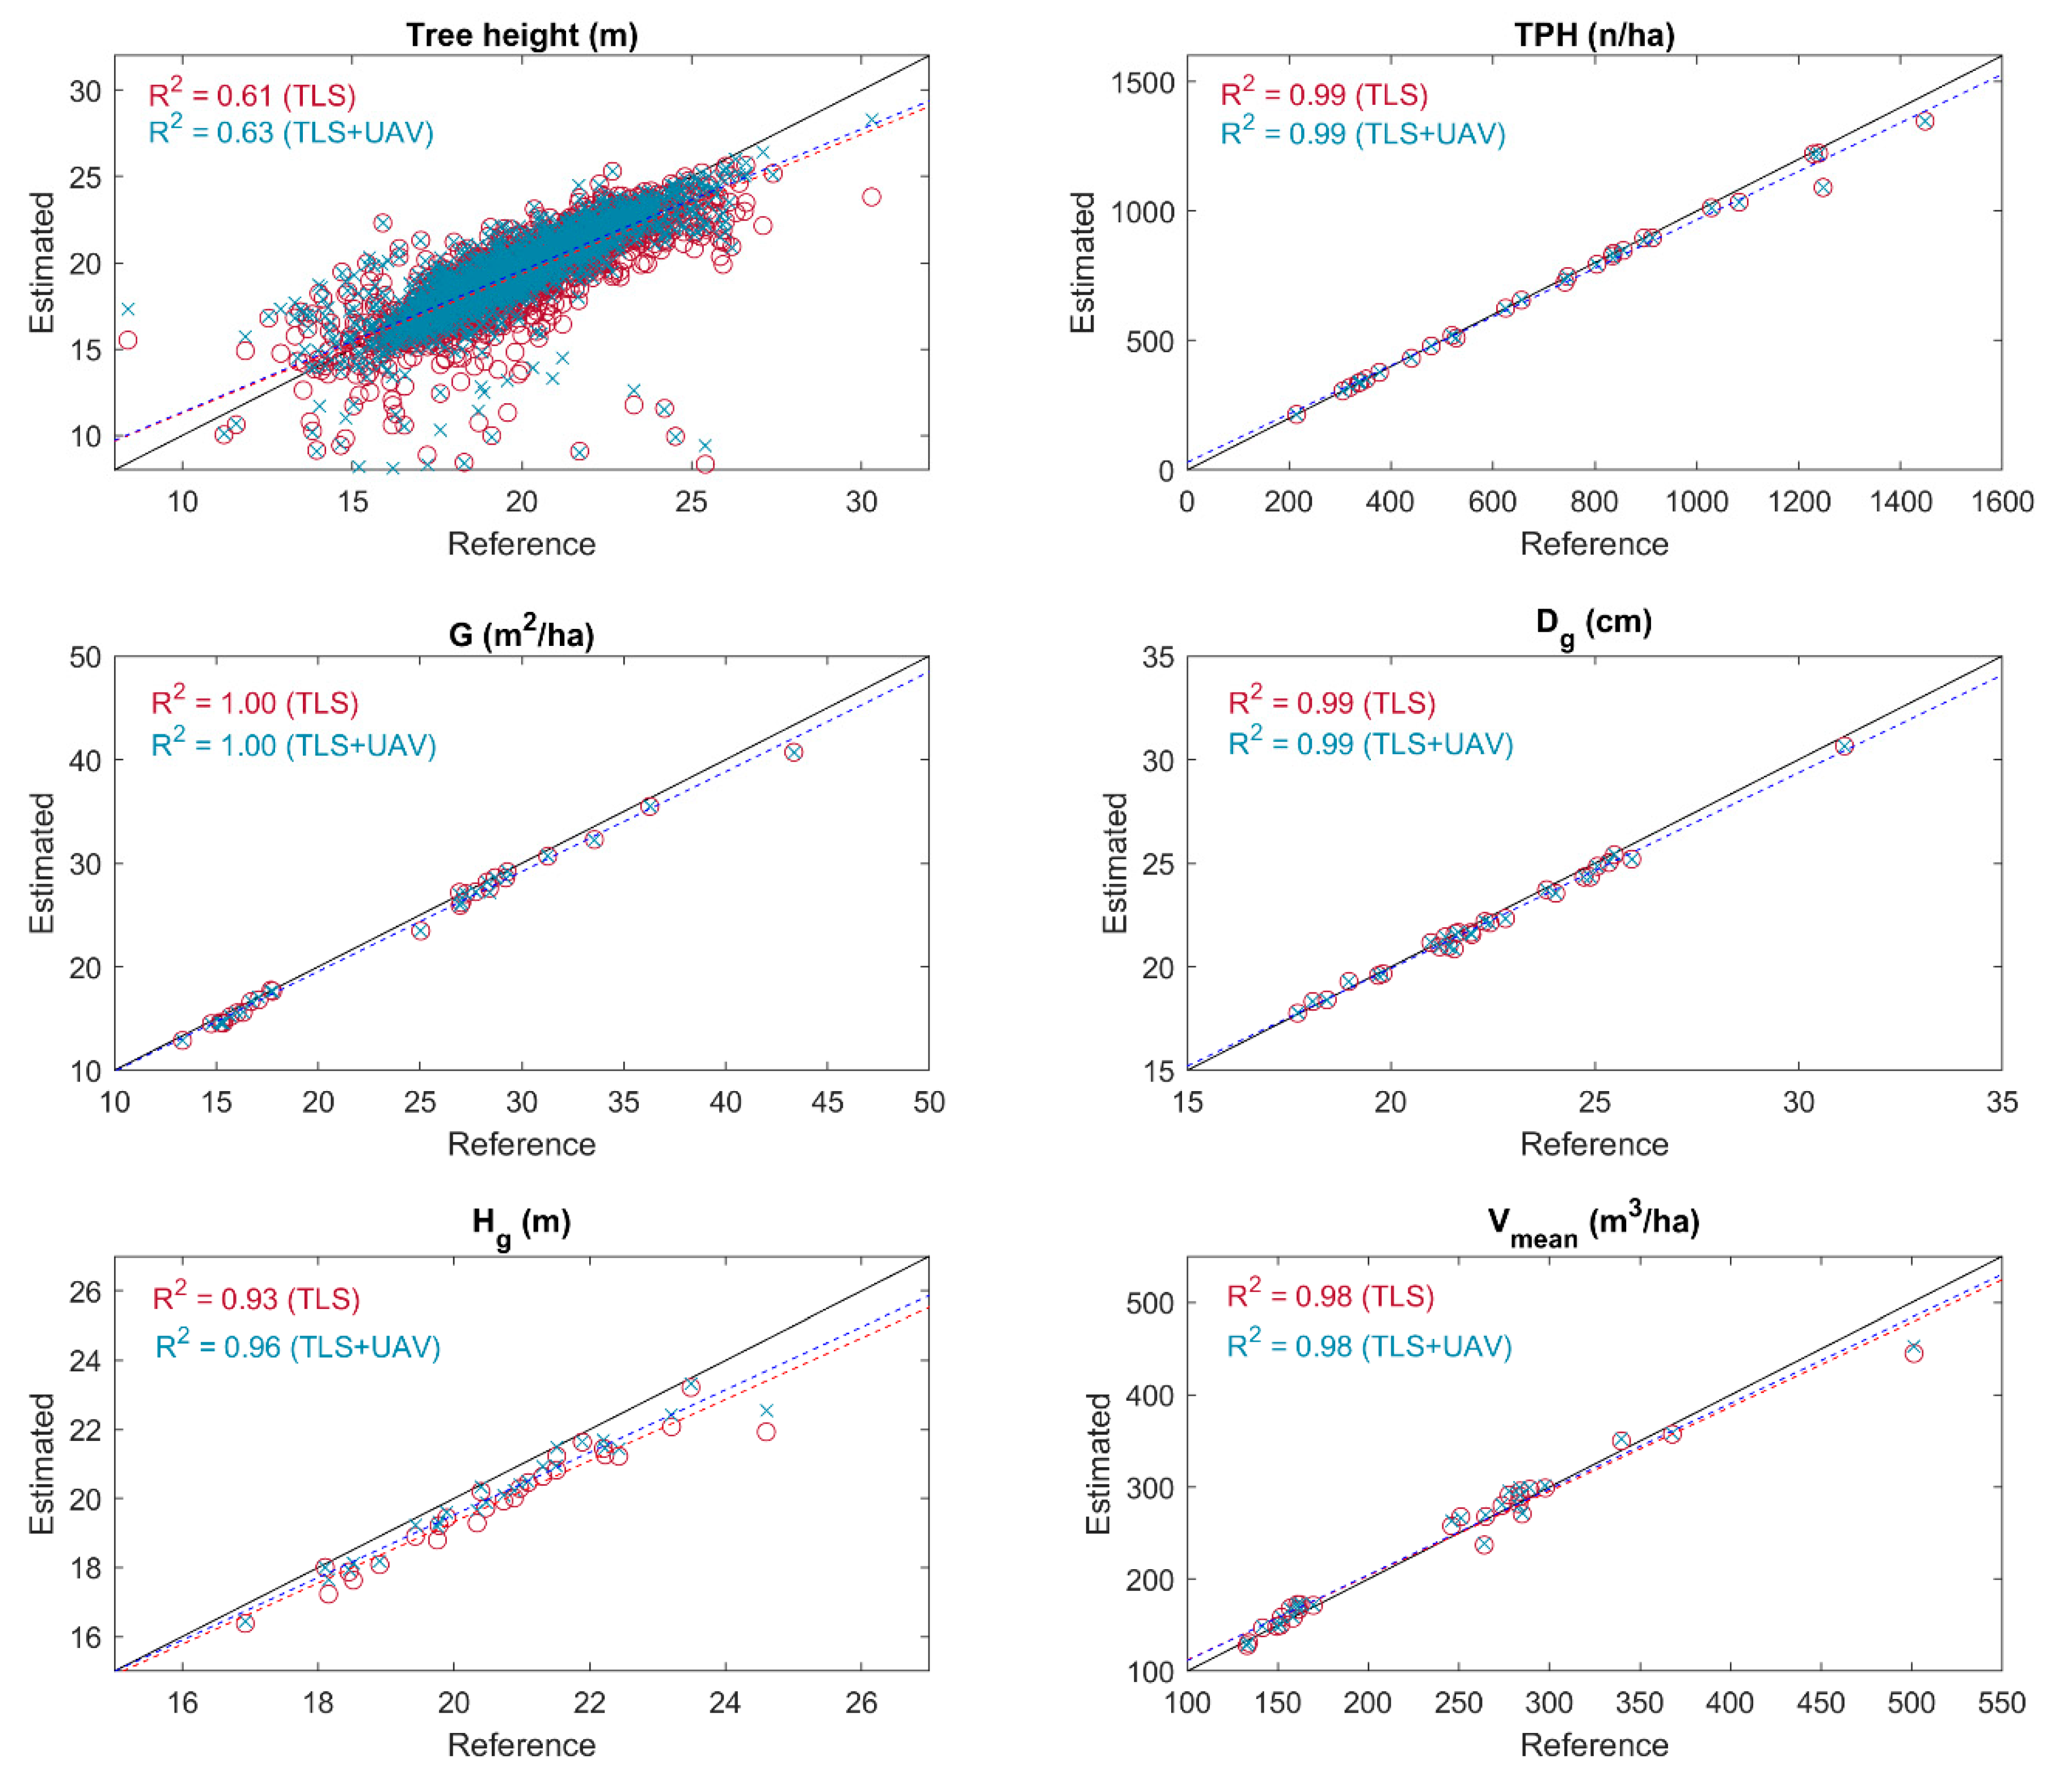
2.4. Performance Assessments

Performance of the methods (i.e., TLS only and TLS+UAV) to characterize the forest structure was assessed by comparing the point cloud-derived tree height for individual trees and the plot-level forest structural attributes (TPH, G, Dg, Hg, Vmean) with the field-measured ones by using bias (mean error) and RMSE as accuracy measures
b i a s = i = 1 n ( X ^ i X i ) n
R M S E = i = 1 n ( X ^ i X i ) 2 n
where n is the number of sample plots, X ^ i is the TLS- or multisensorial point cloud-derived tree attribute or forest structural attribute for plot i, and X i is the corresponding attribute based on field inventory. In addition, the coefficient of determination (R2) was used to describe the proportion of the variance that the point cloud-based approaches could capture from the forest structural attributes. The tree detection accuracy was evaluated by computing how large a part of the field-measured trees was automatically detected from the point clouds and how large a portion of the total tree stem volume these trees represented.

3. Results

There were no differences in the tree detection accuracy between the use of only TLS data and multisensorial point clouds (Table 2, Figure 4). Out of the total number of 2102 Scots pine trees, 2076 (98.8%) were automatically detected with both approaches. The stem volume of the detected trees accounted for 99.5% of the stem volume of all the Scots pine trees. On average, the tree height was underestimated by 0.33 m (1.7%) and the RMSE in the tree height measurements was 1.47 m (7.4%) with the multisensorial approach. The accuracy was slightly decreased when the measurements were only based on the TLS data, as the tree height was underestimated by 0.65 m (3.3%) with an RMSE of 1.64 m (8.3%). In TPH, G and Dg, there were no differences in the bias or the RMSE when these attributes characterizing the forest horizontal structure were derived from the TLS or the multisensorial point clouds (Table 2). TPH, G and Dg were all slightly underestimated (1%–2.5%) whereas the RMSEs for TPH, G, and Dg were 4.8%, 3.3% and 1.5%, respectively. The estimation accuracies of Hg and Vmean, on the other hand, differed between the TLS-only and the multisensorial approach. In Hg, the bias decreased from −0.75 m (−3.6%) to −0.45 m (0.58%) and the RMSE from 0.88 m (4.3%) to 0.58 m (2.8%) when the multisensorial approach was used instead of only TLS data. In Vmean the multisensorial approach provided a slightly lower RMSE (12.81% vs. 14.55% from TLS-only) compared to the TLS, but the estimates included more bias (4.97% vs. 0.82%).

4. Discussion

We investigated how much the forest characterization capacity can be improved in managed Scots pine forests if TLS point clouds are complemented with photogrammetric point clouds acquired from above a canopy using an UAV (i.e., multisensorial close-range sensing approach). We hypothesized that the different measurement geometries between the TLS and the UAV point cloud data would lead to a more complete characterization of single trees and therefore to a more complete characterization of the vertical and the horizontal forest structure. We assessed the performance of the vertical and horizontal characterization by using the most common forest structural attributes, in which TPH, G, and Dg represented the horizontal variation of the Scot pine plots, whereas Hg described their vertical structure, and Vmean was affected by both the vertical and the horizontal structure. The results supported our hypothesis, as the forest structural attributes directly related to the vertical forest structure were more accurately estimated with the multisensorial point clouds (Table 2). Additional benefits from the photogrammetric UAV point clouds were seen in the tree segmentation stage of the data processing. However, the multisensorial close-range sensing approach did not considerably improve the characterization of the horizontal forest structure compared to the use of only the TLS point clouds. This finding was somewhat unexpected, as the different measurement geometries were assumed to also lead to an improved tree detection as different trees were anticipated to be occluded in the TLS and the UAV data. Though, it should be noted that the sample plots located in managed Scots pine stands and already the TLS-based tree detection rate was better than has been reported in most of the studies in boreal forests [21,52]. In more complex forests, use of multisensorial data should theoretically improve the tree detection rate, and therefore the estimation of TPH, G, Dg as well as Vmean.
The tree detection from TLS point clouds is greatly dependent on the comprehensiveness of a point cloud. A grid of 10 m between the scan positions produced uniform data for a detailed characterization of even tropical trees [56]. It was reported in [57] that the highest tree detection rate of 82% was obtained with seven scan locations at the vertices of a hexagon together with a center scan in temperate forests. The RMSE of tree height estimates varied between 2.8 and 4.7 m (13%–30%) in [21], which is considerably higher than the results obtained with the TLS data only here (i.e., RMSE of 1.6 m). It should be noted, however, that the scan design was different between these two studies (i.e., five scan locations in [21] and eight in our study) together with the fact that the plots in [21] had a more complex tree species composition compared to the pure Scots pine plots in this study. The improvements for the estimates of TPH, G, Dg, Hg, and Vmean between [52] and our study is also noticeable, indicating the effect of a forest structure but also a scan design in a reliable characterization of the forest structure. Automatic and manual measurements of tree height from 3D point clouds acquired with a laser sensor mounted on an UAV showed an RMSE of ≥10% and a bias of ~3% [58]. Although the inclusion of the UAV point clouds provided only slightly lower RMSE (2.8%) and bias (−2.2%) for Hg compared to the TLS data only (4.3% and −3.6%, respectively), here, the RMSE especially was considerably lower than reported by [58]. Although there was a difference between the UAV sensors, the difference in heterogeneity in a forest structure is assumed to be the main reason for the differences between these two studies.
A forest structure can be characterized by using field inventories [27], close-range sensing [4,27,56] or remote sensing [5,59]. In field inventories, typically calipers are used for dbh and clinometers for the tree height measurements. If tree positions are mapped, a global navigation satellite system and a tacheometer are needed. Field inventories can be time-consuming, require skillful personnel, and measurements are prone to human errors. Nevertheless, field inventories provide reliable information from trees, but from a limited number of tree attributes (such as species, dbh and height). Still, forest field inventories are most often considered as a reference for other forest characterization methods [27]. Technologies such as airborne laser scanning and digital stereo interpretation of aerial imagery (e.g., [60]) provide the state-of-the-art in characterizing forests based on remote sensing techniques as large forested areas and landscapes can be characterized with these techniques. Generally, direct observations from the traditional forest inventory attributes are not attainable with these techniques but instead are derived from observations of heights of a canopy, height variations, canopy covers, and spectral properties of sample units [60]. Thus, reference information from the attributes of interest are required as prediction models between the attributes of interest and the remote sensing observations are generated. Another limitation relates to the amount of detected trees; typically, only dominant trees or trees contributing to a canopy surface can be identified [20,22,23]. Close-range sensing technologies include, but are not limited to, TLS and UAVs [4,61,62] and they can be used in characterizing single forest stands or small forested landscapes [61]. Although multiple TLS scans are required from each forest stand to capture its structure. Time consumption on the site with TLS is slightly less than in treewise field inventories with calipers and clinometers. However, TLS provides a more complete description of a forest structure, especially below a crown base height [32], and the measurements are objective. In dense forest stands, the occlusion may limit the number of observations that are received from stems and crowns which decreases the forest characterization capacity [4,59]. In general, the number of scans that are required for the automatic detection of each tree [23,52], tree species recognition [63], and systematic underestimation of tree height [21] are the major bottlenecks when mere TLS is used for characterizing forests. UAV photogrammetry has the same limitations as airborne remote sensing technologies, in particular, their unsuitability for direct measurement of single tree attributes. However, UAVs offer flexibility to data acquisition and lower flying costs over small areas than aircrafts [64]. Considering the strengths and weaknesses of the above alternatives for characterizing forest at single tree level, it seems beneficial to combine TLS and UAV data. This statement is also supported by our findings. Compared to the use of TLS data only, the multisensorial approach was able to improve the characterization of the forest structure. In our multisensorial approach, the TLS data was complemented with UAV photogrammetry, but a similar outcome is expected with any comparable photogrammetric or laser scanning point cloud collected from manned or unmanned platforms. The advantage of the UAV photogrammetric approach is that the system cost is low, and its operation is highly automated. Thus, it does not considerably increase the costs or complexity of TLS campaigns, where an operator is in the field anyway. It should be noted that we did not test the use of UAV data alone. However, based on the existing knowledge, it is known that by using similar sensors that were used here, a complete tree detection and tree stem characterization is still challenging [17,65].
We aimed for developing methodologies and technologies that can be used to characterize single trees, forest plots and, even further, to improve our understanding on tree populations at varying scales. Instead of calipers and clinometers, researchers and forest organizations are more and more interested in using close-range remote sensing sensors for characterizing forests. Based on our study, it is beneficial to combine point clouds that are collected below and above a canopy using TLS and UAV for characterizing the horizontal and vertical structure of managed forests.

5. Conclusions

The automatic forest characterization based on the multisensorial data consisting of the photogrammetric UAV and the multi-scan TLS point clouds could detect almost all the Scots pine trees within the sample plots while providing reliable estimates for the forest structural attributes. Compared to the use of only the TLS point clouds, improvement in the accuracy of tree height measurements as well as estimates of Hg and Vmean was recorded when the photogrammetric UAV and the TLS point clouds were combined. However, in managed Scots pine forests, TLS alone also captured the upper parts of the forest canopy rather well and the tree height measurements and the Hg estimates were only slightly underestimated with bias of 0.65 and 0.75 m, respectively. Although the enhancement of the multisensorial approach was incremental in characterizing the vertical structure of the single-species and single-layer Scots pine plots, the representation of complex forest structures may benefit more from point clouds that have been collected using sensors with different measurement geometries.

Author Contributions

Conceptualization, Tuomas Yrttimaa, Mikko Vastaranta, Ninni Saarinen; data collection, Tuomas Yrttimaa, Ninni Saarinen, Ville Kankare, Niko Viljanen; data processing, Tuomas Yrttimaa, Niko Viljanen; formal analysis, Tuomas Yrttimaa; funding, Markus Holopainen, Eija Honkavaara, Ninni Saarinen, Mikko Vastaranta; supervision, Mikko Vastaranta, Eija Honkavaara; resources, Juha Hyyppä, Jari Hynynen, Saija Huuskonen; writing—original draft preparation, Tuomas Yrttimaa, Mikko Vastaranta, Ninni Saarinen; writing—review and editing, all the authors. All authors have read and agreed to the published version of the manuscript.

Funding

This research was funded by the Academy of Finland, grant numbers 315079 (“The effects of stand dynamics on tree architecture of Scots pine trees”), 272195 (“Centre of Excellence in Laser Scanning Research”) and 327861 (“Autonomous tree health analyzer based on imaging UAV spectrometry”).

Acknowledgments

The authors would like to thank the anonymous reviewers for their insightful comments and suggestions.

Conflicts of Interest

The authors declare no conflict of interest.

References

  1. Crowther, T.W.; Glick, H.B.; Covey, K.R.; Bettigole, C.; Maynard, D.S.; Thomas, S.M.; Smith, J.R.; Hintler, G.; Duguid, M.C.; Amatulli, G.; et al. Mapping tree density at a global scale. Nature 2015, 525, 201–205. [Google Scholar] [CrossRef]
  2. Kapos, V. Seeing the forest through the trees. Science 2017, 355, 347–349. [Google Scholar] [CrossRef]
  3. Sutherland, W.J.; Freckleton, R.P.; Godfray, H.C.J.; Beissinger, S.R.; Benton, T.; Cameron, D.D.; Carmel, Y.; Coomes, D.A.; Coulson, T.; Emmerson, M.C.; et al. Identification of 100 fundamental ecological questions. J. Ecol. 2013, 101, 58–67. [Google Scholar] [CrossRef]
  4. Liang, X.; Kankare, V.; Hyyppä, J.; Wang, Y.; Kukko, A.; Haggrén, H.; Yu, X.; Kaartinen, H.; Jaakkola, A.; Guan, F.; et al. Terrestrial laser scanning in forest inventories. ISPRS J. Photogramm. Remote Sens. 2016, 115, 63–77. [Google Scholar] [CrossRef]
  5. White, J.C.; Coops, N.C.; Wulder, M.A.; Vastaranta, M.; Hilker, T.; Tompalski, P. Remote Sensing Technologies for Enhancing Forest Inventories: A Review. Can. J. Remote Sens. 2016, 42, 619–641. [Google Scholar] [CrossRef] [Green Version]
  6. Hyyppä, J.; Yu, X.; Hyyppä, H.; Vastaranta, M.; Holopainen, M.; Kukko, A.; Kaartinen, H.; Jaakkola, A.; Vaaja, M.; Koskinen, J.; et al. Advances in Forest Inventory Using Airborne Laser Scanning. Remote Sens. 2012, 4, 1190–1207. [Google Scholar] [CrossRef] [Green Version]
  7. Danson, F.M.; Morsdorf, F.; Koetz, B. Airborne and Terrestrial Laser Scanning for Measuring Vegetation Canopy Structure. In Laser Scanning for the Environmental Sciences; Heritage, G.L., Large, A.R.G., Eds.; Blackwell Publishing Ltd.: Oxford, UK, 2009; pp. 201–219. [Google Scholar]
  8. Vosselman, G. Airborne and Terrestrial Laser Scanning; CRC PressI Llc: Boca Raton, FL, USA, 2010; ISBN 9781439827987. [Google Scholar]
  9. Leberl, F.; Irschara, A.; Pock, T.; Meixner, P.; Gruber, M.; Scholz, S.; Wiechert, A. Point Clouds. Photogramm. Eng. Remote Sens. 2010, 76, 1123–1134. [Google Scholar] [CrossRef]
  10. Baltsavias, E.; Gruen, A.; Eisenbeiss, H.; Zhang, L.; Waser, L.T. High-quality image matching and automated generation of 3D tree models. Int. J. Remote Sens. 2008, 29, 1243–1259. [Google Scholar] [CrossRef]
  11. Hirschmuller, H. Accurate and Efficient Stereo Processing by Semi-Global Matching and Mutual Information. In Proceedings of the 2005 IEEE Computer Society Conference on Computer Vision and Pattern Recognition (CVPR’05), San Diego, CA, USA, 20–25 June 2005. [Google Scholar]
  12. White, J.; Wulder, M.; Vastaranta, M.; Coops, N.; Pitt, D.; Woods, M. The Utility of Image-Based Point Clouds for Forest Inventory: A Comparison with Airborne Laser Scanning. Forests 2013, 4, 518–536. [Google Scholar] [CrossRef] [Green Version]
  13. Hyyppä, J.; Inkinen, M. Detection and estimating attributes for single trees using laser scanner. Photogramm. J. Finl. 1999, 16, 27–42. [Google Scholar]
  14. Vauhkonen, J.; Tokola, T.; Packalén, P.; Maltamo, M. Identification of Scandinavian commercial species of individual trees from airborne laser scanning data using alpha shape metrics. For. Sci. 2009, 55, 37–47. [Google Scholar]
  15. Yu, X.; Hyyppä, J.; Vastaranta, M.; Holopainen, M.; Viitala, R. Predicting individual tree attributes from airborne laser point clouds based on the random forests technique. ISPRS J. Photogramm. Remote Sens. 2011, 66, 28–37. [Google Scholar] [CrossRef]
  16. Yu, X.; Hyyppä, J.; Litkey, P.; Kaartinen, H.; Vastaranta, M.; Holopainen, M. Single-Sensor Solution to Tree Species Classification Using Multispectral Airborne Laser Scanning. Remote Sens. 2017, 9, 108. [Google Scholar] [CrossRef] [Green Version]
  17. Saarinen, N.; Vastaranta, M.; Näsi, R.; Rosnell, T.; Hakala, T.; Honkavaara, E.; Wulder, M.; Luoma, V.; Tommaselli, A.; Imai, N.; et al. Assessing Biodiversity in Boreal Forests with UAV-Based Photogrammetric Point Clouds and Hyperspectral Imaging. Remote Sens. 2018, 10, 338. [Google Scholar] [CrossRef] [Green Version]
  18. Puliti, S.; Dash, J.P.; Watt, M.S.; Breidenbach, J.; Pearse, G.D. A comparison of UAV laser scanning, photogrammetry and airborne laser scanning for precision inventory of small-forest properties. For. Int. J. For. Res. 2020, 93, 150–162. [Google Scholar] [CrossRef]
  19. Kankare, V.; Räty, M.; Yu, X.; Holopainen, M.; Vastaranta, M.; Kantola, T.; Hyyppä, J.; Hyyppä, H.; Alho, P.; Viitala, R. Single tree biomass modelling using airborne laser scanning. ISPRS J. Photogramm. Remote Sens. 2013, 85, 66–73. [Google Scholar] [CrossRef]
  20. Kaartinen, H.; Hyyppä, J.; Yu, X.; Vastaranta, M.; Hyyppä, H.; Kukko, A.; Holopainen, M.; Heipke, C.; Hirschmugl, M.; Morsdorf, F.; et al. An International Comparison of Individual Tree Detection and Extraction Using Airborne Laser Scanning. Remote Sens. 2012, 4, 950–974. [Google Scholar] [CrossRef] [Green Version]
  21. Liang, X.; Hyyppä, J.; Kaartinen, H.; Lehtomäki, M.; Pyörälä, J.; Pfeifer, N.; Holopainen, M.; Brolly, G.; Francesco, P.; Hackenberg, J.; et al. International benchmarking of terrestrial laser scanning approaches for forest inventories. ISPRS J. Photogramm. Remote Sens. 2018, 144, 137–179. [Google Scholar] [CrossRef]
  22. Vauhkonen, J.; Ene, L.; Gupta, S.; Heinzel, J.; Holmgren, J.; Pitkanen, J.; Solberg, S.; Wang, Y.; Weinacker, H.; Hauglin, K.M.; et al. Comparative testing of single-tree detection algorithms under different types of forest. Forestry 2012, 85, 27–40. [Google Scholar] [CrossRef] [Green Version]
  23. Wang, Y.; Hyyppa, J.; Liang, X.; Kaartinen, H.; Yu, X.; Lindberg, E.; Holmgren, J.; Qin, Y.; Mallet, C.; Ferraz, A.; et al. International Benchmarking of the Individual Tree Detection Methods for Modeling 3-D Canopy Structure for Silviculture and Forest Ecology Using Airborne Laser Scanning. IEEE Trans. Geosci. Remote Sens. 2016, 54, 5011–5027. [Google Scholar] [CrossRef] [Green Version]
  24. Zhen, Z.; Quackenbush, L.; Zhang, L. Trends in Automatic Individual Tree Crown Detection and Delineation—Evolution of LiDAR Data. Remote Sens. 2016, 8, 333. [Google Scholar] [CrossRef] [Green Version]
  25. Newnham, G.J.; Armston, J.D.; Calders, K.; Disney, M.I.; Lovell, J.L.; Schaaf, C.B.; Strahler, A.H.; Mark Danson, F. Terrestrial Laser Scanning for Plot-Scale Forest Measurement. Curr. For. Rep. 2015, 1, 239–251. [Google Scholar] [CrossRef] [Green Version]
  26. Dassot, M.; Constant, T.; Fournier, M. The use of terrestrial LiDAR technology in forest science: Application fields, benefits and challenges. Ann. For. Sci. 2011, 68, 959–974. [Google Scholar] [CrossRef] [Green Version]
  27. Luoma, V.; Saarinen, N.; Wulder, M.; White, J.; Vastaranta, M.; Holopainen, M.; Hyyppä, J. Assessing Precision in Conventional Field Measurements of Individual Tree Attributes. Forests 2017, 8, 38. [Google Scholar] [CrossRef] [Green Version]
  28. Olofsson, K.; Holmgren, J. Single Tree Stem Profile Detection Using Terrestrial Laser Scanner Data, Flatness Saliency Features and Curvature Properties. Forests 2016, 7, 207. [Google Scholar] [CrossRef]
  29. Saarinen, N.; Kankare, V.; Vastaranta, M.; Luoma, V.; Pyörälä, J.; Tanhuanpää, T.; Liang, X.; Kaartinen, H.; Kukko, A.; Jaakkola, A.; et al. Feasibility of Terrestrial laser scanning for collecting stem volume information from single trees. ISPRS J. Photogramm. Remote Sens. 2017, 123, 140–158. [Google Scholar] [CrossRef]
  30. Liang, X.; Litkey, P.; Hyyppa, J.; Kaartinen, H.; Vastaranta, M.; Holopainen, M. Automatic Stem Mapping Using Single-Scan Terrestrial Laser Scanning. IEEE Trans. Geosci. Remote Sens. 2012, 50, 661–670. [Google Scholar] [CrossRef]
  31. Raumonen, P.; Kaasalainen, M.; Åkerblom, M.; Kaasalainen, S.; Kaartinen, H.; Vastaranta, M.; Holopainen, M.; Disney, M.; Lewis, P. Fast Automatic Precision Tree Models from Terrestrial Laser Scanner Data. Remote Sens. 2013, 5, 491–520. [Google Scholar] [CrossRef] [Green Version]
  32. Pyörälä, J.; Liang, X.; Saarinen, N.; Kankare, V.; Wang, Y.; Holopainen, M.; Hyyppä, J.; Vastaranta, M. Assessing branching structure for biomass and wood quality estimation using terrestrial laser scanning point clouds. Can. J. Remote Sens. 2018, 44, 462–475. [Google Scholar] [CrossRef] [Green Version]
  33. Kankare, V.; Holopainen, M.; Vastaranta, M.; Puttonen, E.; Yu, X.; Hyyppä, J.; Vaaja, M.; Hyyppä, H.; Alho, P. Individual tree biomass estimation using terrestrial laser scanning. ISPRS J. Photogramm. Remote Sens. 2013, 75, 64–75. [Google Scholar] [CrossRef]
  34. Calders, K.; Newnham, G.; Burt, A.; Murphy, S.; Raumonen, P.; Herold, M.; Culvenor, D.; Avitabile, V.; Disney, M.; Armston, J.; et al. Nondestructive estimates of above-ground biomass using terrestrial laser scanning. Methods Ecol. Evol. 2015, 6, 198–208. [Google Scholar] [CrossRef]
  35. Schneider, F.D.; Kükenbrink, D.; Schaepman, M.E.; Schimel, D.S.; Morsdorf, F. Quantifying 3D structure and occlusion in dense tropical and temperate forests using close-range LiDAR. Agric. For. Meteorol. 2019, 268, 249–257. [Google Scholar] [CrossRef]
  36. Wang, Y.; Lehtomäki, M.; Liang, X.; Pyörälä, J.; Kukko, A.; Jaakkola, A.; Liu, J.; Feng, Z.; Chen, R.; Hyyppä, J. Is field-measured tree height as reliable as believed—A comparison study of tree height estimates from field measurement, airborne laser scanning and terrestrial laser scanning in a boreal forest. ISPRS J. Photogramm. Remote Sens. 2019, 147, 132–145. [Google Scholar] [CrossRef]
  37. Aicardi, I.; Dabove, P.; Lingua, A.M.; Piras, M. Integration between TLS and UAV photogrammetry techniques for forestry applications. iForest Biogeosci. For. 2017, 10, 41–47. [Google Scholar] [CrossRef] [Green Version]
  38. Mikita, T.; Janata, P.; Surový, P. Forest Stand Inventory Based on Combined Aerial and Terrestrial Close-Range Photogrammetry. For. Trees Livelihoods 2016, 7, 165. [Google Scholar] [CrossRef] [Green Version]
  39. Guerra-Hernández, J.; Cosenza, D.N.; Rodriguez, L.C.E.; Silva, M.; Tomé, M.; Díaz-Varela, R.A.; González-Ferreiro, E. Comparison of ALS- and UAV(SfM)-derived high-density point clouds for individual tree detection in Eucalyptus plantations. Int. J. Remote Sens. 2018, 39, 5211–5235. [Google Scholar] [CrossRef]
  40. Kotivuori, E.; Kukkonen, M.; Mehtätalo, L.; Maltamo, M.; Korhonen, L.; Packalen, P. Forest inventories for small areas using drone imagery without in-situ field measurements. Remote Sens. Environ. 2020, 237, 111404. [Google Scholar] [CrossRef]
  41. Wallace, L.; Lucieer, A.; Malenovský, Z.; Turner, D.; Vopěnka, P. Assessment of forest structure using two UAV techniques: A comparison of airborne laser scanning and structure from motion (SfM) point clouds. For. Trees Livelihoods 2016, 7, 62. [Google Scholar] [CrossRef] [Green Version]
  42. Westoby, M.J.; Brasington, J.; Glasser, N.F.; Hambrey, M.J.; Reynolds, J.M. “Structure-from-Motion” photogrammetry: A low-cost, effective tool for geoscience applications. Geomorphology 2012, 179, 300–314. [Google Scholar] [CrossRef] [Green Version]
  43. Alonzo, M.; Andersen, H.-E.; Morton, D.; Cook, B. Quantifying Boreal Forest Structure and Composition Using UAV Structure from Motion. Forests 2018, 9, 119. [Google Scholar] [CrossRef] [Green Version]
  44. Saarinen, N.; Kankare, V.; Yrttimaa, T.; Viljanen, N.; Honkavaara, E.; Holopainen, M.; Hyyppa, J.; Huuskonen, S.; Hynynen, J.; Vastaranta, M. Assessing the effects of stand dynamics on stem growth allocation of individual Scots pine trees. bioRxiv 2020. [Google Scholar]
  45. Laasasenaho, J. Männyn, Kuusen Ja Koivun Runkokäyrä- Ja Tilavuusyhtälöt. Commun. Inst. For. Fenn. 1982, 108, 74. [Google Scholar]
  46. James, M.R.; Robson, S. Mitigating systematic error in topographic models derived from UAV and ground-based image networks. Earth Surf. Process. Landf. 2014, 39, 1413–1420. [Google Scholar] [CrossRef] [Green Version]
  47. Cunliffe, A.M.; Brazier, R.E.; Anderson, K. Ultra-fine grain landscape-scale quantification of dryland vegetation structure with drone-acquired structure-from-motion photogrammetry. Remote Sens. Environ. 2016, 183, 129–143. [Google Scholar] [CrossRef] [Green Version]
  48. Agisoft Agisoft Metashape User Manual Professional Edition. 2019. Available online: https://www.agisoft.com/pdf/metashape-pro_1_5_en.pdf (accessed on 6 May 2020).
  49. Viljanen, N.; Honkavaara, E.; Näsi, R.; Hakala, T.; Niemeläinen, O.; Kaivosoja, J. A Novel Machine Learning Method for Estimating Biomass of Grass Swards Using a Photogrammetric Canopy Height Model, Images and Vegetation Indices Captured by a Drone. Agriculture 2018, 8, 70. [Google Scholar] [CrossRef] [Green Version]
  50. Puliti, S.; Ørka, H.; Gobakken, T.; Næsset, E. Inventory of Small Forest Areas Using an Unmanned Aerial System. Remote Sens. 2015, 7, 9632–9654. [Google Scholar] [CrossRef] [Green Version]
  51. Isenburg, M. LAStools—Efficient LiDAR Processing Software. 2017. Available online: https://rapidlasso.com/lastools/ (accessed on 6 May 2020).
  52. Yrttimaa, T.; Saarinen, N.; Kankare, V.; Liang, X.; Hyyppä, J.; Holopainen, M.; Vastaranta, M. Investigating the Feasibility of Multi-Scan Terrestrial Laser Scanning to Characterize Tree Communities in Southern Boreal Forests. Remote Sens. 2019, 11, 1423. [Google Scholar] [CrossRef] [Green Version]
  53. Yrttimaa, T.; Saarinen, N.; Kankare, V.; Hynynen, J.; Huuskonen, S.; Holopainen, M.; Hyyppä, J.; Vastaranta, M. Performance of terrestrial laser scanning to characterize managed Scots pine (Pinus sylvestris L.) stands is dependent on forest structural variation. EarthArXiv 2020. [Google Scholar]
  54. Popescu, S.C.; Wynne, R.H. Seeing the Trees in the Forest. Photogramm. Eng. Remote Sens. 2004, 70, 589–604. [Google Scholar] [CrossRef] [Green Version]
  55. Beucher, M. Morphological Segmentation; Academic Press: Cambridge, MA, USA, 1990. [Google Scholar]
  56. Wilkes, P.; Lau, A.; Disney, M.; Calders, K.; Burt, A.; de Tanago, J.G.; Bartholomeus, H.; Brede, B.; Herold, M. Data acquisition considerations for Terrestrial Laser Scanning of forest plots. Remote Sens. Environ. 2017, 196, 140–153. [Google Scholar] [CrossRef]
  57. Gollob, C.; Ritter, T.; Wassermann, C.; Nothdurft, A. Influence of Scanner Position and Plot Size on the Accuracy of Tree Detection and Diameter Estimation Using Terrestrial Laser Scanning on Forest Inventory Plots. Remote Sens. 2019, 11, 1602. [Google Scholar] [CrossRef] [Green Version]
  58. Liang, X.; Wang, Y.; Pyörälä, J.; Lehtomäki, M.; Yu, X.; Kaartinen, H.; Kukko, A.; Honkavaara, E.; Issaoui, A.E.I.; Nevalainen, O.; et al. Forest in situ observations using unmanned aerial vehicle as an alternative of terrestrial measurements. For. Ecosyst. 2019, 6, 20. [Google Scholar] [CrossRef] [Green Version]
  59. Lim, K.; Treitz, P.; Wulder, M.; St-Onge, B.; Flood, M. LiDAR remote sensing of forest structure. Prog. Phys. Geogr. Earth Environ. 2003, 27, 88–106. [Google Scholar] [CrossRef] [Green Version]
  60. Vastaranta, M.; Yrttimaa, T.; Saarinen, N.; Yu, X.; Karjalainen, M.; Nurminen, K.; Karila, K.; Kankare, V.; Luoma, V.; Pyörälä, J.; et al. Airborne laser scanning outperforms the alternative 3D techniques in capturing variation in tree height and forest density in southern boreal forests. Balt. For. 2018, 28, 268–277. [Google Scholar]
  61. Vastaranta, M.; Saarinen, N.; Yrttimaa, T.; Kankare, V.; Junttila, S. Monitoring Forests in Space and Time Using Close-Range Sensing. Preprints 2020, 2020020300. [Google Scholar]
  62. Calders, K.; Jonckheere, I.; Nightingale, J.; Vastaranta, M. Remote Sensing Technology Applications in Forestry and REDD. Forests 2020, 11, 188. [Google Scholar] [CrossRef] [Green Version]
  63. Åkerblom, M.; Raumonen, P.; Mäkipää, R.; Kaasalainen, M. Automatic tree species recognition with quantitative structure models. Remote Sens. Environ. 2017, 191, 1–12. [Google Scholar] [CrossRef]
  64. Aasen, H.; Honkavaara, E.; Lucieer, A.; Zarco-Tejada, P. Quantitative Remote Sensing at Ultra-High Resolution with UAV Spectroscopy: A Review of Sensor Technology, Measurement Procedures, and Data Correction Workflows. Remote Sens. 2018, 10, 1091. [Google Scholar] [CrossRef] [Green Version]
  65. Imangholiloo, M.; Saarinen, N.; Markelin, L.; Rosnell, T.; Näsi, R.; Hakala, T.; Honkavaara, E.; Holopainen, M.; Hyyppä, J.; Vastaranta, M. Characterizing Seedling Stands Using Leaf-Off and Leaf-On Photogrammetric Point Clouds and Hyperspectral Imagery Acquired from Unmanned Aerial Vehicle. Forests 2019, 10, 415. [Google Scholar] [CrossRef] [Green Version]
Figure 1. Location of the three study sites namely Palomäki, Pollari, and Vesijako.
Ijgi 09 00309 g001
Figure 2. UAV flight lines as well as locations for the ground control points (GCPs) and sample plots are presented on top of an orthomosaic illustrating the forest structural variation in study site ‘Palomäki’.
Ijgi 09 00309 g002
Figure 3. Outline of the point cloud processing method: (a) canopy segmentation, (b) point cloud classification, and (c) tree attribute extraction.
Ijgi 09 00309 g003
Figure 4. Coefficient of determination (R2) between the reference and the estimated forest structural attributes, such as individual tree height, trees per hectare (TPH), basal area (G), basal-area weighted mean diameter (Dg), basal-area weighted mean height (Hg) and mean stem volume (Vmean) using the terrestrial laser scanning (TLS) and the combination of the TLS and the unmanned aerial vehicle (UAV) point clouds. The estimated values are based on the TLS and the multisensorial approach (TLS+UAV) and the reference values are based on the field inventory. The solid black line represents the 1:1 relationship between the reference and the estimated values.
Ijgi 09 00309 g004
Table 1. Minimum (min), mean, maximum (max) and standard deviation (sd) in trees per hectare (TPH), basal area (G,), basal-area weighted mean diameter (Dg), basal-area weighted mean height (Hg), and mean stem volume (Vmean) within the 27 sample plots based on the field inventory.
Forest Structural Attributeminmeanmaxsd
TPH (n/ha)2157181448342
G (m2/ha)13.323.743.37.9
Dg (cm)17.722.431.12.9
Hg (m)16.920.624.61.8
Vmean (m3/ha)133.1234.8501.288.6
Table 2. The accuracy of the estimated forest structural attributes, such as trees per hectare (TPH), basal area (G,), basal-area weighted mean diameter (Dg), basal-area weighted mean height (Hg), and mean stem volume (Vmean) using the terrestrial laser scanning (TLS) and the combination of the TLS and the unmanned aerial vehicle (UAV) point clouds. A negative bias denotes underestimation.
Forest Structural AttributeTLSTLS + UAV
BiasRMSEBiasRMSE
TPH (n/ha)−14.18 (−2.0%)34.22 (4.8%)−14.18 (−2.0%)34.22 (4.8%)
G (m2/ha)−0.59 (−2.5%)0.78 (3.3%)−0.59 (−2.5%)0.78 (3.3%)
Dg (cm)−0.23 (−1.0%)0.33 (1.5%)−0.23 (−1.0%)0.33 (1.5%)
Hg (m)−0.75 (−3.6%)0.88 (4.3%)−0.45 (−2.2%)0.58 (2.8%)
Vmean (m3/ha)0.82 (0.4%)14.55 (6.2%)4.97 (2.1%)12.81 (5.4%)

