Article

Risk Assessment of the Overseas Imported COVID-19 of Ocean-Going Ships Based on AIS and Infection Data

1
Institute of Logistics Science and Engineering, Shanghai Maritime University, Shanghai 201306, China
2
Logistics Engineering College, Shanghai Maritime University, Shanghai 201306, China
3
Naval Academy Research Institute, 29240 Brest, France
*
Author to whom correspondence should be addressed.
ISPRS Int. J. Geo-Inf. 2020, 9(6), 351; https://0-doi-org.brum.beds.ac.uk/10.3390/ijgi9060351
Submission received: 26 April 2020 / Revised: 20 May 2020 / Accepted: 25 May 2020 / Published: 27 May 2020

Abstract

:
Preventing and controlling the risk of importing the coronavirus disease (COVID-19) has rapidly become a major concern. In addition to air freight, ocean-going ships play a non-negligible role in spreading COVID-19 due to frequent visits to countries with infected populations. This research introduces a method to dynamically assess the infection risk of ships based on a data-driven approach. It automatically identifies the ports and countries these ships approach based on their Automatic Identification Systems (AIS) data and a spatio-temporal density-based spatial clustering of applications with noise (ST_DBSCAN) algorithm. We derive daily and 14 day cumulative ship exposure indexes based on a series of country-based indices, such as population density, cumulative confirmed cases, and increased rate of confirmed cases. These indexes are classified into high-, middle-, and low-risk levels that are then coded as red, yellow, and green according to the health Quick Response (QR) code based on the reference exposure index of Wuhan on April 8, 2020. This method was applied to a real container ship deployed along a Eurasian route. The results showed that the proposed method can trace ship infection risk and provide a decision support mechanism to prevent and control overseas imported COVID-19 cases from international shipping.

1. Introduction

The novel coronavirus disease (COVID-19) was first reported in December 2019 in Wuhan, China [1]. It was found that COVID-19 is a coronavirus with high person-to-person transmissibility and infectivity, probably higher than the previously identified Severe Acute Respiratory Syndrome (SARS) and Middle East Respiratory Syndrome (MERS) [2,3,4,5]. According to currently available data published by different research teams, the average basic reproduction number (R0) of COVID-19 indicates that the average secondary infections produced by infected people without intervention may be as high as 3.28 [3]. Unfortunately, as there is still no specific antiviral agents and vaccines available to treat this new infection, preventing person-to-person transmission measures, such as keeping suitable social distance, family quarantine, and even locking down entire cities to restrict the flow of people, have so far become the main, if not only, choice for many countries [6]. However, these measures are still not sufficient to stop the rapid spread of this coronavirus at a global scale. Therefore, most countries have witnessed a rapid increase in confirmed cases, and COVID-19 has actually begun to spread globally [6].
According to global COVID-19 outbreak statistics maintained by the Center for System Science and Engineering (CSS) at Johns Hopkins University [7] (see Figure 1), as of April 10, 2020, there were more than 1.6 million confirmed cases, nearly 100,000 deaths, and more than 350,000 recovered cases worldwide. A total of 184 countries have confirmed COVID-19 infections, with the highest number of infections currently in the United States, followed by countries in Europe including Spain, Italy, the United Kingdom, and France.
Although the pandemic is spreading globally, the pandemic in a several countries, such as China, has been effectively controlled. On April 8, 2020, the city of Wuhan, China’s most severely affected city, began lifting its lockdown, indicating a new stage of China’s pandemic control. For instance, as illustrated by the evolution of the COVID-19 pandemic in China, as shown by recent data [8], it clearly appears that one of the main challenges once the pandemic is relatively under control, is to carefully monitor imported cases thus raising the level of interest in accurate monitoring policies oriented to air, land, and maritime transportation, this being a major challenge not only for China [9] but also the world.
Preventing the risk of imported COVID-19 cases as well as supporting the resumption of the local economy has become the main focus of many countries. However, returning to work and resuming production means that people will begin to commute at a large scale; this significantly increases the risk of pandemic transmission. In order to effectively prevent a resurgence in the pandemic and resume work and production smoothly, the Alibaba Group has developed a tracing health QR (Quick Response) code system to identify different degrees of infection risks based on people’s daily activities and movements. People can obtain their health code by providing their phone number, name, and ID [8].
By scanning the QR code, a system based on these principles will show whether a given person has been in proximity to someone who has been infected using a coding system based on three different colors: green, yellow, and red—as shown in Figure 2. The red QR code represents the highest risk (i.e., potential infection) which requires 14 days of quarantine. The yellow QR code indicates general risk (i.e., caution required) and 7 days of quarantine is required. The green QR code (i.e., good health) indicates a very low or null risk of infection. People with green codes are free to move as they like such as entering public buildings, taking public transportation, and returning to work [6]. The reason for the red or yellow health codes may result from movement through key pandemic areas or close proximity to a confirmed or suspected case. The system was first applied to the city of Hangzhou and gradually applied to more than 200 other cities in China. This method has made important contributions to China’s control of the spread of the pandemic and the resumption of production [8]. Nowadays, since this method is well diffused and understood and the principles have been adopted by many countries worldwide, we considered it as a reference and it was retained for our approach to the ship risk evaluation.
While most imported COVID-19 cases mainly enter by either land or airports, depending on frontier control policies, maritime traffic also plays a non-negligible role in spreading overseas COVID-19. It is well known that international shipping has played an important role in ensuring global trade and supply chains during this coronavirus outbreak. However, ships often travel through many countries and regions, and COVID-19 can likely be brought from one country to another by the crew on board. This makes ships one of the possible channels spreading the virus, although this is probably at a different scale and magnitude compared to airlines.
For instance, it has been reported that several seafarers on board the container vessel Gjertrud Maersk tested positive for COVID-19 in China. The Gjertrud Maersk was probably the first container ship worldwide to report carrying the coronavirus [10]. Moreover, cruise ships also attract a lot of attention when it comes to imported cases. For example, the Princess cruise ship caused a large number of overseas imported cases [11,12]. Imported COVID-19 infections from international shipping should not be overlooked when making decisions or taking measures to prevent and control the risk of overseas imported viruses. Given the tight resources of countries for pandemic prevention, maximizing pandemic prevention with limited resources is a very challenging task. Evaluating the risk level of each ship and generating a customized prevention strategy is crucial. While recent studies have estimated the imported COVID-19 risk from airlines [13,14], there are still, to the best of our knowledge, very few studies investigating infection risks from international shipping.
In order to fill this gap, this study introduces a method to evaluate the dynamic risk from international shipping of COVID-19 infections based on a data-driven approach. The approach developed first automatically identifies stop events: the ports approached and the nearest countries based on AIS data and ST-DBSCAN (a density-based algorithm for discovering clusters in large spatial databases with noise) algorithm that has the advantage of taking into account spatial and temporal dimensions. The ships’ COVID-19 exposure indexes at different dates over the previous 14 days are then derived and modeled based on the daily COVID-19 infection statistics of the approached countries including population density, cumulative confirmed cases, and their increase in rates. These indexes are further classified into the three risk levels based on the three-color code index: red, yellow, and green [15].
The main contributions of this study are summarized as follows. First, this study is, to the best of our knowledge, one of the very few studies dynamically evaluating the infection risk of international ships at the global scale. Second, this study developed a data-driven model to provide a quantitative estimation of COVID-19 infection risk from ships using real-time ship trajectory data and COVID-19 infection statistics that is potentially applicable to any individual ship. The exposure index in Wuhan on the final day of the lockdown is considered as the reference to classify the COVID-19 risk levels for individual ships. The main reason for this is that on April 8 it was a turning point in the risk level for the city of Wuhan after which the local authorities then applied different prevention and control measures. This index threshold can be considered a valuable reference for authorities to make proper COVID-19 prevention and control measures and policies.
The following sections are structured as follows. The next section introduces the key datasets used and the main processes developed in assessing the ship infection risks. Section 3 introduces a case study of a container ship deployed along a Eurasian route in order to evaluate the proposed method after which the results are provided. Finally, Section 4 provides the conclusions and outlines the findings and further work.

2. Materials and Methods

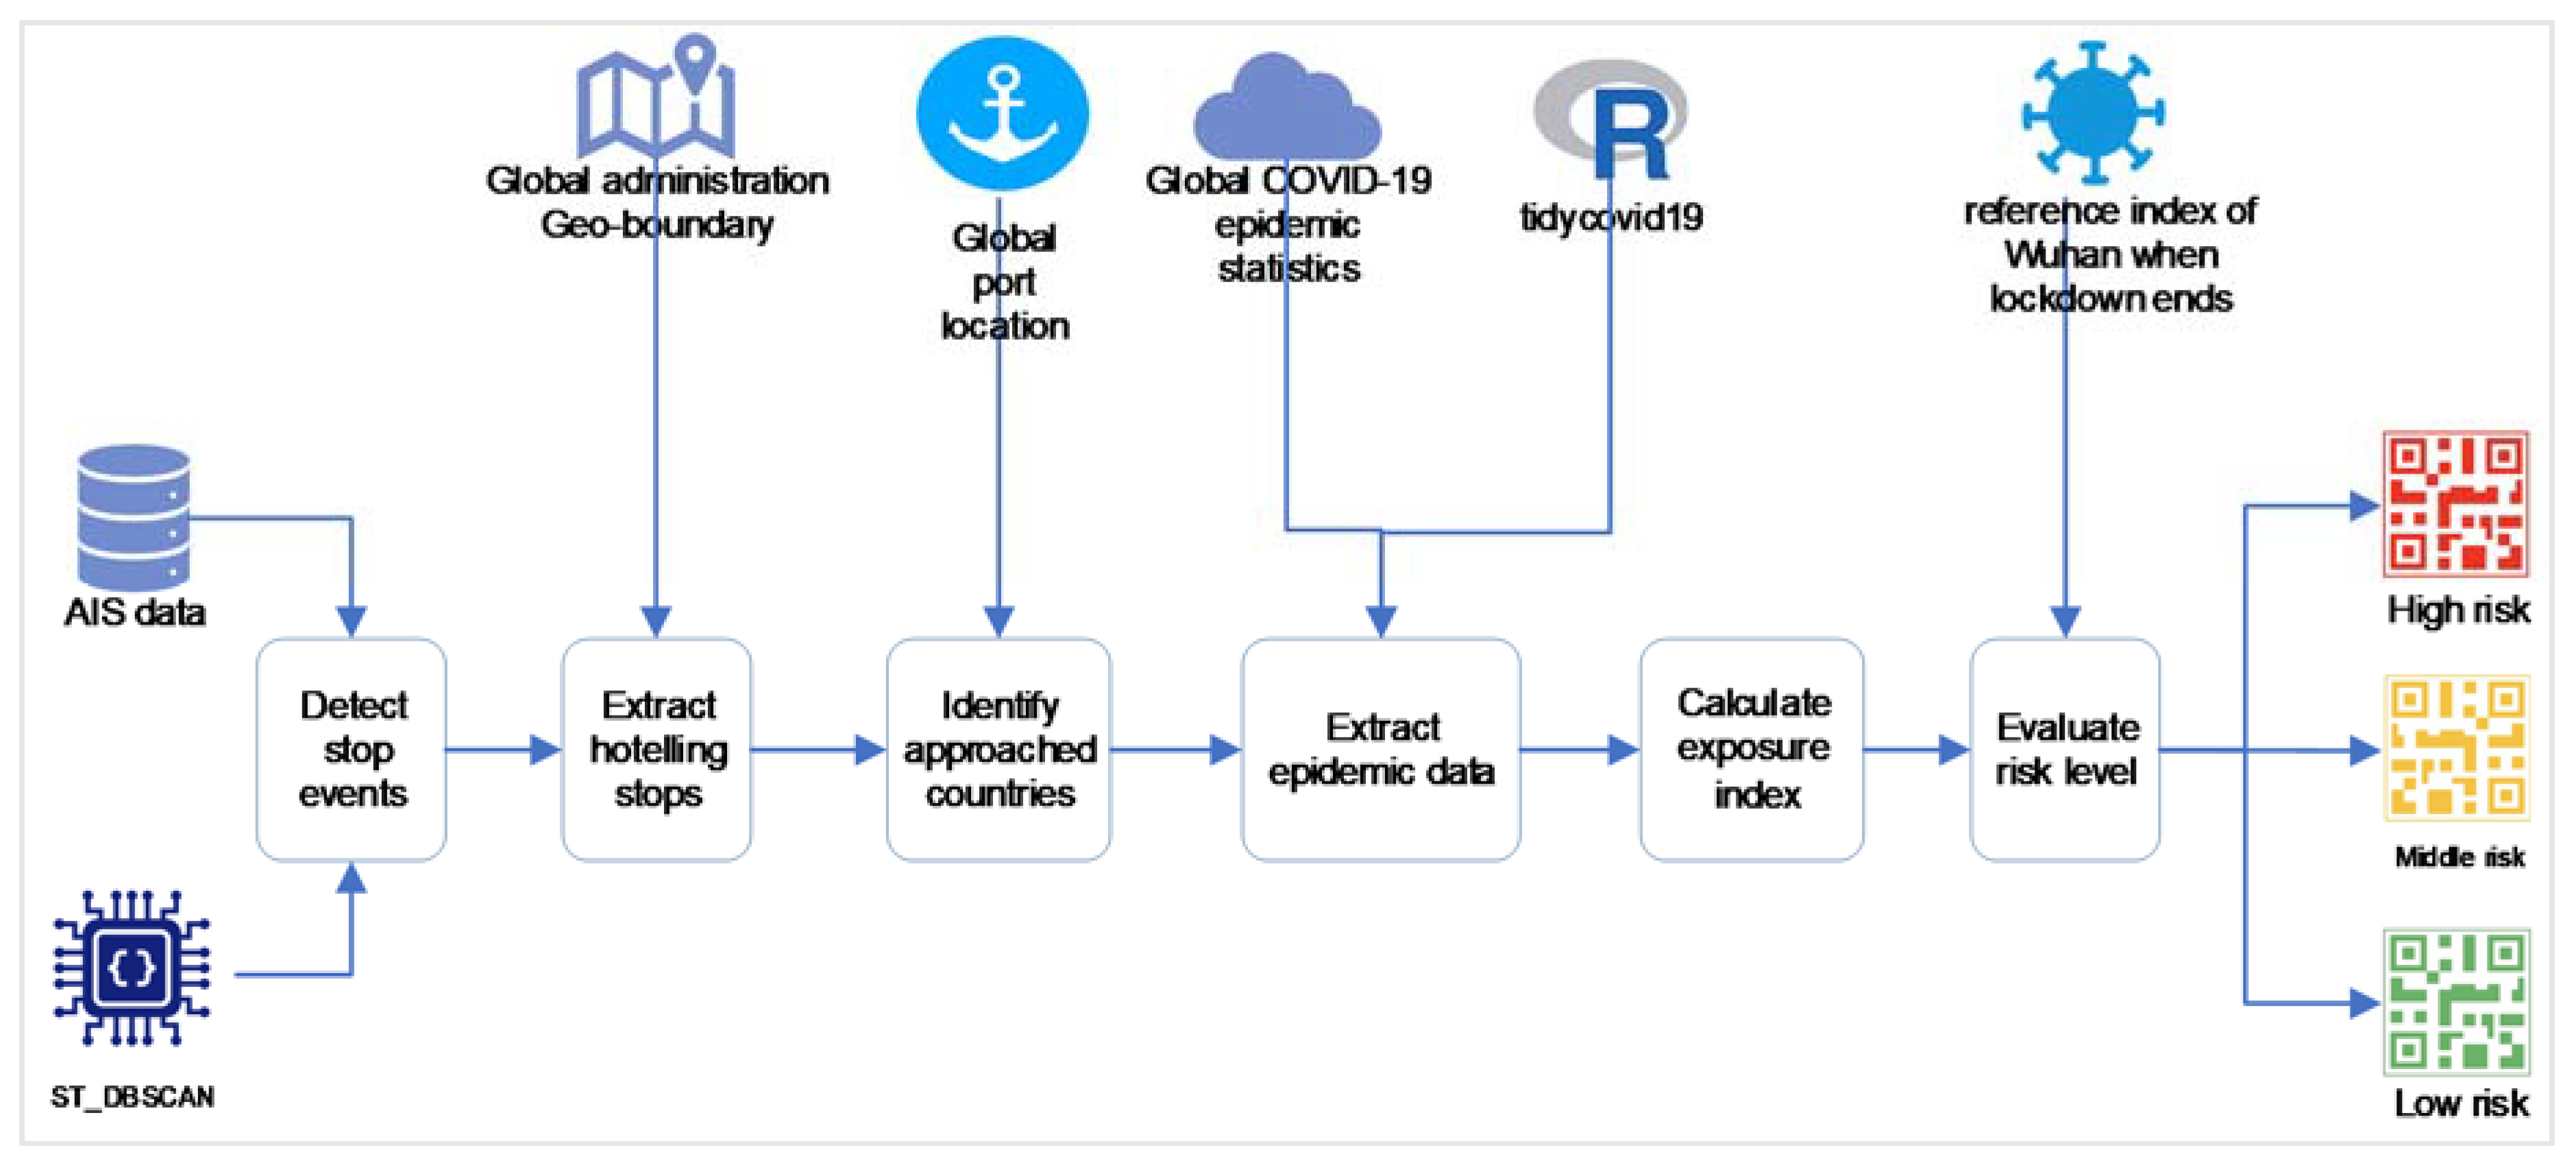
2.1. Overall Framework
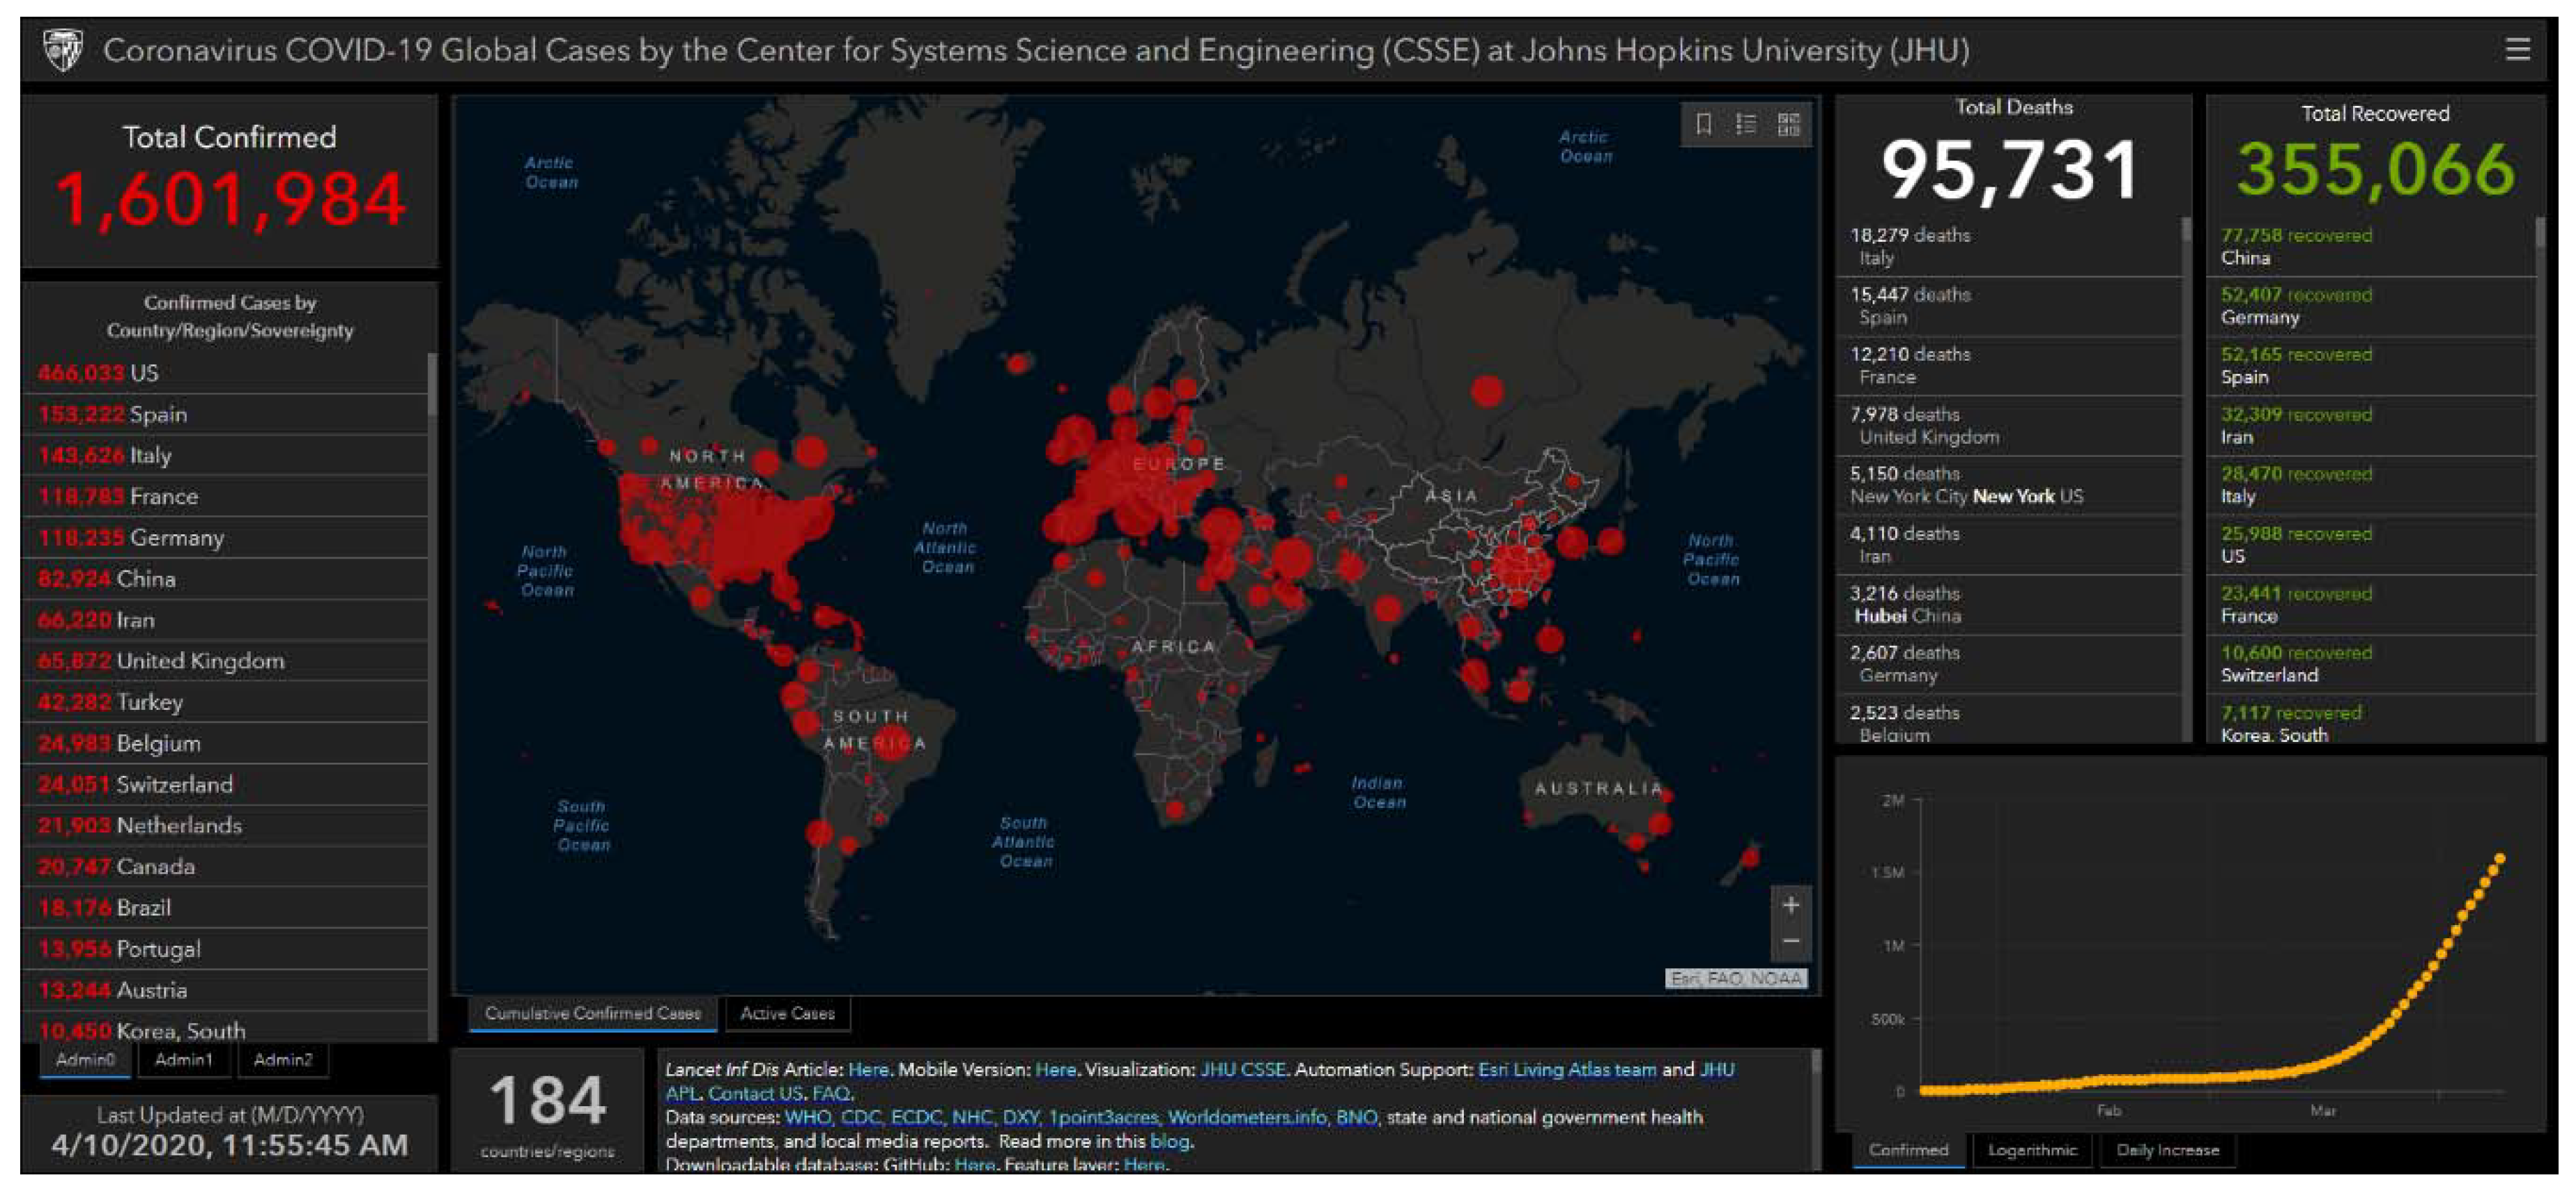
The main procedure and datasets used in this study are described in Figure 3. As shown, the COVID-19 ship risk assessment method is basically a data-driven approach that includes four key datasets and six sequential steps.
The first step is to detect ship “stop” events with the ST-DBSCAN algorithm that integrates ship AIS data as inputs and automatically extracts “stops” spatially and temporally. The detected stops are further classified into hoteling stops and other stops based on distances between their locations and land boundaries. Similarly, hoteling stops are then mapped to their nearest ports and countries based on their distance to ports. This allows us to approximate and identify arrival and departure dates and the travel sequences of the approached ports and countries of a given ship.
These datasets are further used to search for the COVID-19 pandemic statistics of the related countries during the visit period of a ship by taking advantage of the tidycovid19 R package which has the objective of providing transparent access to various authoritative, publicly available COVID-19 data sources at the country-level on a daily basis [16]. Therefore, this allows us to derive daily COVID-19 exposure indexes as well as the past 14 day cumulative exposure indexes. An exposure index denotes the degree of a ship exposed to infected countries (which will be explained in more detail in the next sections). As previously mentioned, the last step is to take the exposure index of Wuhan on April 8, 2020, when the city ended its lockdown, as a reference index. This reference index is applied to classify the 14 day cumulative exposure indexes into three different risk levels. These risk levels, together with the ship’s characteristics, are further encoded into QR codes with red, yellow, or green colors for high risk, middle risk, and low risk, respectively.

2.2. Data Sources

Four main datasets were used in this study including the global ship AIS dataset, global port location datasets, global COVID-19 infection datasets, and global administration boundary datasets. Each of these datasets is described as follows.
The first dataset was the dynamic AIS data which is mainly used as an input of ST_DBSCAN to identify ship stops. Each dynamic AIS record usually includes several attributes including the Maritime Mobile Service Identification (mmsi) of a ship, the timestamp (time)—when the AIS information is generated indicating the number of seconds experienced from the generation time of an AIS point to January 1, 1970; the latitude and longitude coordinates (lon, lat); and the speed over ground (sog). The unit of sog is the knot; one knot is approximately equal to 1852 m per hour. Dynamic AIS information is usually updated every few seconds or minutes according to ship speed and change of course [17]. For instance, AIS messages are usually updated every 3 min when a ship stops at a berth or anchorage and updated every 2–3 s when sailing at high speed. A ship trajectory can be expressed as a series of AIS points arranged in chronological order. It can be expressed as   t r a j = { p 1 , p 2 , , p i , p n } , where p i . t i m e > p i 1 . t i m e , and the i t h point could be expressed as   p i = { m m s i , t i m e , l o n , l a t , s o g } .
The second dataset is the global shipping port location. A port can be represented as   p o r t = { p o r t I d , p o r t N a m e , p o r t L o n , p o r t L a t , c o u n t r y } , where p o r t I d represents the unique identification number of the port; p o r t N a m e represents the name of the port; p o r t L o n represents the longitude of the port; p o r t l a t represents the latitude of the port; and c o u n t r y represents the name of the country where the port is located, this being an important input of our approach.
The third dataset is the global COVID-19 statistics. The data mainly come from the global COVID-19 infection statistics maintained by the Center for Systems Science and Engineering at John Hopkins University in the United States. This dataset is currently one of the most authoritative datasets for COVID-19-related research. The dataset includes the number of confirmed COVID-19 cases, deaths, and recoveries by country since January 22, 2020. This dataset is updated on a daily basis by accessing data from official public health agencies such as the World Health Organization. In addition, a publicly available R language package, called tidycovid19, integrates the economic and social data of each country, such as population, land area, and gross domestic product (GDP), with the pandemic data to facilitate COVID-19-related research [16].
Currently, the tidycovid19 package integrates seven datasets including COVID-19 data from Johns Hopkins University CSSE, government dataset provided by the Assessment Capacities Project (ACAPS), data from the Oxford COVID-19 Government Response Tracker, Mobility Trends Reports provided by Apple, Google COVID-19 Community Mobility Reports data, Google Trends data, and country-level economic data provided by the World Bank. While these datasets are given according to different spatial and temporal resolutions, most provide country-level data but are still not local- or city-based data [16].
The last dataset is the global administrative boundaries (GADM) [18]. The GADM dataset provides country-based geographical data including regional levels, such as province or state, city, district, and county, with high spatial resolution. This dataset is primarily maintained by the University of California and can be used free of charge for academic and other non-commercial purposes. This dataset has been used to identify ship hoteling stopovers.

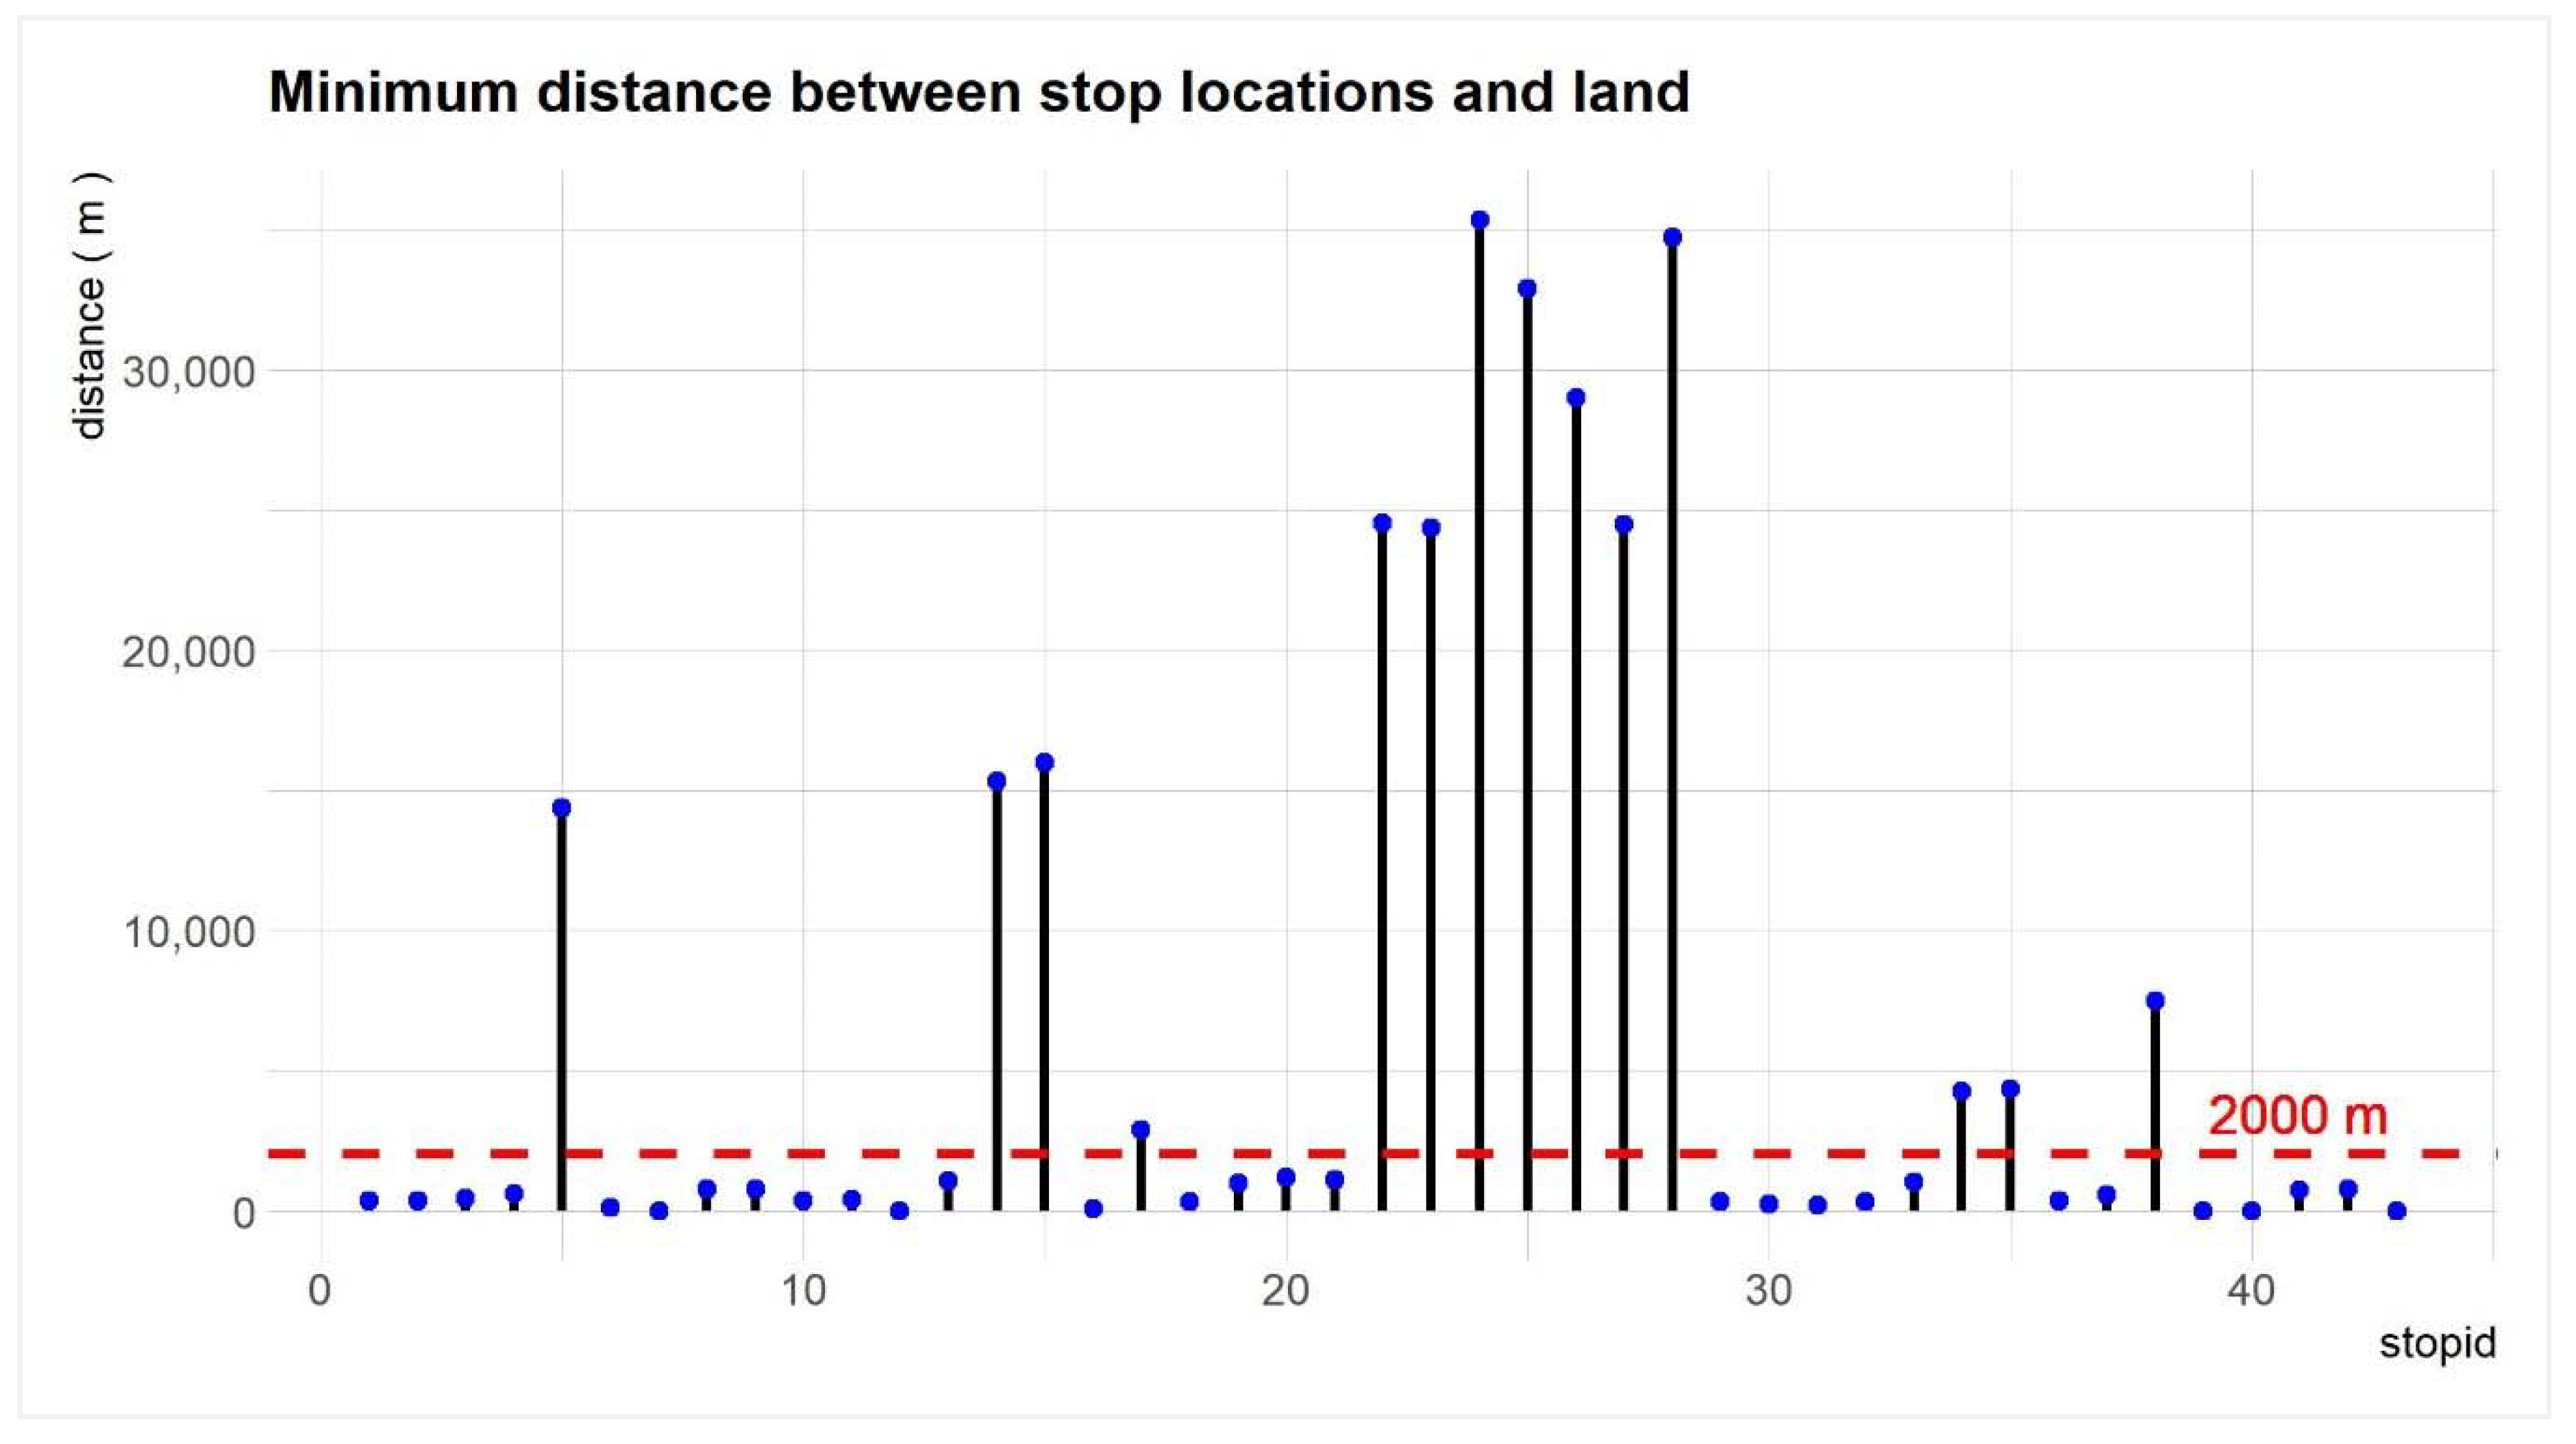
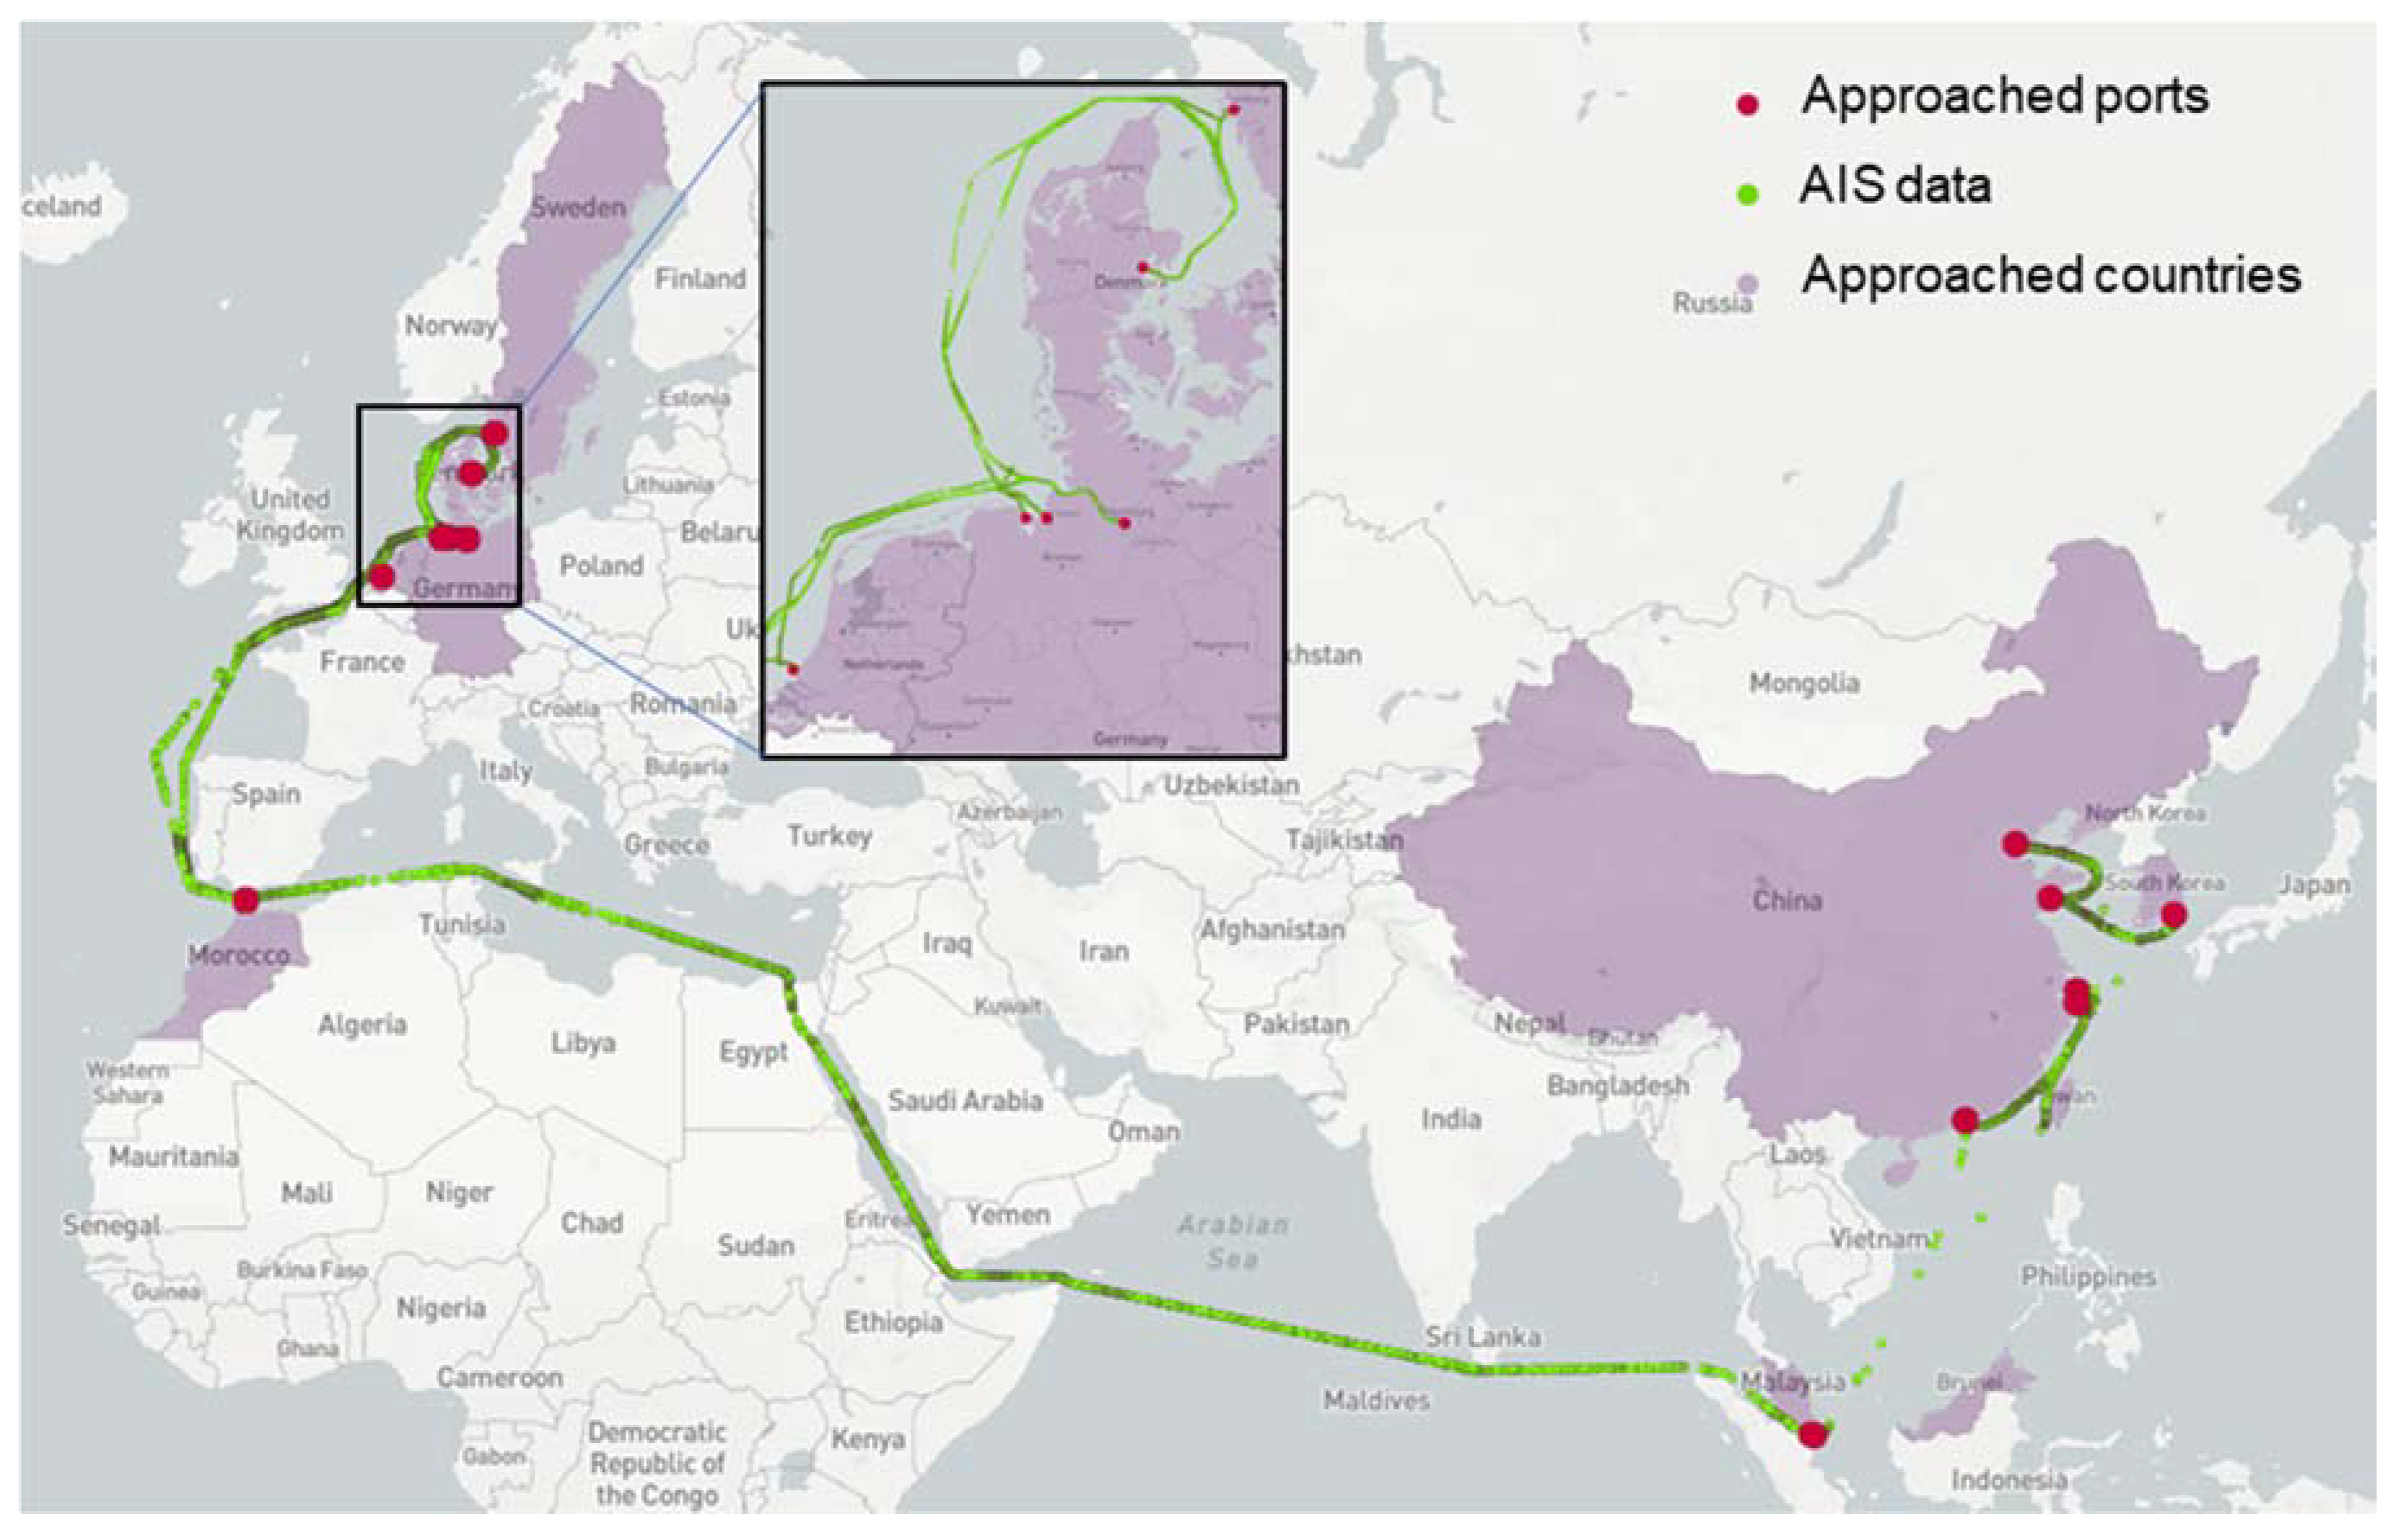
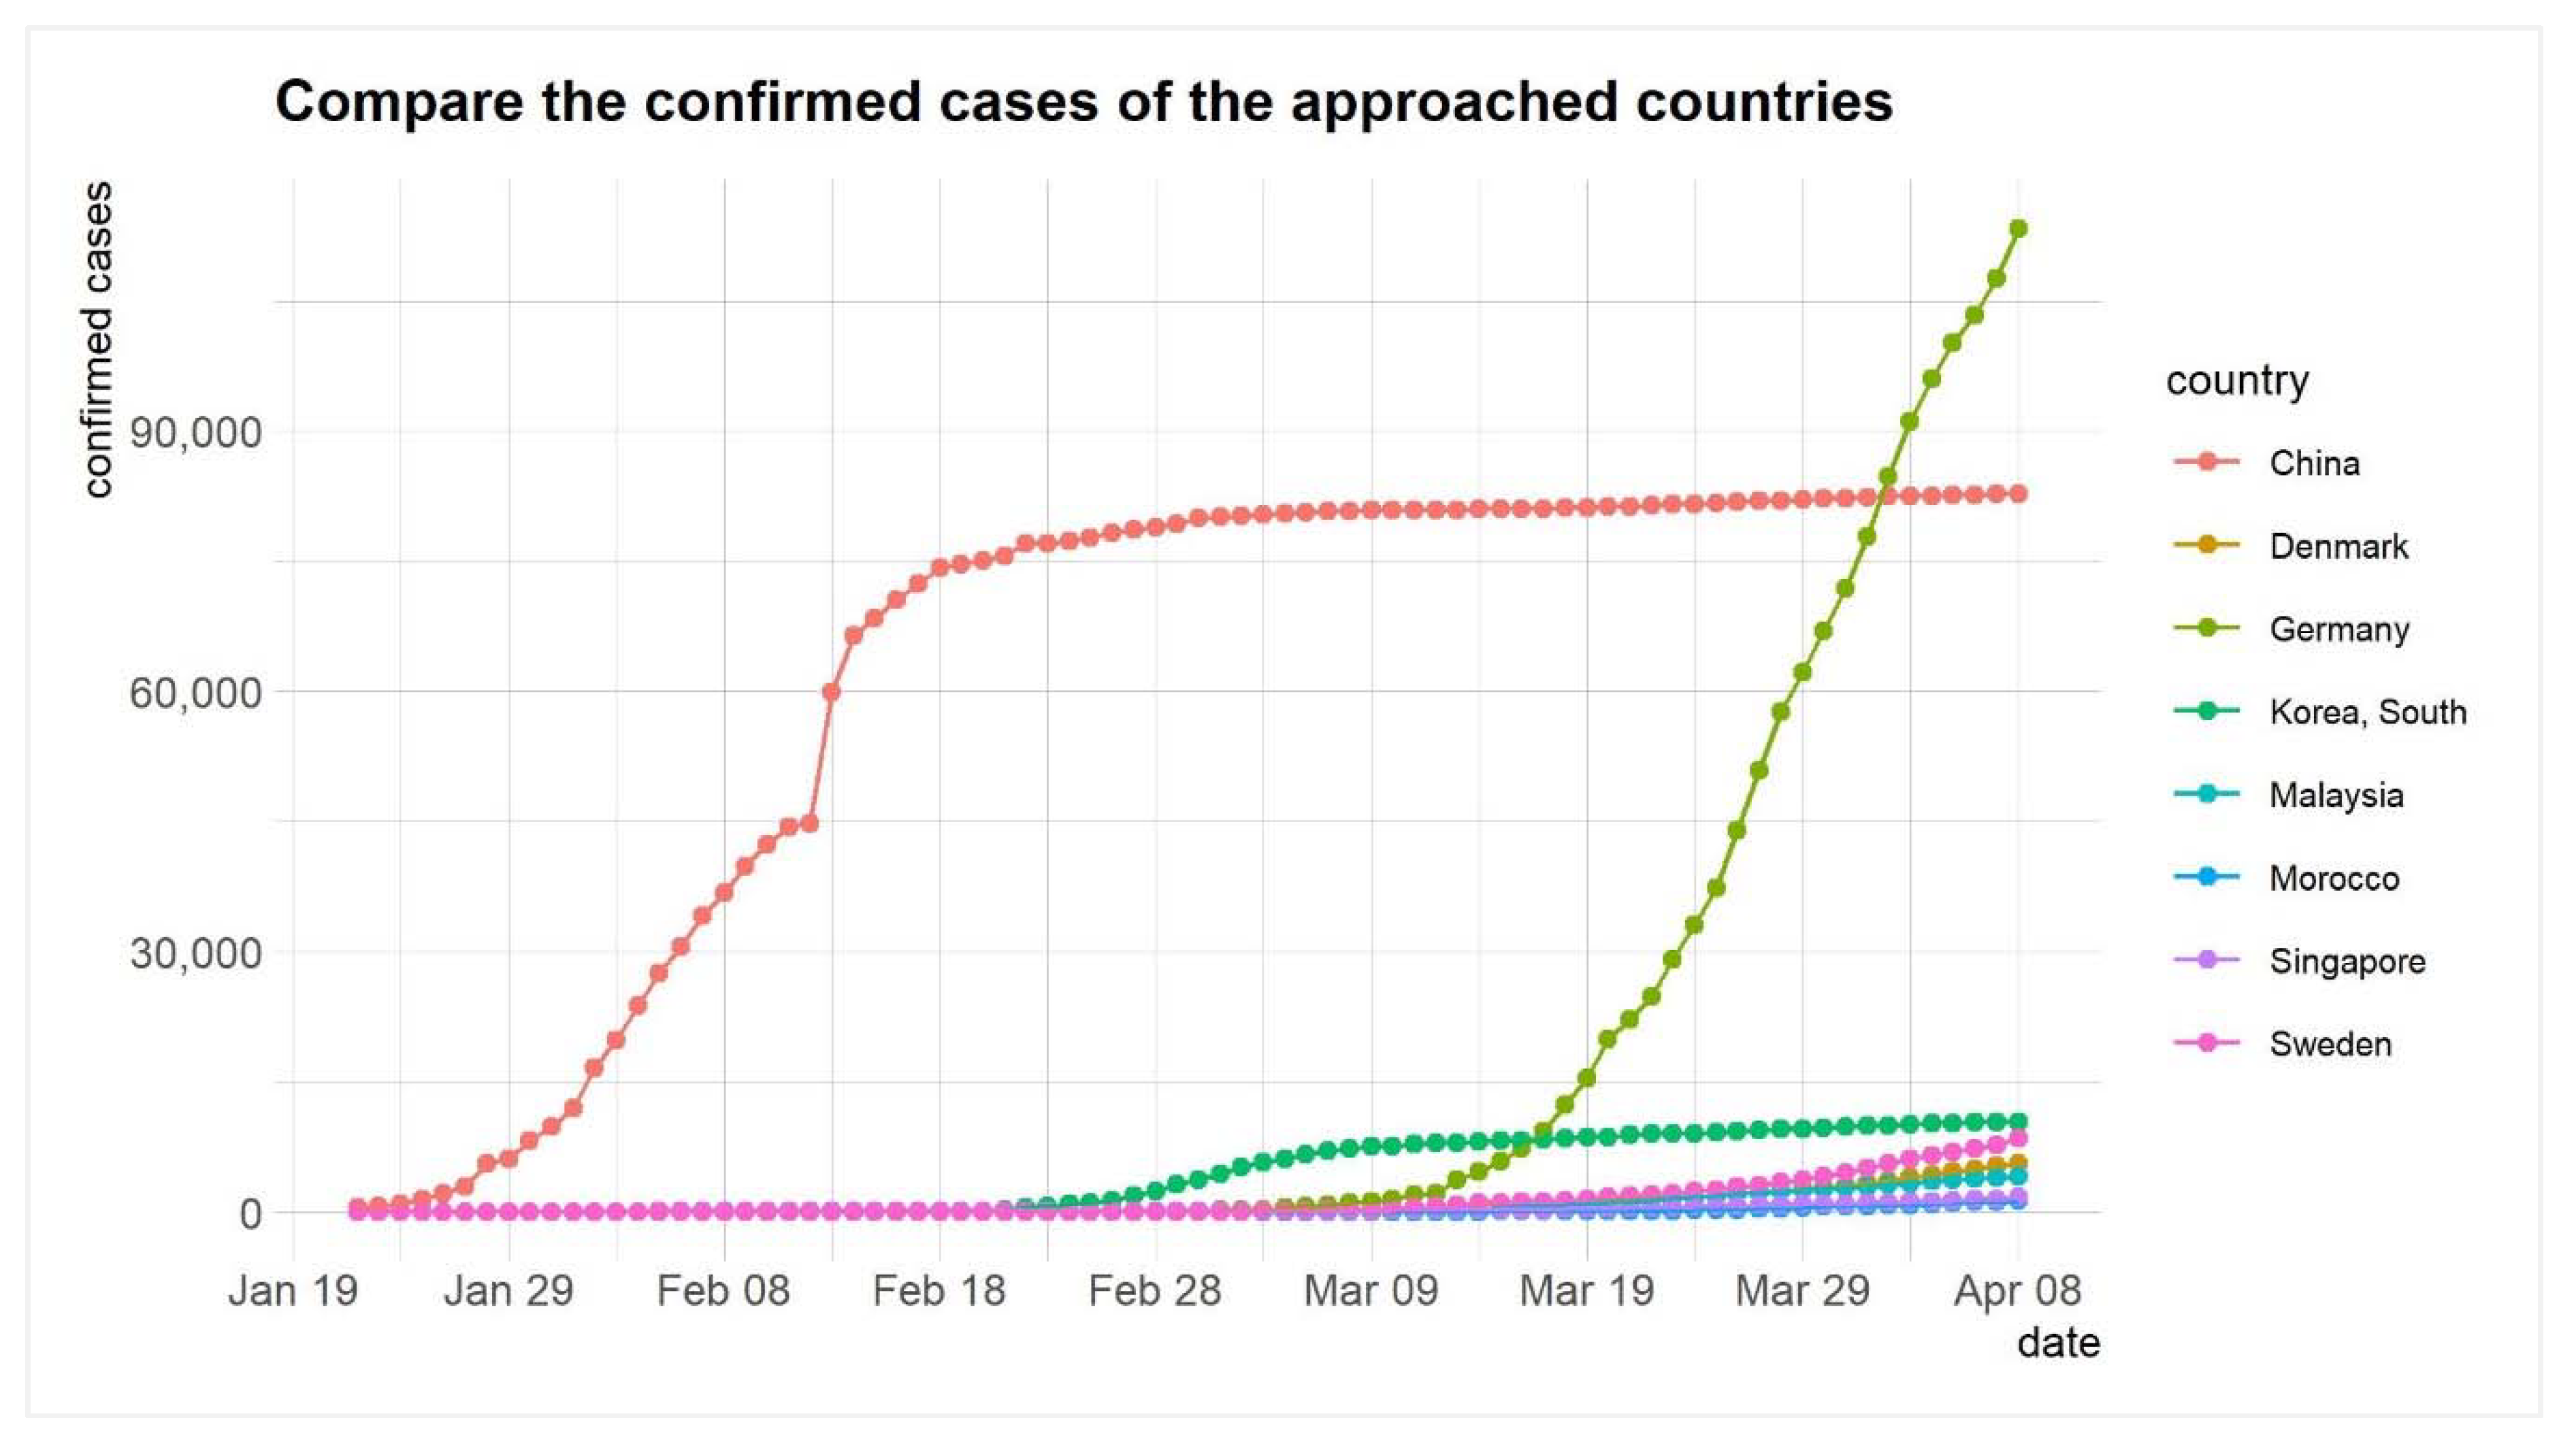
2.3. Identification of Approached Ports and Countries

This section explains the detailed processes applied for the identification of the ports and countries a ship may pass through based on AIS data and application of the ST-DBSCAN algorithm. The AIS data are widely used to investigate ship behaviors at regional and local levels [19,20,21]. The focus here is on detecting a ship’s stop behaviors, and the main processes applied are explained as follows.
The first step is to automatically extract the ship stops as revealed by their AIS data. A ship stop can be identified from either a cluster of AIS points that denotes a location where a ship stays for several hours or even days (e.g., berth, anchorage). Given the fact that ship AIS messages of a ship are broadcasted every few seconds or minutes, the density of the AIS points near stop locations is relatively higher than other locations [22]. Therefore, ship stops can be detected by identifying these high-density areas.
The ST-DBSCAN [23], an unsupervised machine learning method based on spatial and temporal density, has been applied to automatically identify ship stops. The ST-DBSCAN algorithm is an extension of the DBSCAN algorithm [24]. The DBSCAN methods usually identify density clusters from the spatial dimension, while the ST_DBSCAN can detect clusters by integrating the temporal dimension. Therefore, ST_DBSCAN is applied in order to identify ship stops spatially and temporally.
The ST-DBSCAN algorithm requires five parameters: D , e p s 1 , e p s 2 , M i n P t s , and Δ ϵ , where D represents a set of data points; e p s 1 and e p s 2 , respectively, represent the maximum spatial and maximum difference among non-spatial attributes; M i n P t s represents the minimum number of neighbors to form a cluster within the e p s 1 and e p s 2 limits; Δ ϵ represents a threshold that denotes the difference between the average distance of a point to its neighborhood and the average distance of a cluster. If that difference is greater than Δ ϵ , the point will not be classified into this cluster. This parameter is mainly used to avoid generating clusters for non-spatial values [23]. Since this situation has little impact on our case, this parameter was not considered.
The value of each parameter of the ST-DBSCAN algorithm may have a significant impact on the results of the cluster analysis. We set the value of these parameters mainly based on domain knowledge according to the constraints of our study. The value of the first parameter, D , was set as the AIS points which had speeds less than 1 knot, since these points were very much likely to denote the stop of a ship, since ship stops mainly occur at anchorages or berths where ships basically remain stationary or move at very small speeds. Considering the fact that the distance between two sequential AIS points is very close when a ship stops at a terminal or anchorage and the length of a ship is generally around a few hundred meters, this study assumed that the value of e p s 1 was equal to 0.005 degrees which is approximately 500 m. Similarly, we set the value of the third parameter, e p s 2 , to 2 h, since the time intervals between two terminal stays of a ship are usually much longer than 2 h. This means that when the time interval between two AIS trajectory points exceeds 2 h, these two points will not be in the same stop cluster. In order to identify the ship stops at some locations with poor AIS signal coverage where very limited AIS points are available, we set the fourth parameter, M i n P t s ,   to 2 points. This reveals that a stop cluster will be identified as long as there are at least two AIS points within the range of e p s 1 and e p s 2 .
After setting these parameters and running the ST-DBSCAN algorithm, we were able to identify a series of ship stop clusters. Each stop cluster included at least two AIS points with a speed lower than one knot. Then, we chronologically ordered the AIS points of each stop and took the timestamp of the first and last points as the start and end times of each stop, respectively. Therefore, we selected all AIS points reported between the start and end times as a stop. These stops can be expressed as   s t o p s = { s t o p 1 ,   s t o p 2 ,   ,   s t o p i ,     s t o p n } ; each stop represented a series of chronological AIS trajectory points, and the i t h stop could be expressed as s t o p i = { p i 1 , p i 2 , , p i j , p i m } , where p i j . t i m e > p i j 1 . t i m e , m represented the total number of points included in the stop.
The spatial and temporal features of each stop cluster were derived based on the AIS points they contained. The features of a stop can be expressed as s t o p F e a t u r e i = { s t o p I d , s t a r t T i m e , e n d T i m e , s t o p L o n , s t o p L a t , m } , where s t o p I d represents the unique identification number of the stop, s t a r t T i m e and e n d T i m e , respectively, represent the start and end times of the stop with s t a r t T i m e = p i 1 . t i m e   and e n d T i m e = p i m . t i m e , s t o p L o n and s t o p L a t represent the latitude and longitude coordinates of the stop, which is the median of the latitude and longitude coordinates of all the AIS points included in the stop, and m denotes the number of AIS points included in the stop.
The next step was to distinguish the stopovers from anchorage and other stops. The main idea behind this approach was that when a ship is relatively very close to a port for a significant amount of time, the probability of having regular exchanges between the crew and the city is relatively high. It was noticeable that not all stops happened at terminals. Ships usually wait at anchorages for hours and even days. Since our approach is only interested in stops at ports, it was necessary to exclude non-berth stops. This could be achieved by calculating the shortest distance between stop locations and the land shoreline. Stops with a distance less than a distance threshold would be considered as stopovers. The GADM datasets were used to calculate the shortest distance of each stop to the mainland. Compared to anchorages, terminals were generally much closer to the coastline. We assumed that a stop was a stopover if its distance to the coastline was less than 2 km based on our own knowledge of real stop locations and suggestions from domain experts.
It was essential to further link their associated stops with their associate ports and countries. The global port dataset which contains the latitude and longitude coordinates of each port was employed to find the ports and countries a stop may be related to. We first computed the distances among all of the stopovers and ports. Then, for a specific stopover, the nearest port would be the one located. As a result, the ports and countries a ship passed through are identified based on AIS data and on the application of the ST-DBSCAN algorithm. Moreover, since each stop had a start and end time, we could figure out the start, end date, and stay duration of each port a ship visited.

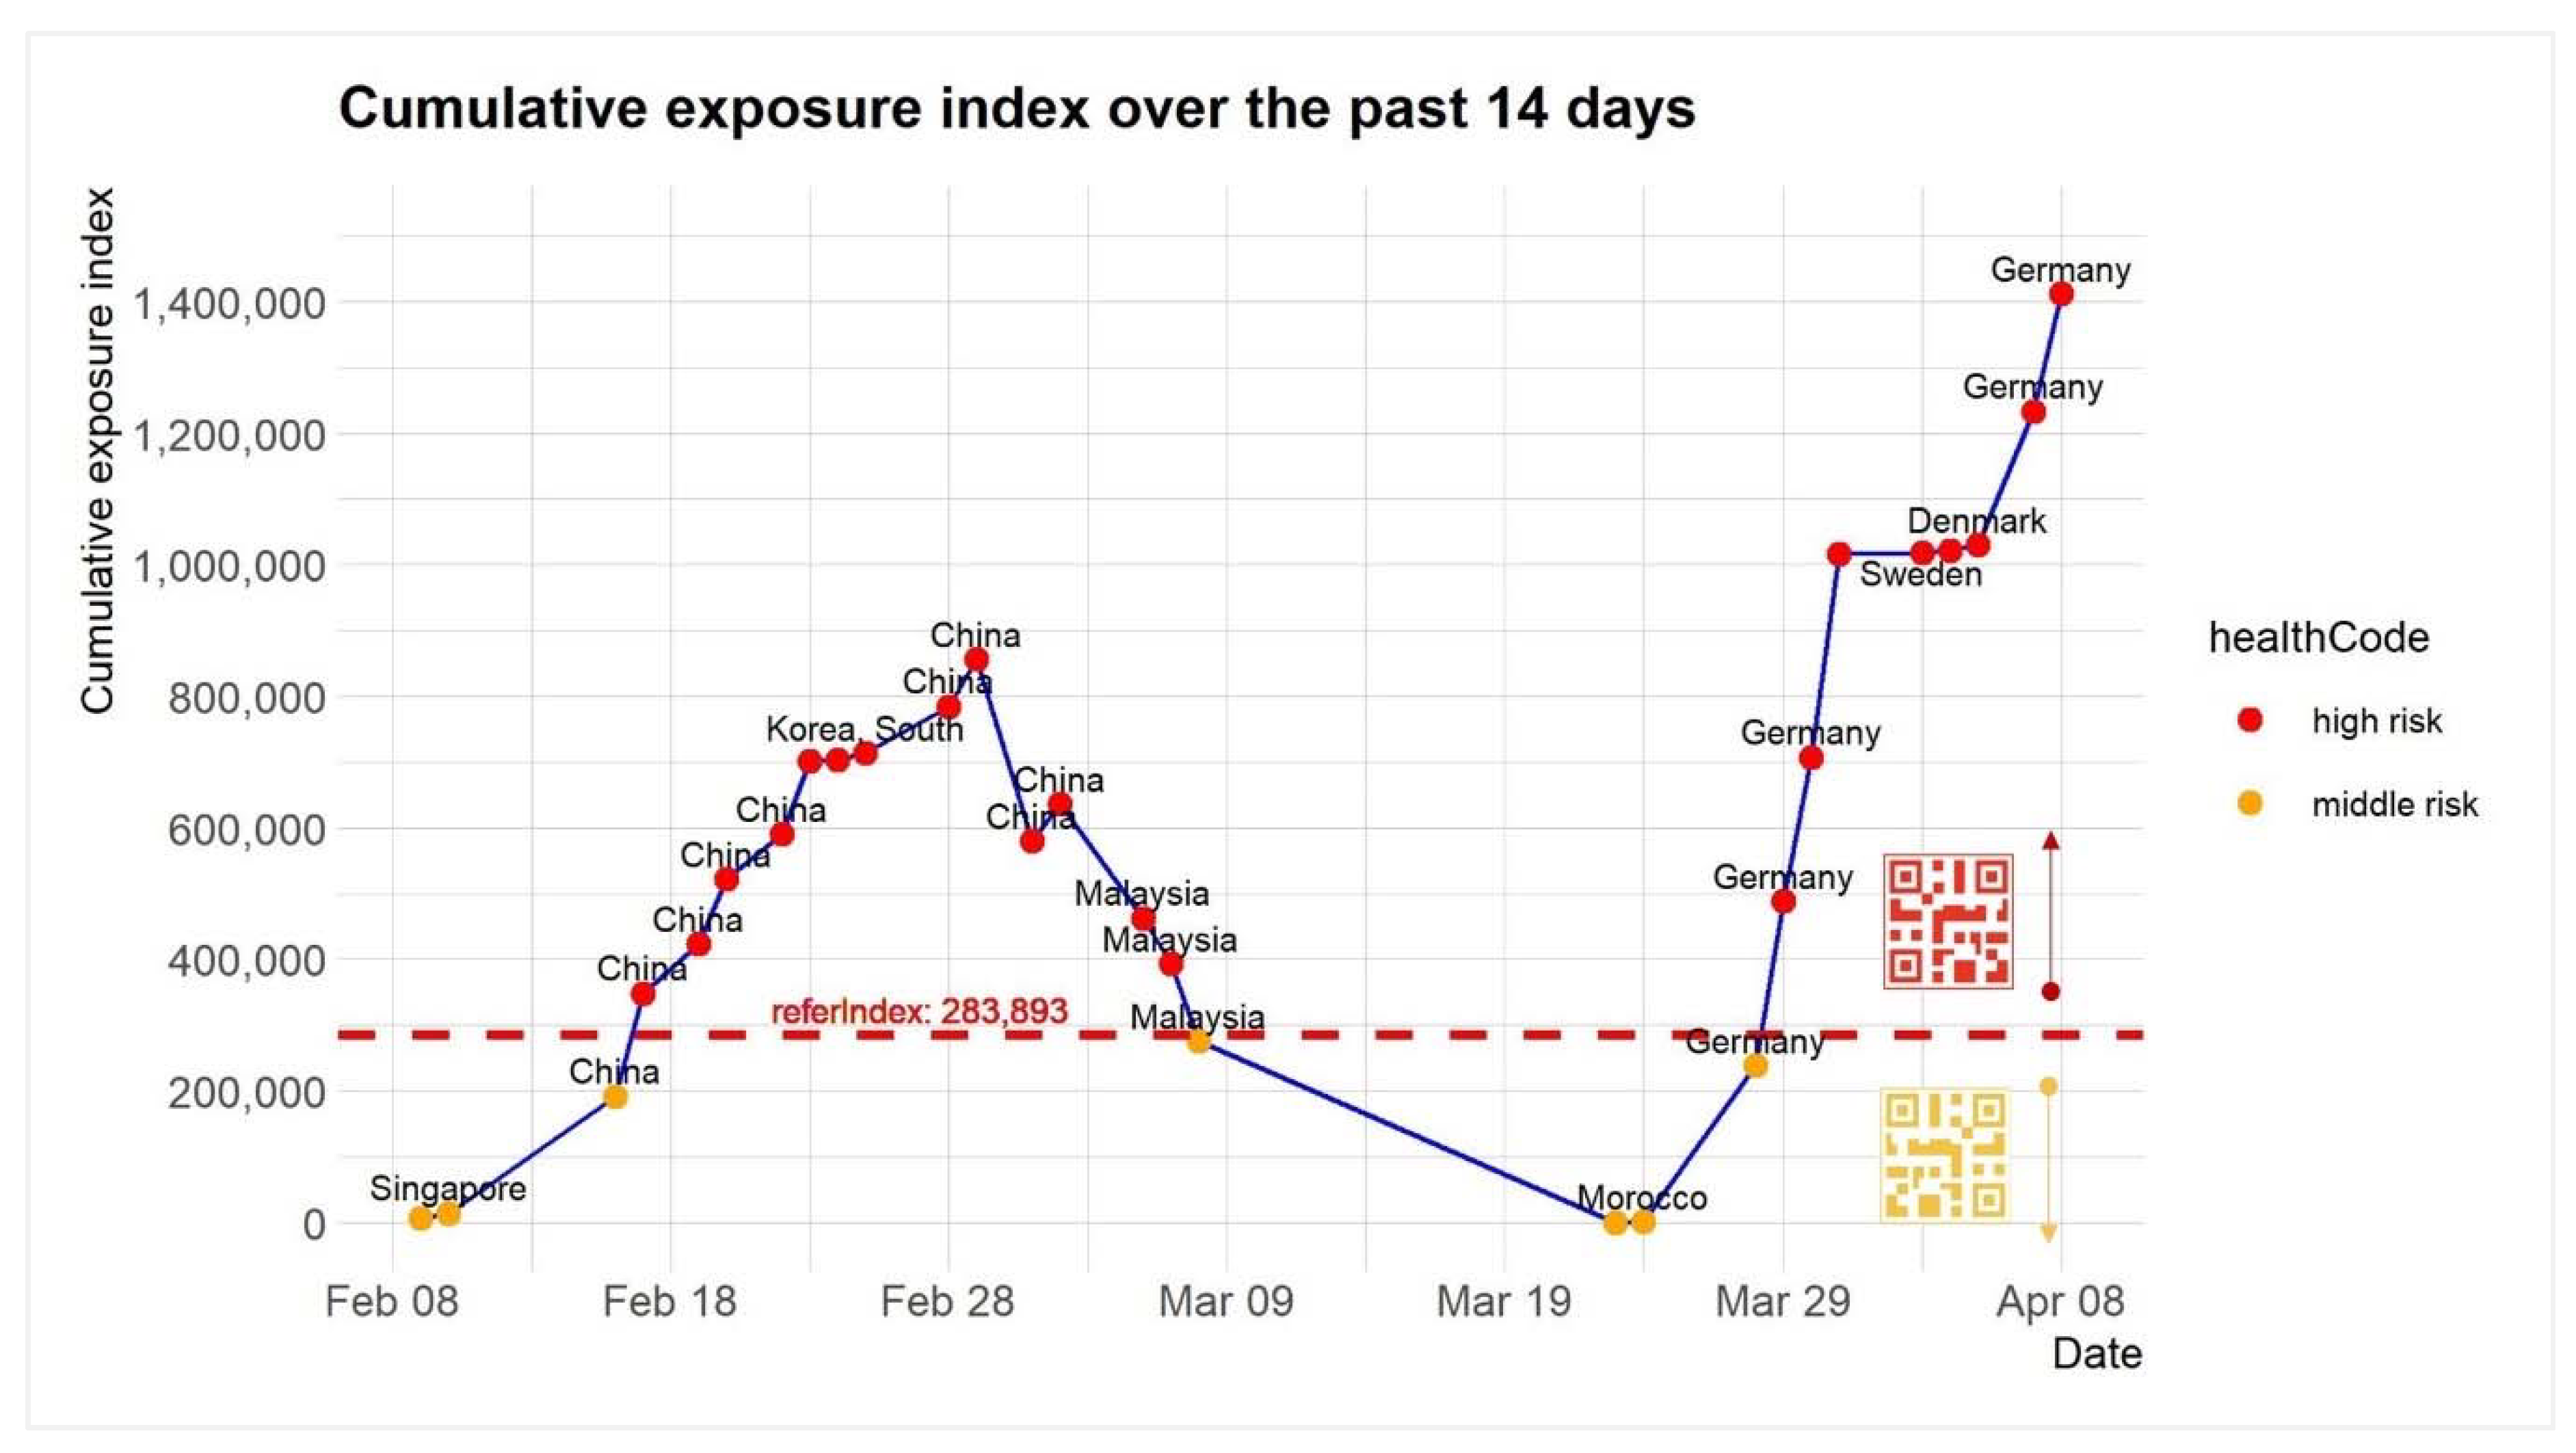
2.4. Estimation of COVID-19 Exposure Index

The risk of COVID-19 infection was impacted by many factors. In a related work, Hu and his colleagues took cumulative confirmed cases, population, and migration index as derived from Baidu as three main factors to evaluate the exported risk of COVID-19 from Hubei Province and the imported risk of COVID-19 in Guangdong Province and its cities in China [25,26]. The work of Boldog [27] tried to assess the risk of a COVID-19 outbreak for a given country based on three parameters including the connectivity between the country and China, the cumulative confirmed cases in China, and the local basic reproduction number R 0 [27].
We introduced a cumulative COVID-19 exposure index to evaluate the risk of a ship being infected by COVID-19. This index mainly takes the cumulative confirmed cases over the past 14 days—because the generally accepted incubation period of COVID-19 is 14 days—population density, and the increase in the rate of confirmed COVID-19 cases into account. It could be approximated as follows:
c m E x p o s u r e I n d e x t = t 14 t e x p o s u r e I n d e x t
where   t denotes the date a ship arrived at a port or country, c m E x p o s u r e I n d e x t denotes the 14 day cumulative exposure index, and e x p o s u r e I n d e x t denotes the exposure index at the day t which can be expressed as follows:
e x p o s u r e I n d e x t = d e n s i t y F a c t o r × ( c t d t r t ) × g r o w F a c t o r t
the d e n s i t y F a c t o r refers to the population density adjustment factor of the country approached which is defined as the population density of the country divided by the global average population density. This factor is used to adjust the impact of population density on COVID-19 infection. We assumed that the higher the population density, the higher the level of risk. c t , d t ,   a n d   r t , respectively, represent the total number of confirmed cases, deaths, and recovered cases at day t . These data were downloaded from the CSSE at Johns Hopkins University according to the country’s name and the date of the ship’s visit. The number of confirmed cases minus the recovered cases and deaths represent the current active confirmed cases. We assumed that the number of active confirmed cases was proportional to the infection risk.
The g r o w F a c t o r t is an adjustment of the daily change of the confirmed cases on infection risk. We assumed that the infection risk level of a ship in a country was much higher with increasing confirmed cases than with decreasing confirming cases. The g r o w F a c t o r t is then derived as follows:
g r o w F a c t o r t = 1 + 0.5 a d d C a s e s t a b s ( a d d C a s e s t ) + a b s ( a d d C a s e s t 1 )
where t 1   represents the day before t , the a d d C a s e s t denotes the number of increased confirmed cases at the date t . If the number of confirmed cases decreases, the value will be negative. According to the above formula, the ship exposure index can be calculated dynamically. The range of the g r o w F a c t o r   was controlled from 50% to 150%. This means that the higher the increase rate, the closer to 150%. For example, if the number of the increased cases grows dramatically, the g r o w F a c t o r will be close to 150%. By contrast, when the number of confirmed cases drops sharply, the g r o w F a c t o r will be close to 50%.

2.5. Assessment of COVID-19 Infection Risk Level

As previously mentioned, the 14 day cumulative exposure index of Wuhan on April 8, 2020 was considered as the reference to classify the infection risk of a ship into different levels. The reason behind is that the city of Wuhan, the most seriously infected city in China, ended its over two-month lockdown on April 8, 2020; probably indicating that the COVID-19 pandemic situation had fundamentally changed in Wuhan. The COVID-19 infection data for the 14 days before lifting the lockdown of Wuhan can be obtained from the website of the National Health Commission of the People’s Republic of China. The population density of Wuhan is approximately 1283 people per square kilometer. The number of confirmed cases was reduced and with a growth coefficient R 0 less than 1. Finally, based on the method previously introduced, we derived the 14 day cumulative exposure index of Wuhan on the day of cessation of lockdown. This index was used as a reference to categorize the infection risk of a ship into different levels based on its cumulative COVID-19 exposure index. The risk level of a ship was then expressed as follows:
r i s k L e v e l = { h i g h   r i s k ,   i f   c m E x p o s u r e I n d e x > r e f e r e n c e   I n d e x   l o w   r i s k ,   i f   c m E x p o s u r e I n d e x = 0     m i d d l e   r i s k ,   i f   c m E x p o s u r e I n d e x   b e t w e e n   0   a n d   r e f e r e n c e   I n d e x )
We categorized the infection risk of a ship into high, middle, and low levels which were, respectively, represented by red, yellow, and green QR codes. The red QR code indicates that the ship has passed through a high-risk zone; a yellow QR code refers to an average risk level; and a green one indicates that the ship is healthy with a very low risk. The main idea behind this approach is to help local authorities make appropriate prevention and control policies based on a given ship infection risk level. The same approach might also be useful for ship owners and crew to plan less risky navigation routes.

3. Case Study

The proposed method was applied to a real container ship to assess its daily infection risk. This experimental ship was a container ship deployed on a Eurasian route. The ship was built in 2006, with a gross tonnage of 4713 tons, a deadweight tonnage of 6009 tons, an overall length of 116.5 m, and a breadth of 15.9 m. We extracted the AIS trajectory data of the ship after January 1, 2020, from the global AIS dataset as input. As of April 8, 2020, there were 60,936 ship trajectory points for the ship. Among them, there were a total of 20,091 trajectory points with a speed of less than 1 knot, accounting for about one-third of the total volume of data. The AIS data transmission rate was time dependent and also affected by many factors such as the ship t, speed over ground (sog), course over ground (cog), and navigation status. The mean AIS transmission rate available in this study was approximately 20 points per hour.
The AIS points with a speed of less than 1 knot were extracted as an input to the ST-DBSCAN algorithm to automatically identify the ship stops. In order to improve the ST-DBSCAN algorithm computation time, before stop detection, trajectory points were grouped into several subgroups to keep the data volume of each subgroup small enough. Therefore, before stop detection, we grouped these trajectory points into several subgroups to keep the data volume of each subgroup small enough so that the ST_DBSCAN algorithm could rapidly converge. This grouping process was mainly based on two parameters: the first parameter was the time interval between two points, while the second parameter was the maximum amount of data in each group. When the time interval between two trajectory points was greater than 5 h, it was divided into two groups. The data volume of each group was counted. If it was greater than 10,000 points, then the grouping process was performed. This process was not stopped until the amount of data in each group was lower than 10,000 or if it could no longer be divided.
Based on the grouping process, we obtained three groups of datasets. For each group, ST-DBSCAN was applied to calculate the stop clusters. Here, we set the e p s 1 to 0.005, the e p s 2 to 2 h, and the M i n P t s to 2 points. This meant that the time interval between any two AIS trajectory points was within two hours, and the distance between the two AIS trajectory points was lower than 0.005 degrees; two or more than two data points could then form a stop event. Finally, we obtained a total of 43 stop events. Although these stops were identified, it was still necessary to remove anchorage stops to determine the ports the ship visited. For this purpose, we calculated the distance of each stop to its nearest coastline as shown in Figure 4. Based on our own knowledge of usual stopover locations and domain knowledge, we considered a stop with a distance of less than 2 km as a berth stop. Finally, we obtained 29 berth stops.
By removing anchorage stops, this gave 29 berth stops that occurred in 15 ports in nine countries. The specific locations of these ports are shown as red dots, and the countries passing by are highlighted in purple as shown in Figure 5. From that figure, one can clearly identify the ports and countries the ship passed by as derived from the ship AIS trajectory (in green dots). It is worth noting that a ship may visit a port or country more than once, and there are likely multiple stop events during a given visit.
Next, our approach extracted the country-based COVID-19 data related to the ship stopovers from the COVID-19 statistics maintained by the CSSE at Johns Hopkins University through the R package of tidycovid19. Key data included the number of confirmed cases, deaths and recovered cases, population density, etc. Since no confirmed cases were reported in the Netherlands when the ship arrived (January 18–19, 2020), overall, we obtained data for eight countries. It was noticeable that the duration of a ship stop may exceed 24 h, and some ports had multiple stops at a same date. Table 1 shows the ship stopovers and their associated ports and countries at each date. This table shows that there were 17 ship stopover events that covered a period of 32 days. The number of stops was much lower than the total number of stops, as we only retained the first stop of each port for each date.
Figure 6 shows the evolution of the number of confirmed cases for each visited country. This shows that China and Germany had the highest number of confirmed cases, while the number of confirmed cases for the other countries approached was lower than 15,000 cases on April 8, 2020. Figure 6 also shows that the pandemic in China tended to be stabilized, while the number of new cases in Germany increased rapidly.
According to the date of each port stopover, the data for each country were extracted and the daily COVID-19 exposure index and 14 day cumulative exposure index of the ship was derived. Figure 7 shows the 14 day cumulative exposure indexes of the ship at different dates and the corresponding risk levels and health QR codes.
As shown in Figure 7, the risk of infection fluctuated greatly. The 14 day cumulative exposure index curve started in Singapore with an index close to the null value on February 9 2020; then, the index rose rapidly and reached its peak in China with an index around 850,000 on February 29 2020. After that, with the ship leaving China, the risk of exposure began to decline rapidly and hit bottom in Morocco on March 24, 2020. Then, the index started pulling in a straight line under the influence of the quick spread of COVID-19 in Europe. As also shown in Figure 7, most of the dates were at high risk with a red health QR code, while only seven dates were at a middle risk level, mainly when the ship visited Singapore and Morocco (note that the figure does not show the date with an exposure index of null).

4. Conclusions

Preventing and controlling the increasingly severe risk of COVID-19 imported from overseas has currently becomes one of the main concerns of many countries when taking measures to protect their citizens and to restart the economy. As the imported risk of COVID-19 from international shipping should not be ignored, this study introduced a data-driven and machine learning approach to automatically and dynamically estimate the COVID-19 risk of international shipping that also has the potential to be generalized at the global level. It may provide decision support mechanisms for preventing infections of COVID-19 from ocean-going ships for all the approached countries. The potential of the proposed approach was illustrated and applied to a real container ship that successfully provided a daily trace of cumulative exposure indexes and risk levels of the experimental ship.
The illustrative real ship application shows that the proposed method can be applied to pandemic risk monitoring of most ships. Theoretically, as long as ship AIS data are available, the model principles can be used to monitor the infection risk of a ship on a daily basis. Although this paper is mainly aimed at international sailing ships, it is also suitable for domestic trade and inland waterway ships. The proposed method can also obtain the exposure indexes and risk levels of a ship approaching any country and could provide support for different countries to prevent the importation of infections. Also, due to the impact of the pandemic, the shipping schedule of many ships has been seriously disturbed. It is common for ships to jump over ports, which may lead to the difference between the actual sailing route and the schedule. One of the advantages of using AIS data is that it favors the accurate tracking of ship trajectories and provides valuable information on ship behaviors.
However, there are still many directions to explore to improve the approach both at the data and methodological levels. First, the detailed travel history of a seafarer and the real exposure condition during his/her visit to a country may have a significant influence on the risk of infection. Moreover, infection data and risks might be further refined at the local and port levels, but such data are not always available. Indeed, ship infection risk is also related to the prevention measures taken by the approached ports and countries. However, this factor is so far not considered by our modeling approach, as it is qualitatively difficult to evaluate. Finally, while the current approach is applied to maritime trajectories and the evaluation of ship infection risks, the principles behind the method developed might be extended towards other trajectory contexts in land and air with some minor adaptations.

Author Contributions

Conceptualization, Christophe Claramunt and Zhihuan Wang; methodology, Zhihuan Wang and Christophe Claramunt; software, Chenguang Meng; validation, Zhihuan Wang; resources, Zhihuan Wang; writing—original draft preparation, Zhihuan Wang and Mengyuan Yao; writing—review and editing, Christophe Claramunt and Mengyuan Yao; visualization, Chenguang Meng; supervision, Zhihuan Wang; project administration, Zhihuan Wang; funding acquisition, Zhihuan Wang. All authors have read and agreed to the published version of the manuscript.

Funding

This research was funded by the National Natural Science Foundation of China, grant number 41505001.

Conflicts of Interest

The authors declare no conflict of interest.

References

  1. Huang, C.; Wang, Y.; Li, X.; Ren, L.; Zhao, J.; Hu, Y.; Zhang, L.; Fan, G.; Xu, J.; Gu, X.; et al. Clinical features of patients infected with 2019 novel coronavirus in Wuhan, China. Lancet 2020, 395, 497–506. [Google Scholar] [CrossRef] [Green Version]
  2. Wu, J.T.; Leung, K.; Leung, G.M. Nowcasting and forecasting the potential domestic and international spread of the 2019-nCoV outbreak originating in Wuhan, China: A modelling study. Lancet 2020, 395, 689–697. [Google Scholar] [CrossRef] [Green Version]
  3. Liu, Y.; Gayle, A.A.; Wilder-Smith, A.; Rocklöv, J. The reproductive number of COVID-19 is higher compared to SARS coronavirus. J. Travel Med. 2020, 27. [Google Scholar] [CrossRef] [PubMed] [Green Version]
  4. Chan, J.F.; Yuan, S.; Kok, K.H.; To, K.K.; Chu, H.; Yang, J.; Xing, F.; Liu, J.; Yip, C.C.; Poon, R.W.; et al. A familial cluster of pneumonia associated with the 2019 novel coronavirus indicating person-to-person transmission: A study of a family cluster. Lancet 2020, 395, 514–523. [Google Scholar] [CrossRef] [Green Version]
  5. Liu, T.; Hu, J.; Xiao, J.; He, G.; Kang, M.; Rong, Z.; Lin, L.; Zhong, H.; Huang, Q.; Deng, A.; et al. Time-varying transmission dynamics of Novel Coronavirus Pneumonia in China. bioRxiv 2020. [Google Scholar] [CrossRef] [Green Version]
  6. Shaw, R.; Kim, Y.-K.; Hua, J. Governance, technology and citizen behavior in pandemic: Lessons from COVID-19 in East Asia. Prog. Disaster Sci. 2020, 6, 100090. [Google Scholar] [CrossRef]
  7. Dong, E.; Du, H.; Gardner, L. An interactive web-based dashboard to track COVID-19 in real time. Lancet Infect. Dis. 2020, 30120–30121. [Google Scholar] [CrossRef]
  8. Zhenhuan, M. Health QR Code Helps Curb Spread of Infection. Available online: https://www.chinadailyhk.com/article/124757 (accessed on 12 April 2020).
  9. NetEaseNews. Available online: https://news.163.com/20/0216/12/F5GNTI8R00018AOR.html (accessed on 12 April 2020).
  10. Freightwaves. COVID-19 Confirmed on Gjertrud Maersk. Available online: https://www.freightwaves.com/news/covid-19-confirmed-on-gjertrud-maersk (accessed on 20 April 2020).
  11. Zhang, S.; Diao, M.; Yu, W.; Pei, L.; Lin, Z.; Chen, D. Estimation of the reproductive number of novel coronavirus (COVID-19) and the probable outbreak size on the Diamond Princess cruise ship: A data-driven analysis. Int. J. Infect. Dis. 2020, 93, 201–204. [Google Scholar] [CrossRef] [PubMed]
  12. Mizumoto, K.; Chowell, G. Transmission potential of the novel coronavirus (COVID-19) onboard the diamond Princess Cruises Ship, 2020. Infect. Dis. Model. 2020, 5, 264–270. [Google Scholar] [CrossRef] [PubMed]
  13. Lau, H.; Khosrawipour, V.; Kocbach, P.; Mikolajczyk, A.; Ichii, H.; Zacharski, M.; Bania, J.; Khosrawipour, T. The association between international and domestic air traffic and the coronavirus (COVID-19) outbreak. J. Microbiol. Immunol. Infect. 2020, in press. [Google Scholar] [CrossRef] [PubMed]
  14. Zhang, X.-A.; Fan, H.; Qi, R.-Z.; Zheng, W.; Zheng, K.; Gong, J.-H.; Fang, L.-Q.; Liu, W. Importing coronavirus disease 2019 (COVID-19) into China after international air travel. Travel Med. Infect. Dis. 2020. [Google Scholar] [CrossRef] [PubMed]
  15. National Health Commission of the People’s Republic of China. The Latest Situation of the New Coronavirus Pneumonia Pandemic Situation as of 24:00 on 8 April. Available online: http://www.nhc.gov.cn/xcs/yqtb/202004/fa7bb40a7fbf4b2c8f3989d512fe5b77.shtml (accessed on 12 April 2020).
  16. Gassen, J. Download, Tidy and Visualize Covid-19 Related Data. Available online: https://joachim-gassen.github.io/tidycovid19/ (accessed on 12 April 2020).
  17. ITU. Technical Characteristics for an Automatic Identification System Using Time Division Multiple Access in the VHF Maritime Mobile Frequency Band; International Telecommunication Union: Geneva, Switzerland, 2014. [Google Scholar]
  18. GADM. GADM Maps and Data. Available online: https://gadm.org/index.html (accessed on 25 April 2020).
  19. Peng, P.; Cheng, S.; Chen, J.; Liao, M.; Wu, L.; Liu, X.; Lu, F. A fine-grained perspective on the robustness of global cargo ship transportation networks. J. Geogr. Sci. 2018, 28, 881–889. [Google Scholar] [CrossRef] [Green Version]
  20. De Souza, E.N.; Boerder, K.; Matwin, S.; Worm, B. Improving Fishing Pattern Detection from Satellite AIS Using Data Mining and Machine Learning. PLoS ONE 2016, 11, e0158248. [Google Scholar] [CrossRef]
  21. Johansson, L.; Jalkanen, J.P.; Kukkonen, J. Global assessment of shipping emissions in 2015 on a high spatial and temporal resolution. Atmos. Environ. 2017, 167, 403–415. [Google Scholar] [CrossRef]
  22. Wang, Z.; Claramunt, C.; Wang, Y. Extracting Global Shipping Networks from Massive Historical Automatic Identification System Sensor Data: A Bottom-Up Approach. Sensors 2019, 19, 3363. [Google Scholar] [CrossRef] [PubMed] [Green Version]
  23. Birant, D.; Kut, A. ST-DBSCAN: An algorithm for clustering spatial–temporal data. Data Knowl. Eng. 2007, 60, 208–221. [Google Scholar] [CrossRef]
  24. Ester, M.; Kriegel, H.-P.; Sander, J.; Xu, X. A density-based algorithm for discovering clusters in large spatial databases with noise. In Proceedings of the Second International Conference on Knowledge Discovery and Data Mining, Portland, Oregon, 2–4 August 1996; pp. 226–231. [Google Scholar]
  25. Hu, J.; Liu, T.; Xiao, J.; He, G.; Rong, Z.; Yin, L.; Wan, D.; Zeng, W.; Gong, D.; Guo, L.; et al. Risk assessment and early warning of imported COVID-19 in 21 cities, Guangdong province. Chin. J. Epidemiol. 2020, 41, 658–662. [Google Scholar]
  26. Hu, J.; He, G.; Liu, T.; Xiao, J.; Rong, Z.; Guo, L.; Zeng, W.; Zhu, Z.; Gong, D.; Yin, L.; et al. Risk assessment of exported risk of novel coronavirus pneumonia from Hubei Province. Chin. J. Epidemiol. 2020, 54, E017. [Google Scholar]
  27. Boldog, P.; Tekeli, T.; Vizi, Z.; Dénes, A.; Bartha, F.A.; Röst, G. Risk Assessment of Novel Coronavirus COVID-19 Outbreaks Outside China. J. Clin. Med. 2020, 9, 571. [Google Scholar] [CrossRef] [PubMed] [Green Version]
Figure 1. Global COVID-19 statistics as of April 10, 2020 [7].
Ijgi 09 00351 g001
Figure 2. Red, yellow, and green health Quick Response (QR) codes used to indicate the COVID-19 infection status of people [8,9].
Ijgi 09 00351 g002
Figure 3. The overall framework of assessing the COVID-19 infection risk of ocean-going ships.
Ijgi 09 00351 g003
Figure 4. Minimum distance between ship stops and coastlines.
Ijgi 09 00351 g004
Figure 5. The AIS trajectory and the approached ports and countries of the ship.
Ijgi 09 00351 g005
Figure 6. Evolution of the number of confirmed cases of the approached countries.
Ijgi 09 00351 g006
Figure 7. The 14 day cumulative exposure indexes and risk levels for COVID-19 of the ship.
Ijgi 09 00351 g007
Table 1. Ship stops and associated ports and countries for each date.
DateStop_idPort NameCountry Name
9 February 20202_3Pasir PanjangSingapore
10 February 20202_3Pasir PanjangSingapore
16 February 20202_5YangshanChina
17 February 20202_5YangshanChina
19 February 20202_6Tianjin XingangChina
20 February 20202_6Tianjin XingangChina
22 February 20202_7QingdaoChina
23 February 20202_7QingdaoChina
24 February 20202_8ChinhaiKorea, South
25 February 20202_8ChinhaiKorea, South
28 February 20202_16ZhoushanChina
29 February 20202_16ZhoushanChina
2 March 20202_17YantianChina
3 March 20202_17YantianChina
3 March 20202_18YantianChina
3 March 20202_19YantianChina
6 March 20203_1Tanjung BinMalaysia
7 March 20203_1Tanjung BinMalaysia
8 March 20203_1Tanjung BinMalaysia
23 March 20203_4Tanger MedMorocco
24 March 20203_4Tanger MedMorocco
28 March 20203_5BremerhavenGermany
29 March 20203_5BremerhavenGermany
30 March 20203_5BremerhavenGermany
30 March 20203_7HamburgGermany
31 March 20203_7HamburgGermany
3 April 20203_8GothenburgSweden
4 April 20203_8GothenburgSweden
5 April 20203_9AarhusDenmark
7 April 20203_10WilhelmshavenGermany
8 April 20203_10WilhelmshavenGermany
8 April 20203_11BremerhavenGermany

