Geospatial Assessment of Soil Erosion Intensity and Sediment Yield Using the Revised Universal Soil Loss Equation (RUSLE) Model

 ,
,  ,
,
Abstract
:1. Introduction
2. Methods and Materials
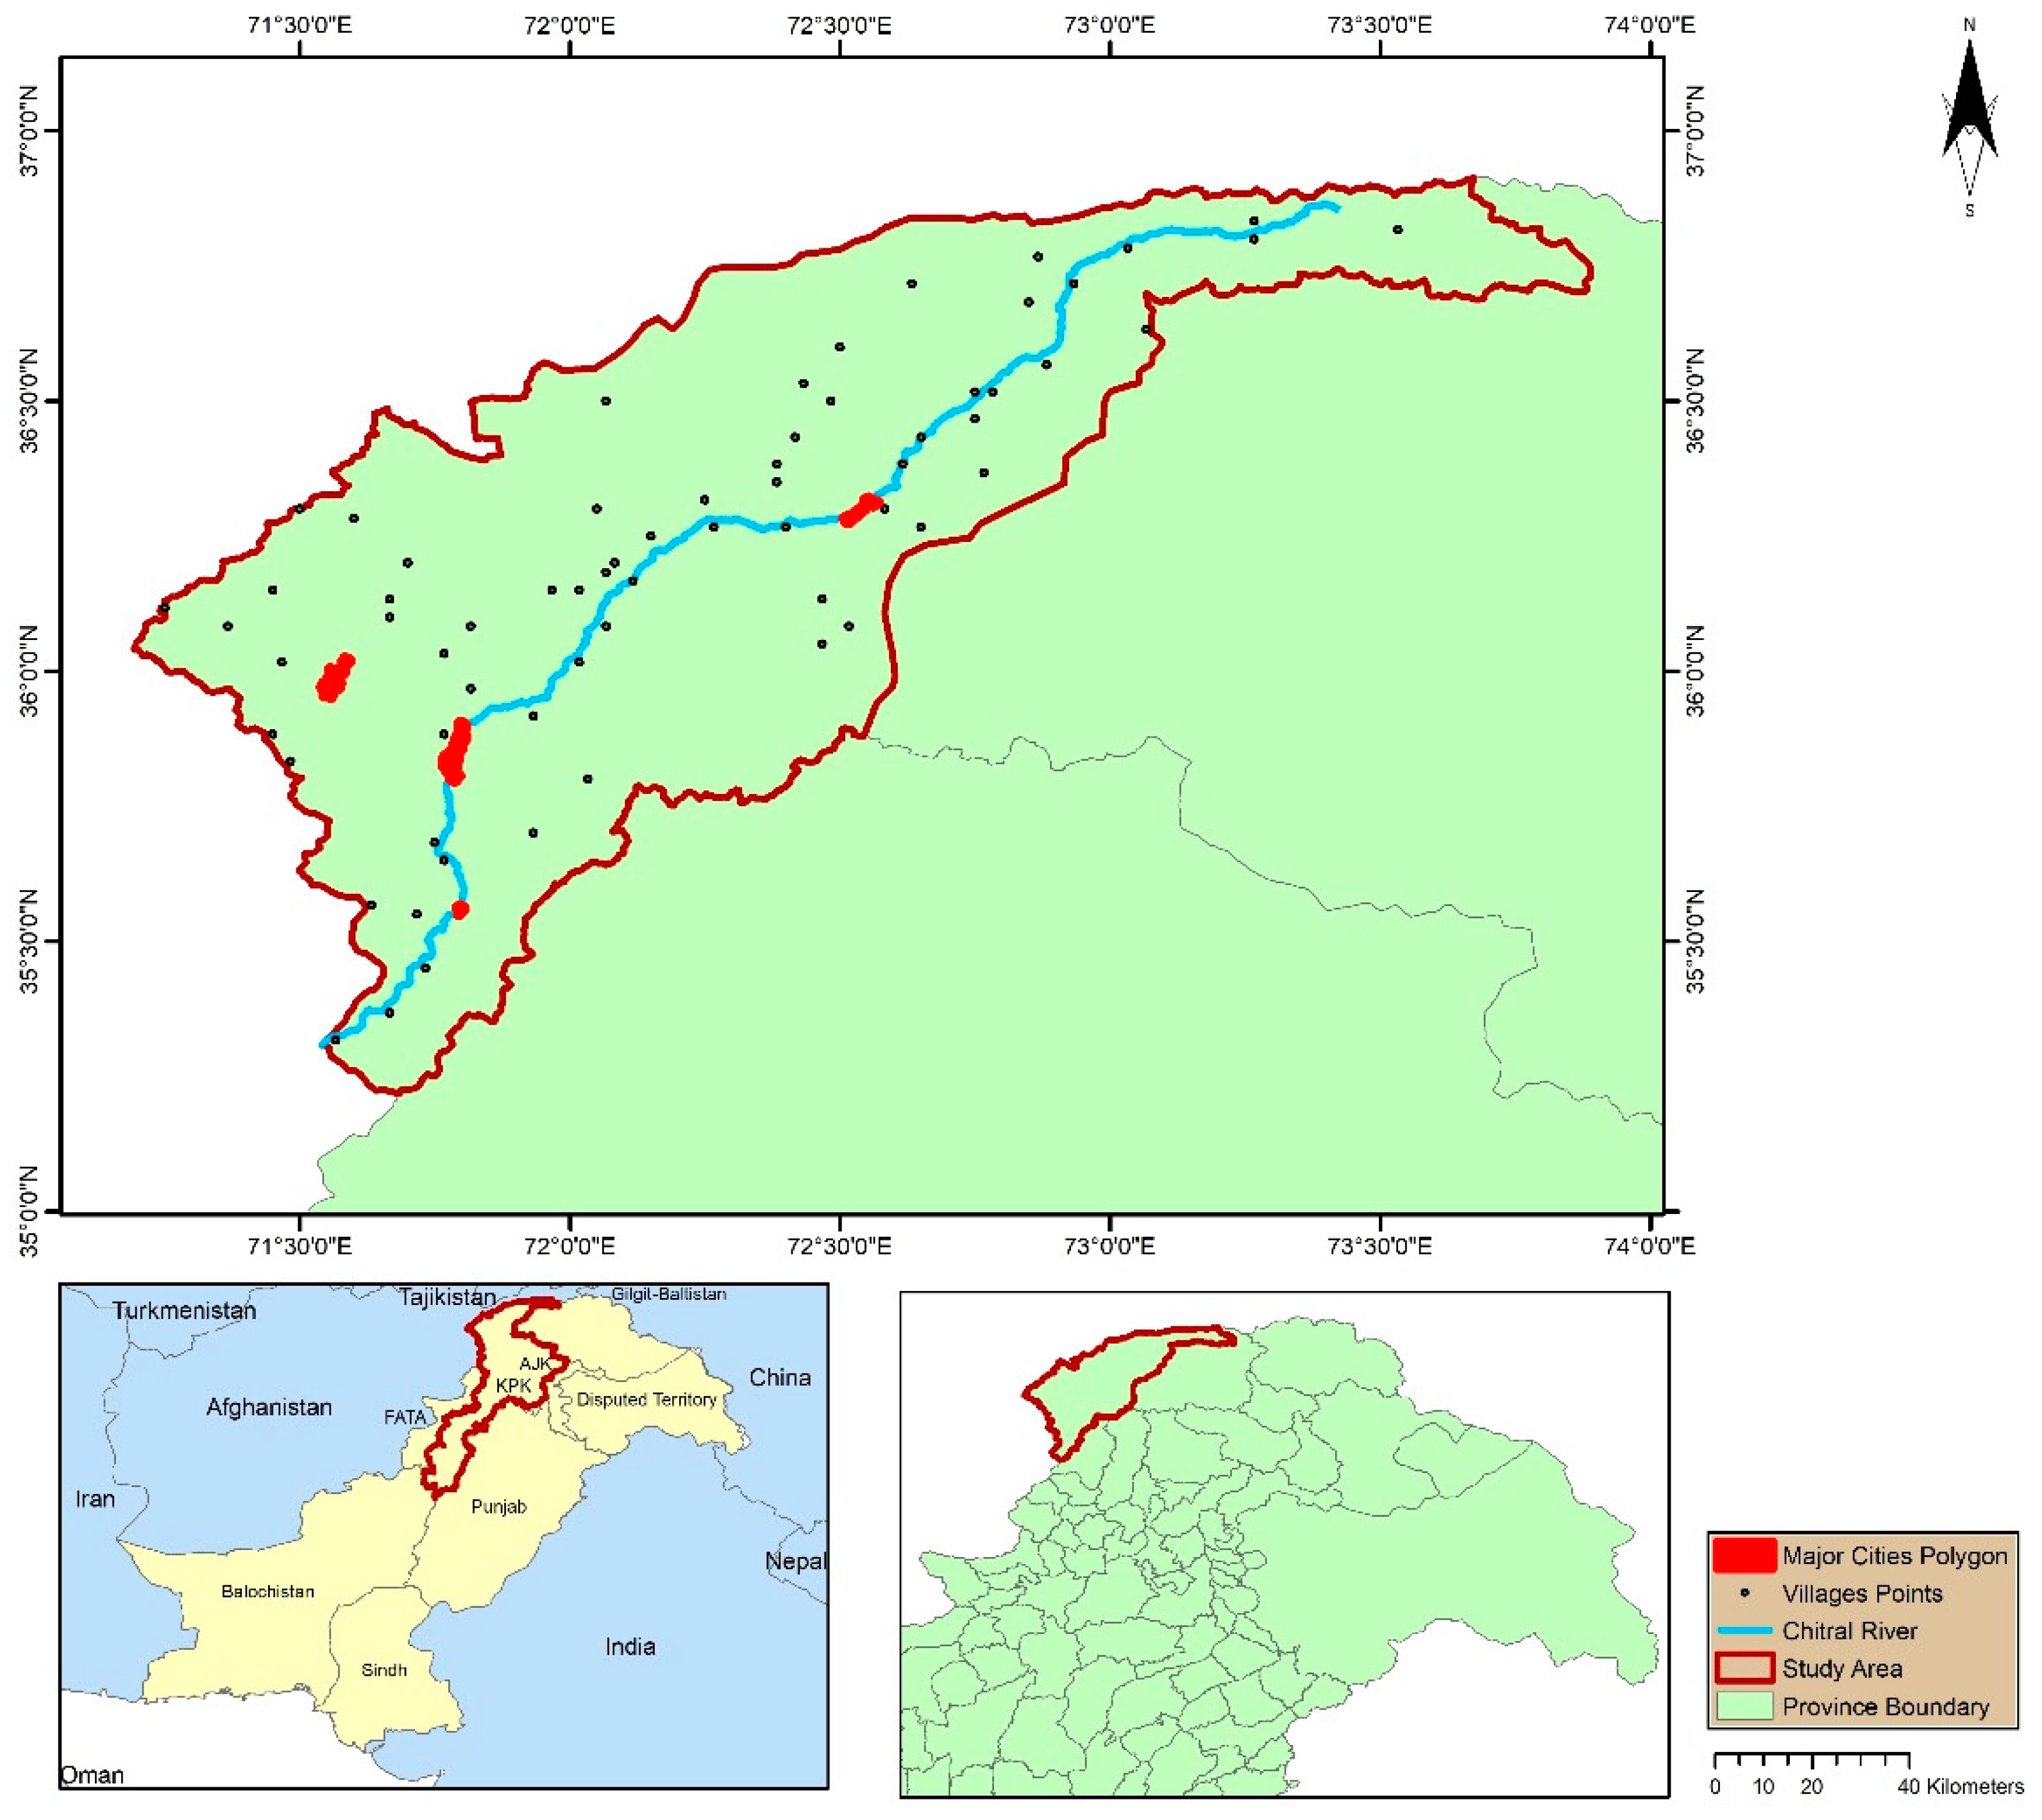
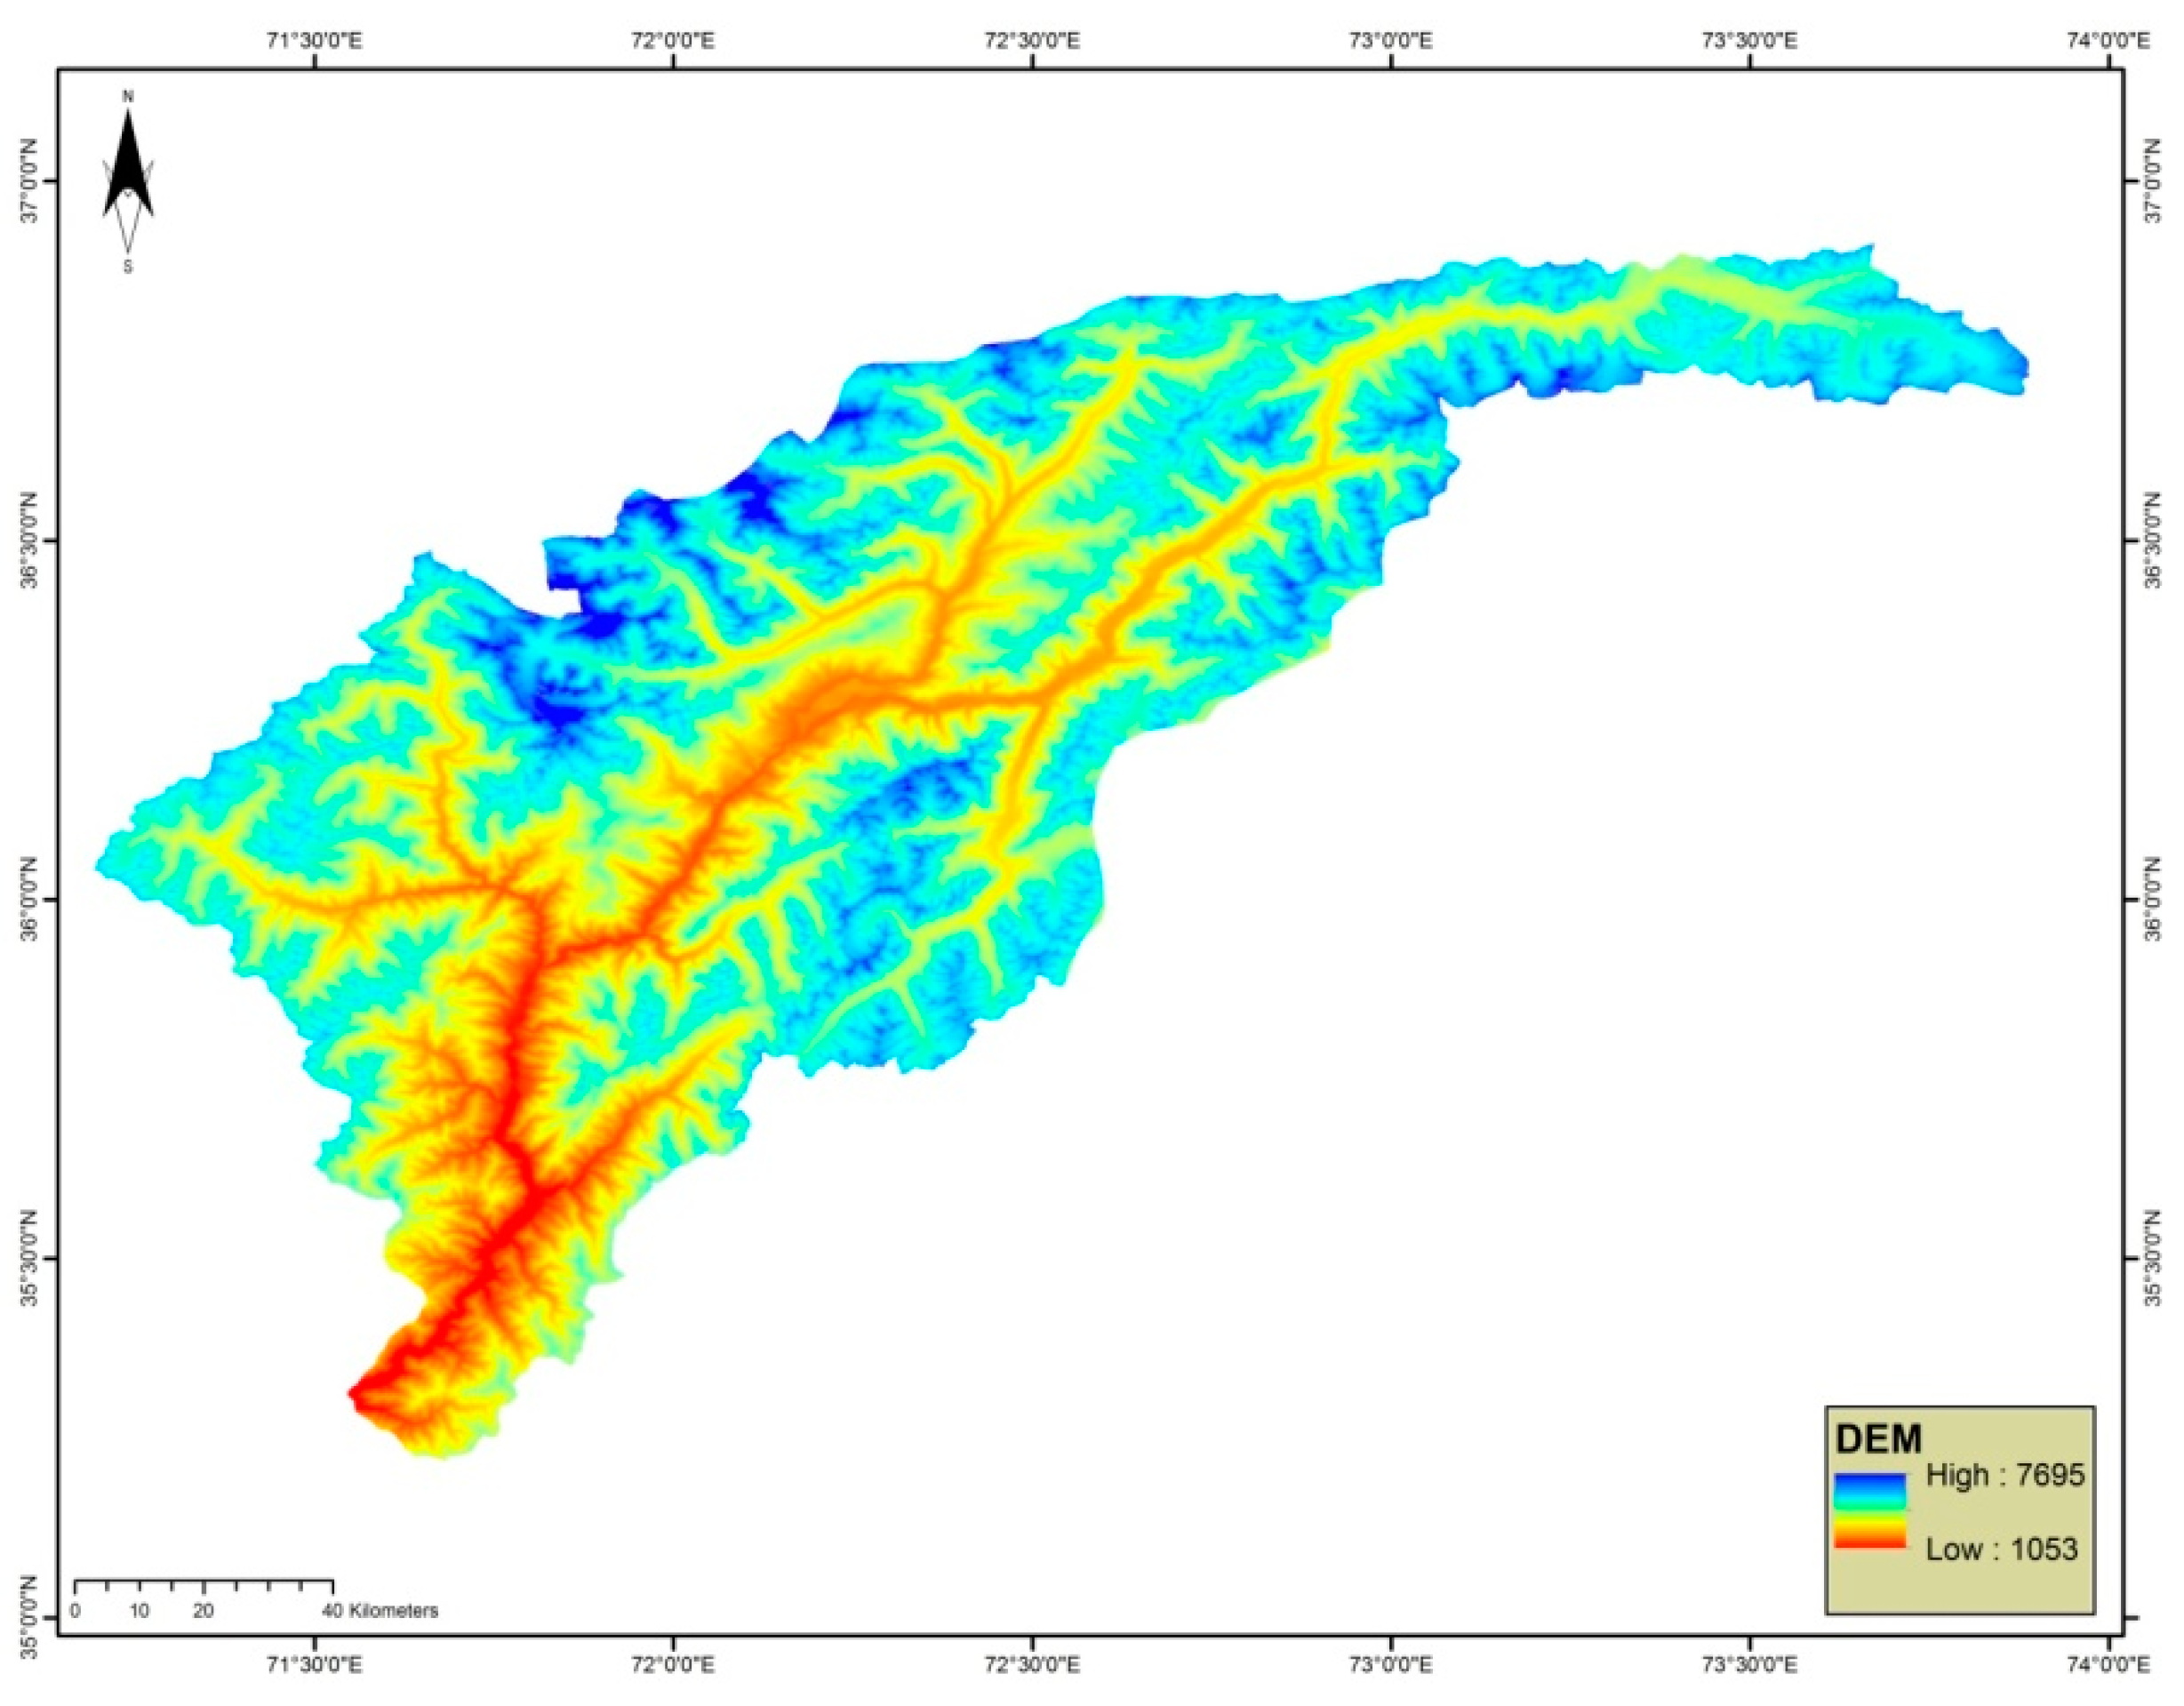
2.1. Study Area
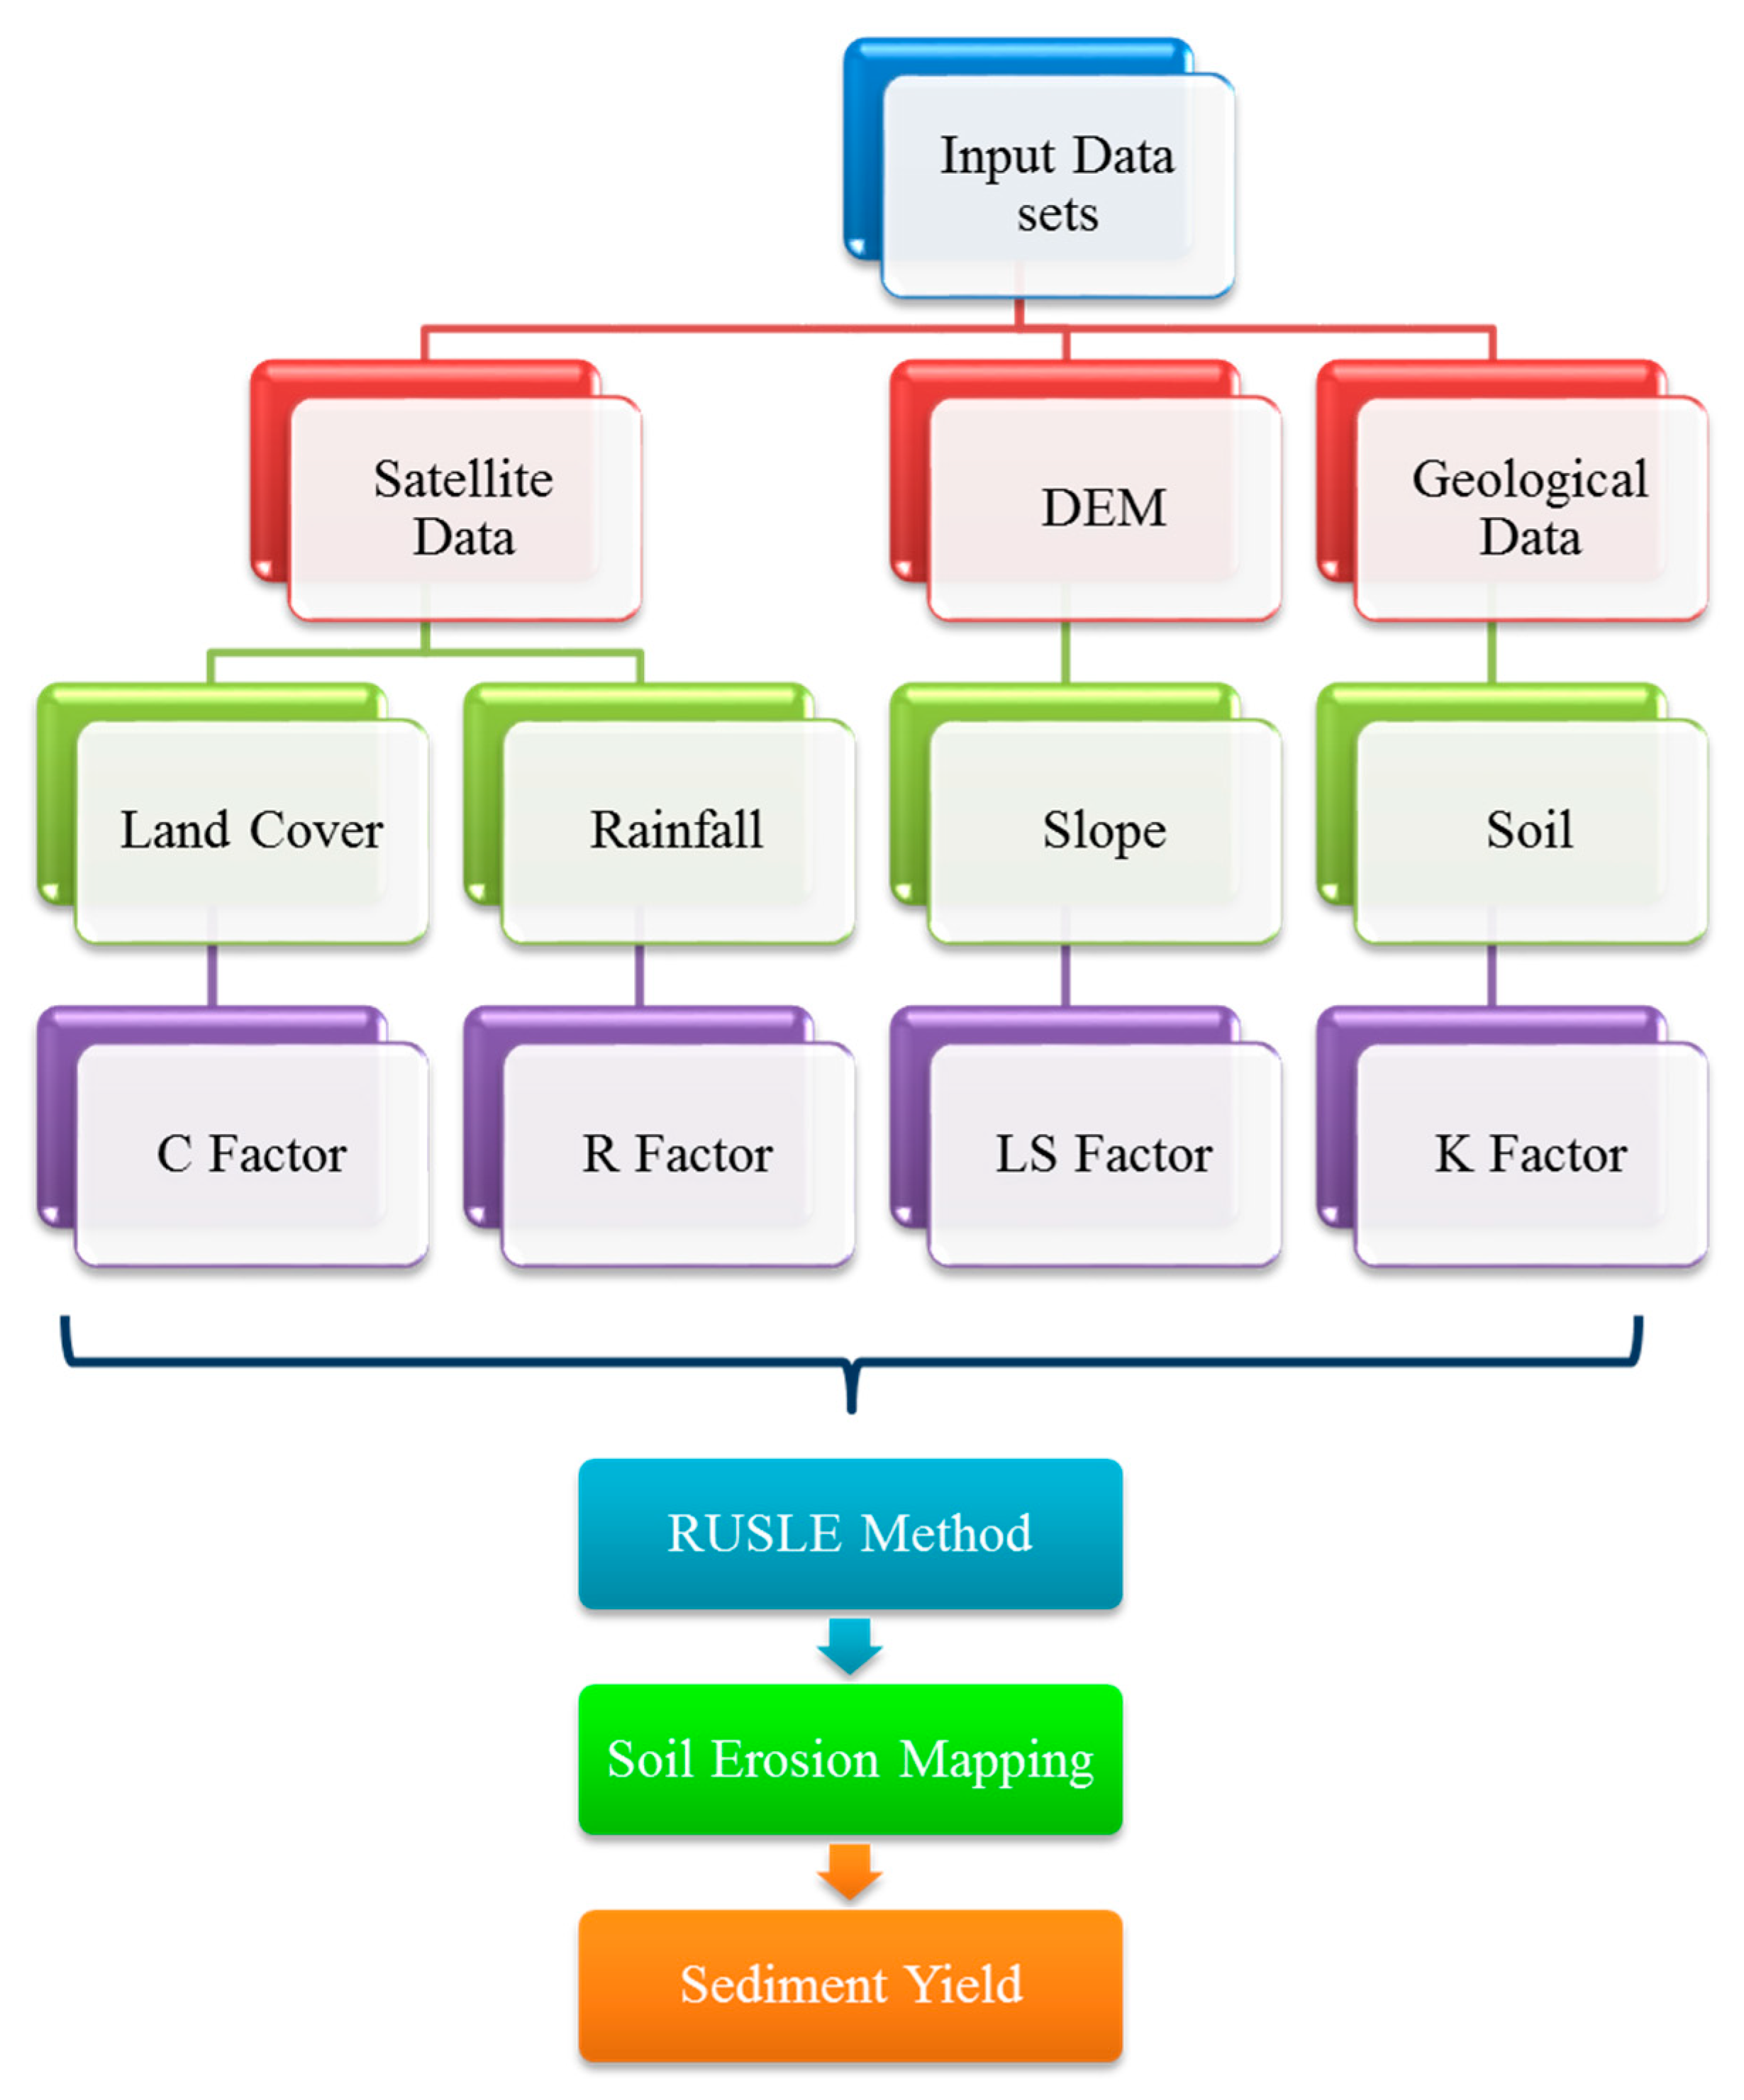
2.2. Methodology
2.3. RUSLE Model Factor
2.3.1. Topographic (LS) Factor
- By using filled DEM as input to find the way of the flow.
- By using the direction of flow as an input grid derived the flow assemblage.
- Flow assemblage is used as an input grid for the extraction of the stream network.
- Using the extraction of drainage for the ordering of stream network
- Using ordering map of stream network for the derivation of water basin flow length.
- Slope derivation through DEM.
2.3.2. Cover (C) Factor
2.3.3. Soil Erodibility (K) Factor
2.3.4. Rainfall Erosivity (R) Factor
2.3.5. Erosion Control Practice (P) Factor
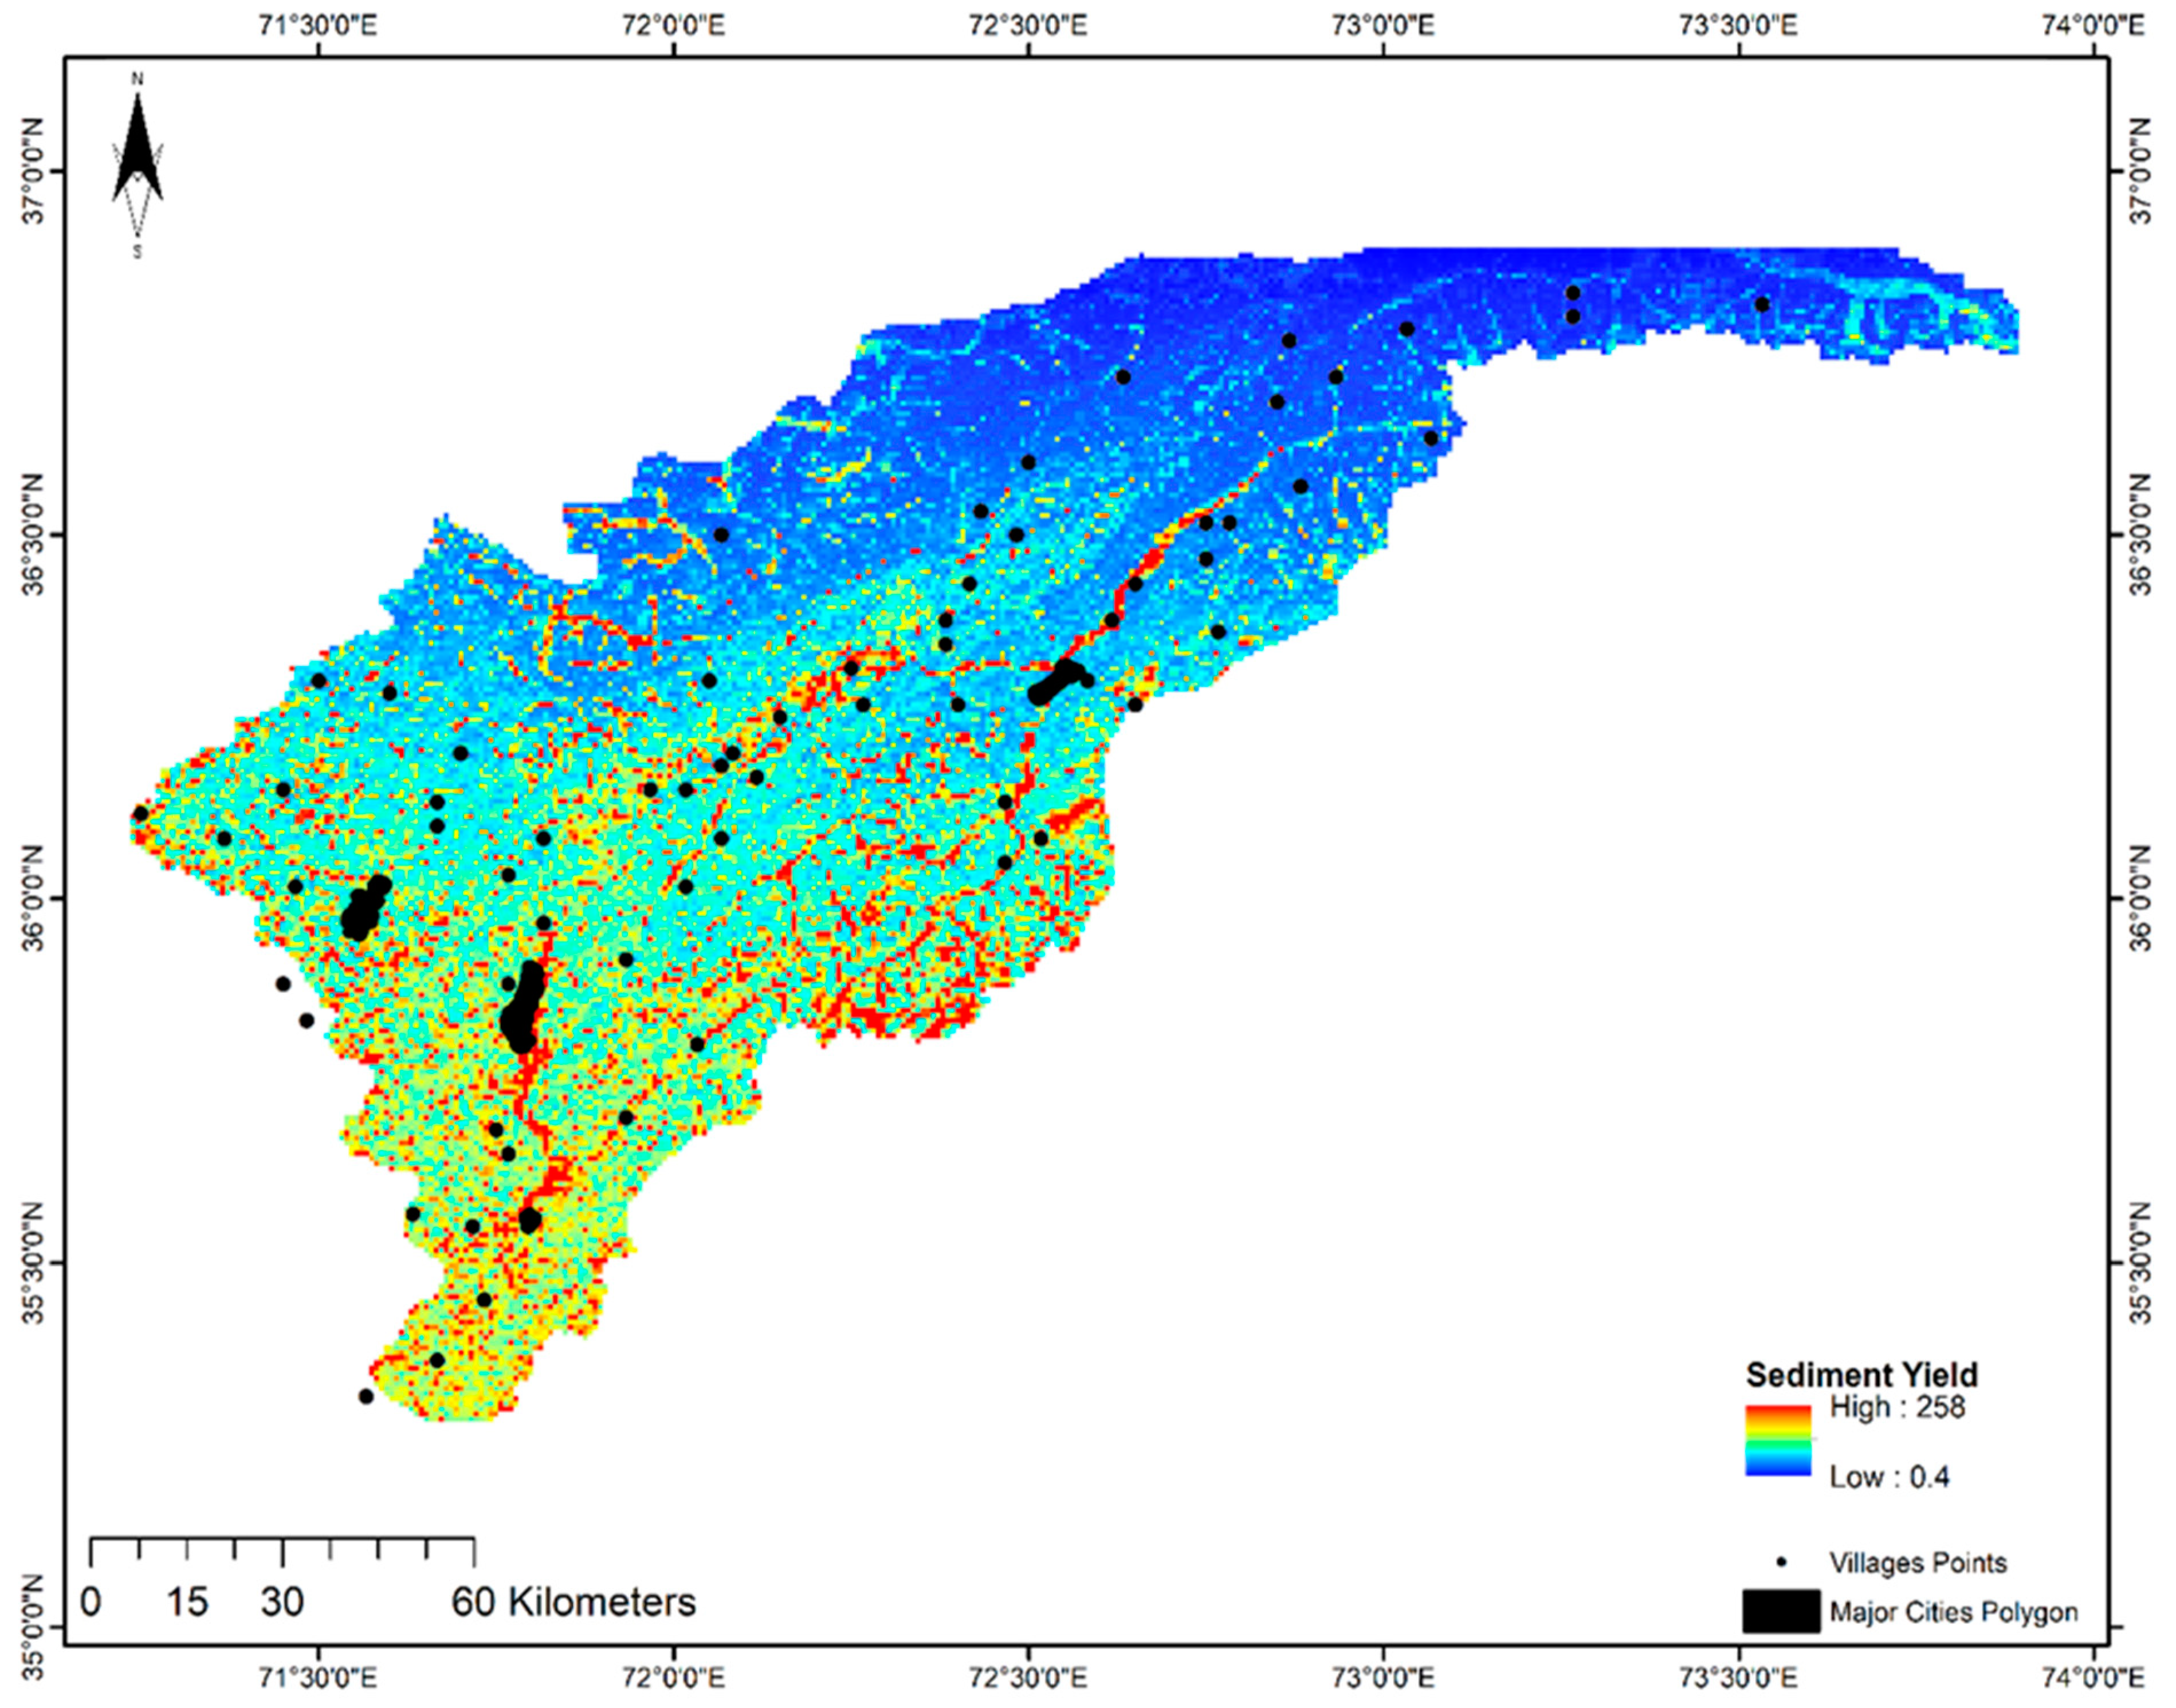
2.3.6. Sediment Yield (Y)
3. Results
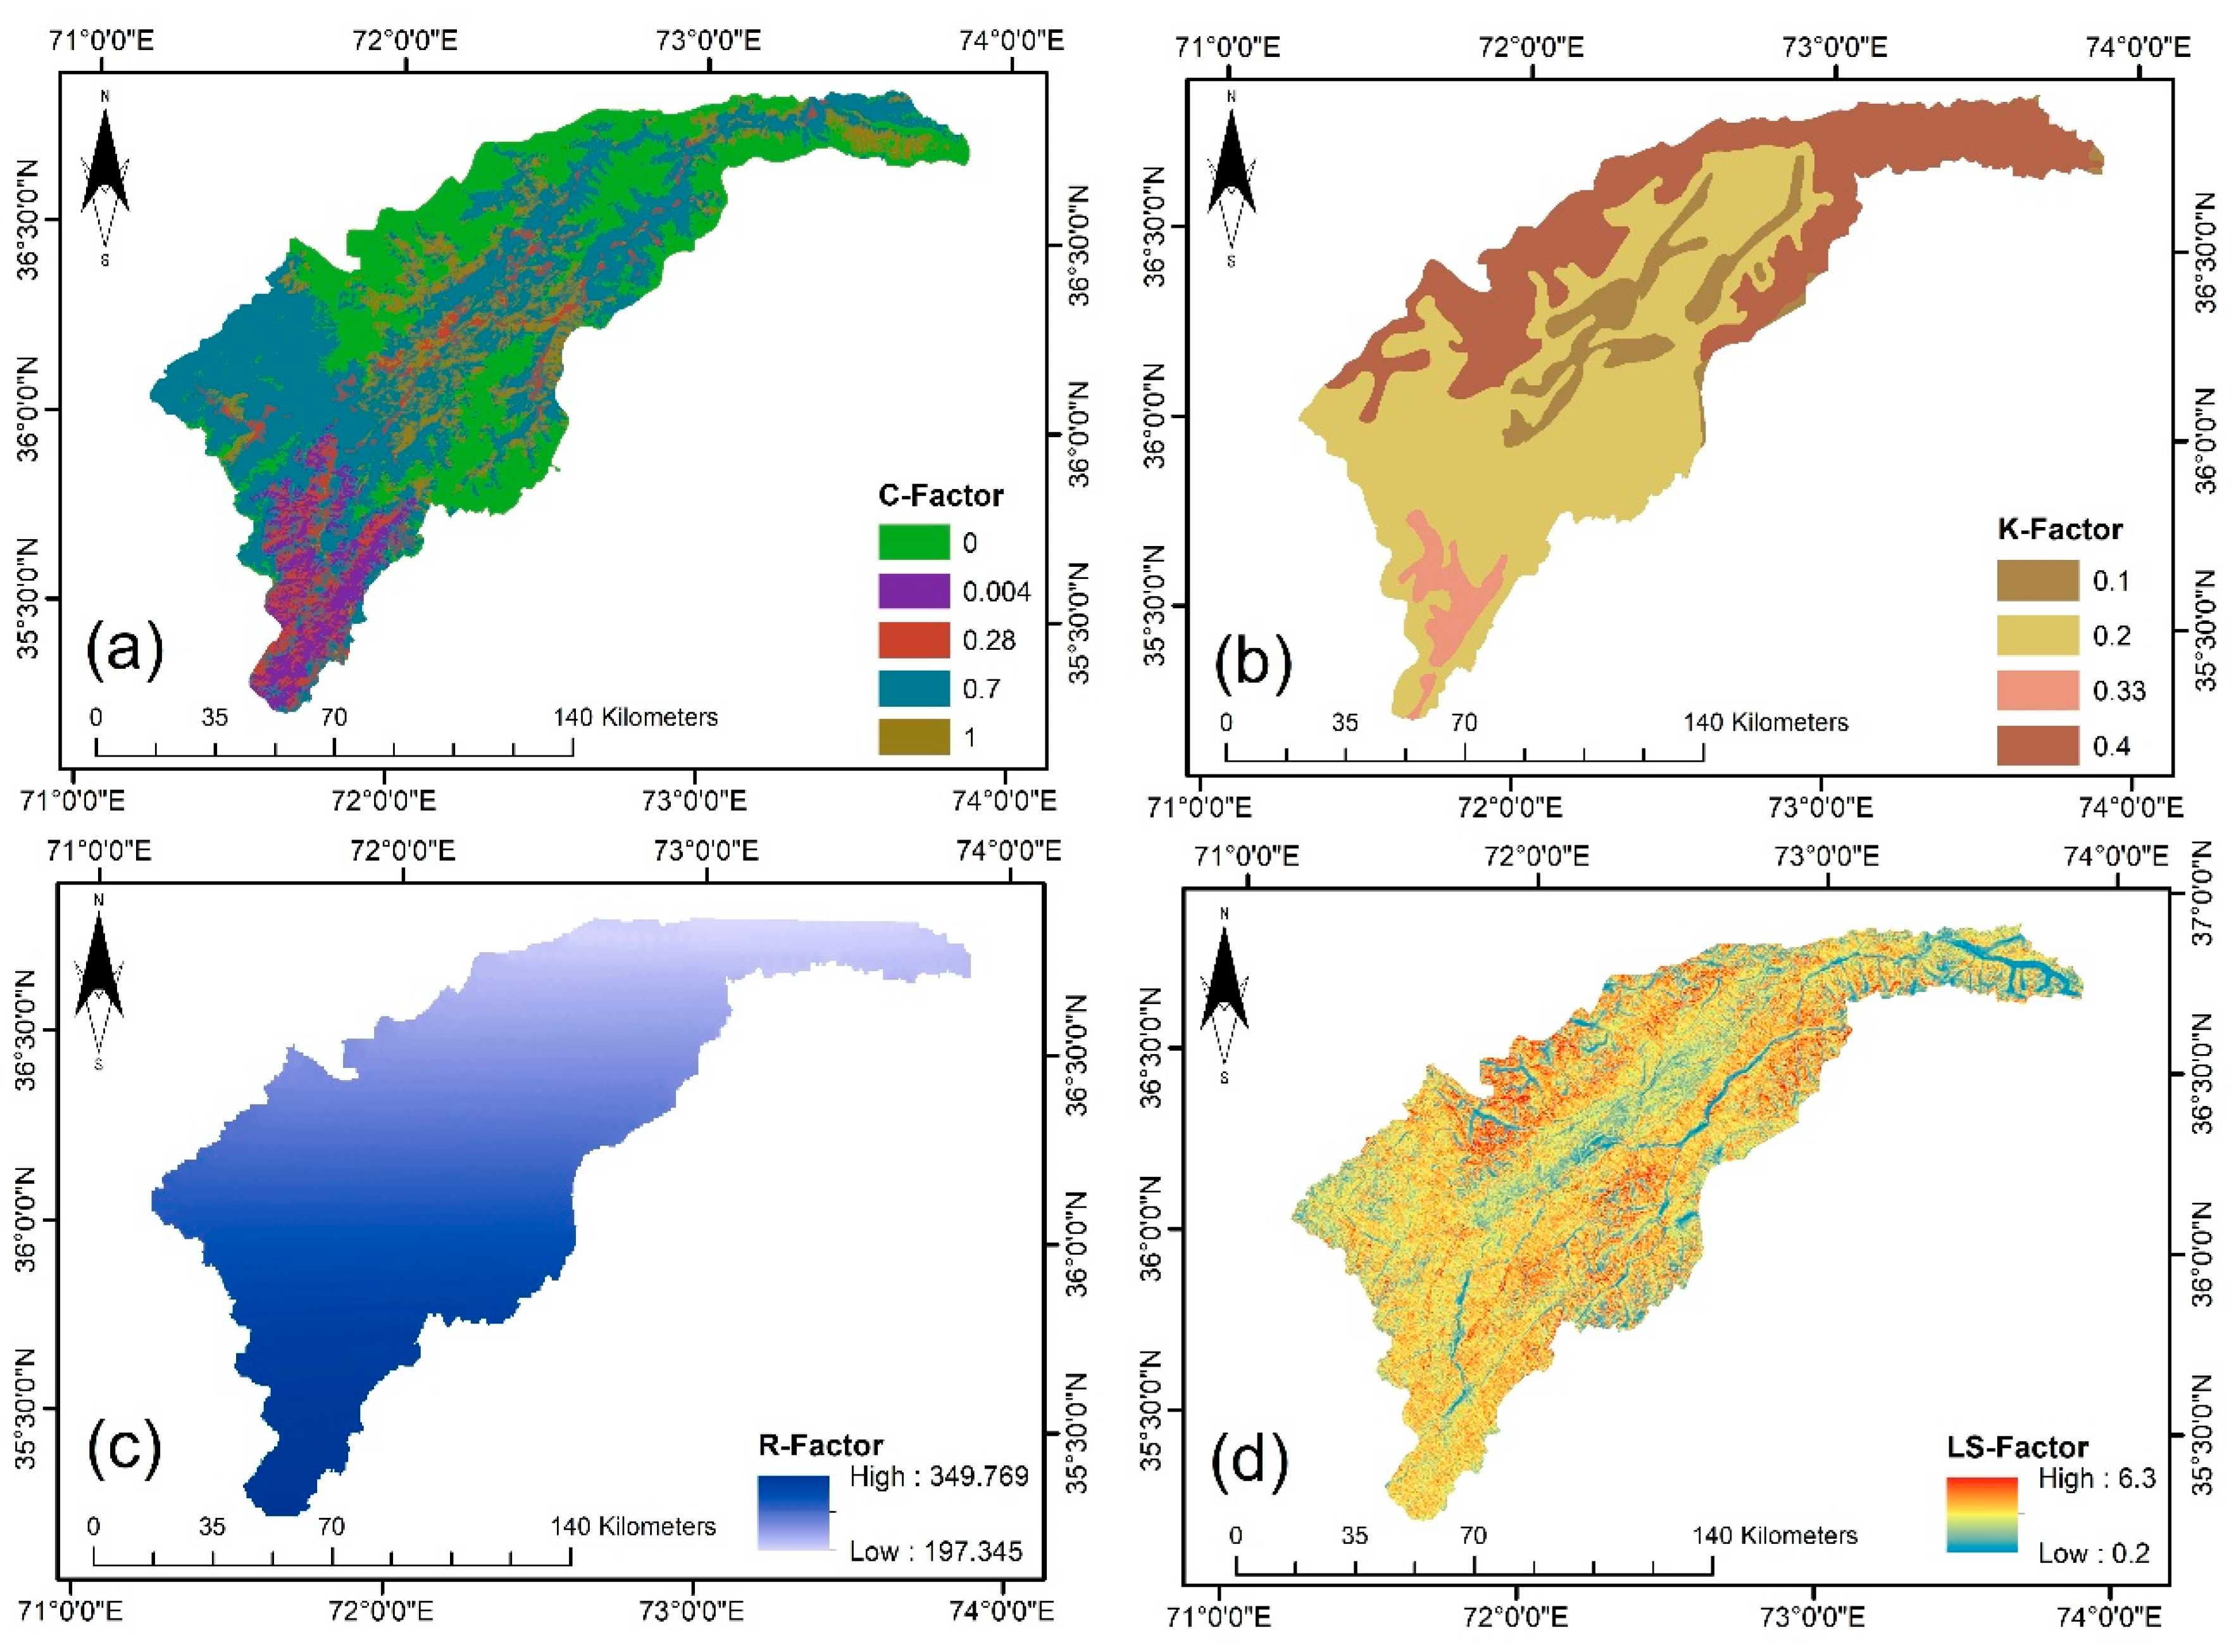
3.1. C-factor
3.2. K-Factor
3.3. R-Factor
3.4. LS-Factor
3.5. Sediment Yield
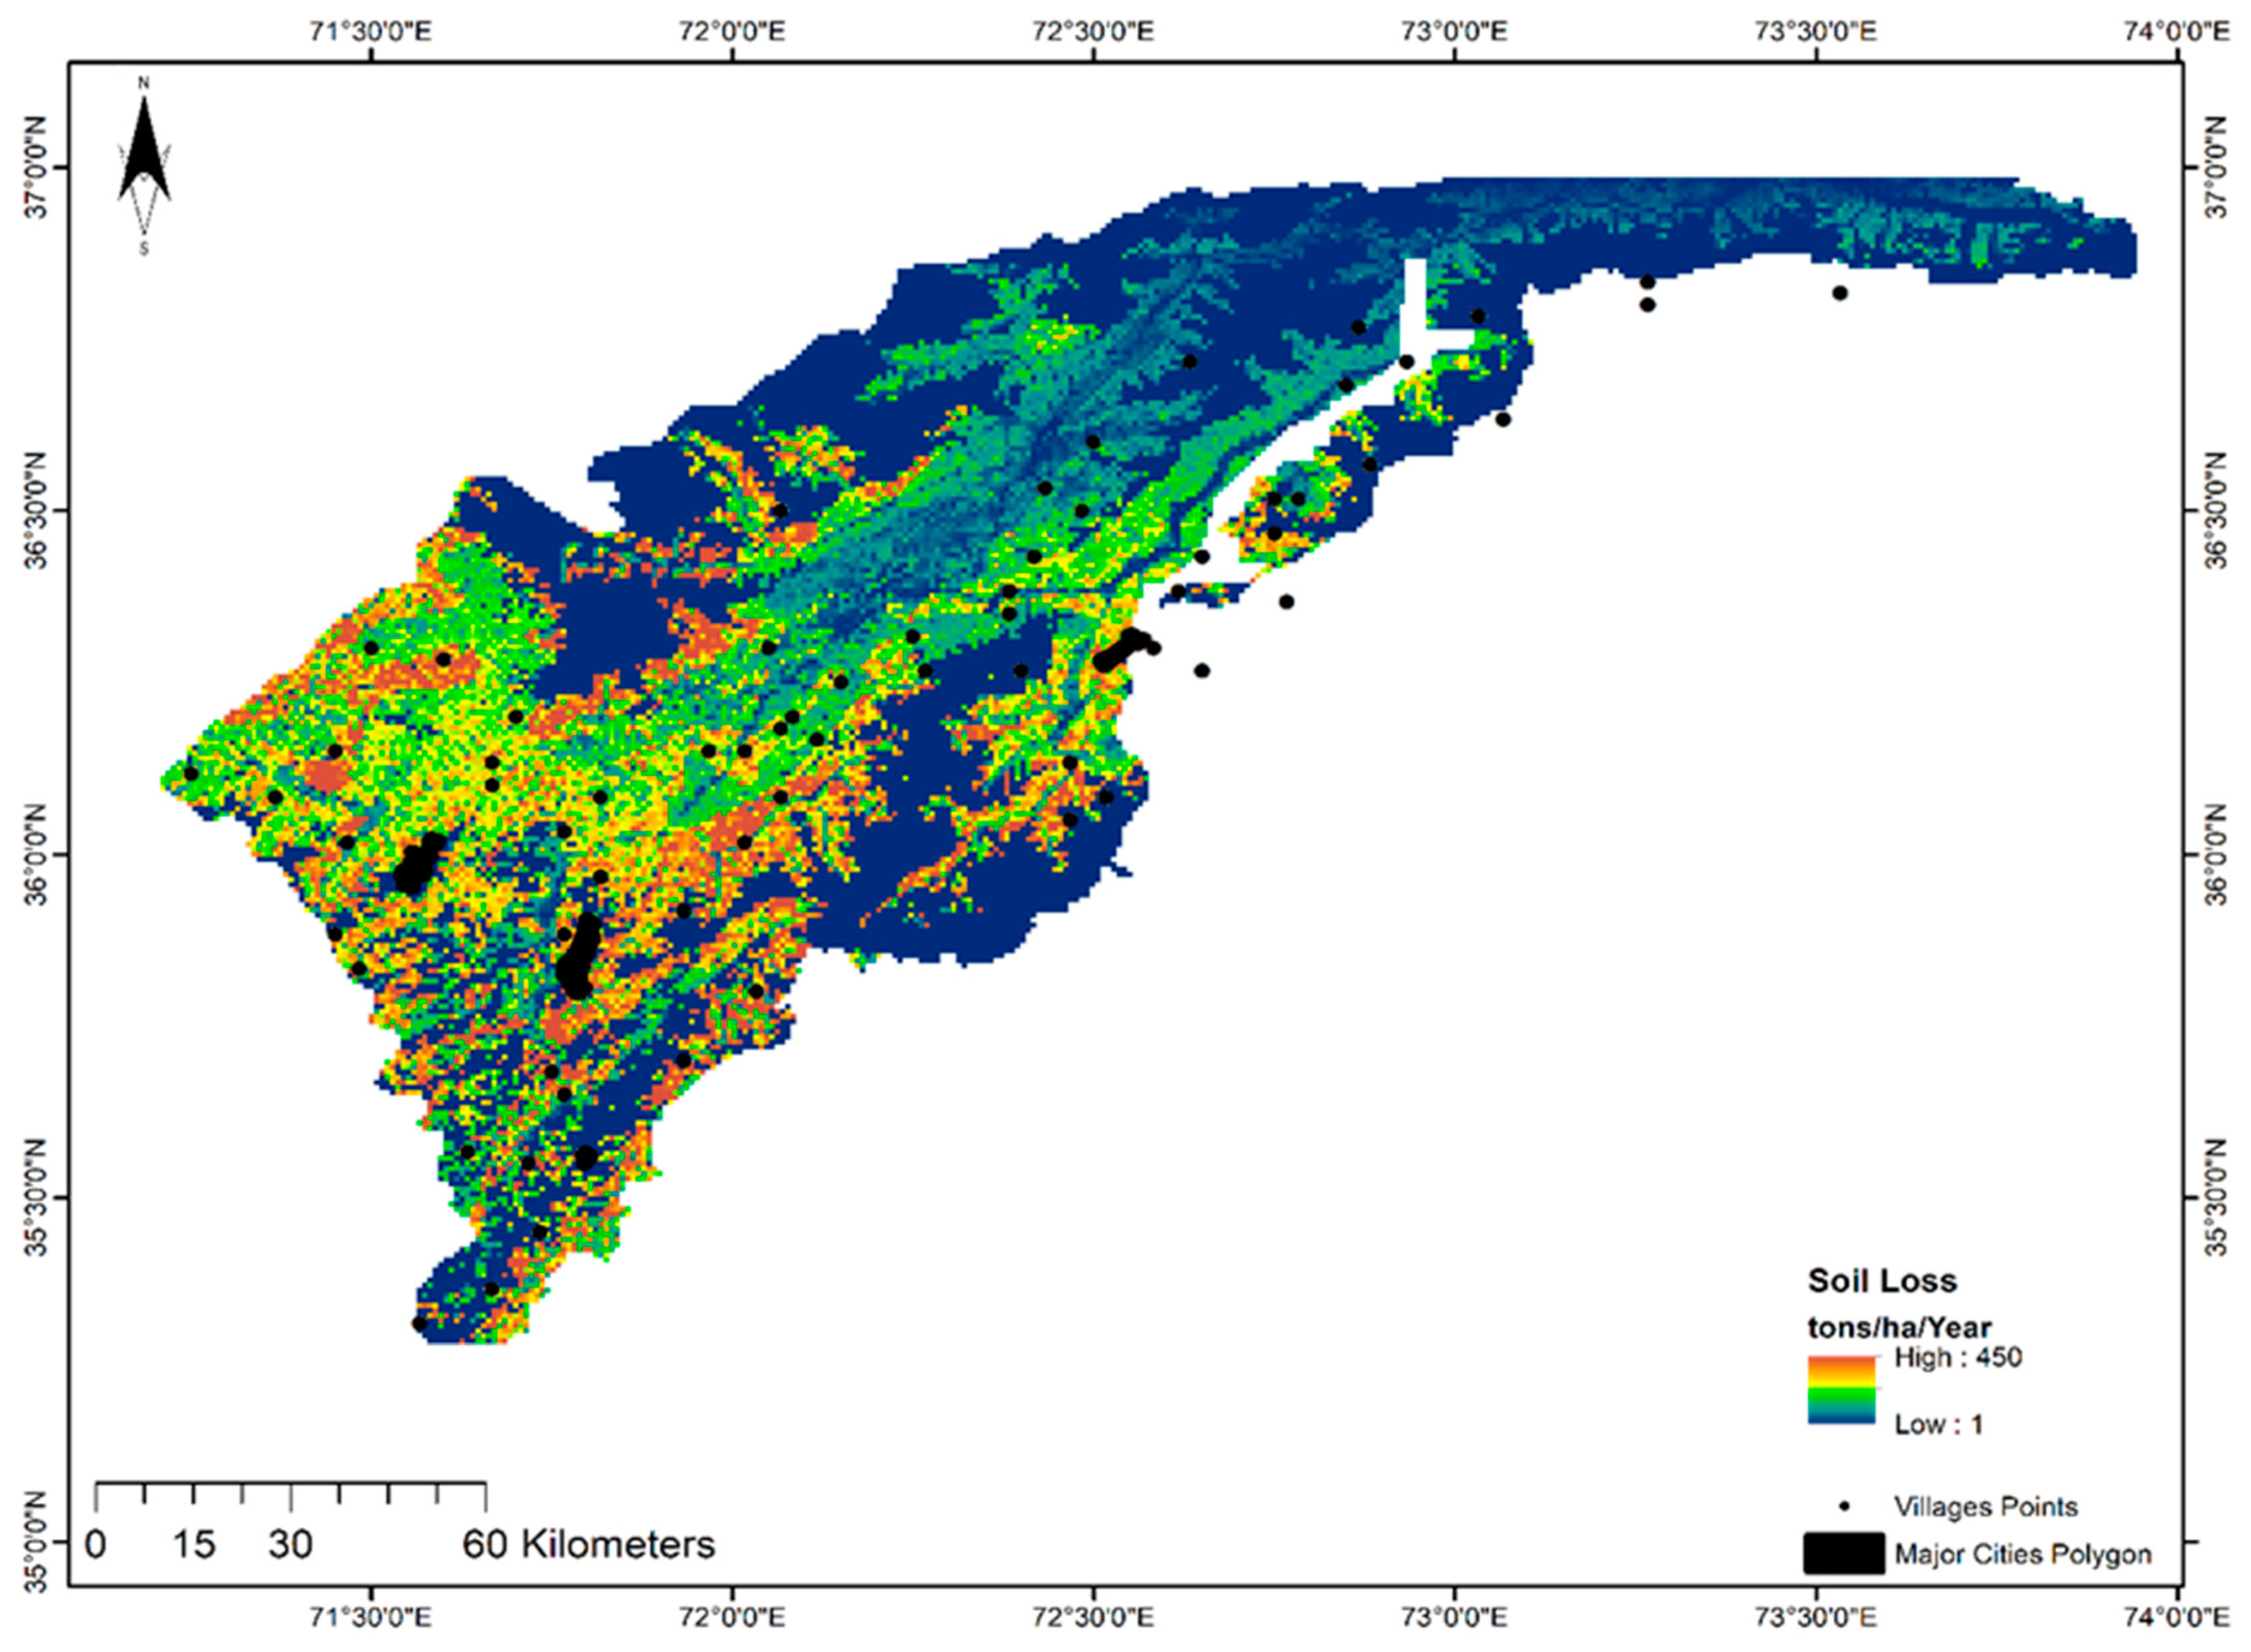
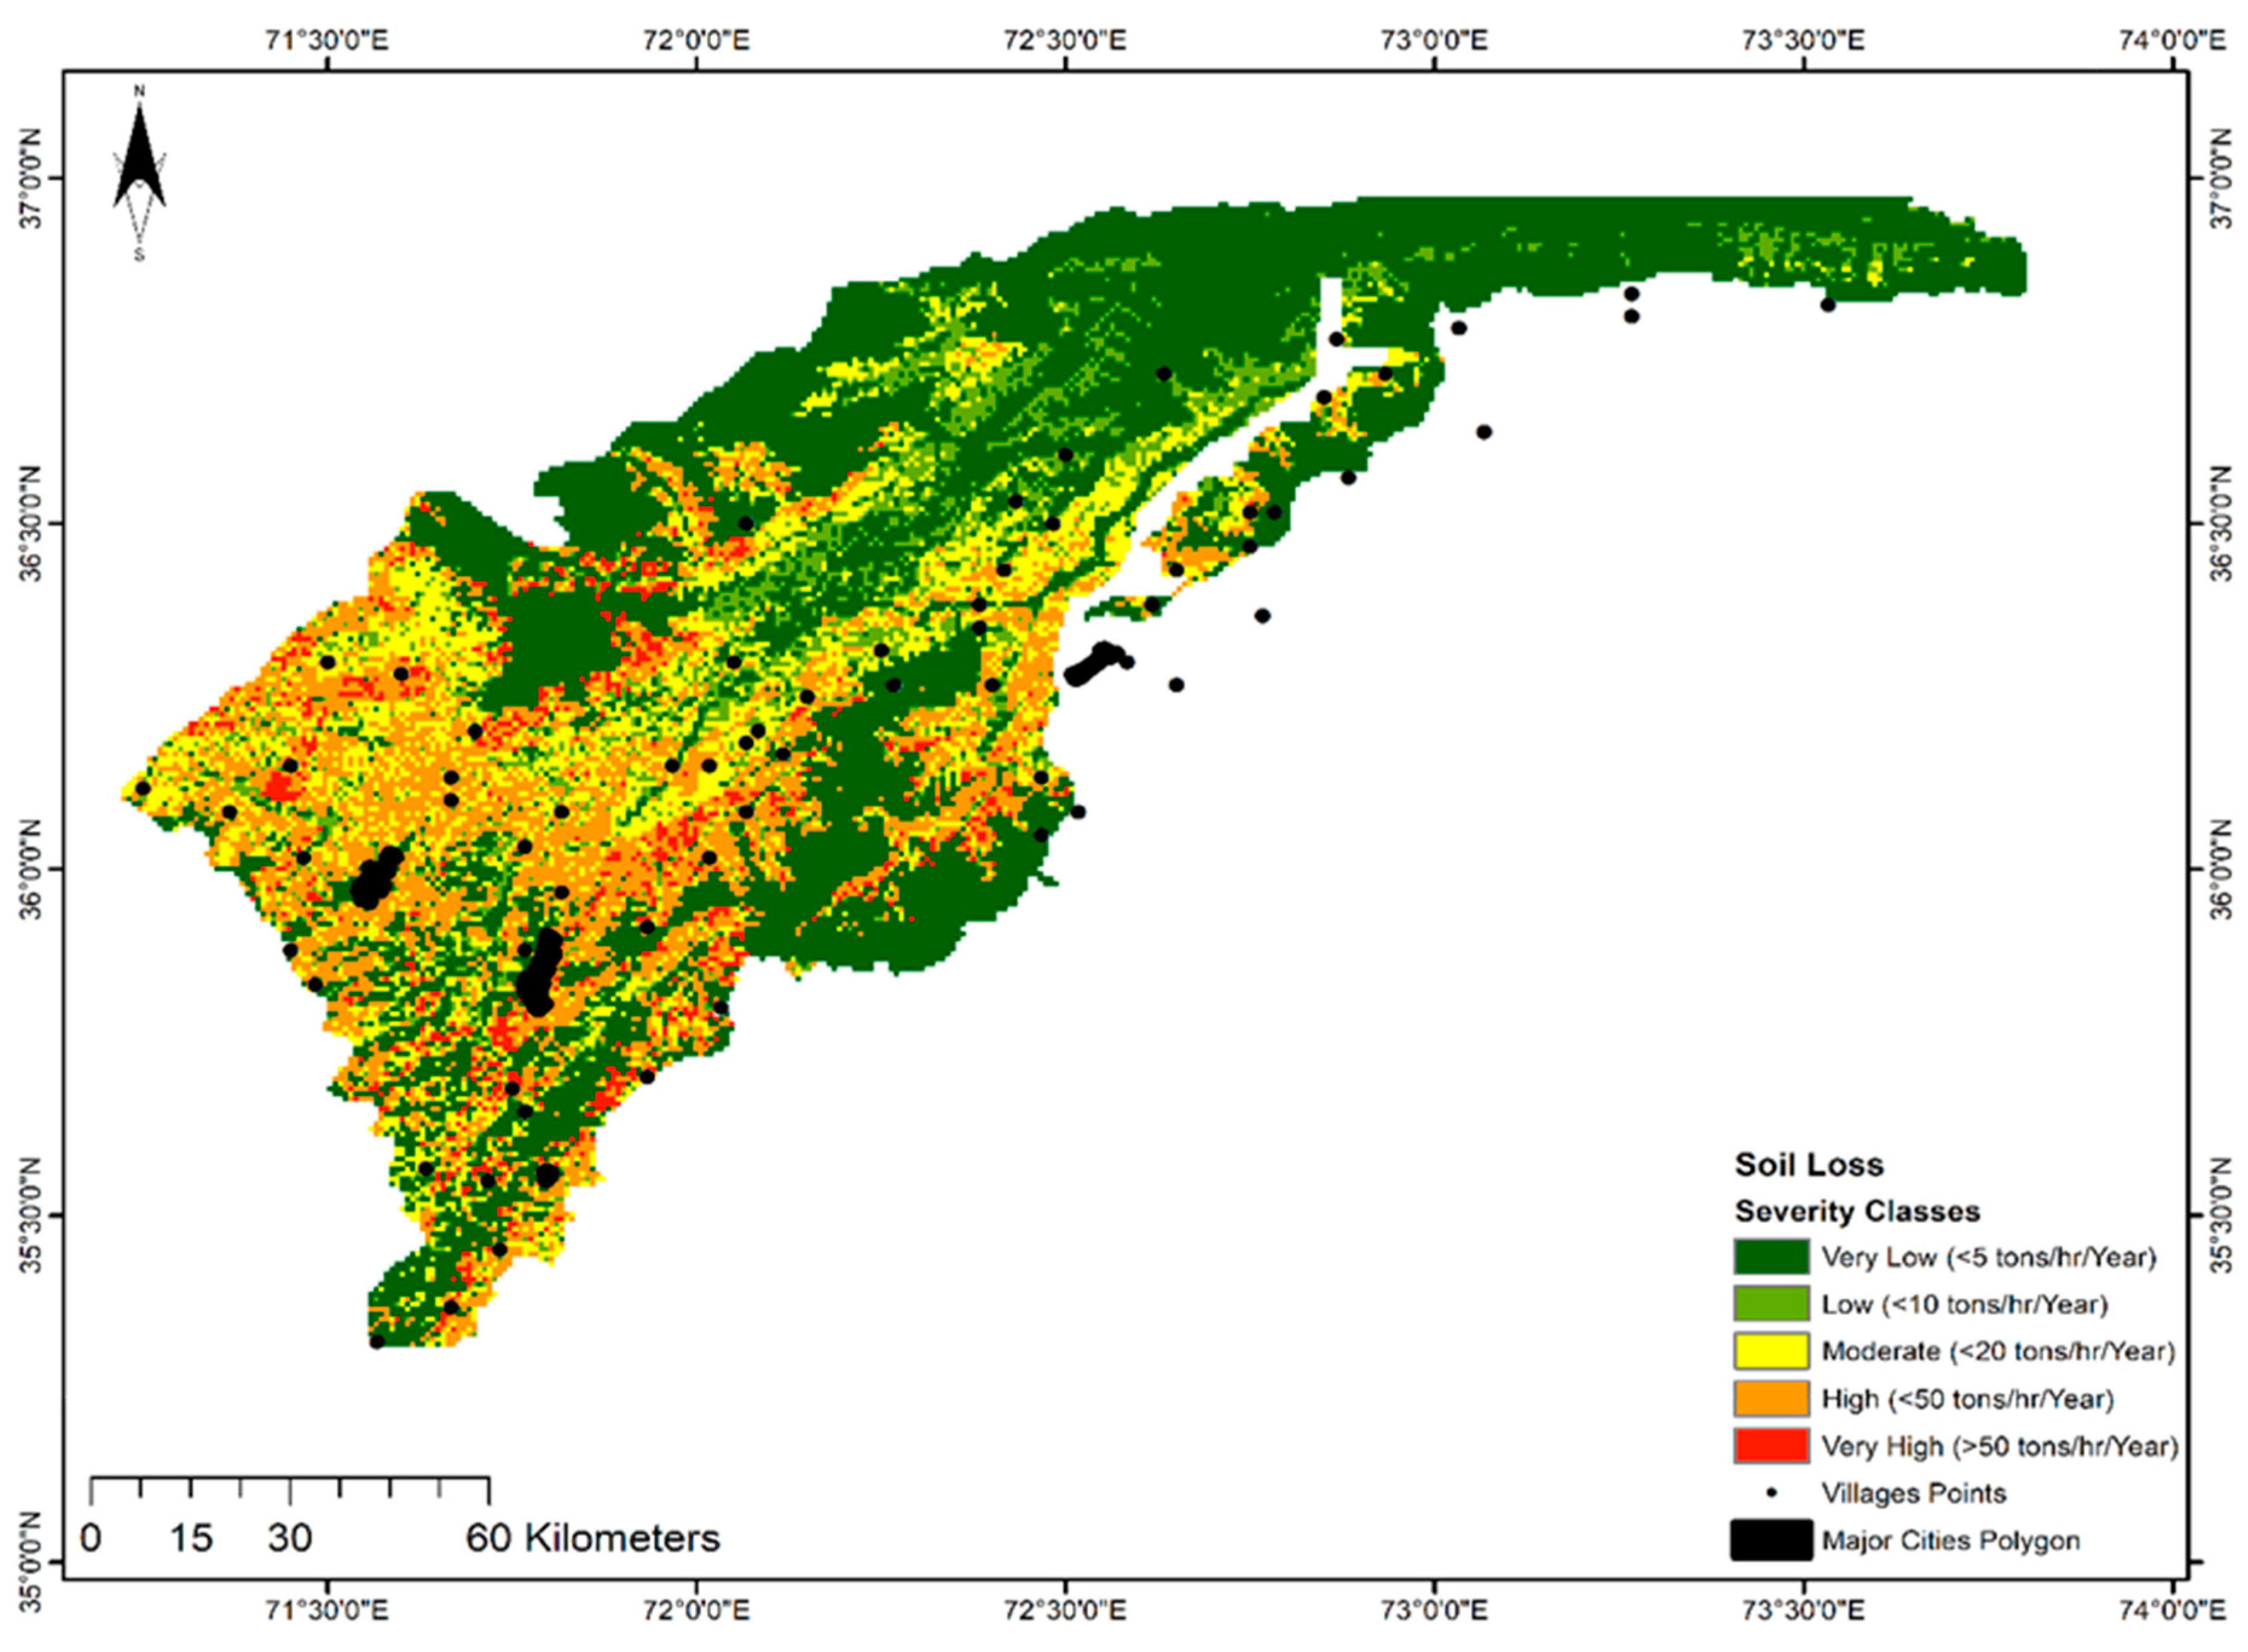
3.6. Soil Loss
4. Discussion
5. Conclusions
Author Contributions
Funding
Acknowledgments
Conflicts of Interest
References
- Shit, P.K. Gully Erosion Studies from India and Surrounding Regions; Springer Nature: Berlin/Heidelberg, Germany, 2019. [Google Scholar]
- Boakye, E. Spatial distribution of soil erosion and sediment yield in the Pra River Basin. Sn Appl. Sci. 2020, 2, 320. [Google Scholar] [CrossRef] [Green Version]
- Chuenchum, P.; Xu, M.; Tang, W. Estimation of Soil Erosion and Sediment Yield in the Lancang–Mekong River Using the Modified Revised Universal Soil Loss Equation and GIS Techniques. Water 2020, 12, 135. [Google Scholar] [CrossRef] [Green Version]
- Luetzenburg, G. Climate and land use change effects on soil erosion in two small agricultural catchment systems Fugnitz–Austria, Can Revull–Spain. Sci. Total Environ. 2020, 704, 135389. [Google Scholar] [CrossRef] [PubMed]
- Vaezi, A.R. Assessment of soil particle erodibility and sediment trapping using check dams in small semi-arid catchments. Catena 2017, 157, 227–240. [Google Scholar] [CrossRef] [Green Version]
- Ullah, S. Geospatial assessment of soil erosion intensity and sediment yield: A case study of Potohar Region, Pakistan. Environ. Earth Sci. 2018, 77, 705. [Google Scholar] [CrossRef]
- Hamanaka, A. Experimental study on soil erosion under different soil composition using rainfall simulator. Plant. Soil Env. 2019, 65, 181–188. [Google Scholar] [CrossRef] [Green Version]
- Vanmaercke, M. Sediment Yield and Reservoir Siltation in Tigray. In Geo-Trekking in Ethiopia’s Tropical Mountains; Springer: Berlin/Heidelberg, Germany, 2019; pp. 345–357. [Google Scholar]
- Walling, D.E. Human impact on the sediment loads of Asian rivers. Sediment Problems and Sediment Management in Asian River Basins. IAHS Publ. 2011, 349, 37–51. [Google Scholar]
- Lal, R. Soil erosion and global warming in India. J. Soil Water Conserv. 2017, 16, 297–305. [Google Scholar] [CrossRef]
- Karimzadeh, H.; Alizadeh, M. Spatial Estimation of Soil Erosion in Iran. Using Rusle Model. Iran. J. Echohydology 2018, 5, 551–569. [Google Scholar]
- Ashraf, A. Modeling risk of soil erosion in high and medium rainfall zones of Pothwar region, Pakistan. Proc. Pak. Acad. Sci. Pak. Acad. Sci. B. Life Environ. Sci. 2017, 54, 67–77. [Google Scholar]
- Walling, D.E. Measuring sediment yield from river basins. In Soil Erosion Research Methods; Routledge: London, UK, 2017; pp. 39–82. [Google Scholar]
- Atoma, H.; Suryabhagavan, K.; Balakrishnan, M. Soil erosion assessment using RUSLE model and GIS in Huluka watershed, Central Ethiopia. Sustain. Water Resour. Manag. 2020, 6, 12. [Google Scholar] [CrossRef]
- Anjum, S.A. Desertification in Pakistan: Causes, impacts and management. J. Foodagric. Environ. 2010, 8, 1203–1208. [Google Scholar]
- Sabir, M.A. The Impact of Suspended Sediment Loadon Reservoir Siltation and Energy Production: A Case Study of the Indus River and Its Tributaries. Pol. J. Environ. Stud. 2013, 22, 219–225. [Google Scholar]
- Altaf, S.; Meraj, G.; Romshoo, S.A. Morphometry and land cover based multi-criteria analysis for assessing the soil erosion susceptibility of the western Himalayan watershed. Environ. Monit. Assess. 2014, 186, 8391–8412. [Google Scholar] [CrossRef]
- Amin, M.; Romshoo, S.A. Comparative assessment of soil erosion modelling approaches in a Himalayan watershed. Modeling Earth Syst. Environ. 2019, 5, 175–192. [Google Scholar] [CrossRef]
- Abdo, H.; Salloum, J. Mapping the soil loss in Marqya basin: Syria using RUSLE model in GIS and RS techniques. Environ. Earth Sci. 2017, 76, 114. [Google Scholar] [CrossRef]
- Djoukbala, O. Estimating of water erosion in semiarid regions using RUSLE equation under GIS environment. Environ. Earth Sci. 2018, 77, 345. [Google Scholar] [CrossRef]
- Yeshaneh, G.T. Assessment of soil fertility variation in different land uses and management practices in maybar watershed, South Wollo Zone, North Ethiopia. Int. J. Environ. Bioremediation Biodegrad. 2015, 3, 15–22. [Google Scholar]
- Wang, X. Assessment of soil erosion change and its relationships with land use/cover change in China from the end of the 1980s to 2010. Catena 2016, 137, 256–268. [Google Scholar] [CrossRef]
- Zare, M.; Panagopoulos, T.; Loures, L. Simulating the impacts of future land use change on soil erosion in the Kasilian watershed, Iran. Land Use Policy 2017, 67, 558–572. [Google Scholar] [CrossRef]
- Rodríguez-Blanco, M.L. Potential impact of climate change on suspended sediment yield in nwspain: A case study on the corbeira catchment. Water 2016, 8, 444. [Google Scholar]
- Gelagay, H.S.; Minale, A.S. Soil loss estimation using GIS and Remote sensing techniques: A case of Koga watershed, Northwestern Ethiopia. Int. Soil Water Conserv. Res. 2016, 4, 126–136. [Google Scholar] [CrossRef] [Green Version]
- Rangsiwanichpong, P.; Kazama, S.; Gunawardhana, L. Assessment of sediment yield in Thailand using revised universal soil loss equation and geographic information system techniques. River Res. Appl. 2018, 34, 1113–1122. [Google Scholar] [CrossRef]
- Biswas, S.S.; Pani, P. Estimation of soil erosion using RUSLE and GIS techniques: A case study of Barakar River basin, Jharkhand, India. Modeling Earth Syst. Environ. 2015, 1, 42. [Google Scholar] [CrossRef] [Green Version]
- Balasubramani, K. Estimation of soil erosion in a semi-arid watershed of Tamil Nadu (India) using revised universal soil loss equation (rusle) model through GIS. Modeling Earth Syst. Environ. 2015, 1, 10. [Google Scholar] [CrossRef]
- Jiang, L. Estimation of soil erosion in some sections of Lower Jinsha River based on RUSLE. Nat. Hazards 2015, 76, 1831–1847. [Google Scholar] [CrossRef]
- Zhou, Q. A soil erosion assessment of the upper Mekong River in Yunnan Province, China. Mt. Res. Dev. 2014, 34, 36–47. [Google Scholar] [CrossRef]
- Xie, H. A Bibliometric Analysis on Land Degradation: Current Status, Development, and Future Directions. Land 2020, 9, 28. [Google Scholar] [CrossRef] [Green Version]
- Chen, X. Effects of Soil and Water Conservation Measures on Runoff and Sediment Yield in Red Soil Slope Farmland under Natural Rainfall. Sustainability 2020, 12, 3417. [Google Scholar] [CrossRef] [Green Version]
- Nicu, I.C. Is overgrazing really influencing soil erosion? Water 2018, 10, 1077. [Google Scholar] [CrossRef] [Green Version]
- Frankl, A. The success of recent land management efforts to reduce soil erosion in northern France. Geomorphology 2018, 303, 84–93. [Google Scholar] [CrossRef]
- Fernandes, P. Integrating road traffic externalities through a sustainability indicator. Sci. Total Environ. 2019, 691, 483–498. [Google Scholar] [CrossRef]
- Belay, H.T. Erosion Risk Potential Assessment Using GIS and RS for Soil and Water Resource Conservation Plan: The Case of Yisir Watershed, Northwestern Ethiopia. Agric. Fish. 2020, 9, 1. [Google Scholar]
- Lal, P.; Prakash, A.; Prasad, A. Assessment of Yearly Soil Erosion of Ranchi District using RUSLE Integrating Geo Informatics Approach. i-Manag. J. Future Eng. Technol. 2019, 15, 54. [Google Scholar]
- Bhattarai, R.; Dutta, D. Estimation of soil erosion and sediment yield using GIS at catchment scale. Water Resour. Manag. 2007, 21, 1635–1647. [Google Scholar] [CrossRef]
- Ballabio, C. Mapping monthly rainfall erosivity in Europe. Sci. Total Environ. 2017, 579, 1298–1315. [Google Scholar] [CrossRef] [Green Version]
- Özşahin, E.; Eroğlu, İ. Soil Erosion Risk Assessment due to Land Use/Land Cover Changes(LULCC) in Bulgaria From 1990 to 2015. Alinteri J. Agric. Sci. 2019, 34, 1–8. [Google Scholar]
- Morgan, R.P.C.; Davidson, D.A. Soil Erosion and Conservation; Longman Group: London, UK, 1991. [Google Scholar]
- Stanchi, S.; Falsone, G.; Bonifacio, E. Soil aggregation, erodibility, and erosion rates in mountain soils (NW Alps, Italy). Solid Earth 2015, 6, 403–414. [Google Scholar] [CrossRef] [Green Version]
- Nasir, A.; Uchida, K.; Ashraf, M. Estimation of soil erosion by using RUSLE and GIS for small mountainous watersheds in Pakistan. Pak. J. Water Resour. (Pak.) 2006, 10, 11–21. [Google Scholar]
- Julien, P.Y. Erosion and Sedimentation; Cambridge University Press: Cambridge, UK, 2010. [Google Scholar]
- Osinski, E. Operationalisation of a landscape-oriented indicator. Agric. Ecosyst. Environ. 2003, 98, 371–386. [Google Scholar] [CrossRef]
- Farhan, Y.; Nawaiseh, S. Spatial assessment of soil erosion risk using RUSLE and GIS techniques. Environ. Earth Sci. 2015, 74, 4649–4669. [Google Scholar] [CrossRef]
- Van Rompaey, A.J.; Bazzoff, P.; Jones, R.; Montanarella, L.; Govers, G. Validation of soil erosion risk assessments in Italy. In European Commission, Joint Research Centre; Office for Official Publications of the European Communities: Luxembourg, 2003. [Google Scholar]
- Bathrellos, G.D. Suitability estimation for urban development using multi-hazard assessment map. Sci. Total Environ. 2017, 575, 119–134. [Google Scholar] [CrossRef] [PubMed]


| Sr. No | Land Cover | C-factor |
|---|---|---|
| 1 | Bare area | 1 |
| 2 | Rangeland/natural herbs and shrubs | 0.7 |
| 3 | Crop in the flood plain | 0.28 |
| 4 | Forest natural trees | 0.004 |
| 5 | Built-up areas | 0 |
| 6 | Wet areas | 0 |
| Sr. No | Soil Type | K-Factor |
|---|---|---|
| 1 | Calcareous clayey soil | 0.1 |
| 2 | Calcareous loamy and clayey soil | 0.2 |
| 3 | Mountainous land with nearly continuous | 0.2 |
| 4 | Non-calcareous loamy soil | 0.33 |
| 5 | Rough broken land | 0.4 |
| 6 | Water and seasonally flooded soil | 0.4 |
| 7 | Calcareous silty soil–gullied land complex | 0.4 |
| Soil Erosion Severity Class | Soil Loss (tons/h/year) | Total Area (ha) | Area (%) |
|---|---|---|---|
| Very Low | <5 | 648,159 | 43 |
| Low | 5–10 | 180,882 | 12 |
| Moderate | 10–20 | 316,543 | 21 |
| High | 20–50 | 241,175 | 16 |
| Very High | >50 | 120,588 | 8 |
© 2020 by the authors. Licensee MDPI, Basel, Switzerland. This article is an open access article distributed under the terms and conditions of the Creative Commons Attribution (CC BY) license (http://creativecommons.org/licenses/by/4.0/).
Share and Cite
Maqsoom, A.; Aslam, B.; Hassan, U.; Kazmi, Z.A.; Sodangi, M.; Tufail, R.F.; Farooq, D. Geospatial Assessment of Soil Erosion Intensity and Sediment Yield Using the Revised Universal Soil Loss Equation (RUSLE) Model. ISPRS Int. J. Geo-Inf. 2020, 9, 356. https://0-doi-org.brum.beds.ac.uk/10.3390/ijgi9060356
Maqsoom A, Aslam B, Hassan U, Kazmi ZA, Sodangi M, Tufail RF, Farooq D. Geospatial Assessment of Soil Erosion Intensity and Sediment Yield Using the Revised Universal Soil Loss Equation (RUSLE) Model. ISPRS International Journal of Geo-Information. 2020; 9(6):356. https://0-doi-org.brum.beds.ac.uk/10.3390/ijgi9060356
Chicago/Turabian StyleMaqsoom, Ahsen, Bilal Aslam, Usman Hassan, Zaheer Abbas Kazmi, Mahmoud Sodangi, Rana Faisal Tufail, and Danish Farooq. 2020. "Geospatial Assessment of Soil Erosion Intensity and Sediment Yield Using the Revised Universal Soil Loss Equation (RUSLE) Model" ISPRS International Journal of Geo-Information 9, no. 6: 356. https://0-doi-org.brum.beds.ac.uk/10.3390/ijgi9060356