Geointelligence against Illegal Deforestation and Timber Laundering in the Brazilian Amazon


Abstract
:1. Introduction
2. Literature Review
3. Objectives, Materials and Methodology
3.1. Objectives
- Evaluate how the use of GEOINT based on medium resolution imagery can be used on understanding the real situation of forest exploitation in areas authorized by the government in the Brazilian Amazon; and
- Verify if the PMFS of MSA are being carried out in compliance with the respective environmental standards, being truly sustainable, or whether laundering the timber illegally extracted from other areas.
3.2. Materials
- Satellite imagery: multispectral Landsat 5 and 8 with a spatial resolution of 30 m made available to the public by the United States Geological Survey (USGS) [30];
- Geospatial information: polygons and other vector data of PMFS from the State of Amazonas Environmental Agency (Instituto de Proteção Ambiental do Amazonas, IPAAM) [31], protected areas (indigenous lands and national parks), roads, rivers, municipal boundaries, etc. from Chico Mendes Institute (Instituto Chico Mendes, ICMBio and National Indigenous People Foundation (Fundação Nacional do Índio, FUNAI) [32,33,34,35];
- Collateral materials:
- Data from the RADAM Project (Projeto Radar da Amazônia), a very comprehensive official collection of forest inventories, with species and respective volumes for approximately 2130 collection points, duly georeferenced, throughout the Brazilian Amazon made available to the public by the Brazilian Institute of Geography and Statistics (Instituto Brasileiro de Geografia e Estatística, IBGE) [38];
- Identifying data for motor vehicles authorized to transport forest products in the Amazon as well as their carrying volume capacity from IBAMA [41]; and
- SisDOF data referring to all commercial timber transactions carried out between 2013 and 2018 from IBAMA [42].
3.3. Methodology
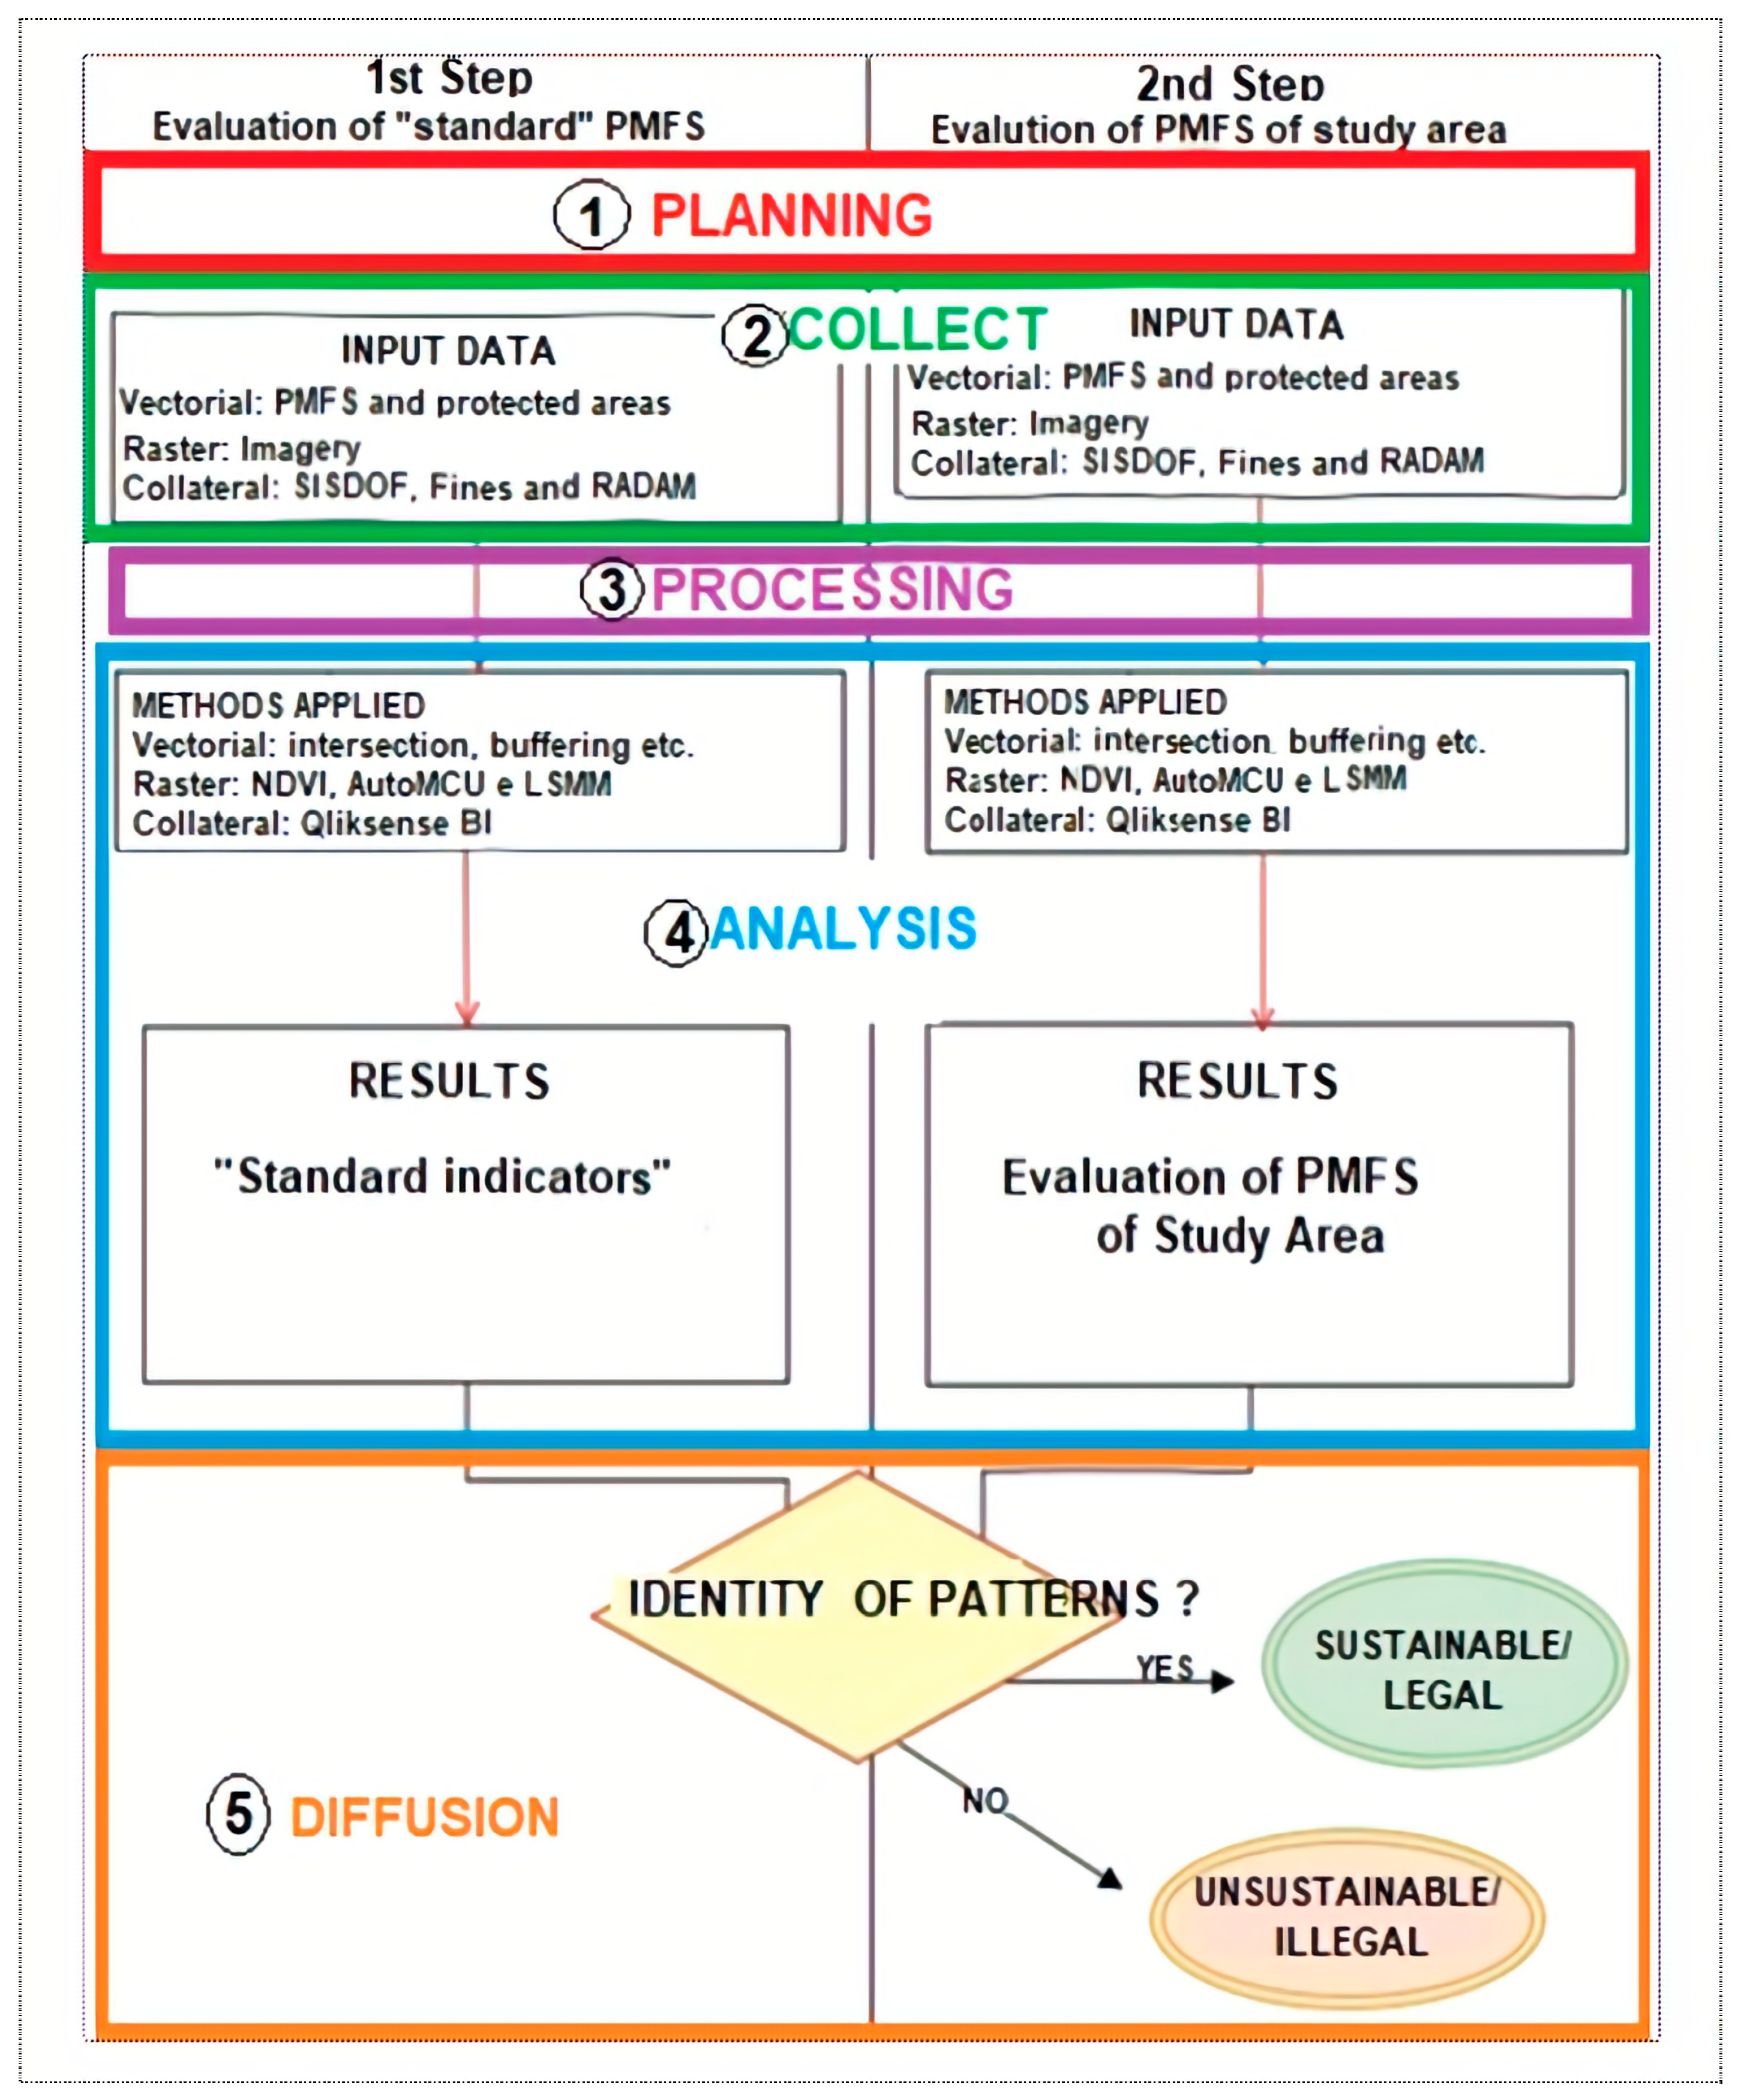
3.3.1. General Overview
- Planning phase (in red), composed in this case of the activities of definition of the standard PMFS and the study area as well as the data and resources necessary for the research;
- Collect phase (in green), consisting of the obtaining and initial validation of the data and resources necessary for the evaluation of the “standard” PMFS and the study area;
- Processing phase (in purple), consisting of the definition of tools and methods to be applied to each of the datasets (spatial and non-spatial) as well as the creation of the definitive dataset;
- Analysis phase (in blue), consisting of the integrated analysis of the data obtained and prepared in the previous phases and its documentation for later evaluation and comparison of the results;
- Diffusion phase (in orange), consisting of the presentation of the information obtained and the respective conclusions.
3.3.2. Planning
- The PMFS area was planned to be exclusively exploited under the selective logging regime at a proportion of 2.5% per year, between 2002 and 2022;
- 100% of commercial trees in the area were inventoried and the PMFS, approved by environmental agencies, was duly designed to prevent overexploitation;
- In addition to inventorying commercial species, the company carried out an inventory of 0.5% of the area (1/200), one year before and one year after exploitation in order to understand the impact of logging on forest regeneration and species diversity.
- When settling in the region, the company came across about 50 families that already lived there, without, however, having the respective property titles. They were individuals who already lived there. The company chose to assign property rights to them instead of filing lawsuits to expel them. Most of these people were also employed at the company.
3.3.3. Data Collection
3.3.4. Processing
- RGB composition using ArcMap 10.7.1 software: the resulting (true or false color) composition allowed for a better discrimination by visual observation of the targets and facilitated their interpretation);
- Automated Monte Carlo Spectral Unmixing (MTCU) using CLASlite 3.3 software [52]: uses a spectral mixture model associated with a robust spectral library to generate fractions that represent the main biophysical components of the landscape existing in a pixel [19,53]. The tool allows: (i) correction of atmospheric effects; (ii) derivation of fraction images corresponding to photosynthetically active vegetation (PV), non-photosynthetic vegetation (NPV) and bare soil (S); and (iii) multitemporal comparison of images, identifying situations of deforestation and forest degradation between two or more images.
- Normalized Difference Vegetation Index (NDVI) [54] through ArcMap 10.7.1 software: obtained by the ratio of the difference in reflectance of near infrared (NIR) and red (R) by the sum of them. It results in an index with values between −1 and 1, where the presence of negative values or close to zero indicates the presence of areas of water or bare soil with little chlorophyll activity and thus low amount of vegetation; in turn, positive values indicate areas of vegetation.
- Linear Spectral Mixing Model (LSMM) using TerraAmazon 7.1.0 software. LSMM [55] allows for the estimation of the proportion of each component of the spectral mixture (soil, shadow, and vegetation), defining which one is the most representative within each pixel of the image. This is very useful in medium resolution images, especially because we there are three components radiating electromagnetic energy in the same pixel.
3.3.5. Analysis
4. Results
4.1. Preliminary Results Obtained during the Processing Phase
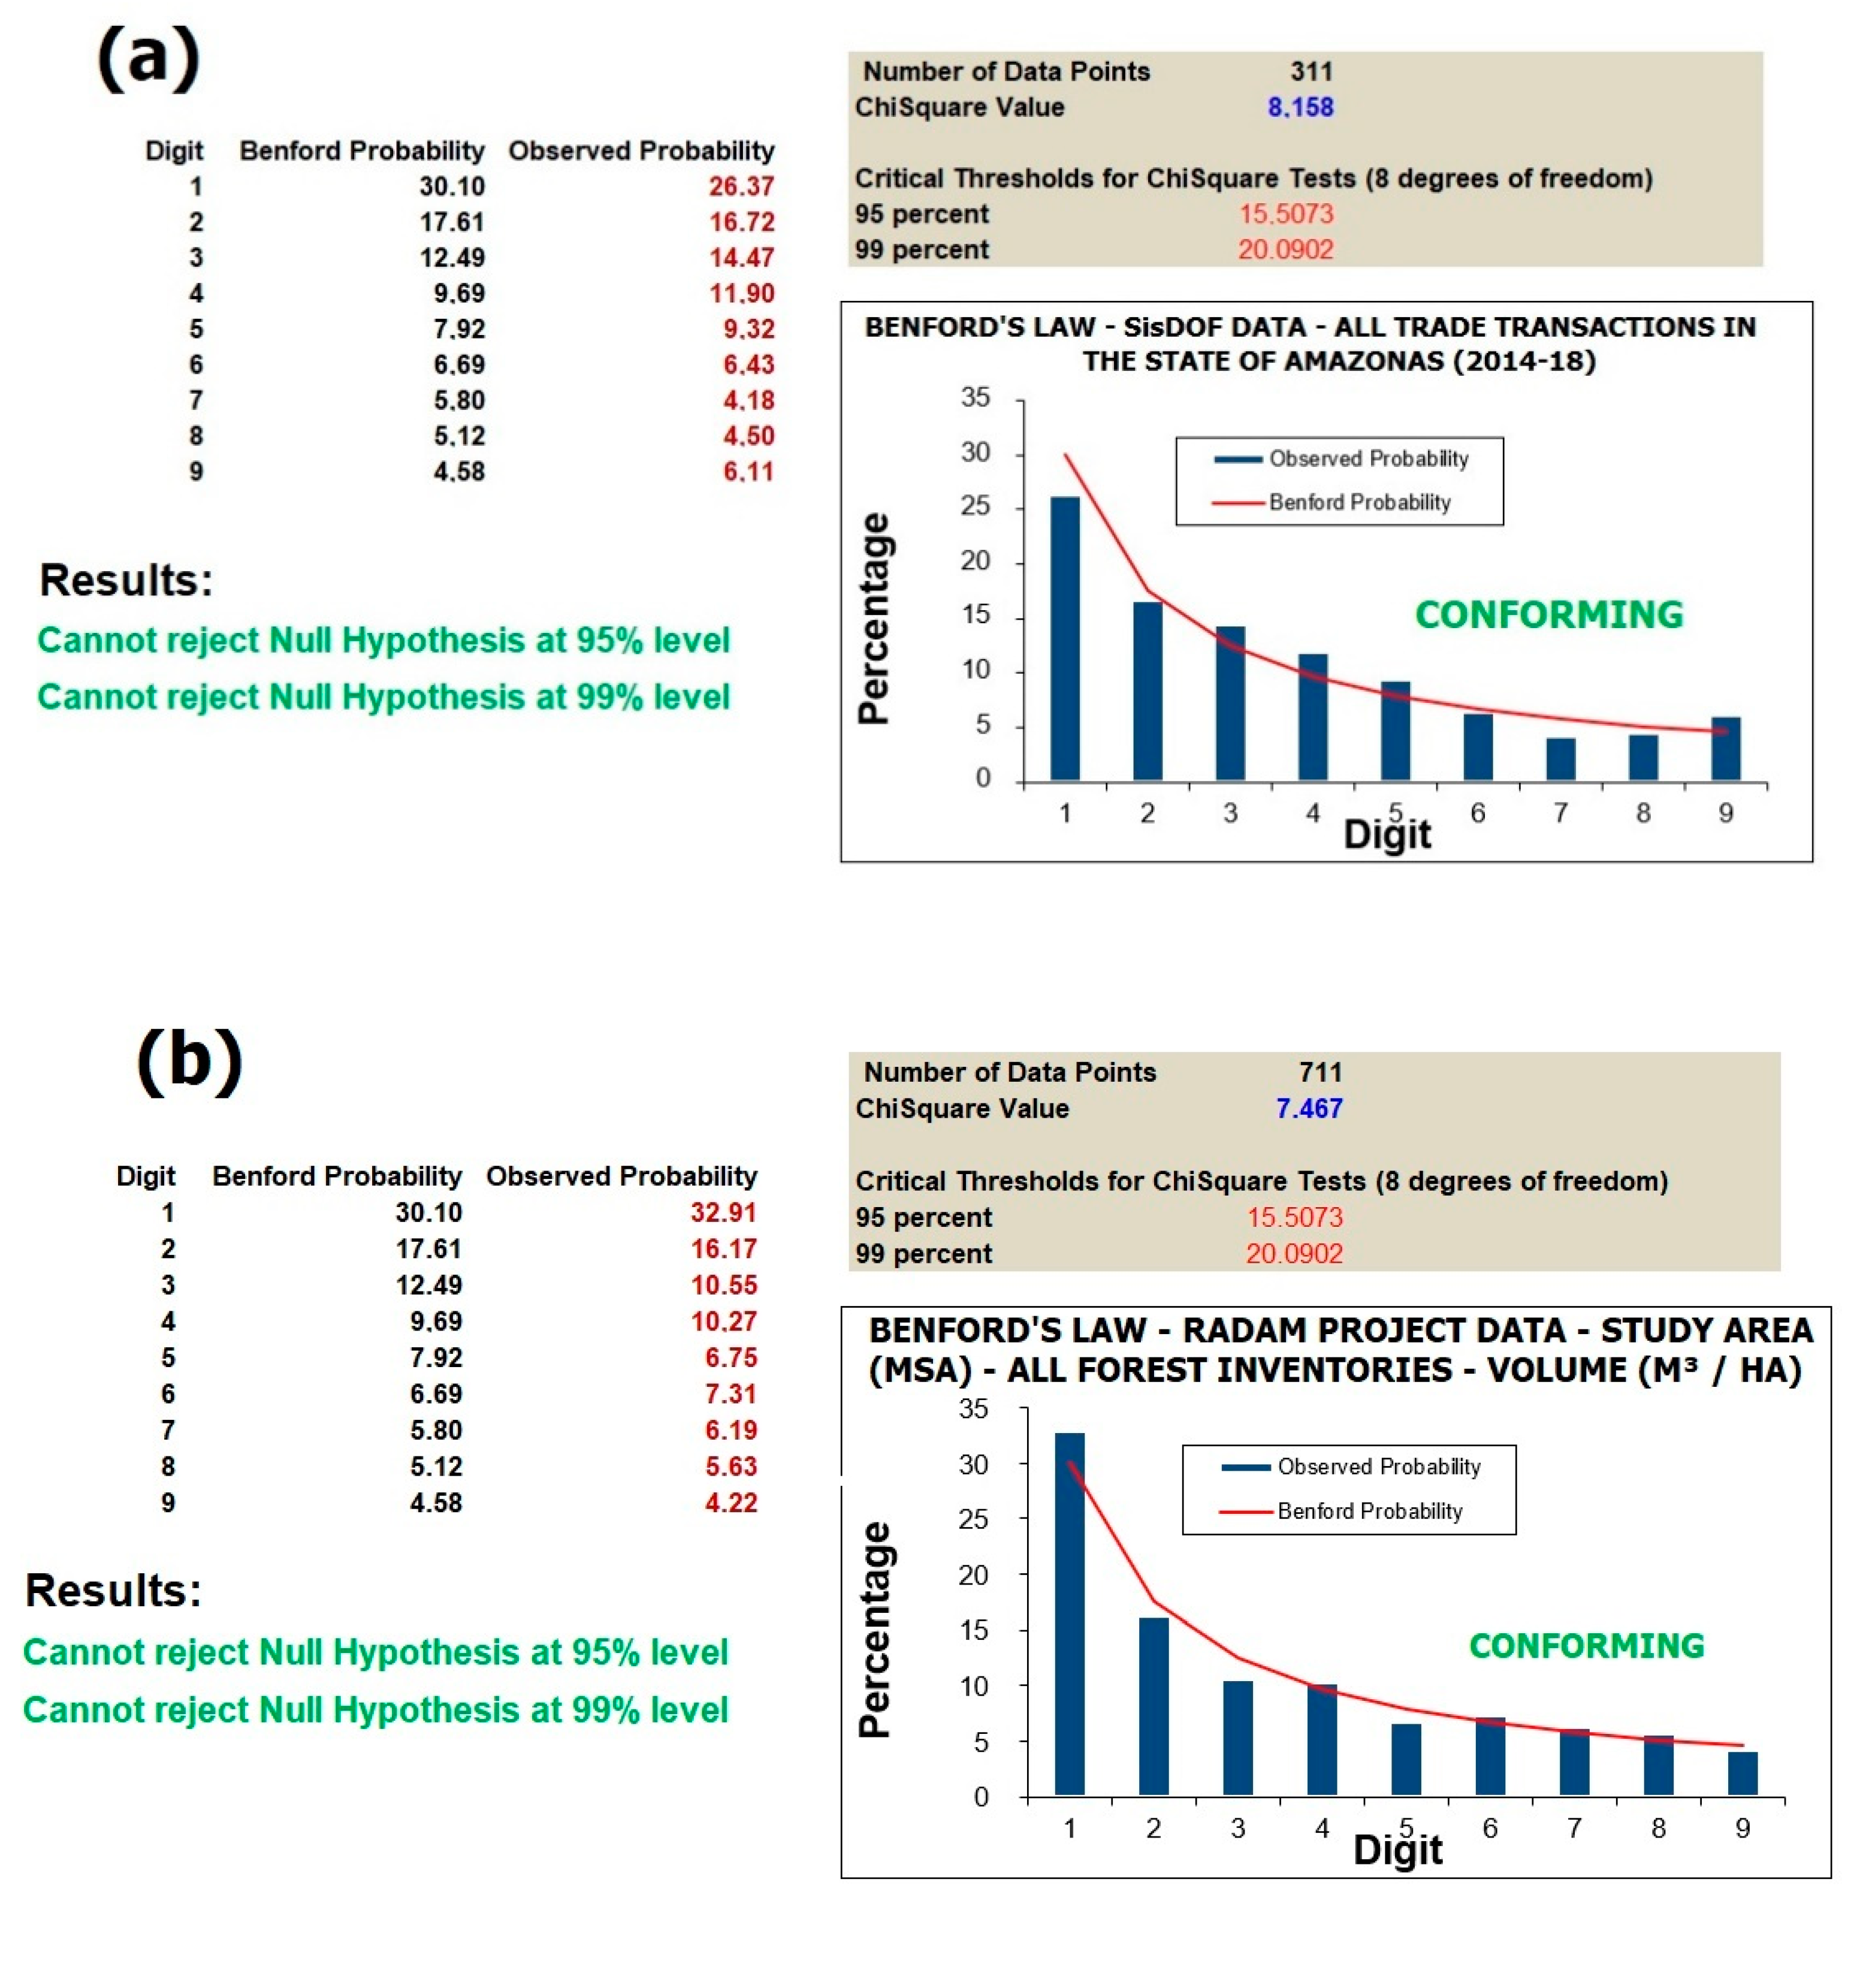
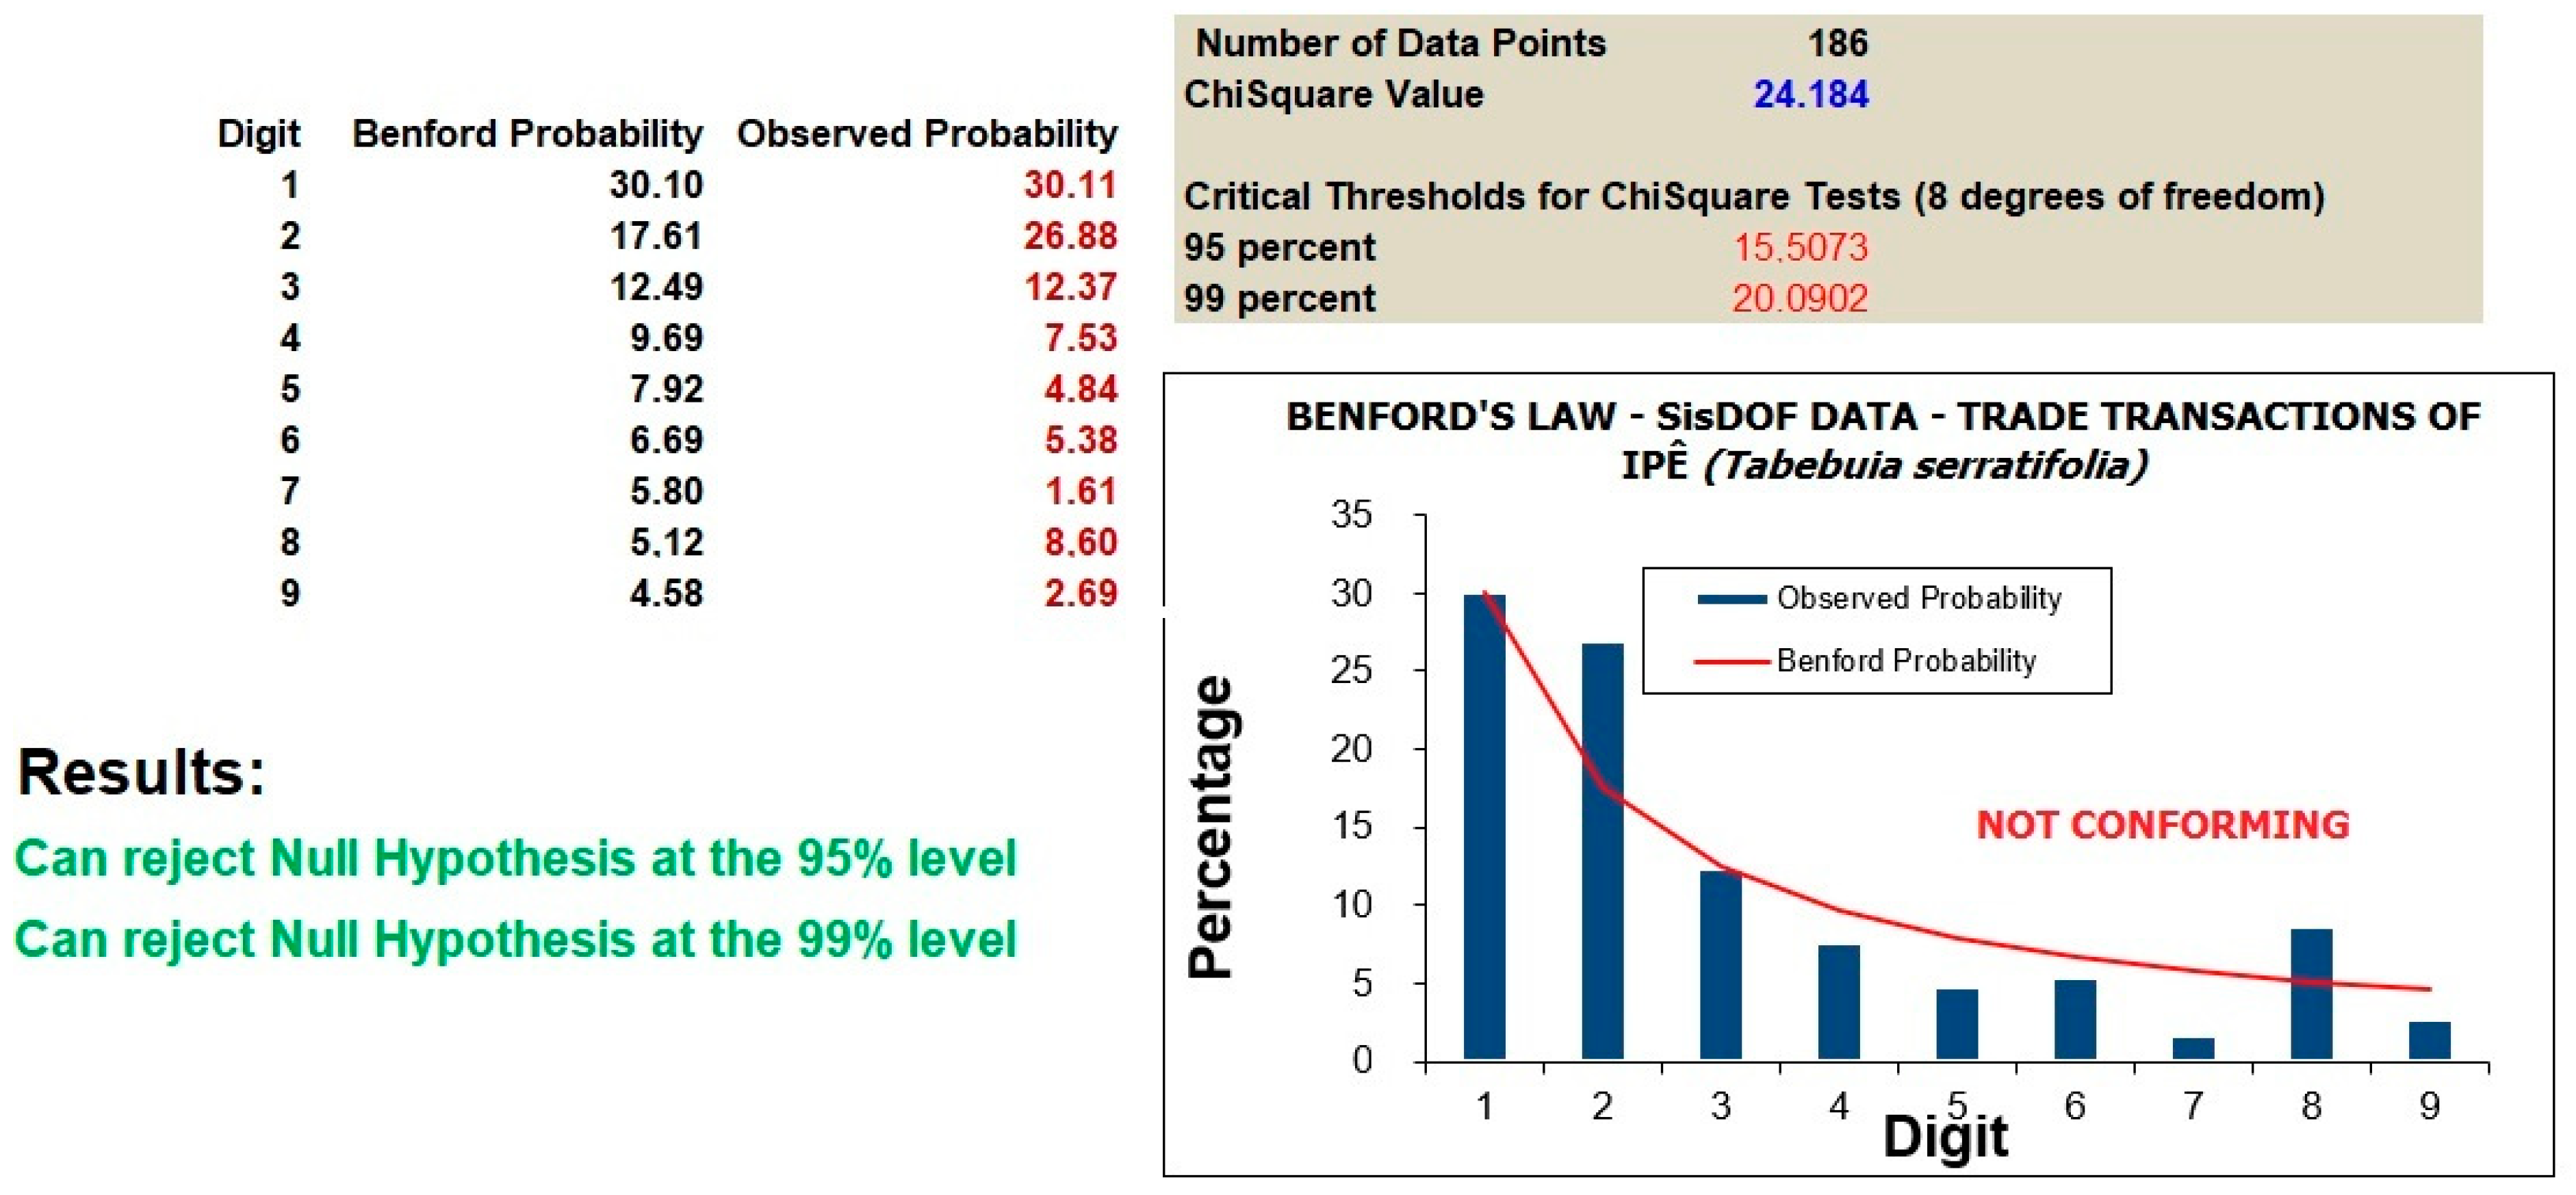
- The volumetric data of all transactions contained in SisDOF for the State of Amazonas for both the total volume by species as well as the total volume of species traded per hectare presented conformity with Benford’s law;
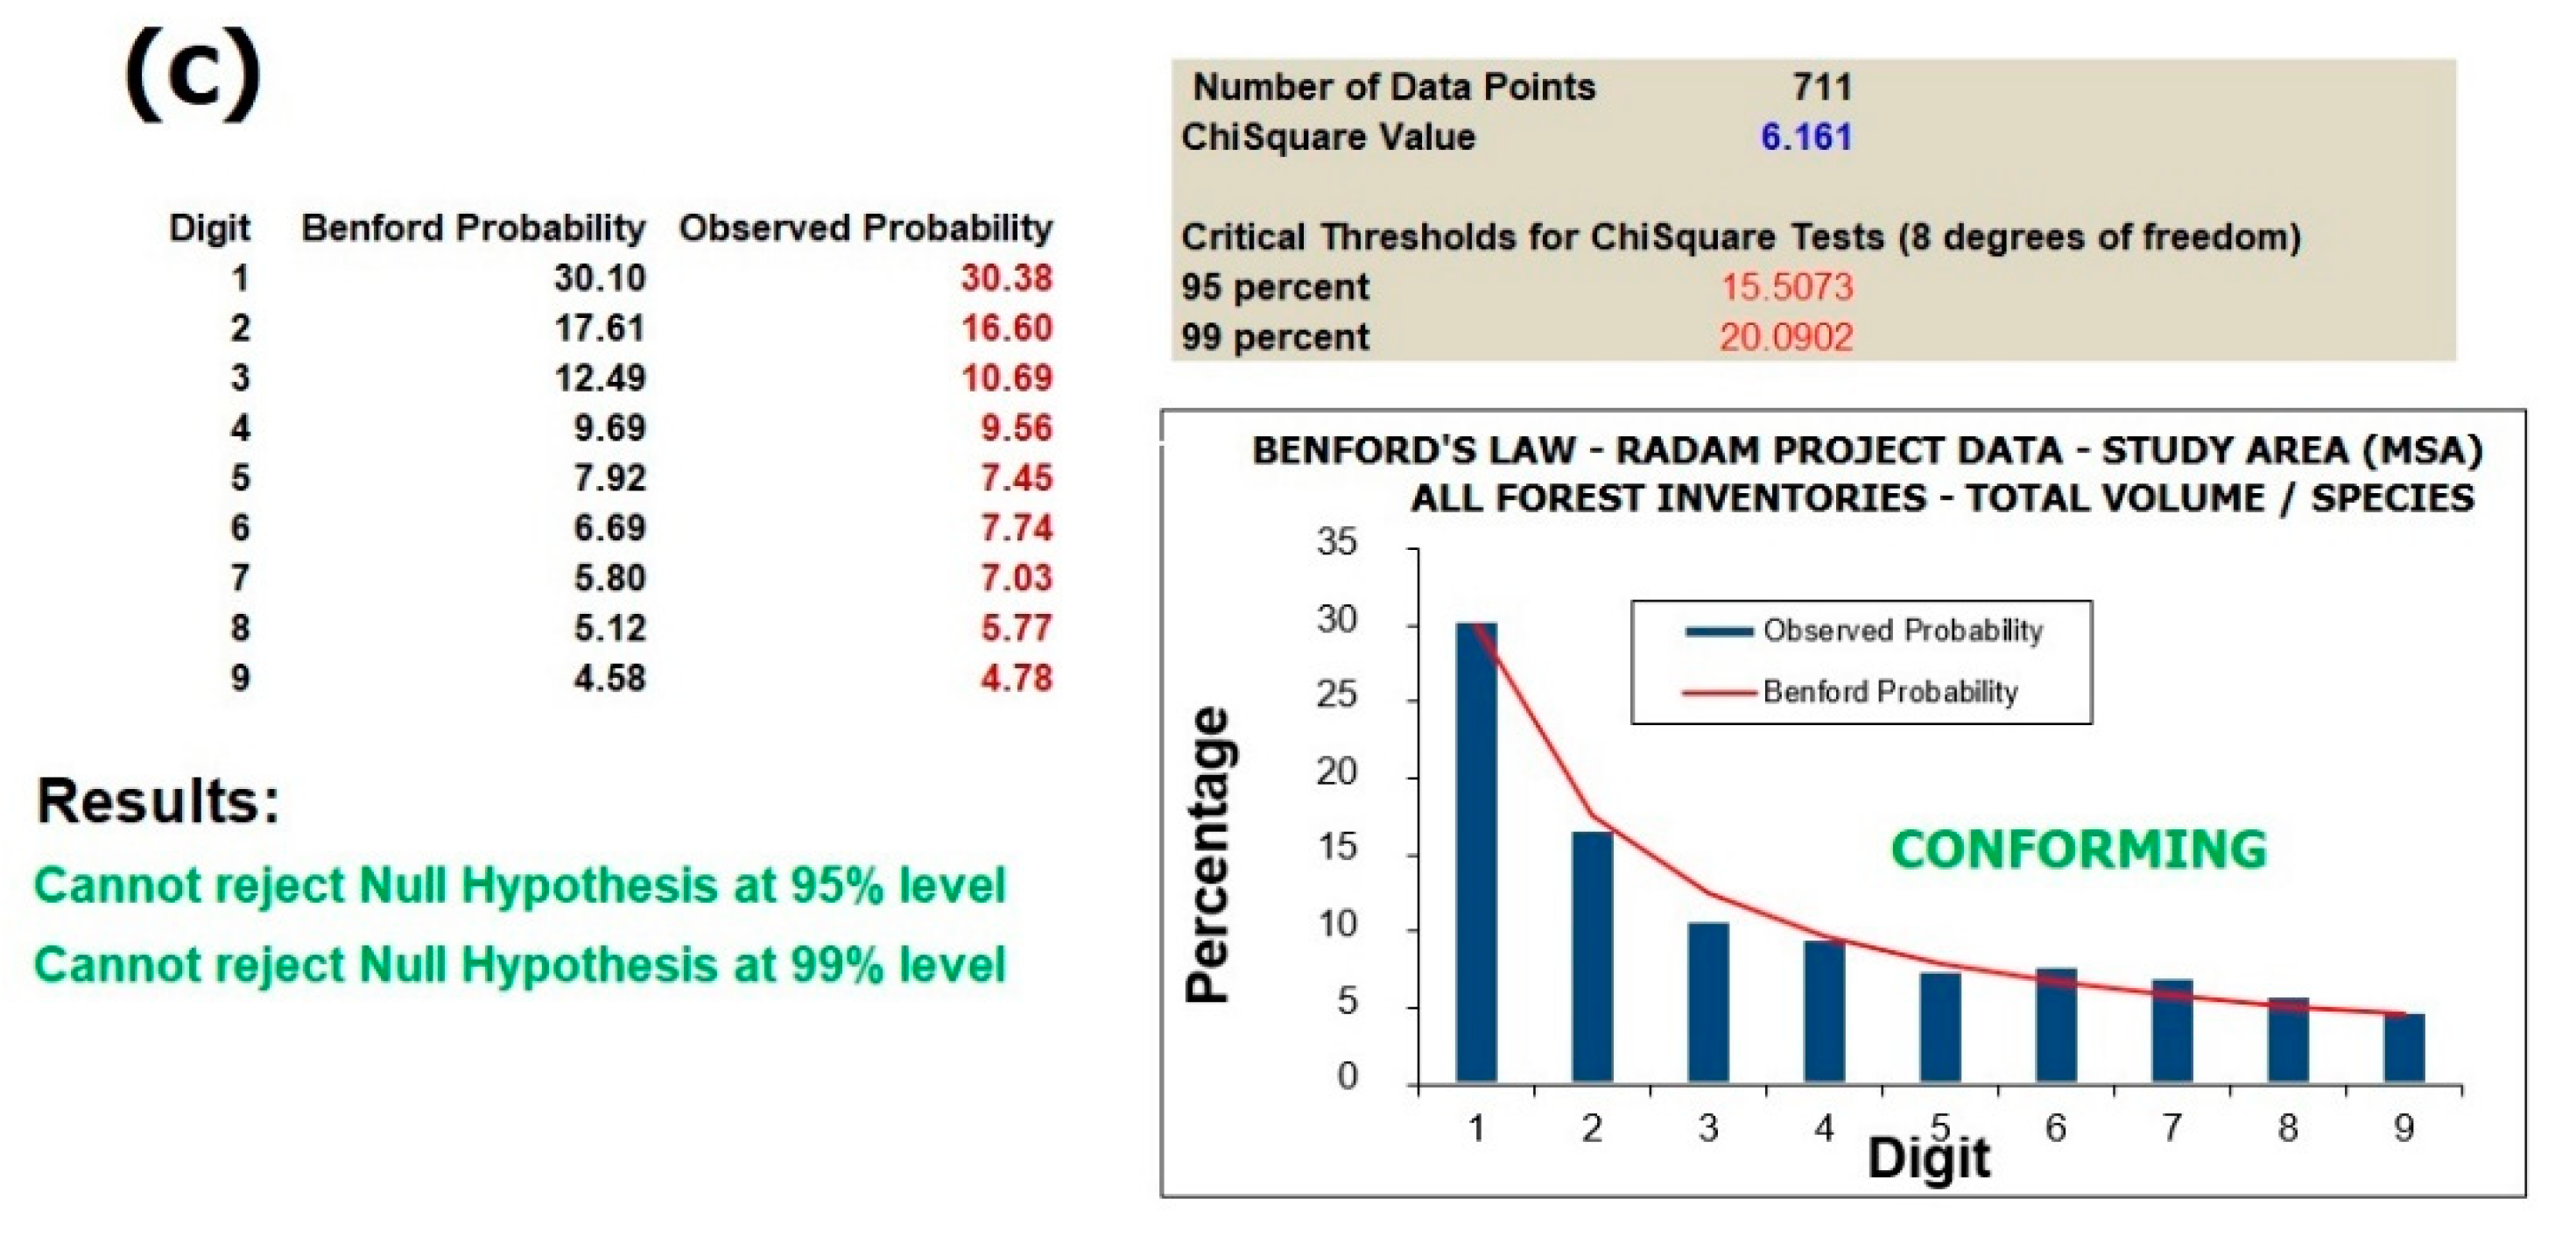
- The official volumetric data of the RADAM Project for both for total volume per species and total volume of species per hectare also showed conformity with the model;
- The sum of the “Diameter at Breast Height” (DBH) values of all individuals of the same species, per hectare, or totals for the entire study area also proved to be in conformity (RADAM volumetric data); and
- Changes in the data scale (daily, weekly, monthly, quarterly, half-yearly, or annual), did not significantly change the results obtained.
4.2. Analysis Results
4.2.1. Spatial Data
- (i)
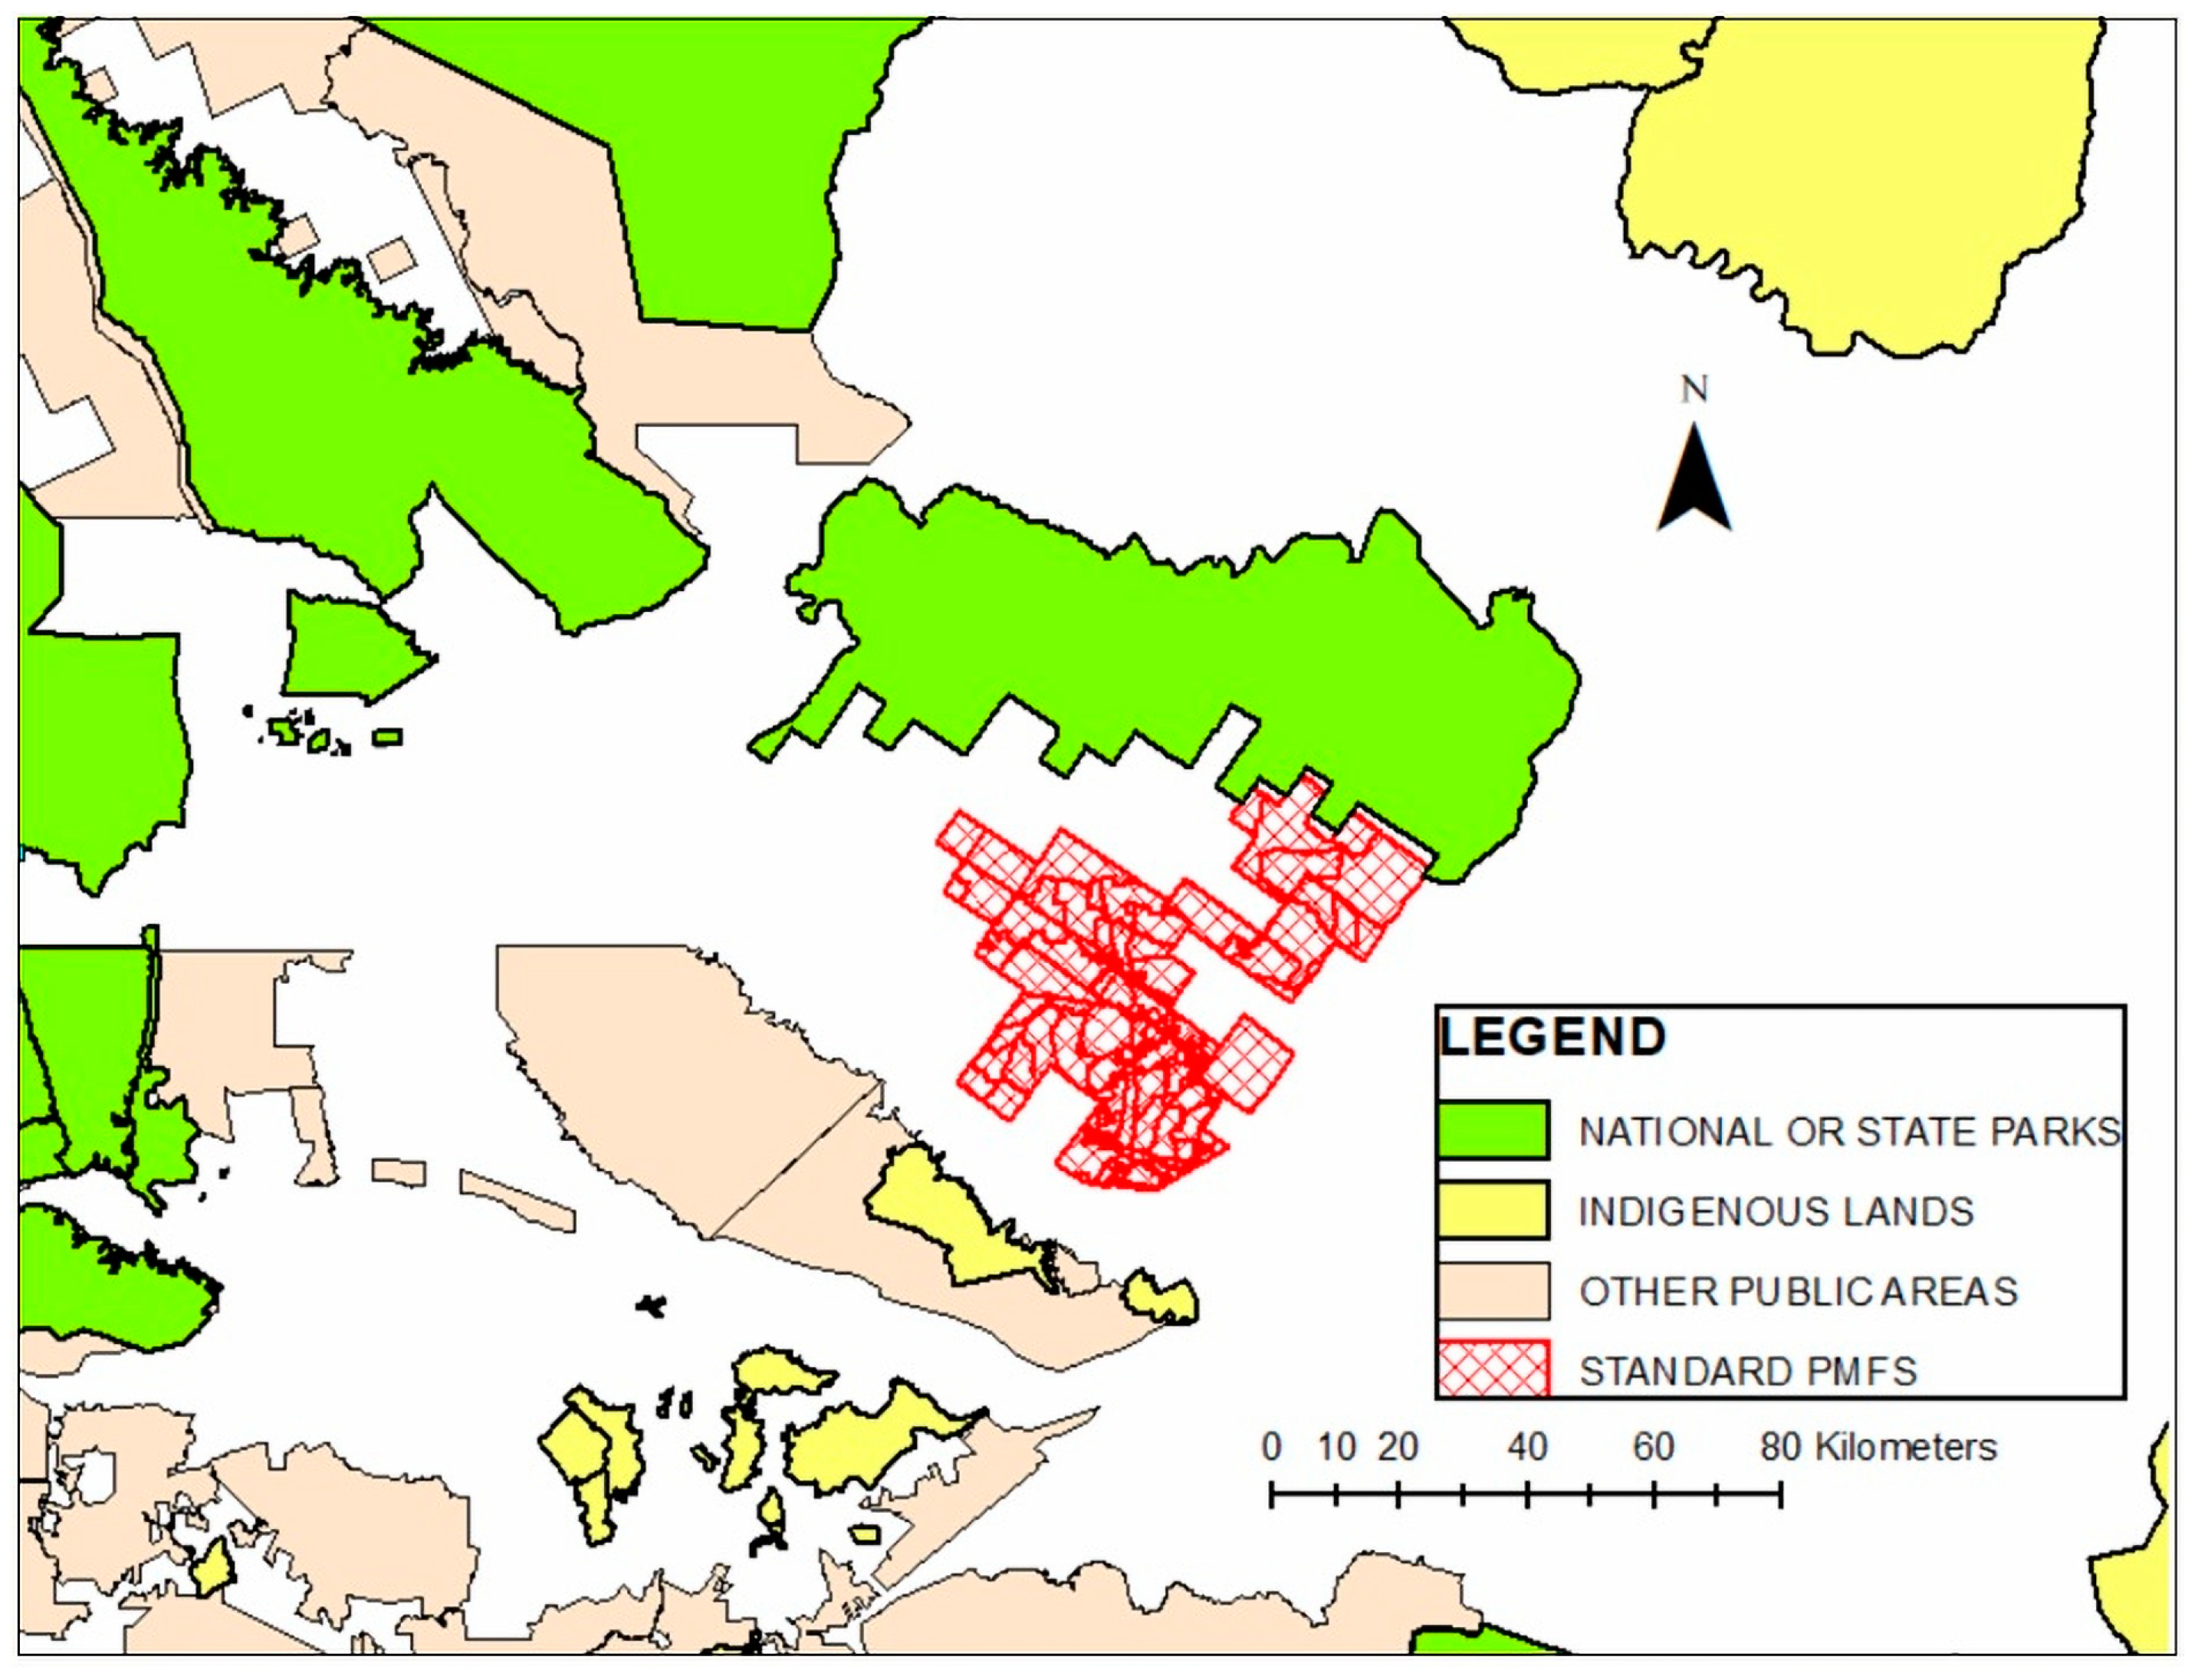
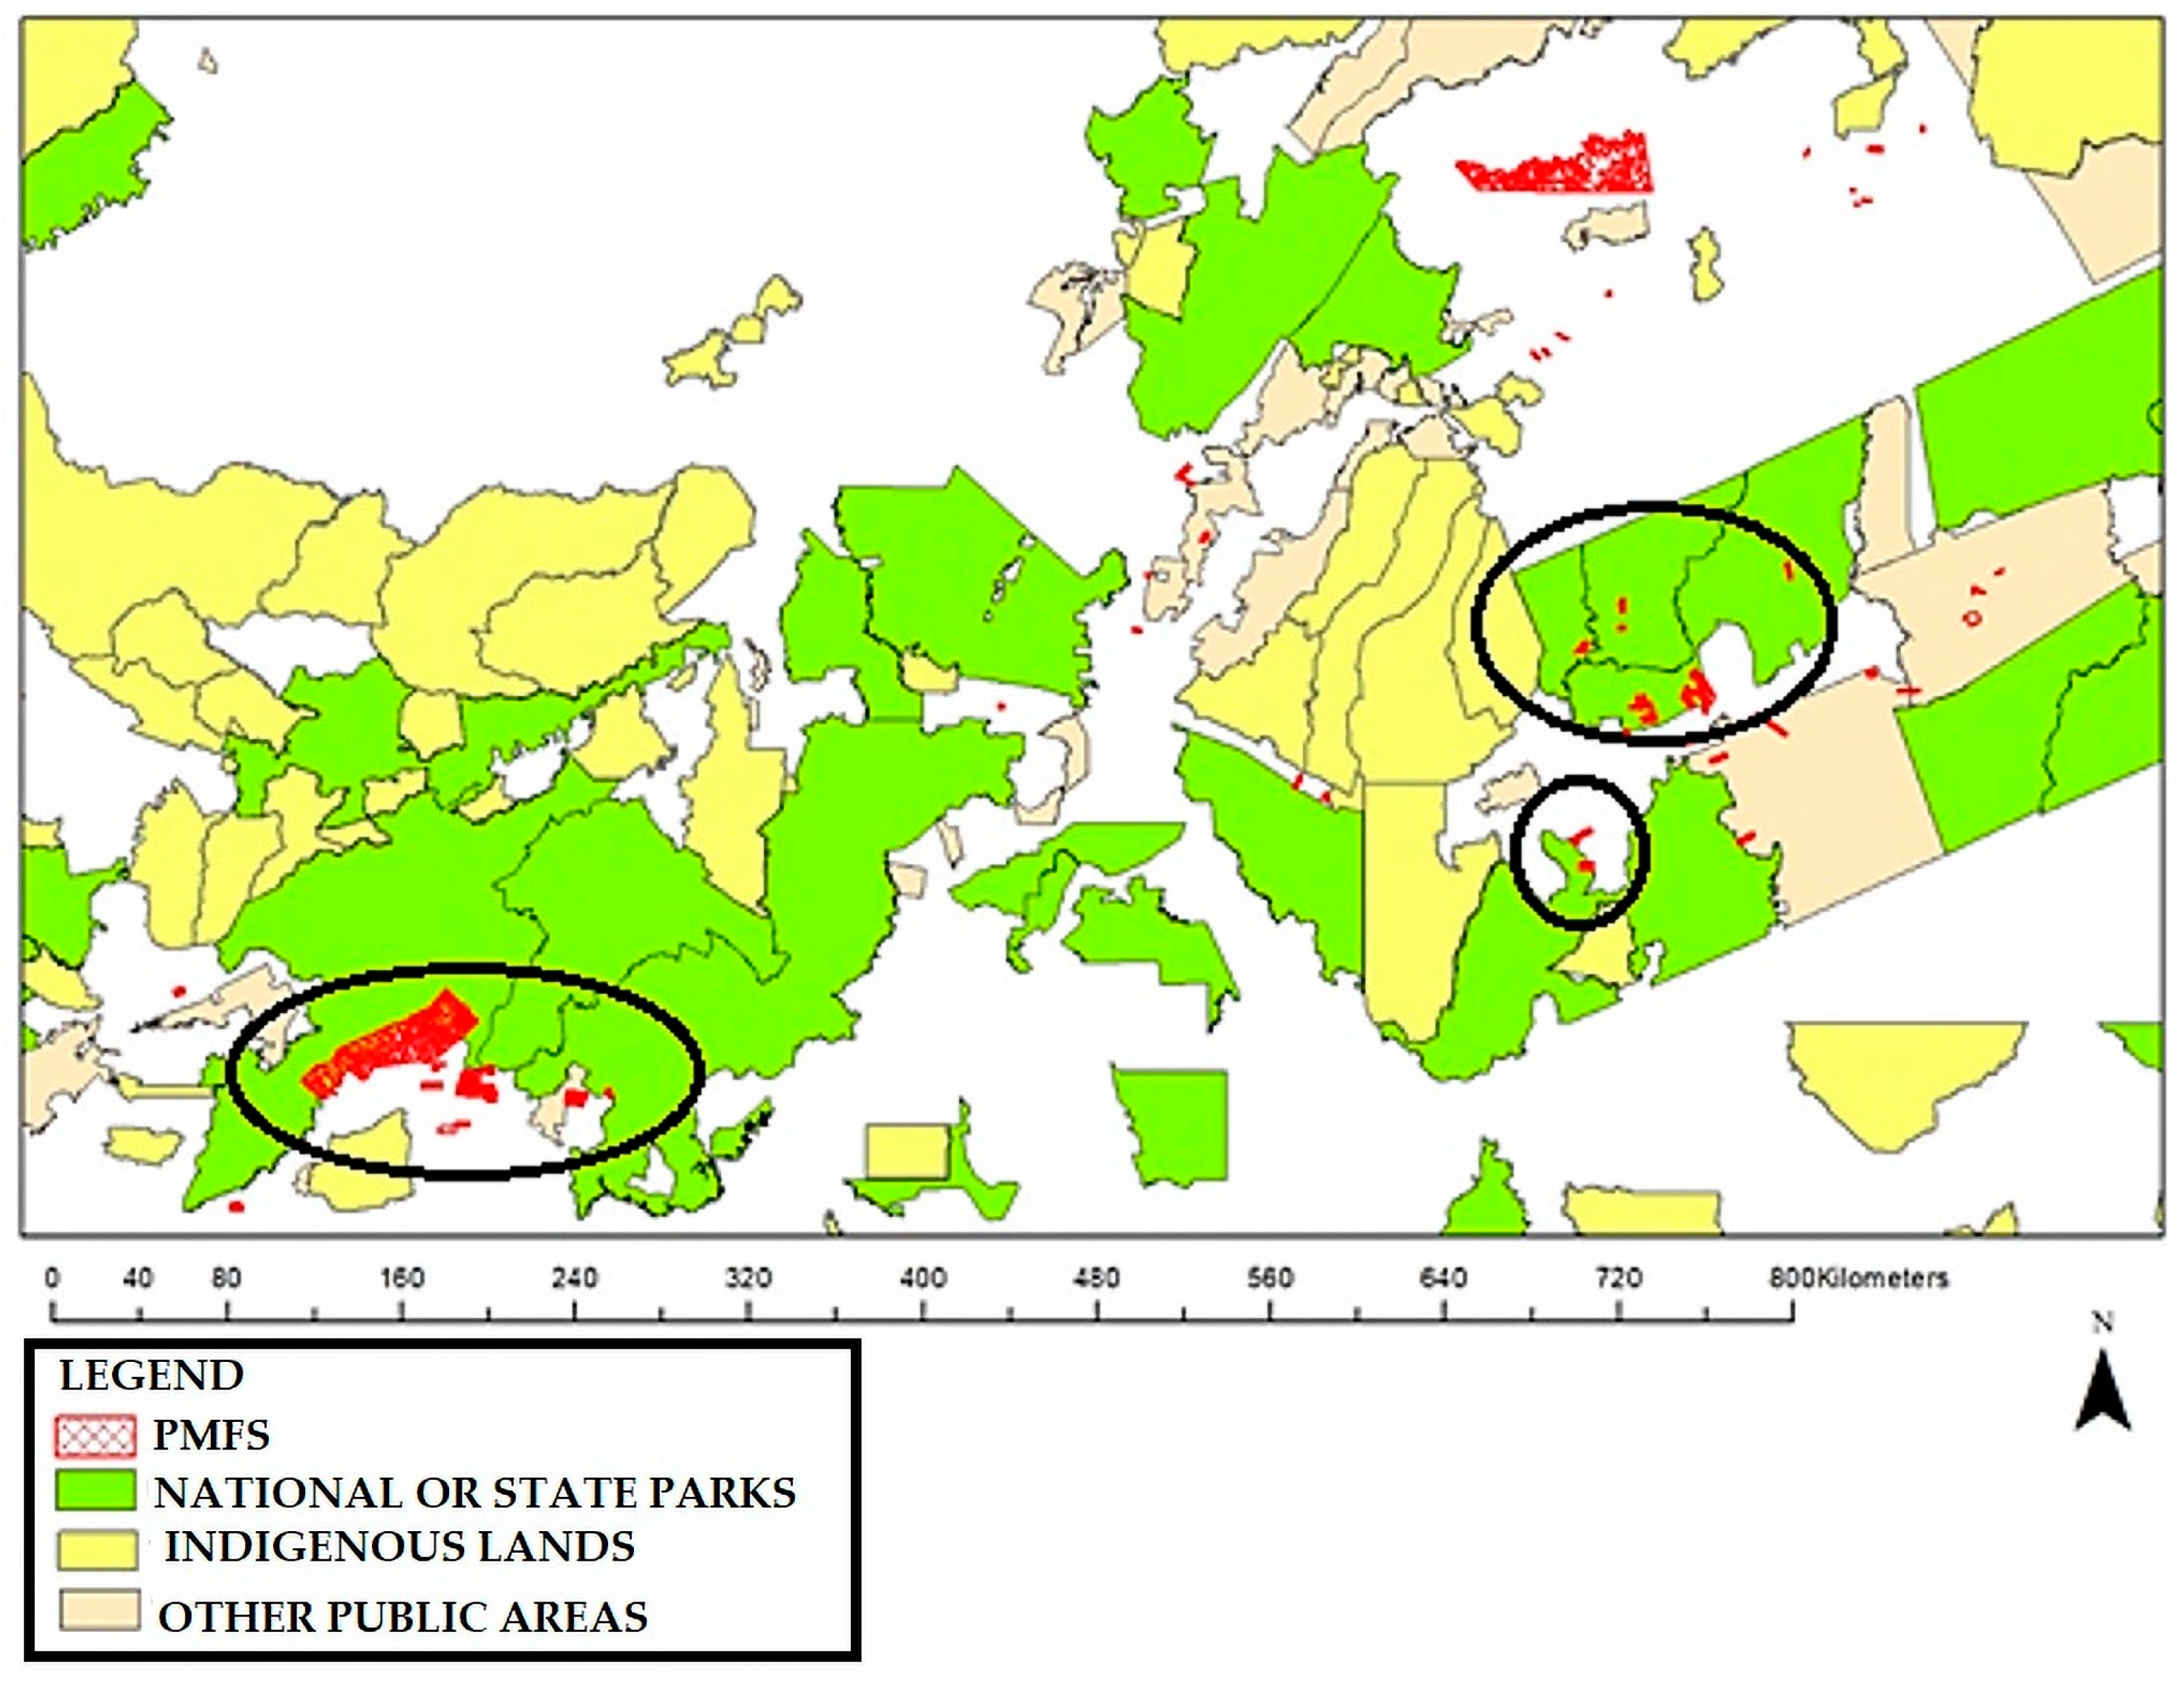
- Criterion 1.1—Total or partial overlap of the PMFS area with protected areasStandard PMFS: No overlapping of the standard PMFS with protected areas identified (Figure 13).MSA PMFS: 10% (8 PMFS) totally or partially inside National Forests (Figure 14). 06 PMFS (FIDs 107, 304, 124, 406, 159 and 1904) totally overlapped with National Forests. FIDs 1325 and 3826 had partial overlap. All these areas presented signs of exploitation what can indicate that overlapping was not just error in polygon creation, georeferencing, etc.
- (ii)
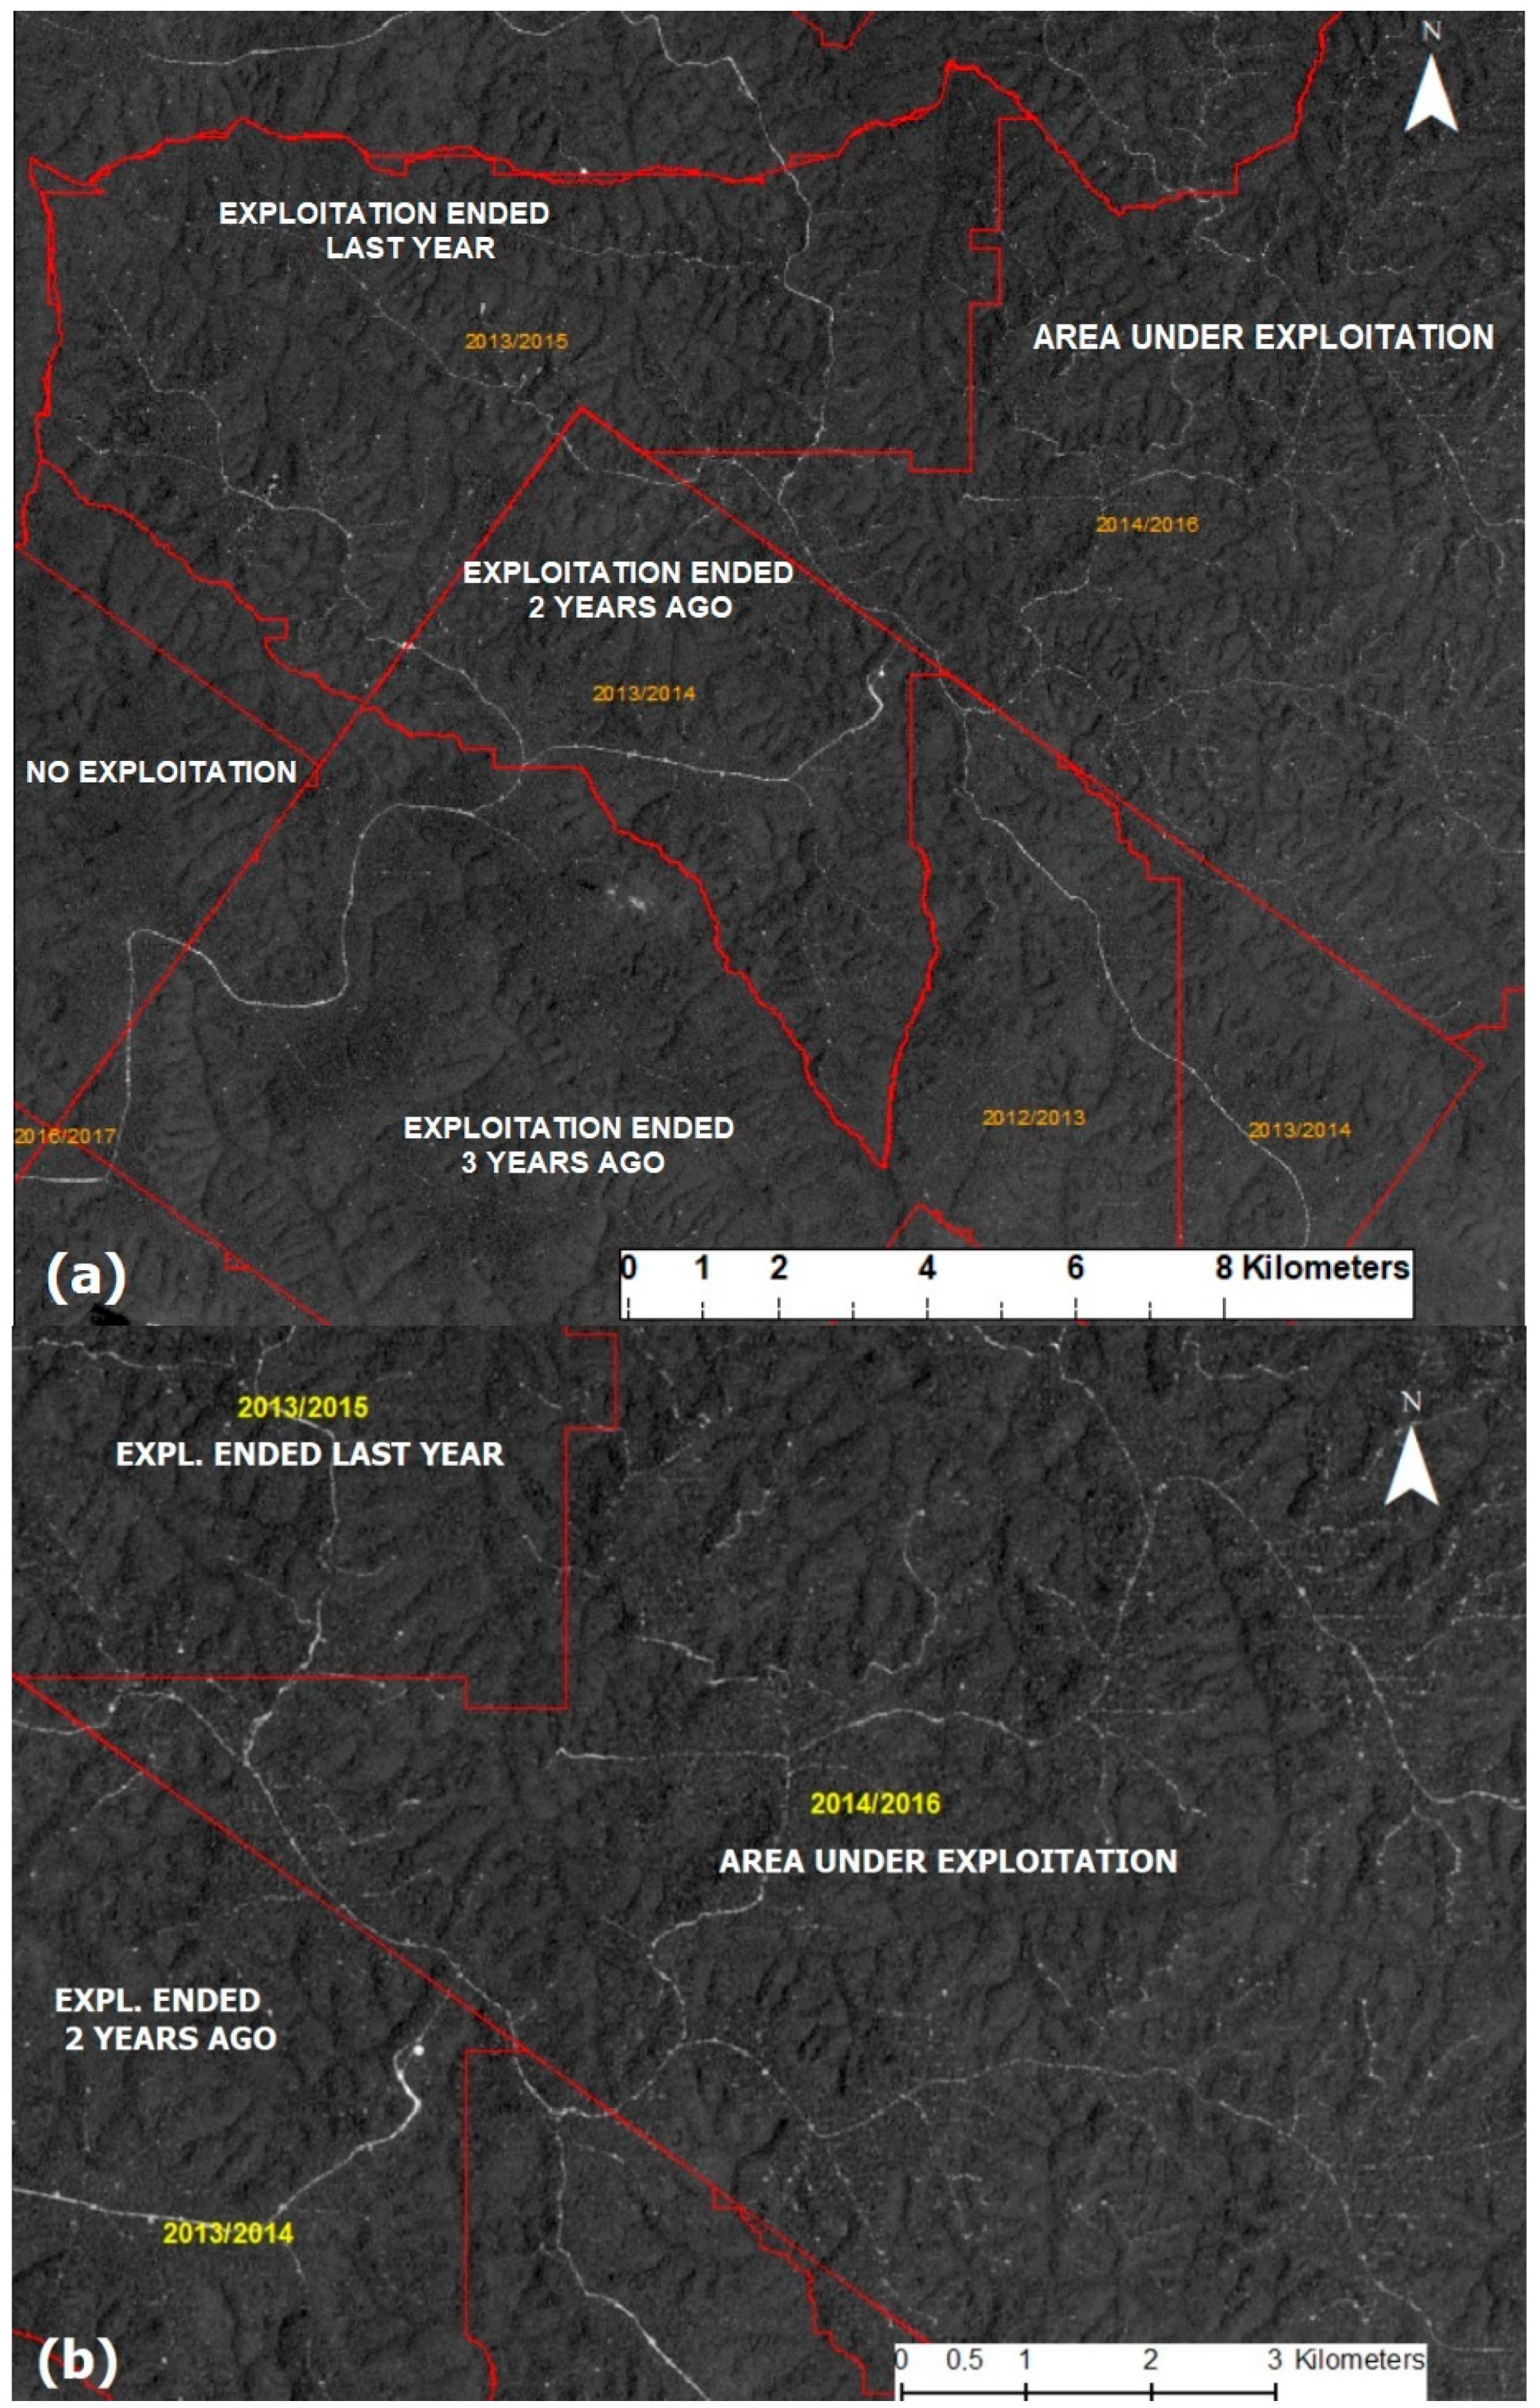
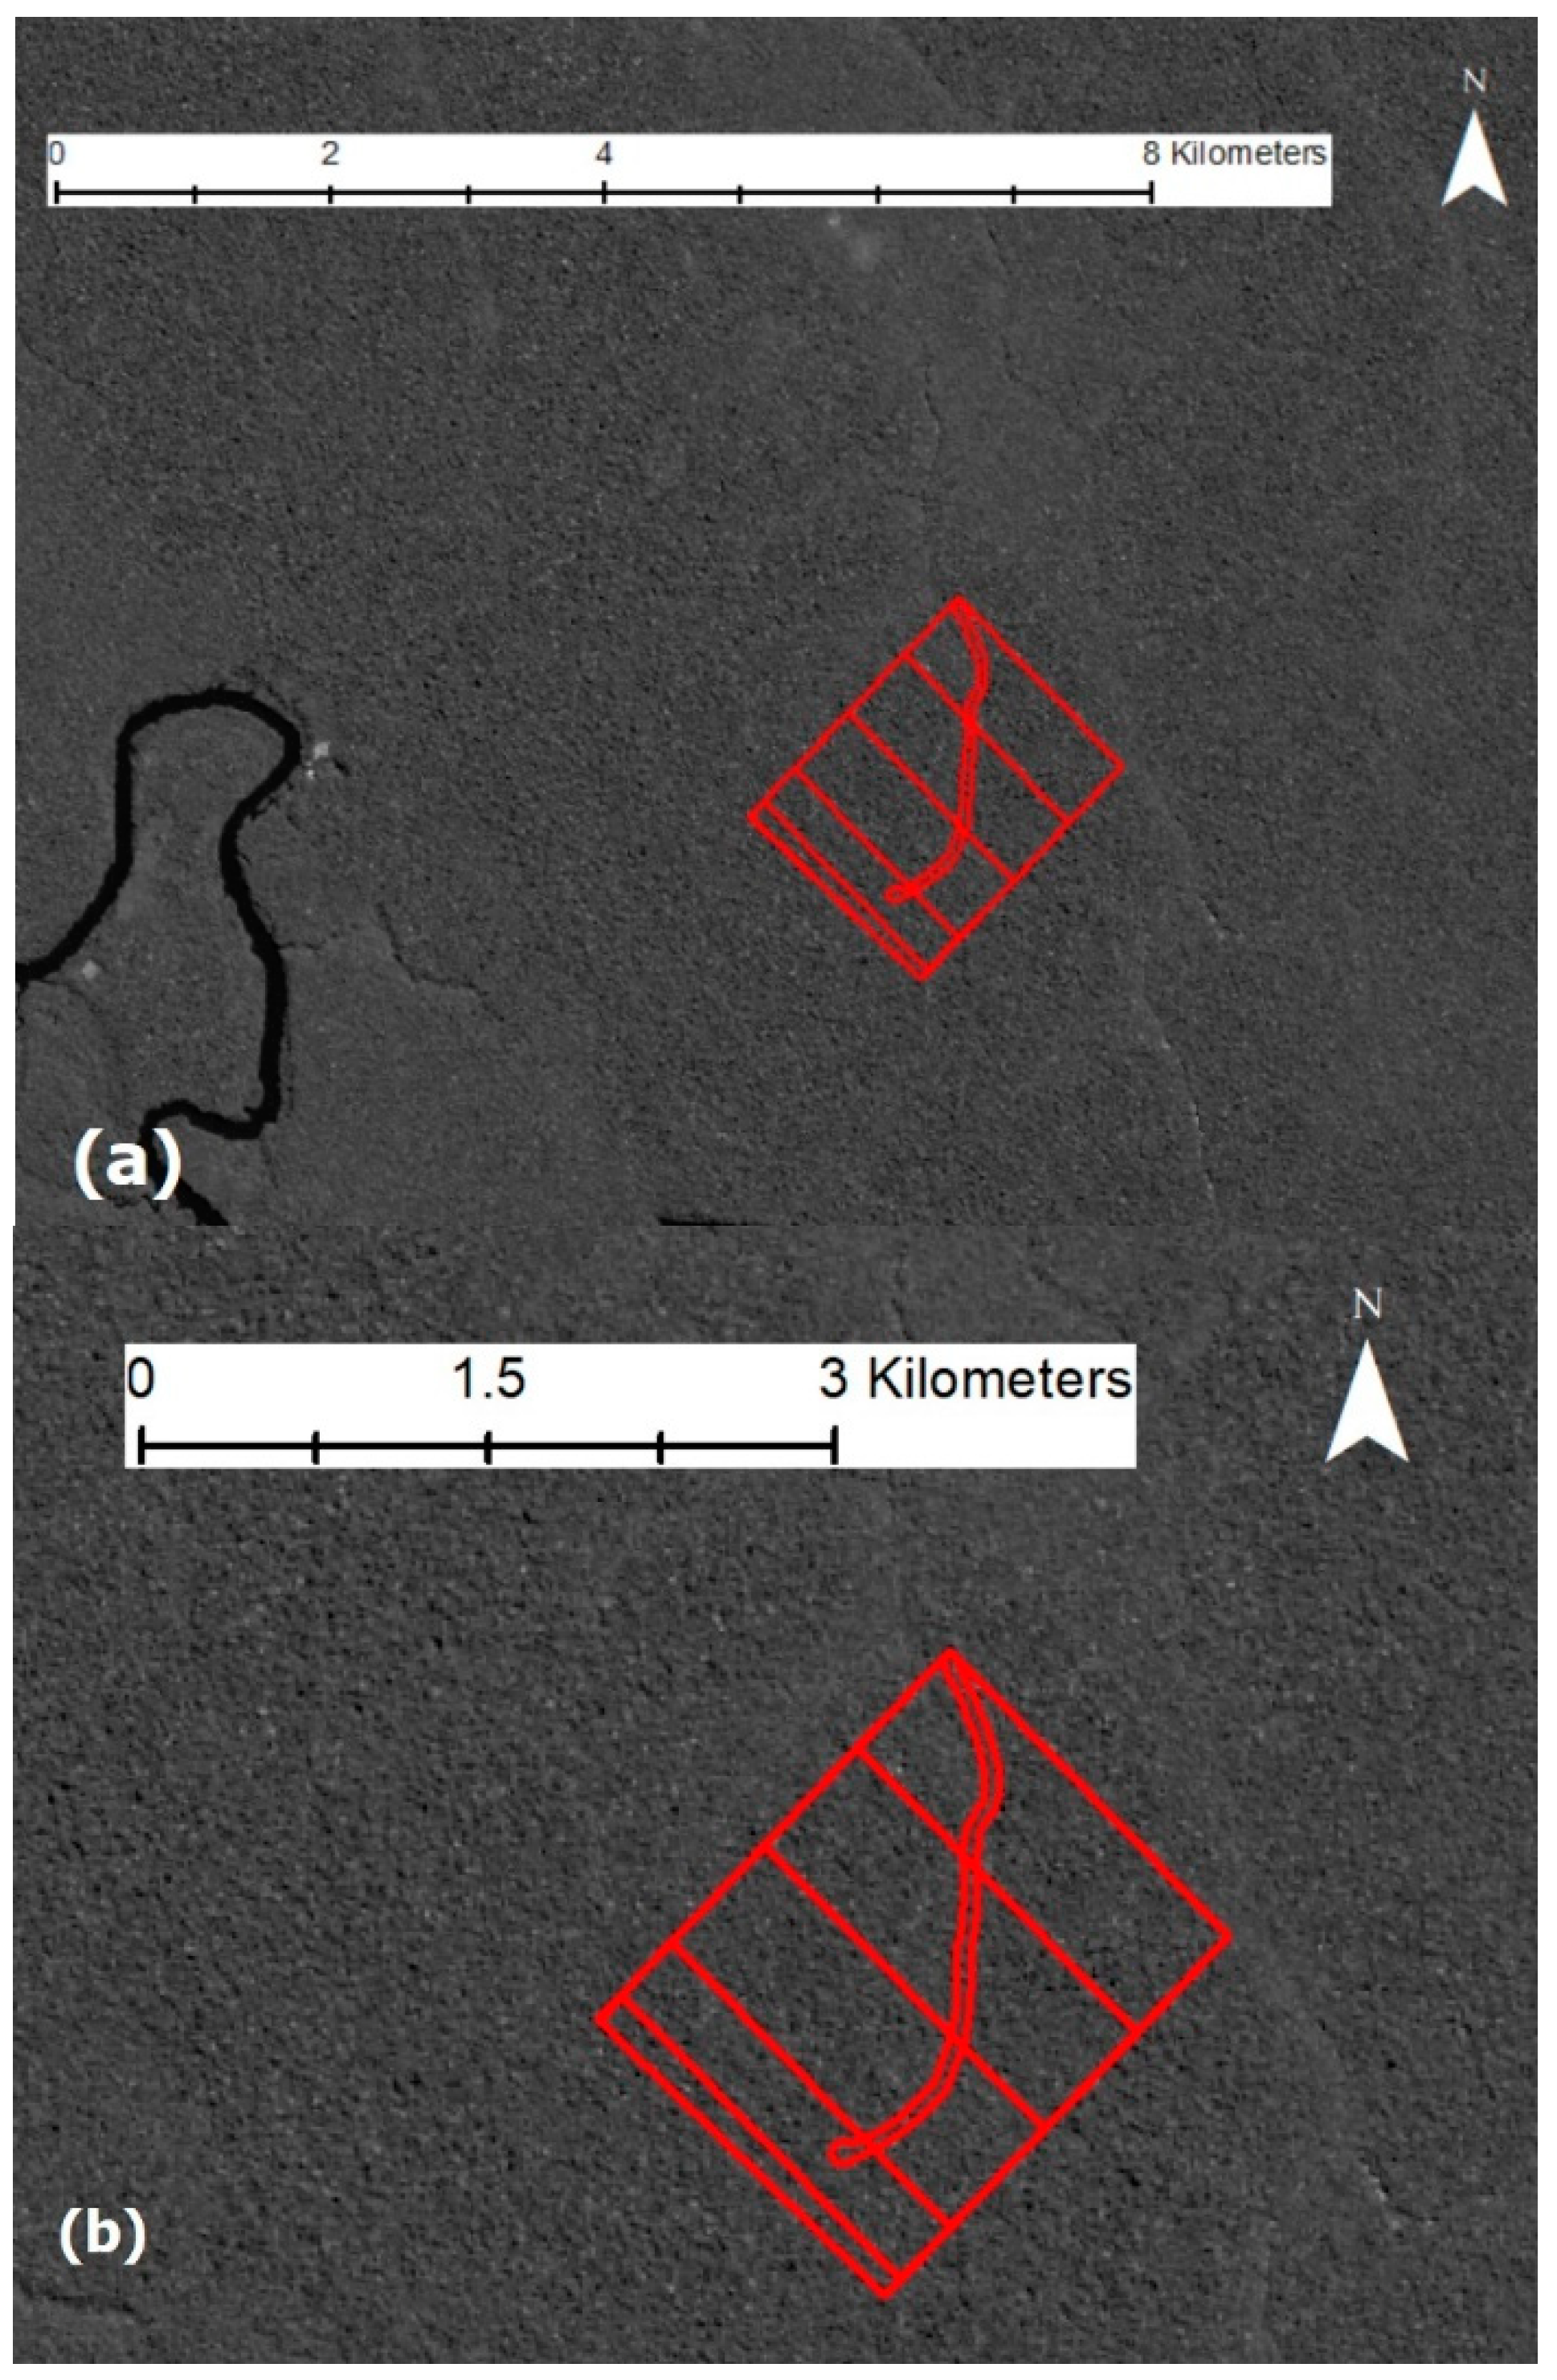
- Criterion 1.2—Lack of infrastructure compatible with PMFS (storage yards and roads)Standard PMFS: There are infrastructures of roads and yards in the standard PMFS during the effective exploitation (Figure 15).MSA PMFS: 20 PMFS (24% of the sample) had infrastructure incompatible with forest management practices, 10 referring to cases of no sign of yards and roads in the area and 10 referring to situations incompatible with PMFS and/or the volumes traded from these areas. Figure 16 shows complete absence of infrastructure and signs of selective logging inside PMFS.
- (iii)
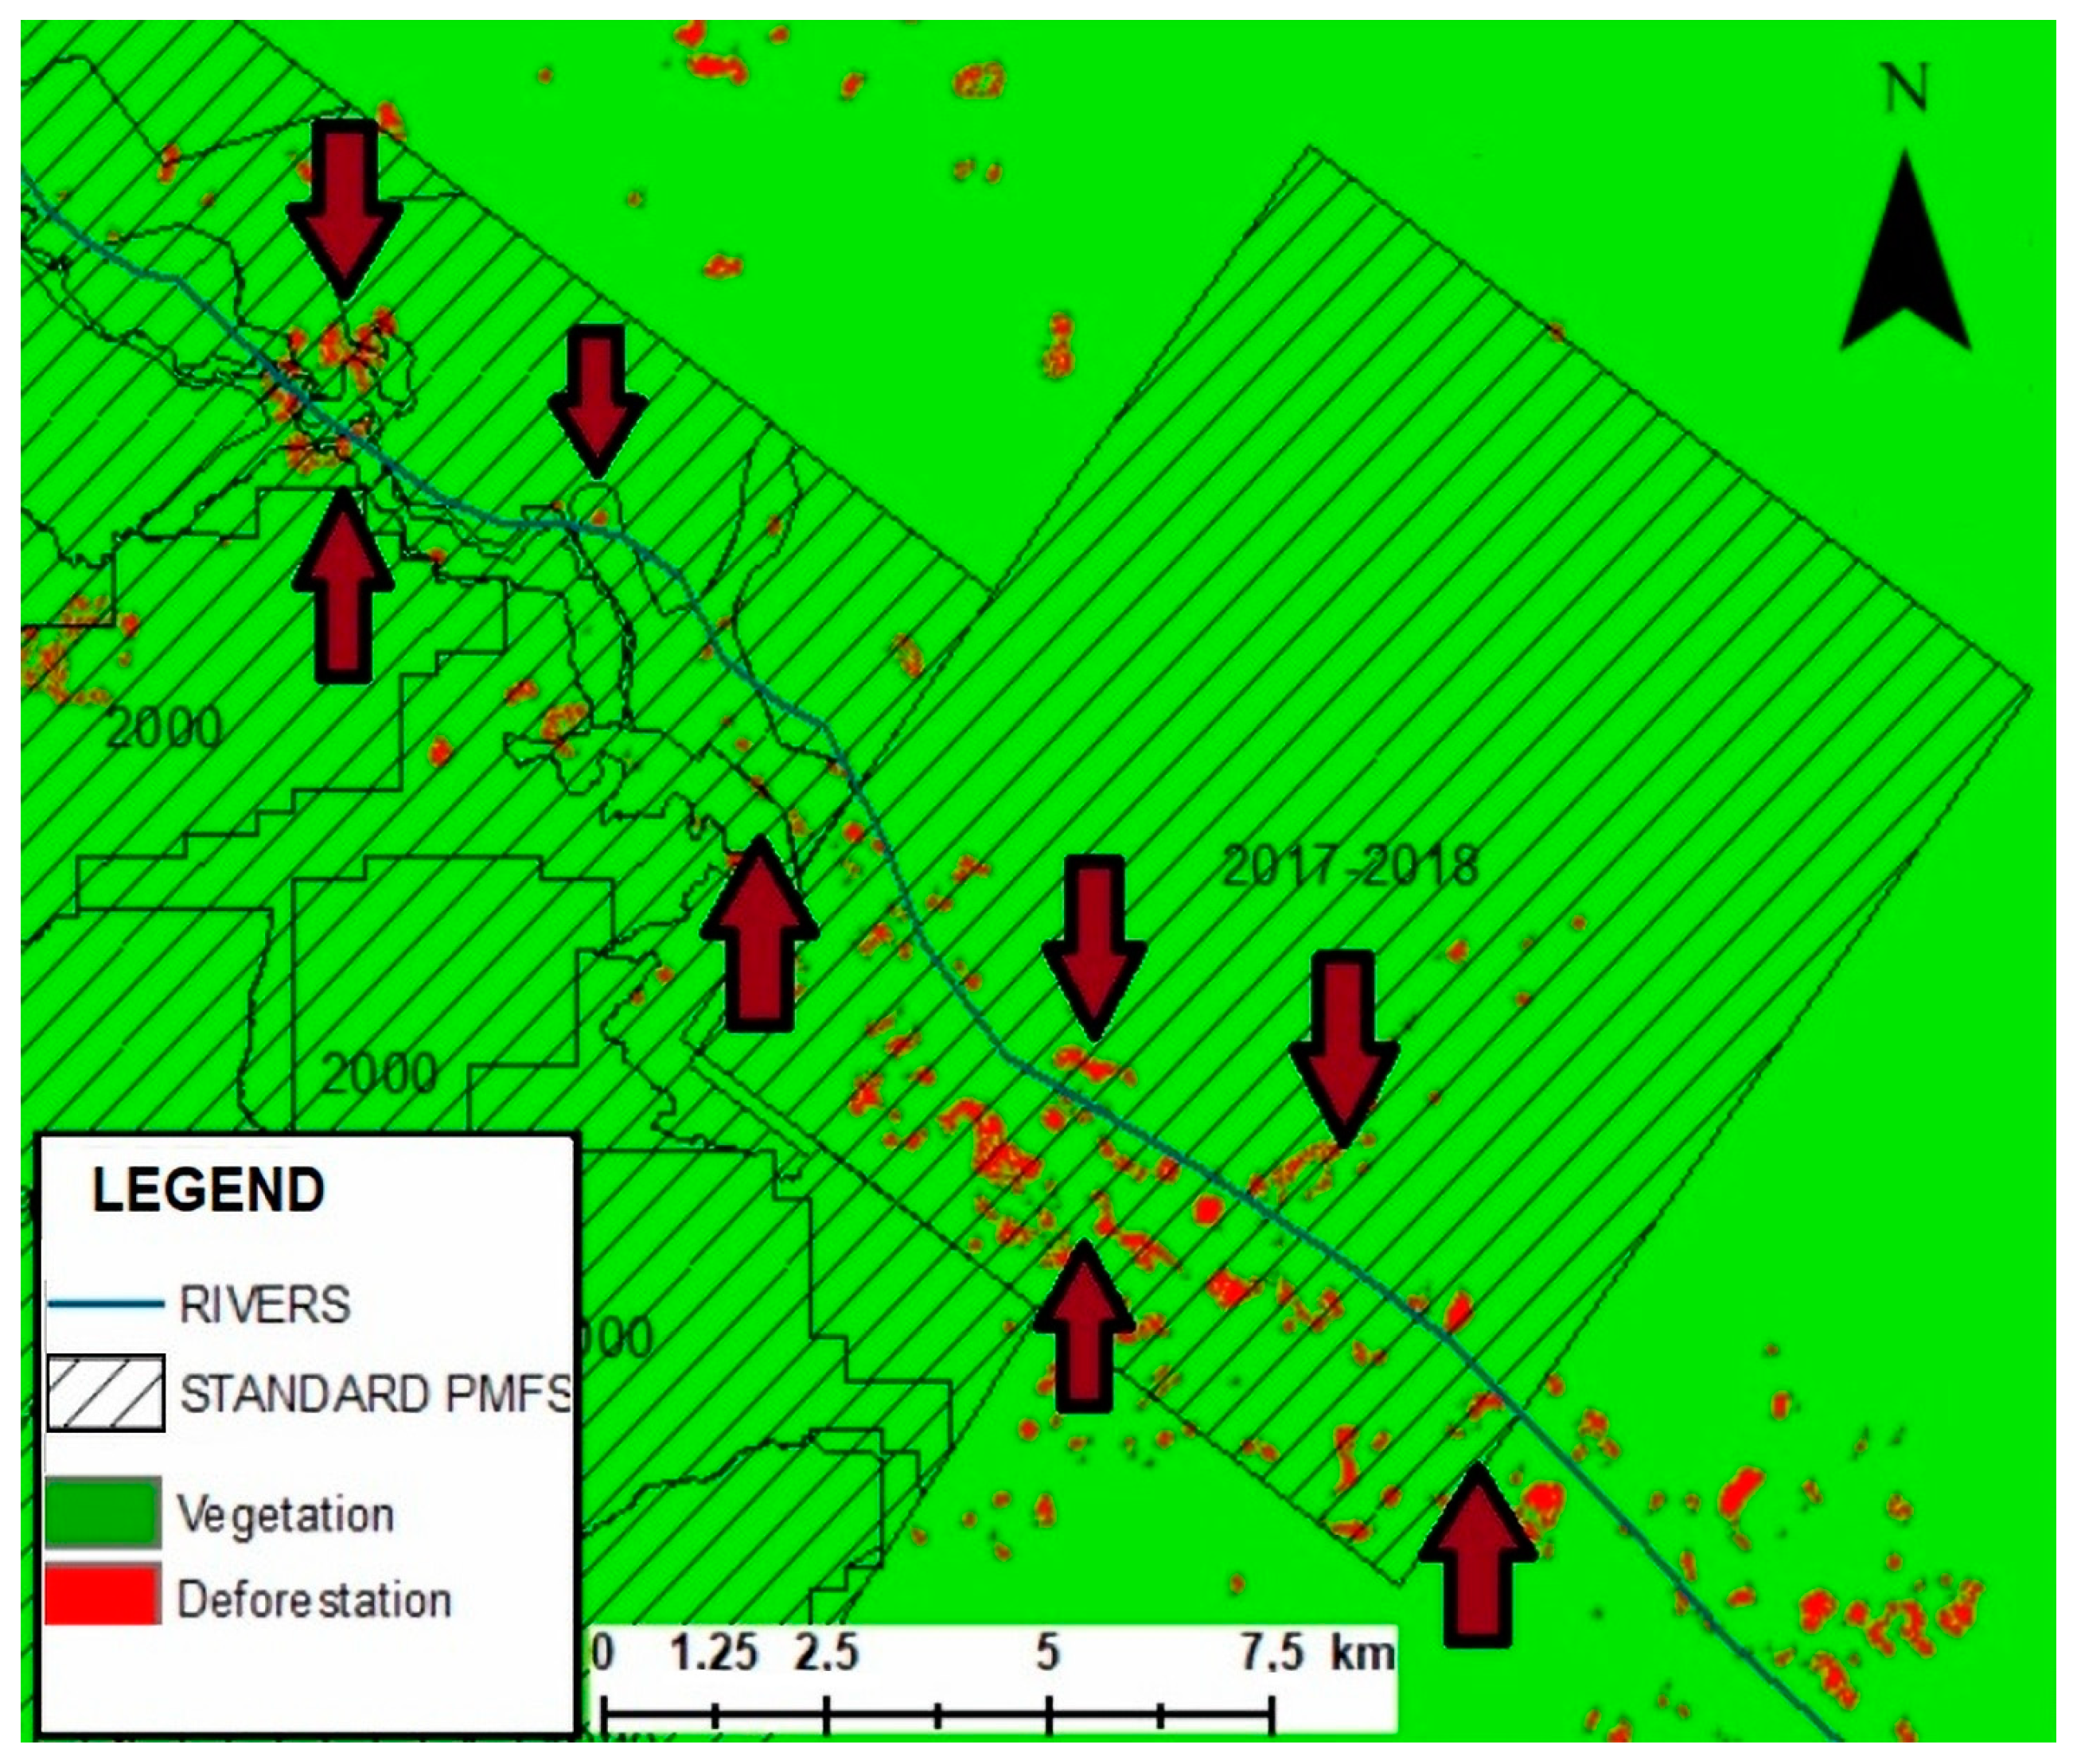
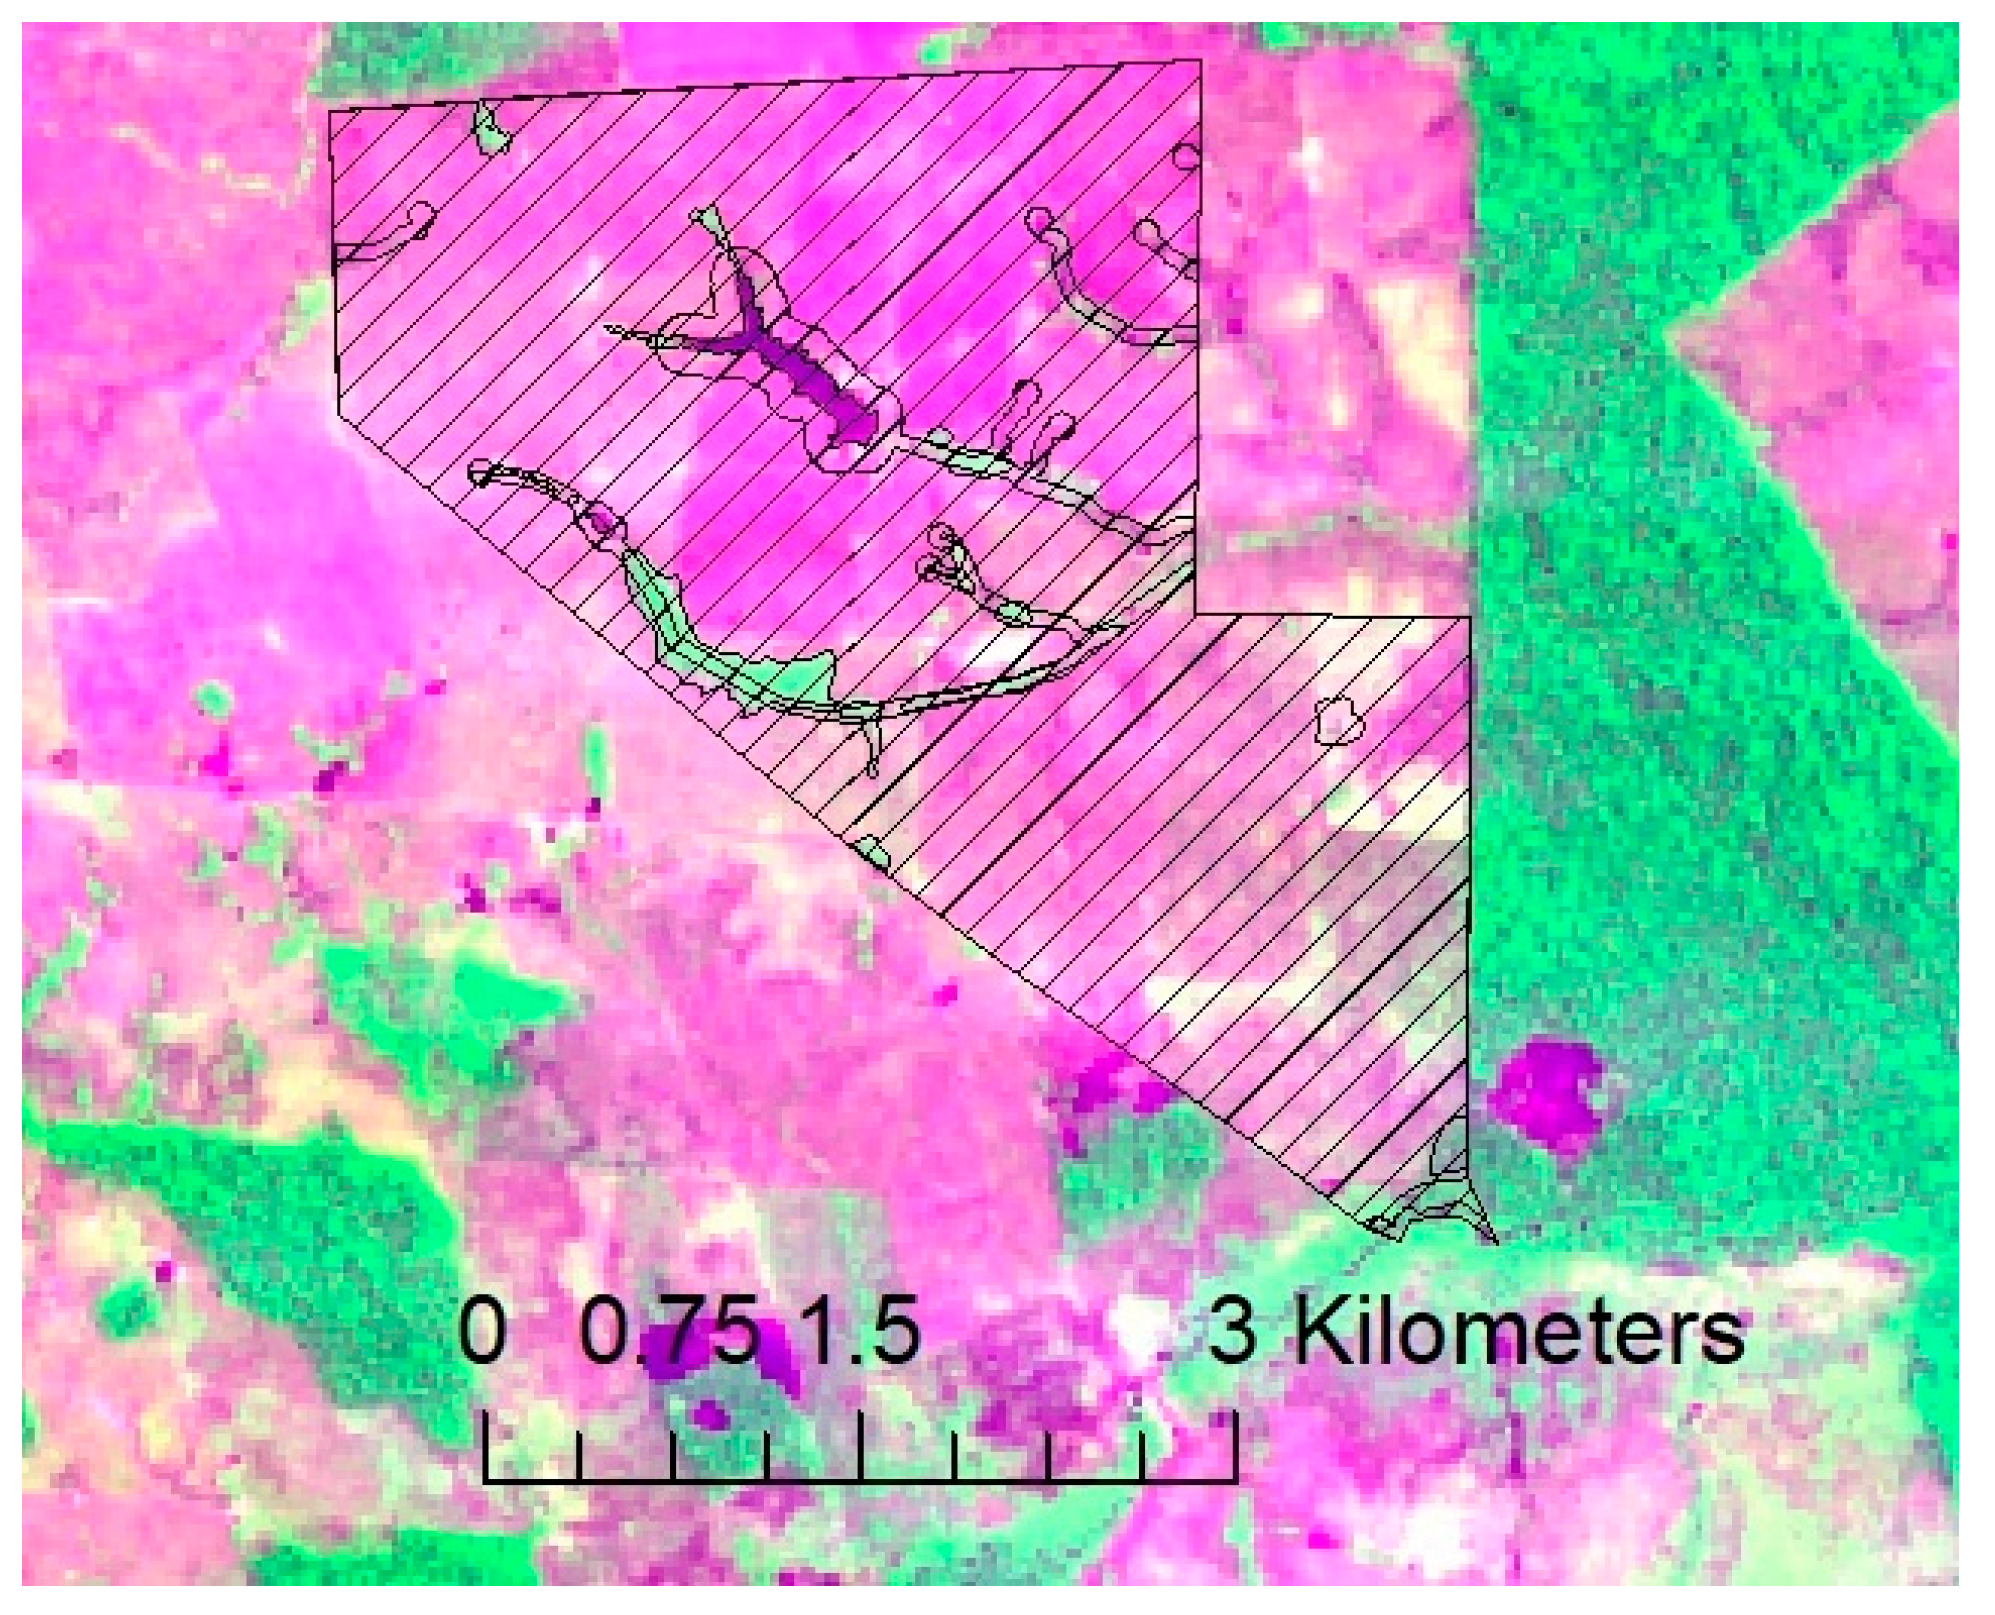
- Criterion 1.3—Deforestation in the PMFS and/or Areas of Permanent Preservation (APP)Standard PMFS: Between the years 1993 and 2004, there was an increasing deforestation of APP located in the southeastern portion of the PMFS, which was possible to detect thru MTCU (Figure 17).MSA PMFS: 36 properties (43%) showed signs of clear-cutting in their interior, among which 23 presented deforestation that reached APPs. Figure 18 shows deforestation in the PMFS (FID 3364).
- (iv)
- Criterion 1.4—Forest exploitation in the area prior to licensingStandard PMFS: No forest exploitation in the standard PMFS prior to licensing identified.83 MSA PMFS: 19% of the areas showed signs of exploitation prior to the licensing. Figure 19 shows presence of yards, roads and selective cutting signs inside three PMFS (4888, 2987 and 4191).
- (v)
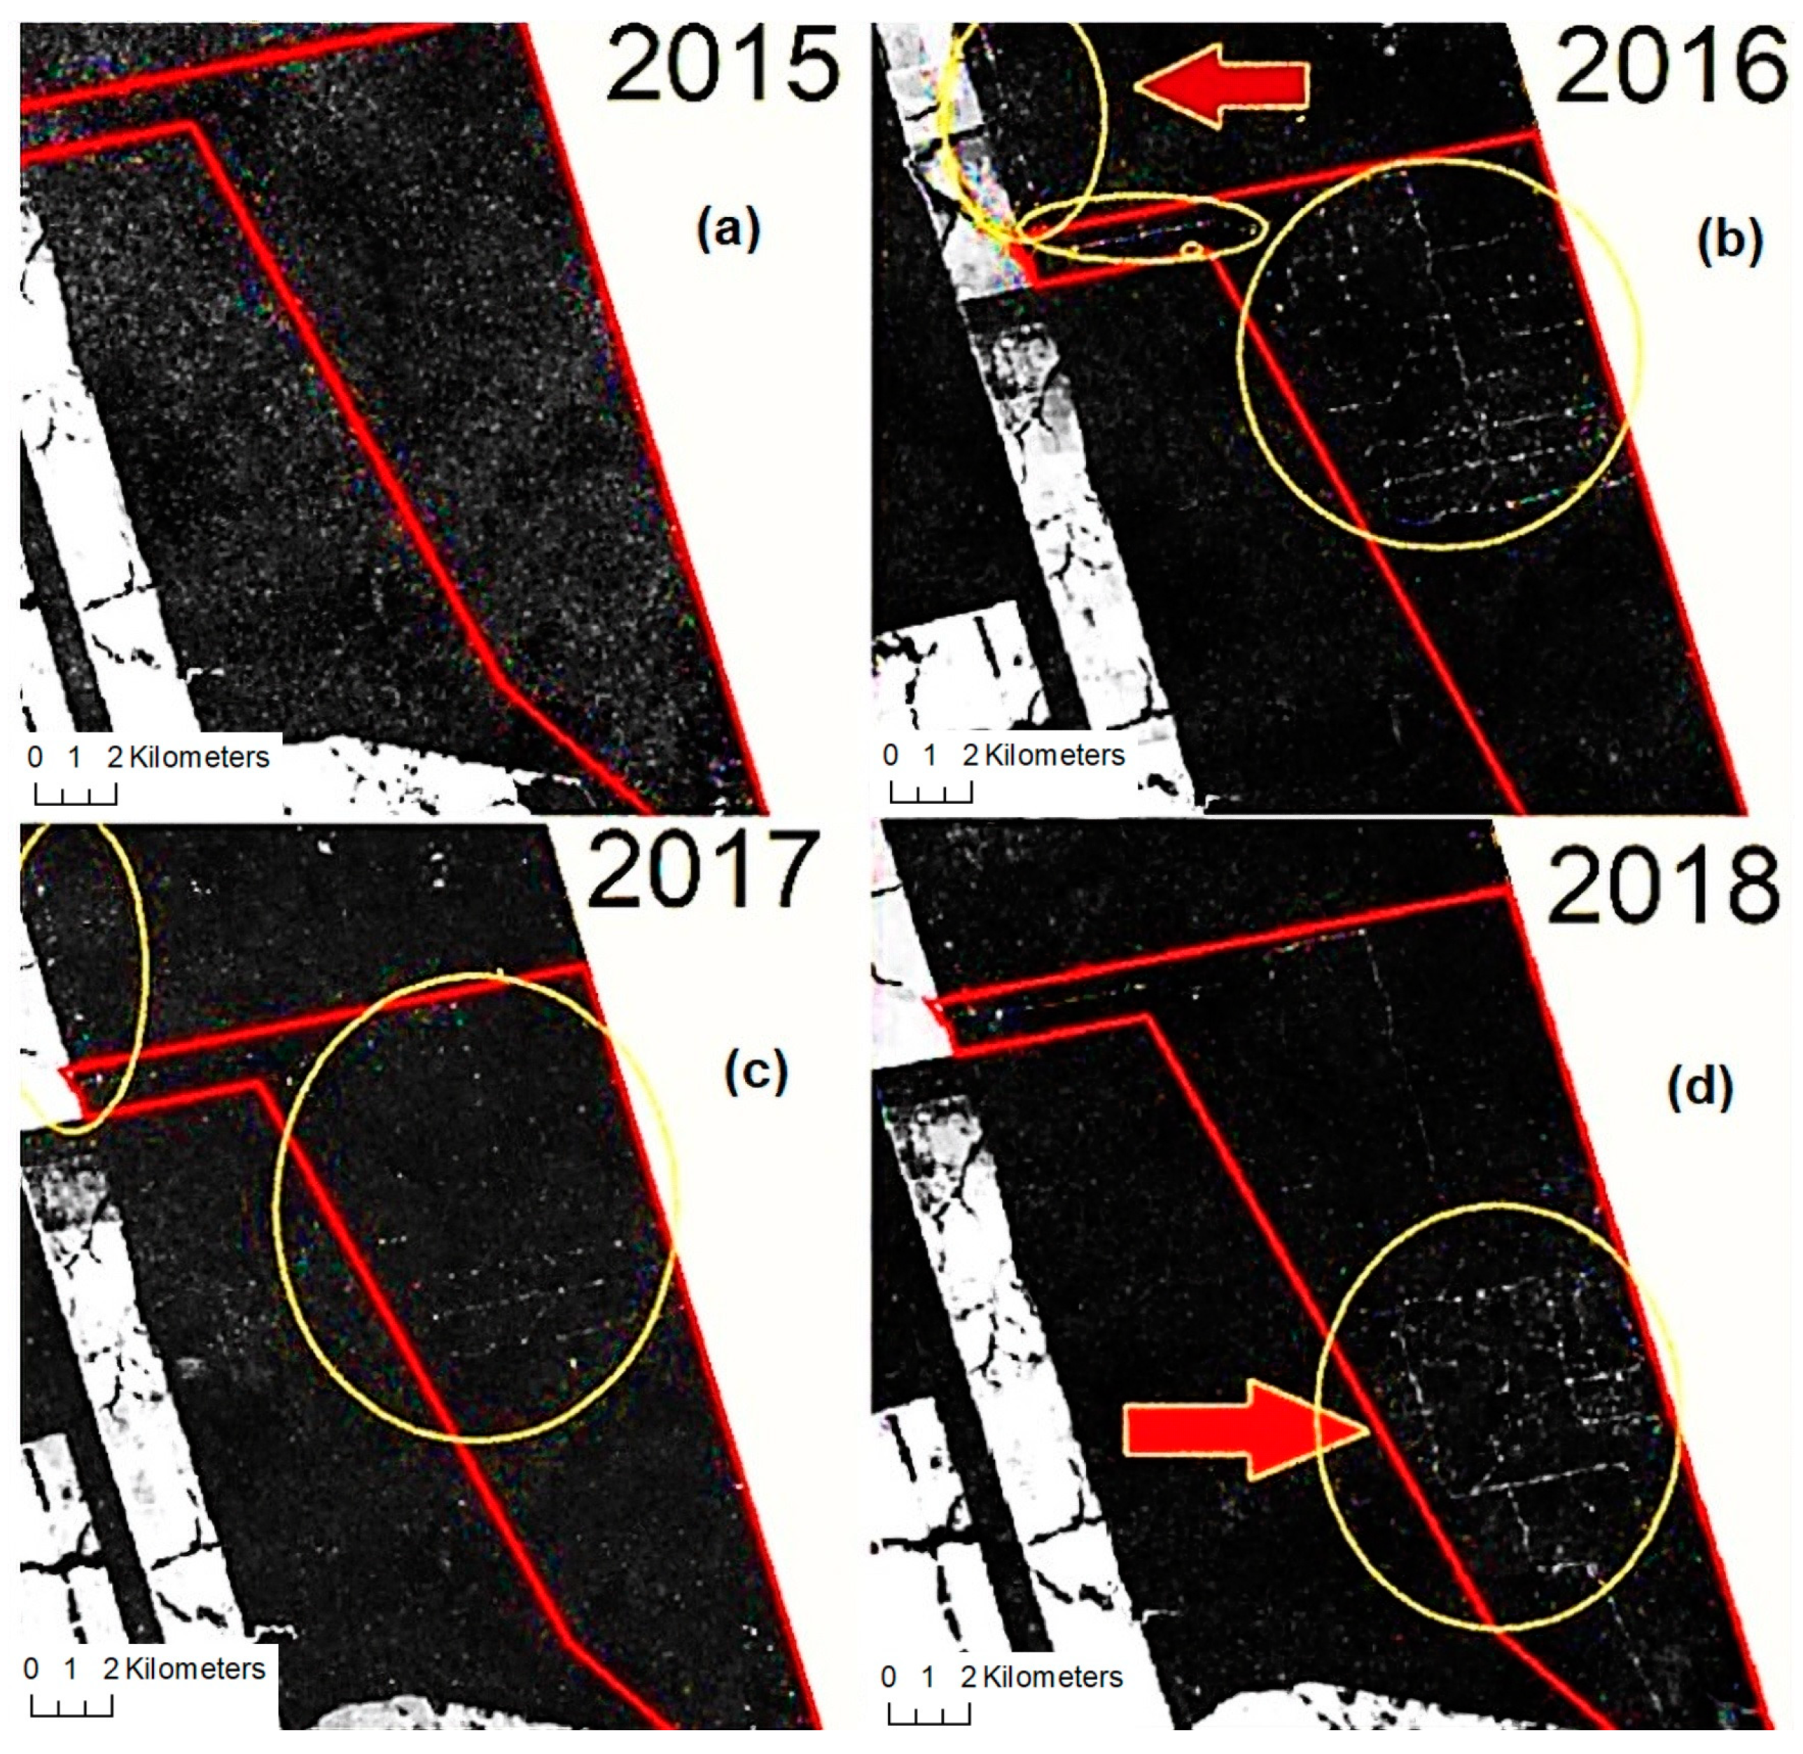
- Criterion 1.5—Further forest exploitation after the last DOF issuingStandard PMFS: No forest exploitation in the standard PMFS after the last DOF issuing.83 MSA PMFS: 5% of the areas showed signs of exploitation after the last DOF issuing. Figure 20 shows areas of selective cut inside and around PMFS (FID 4572).
- (vi)
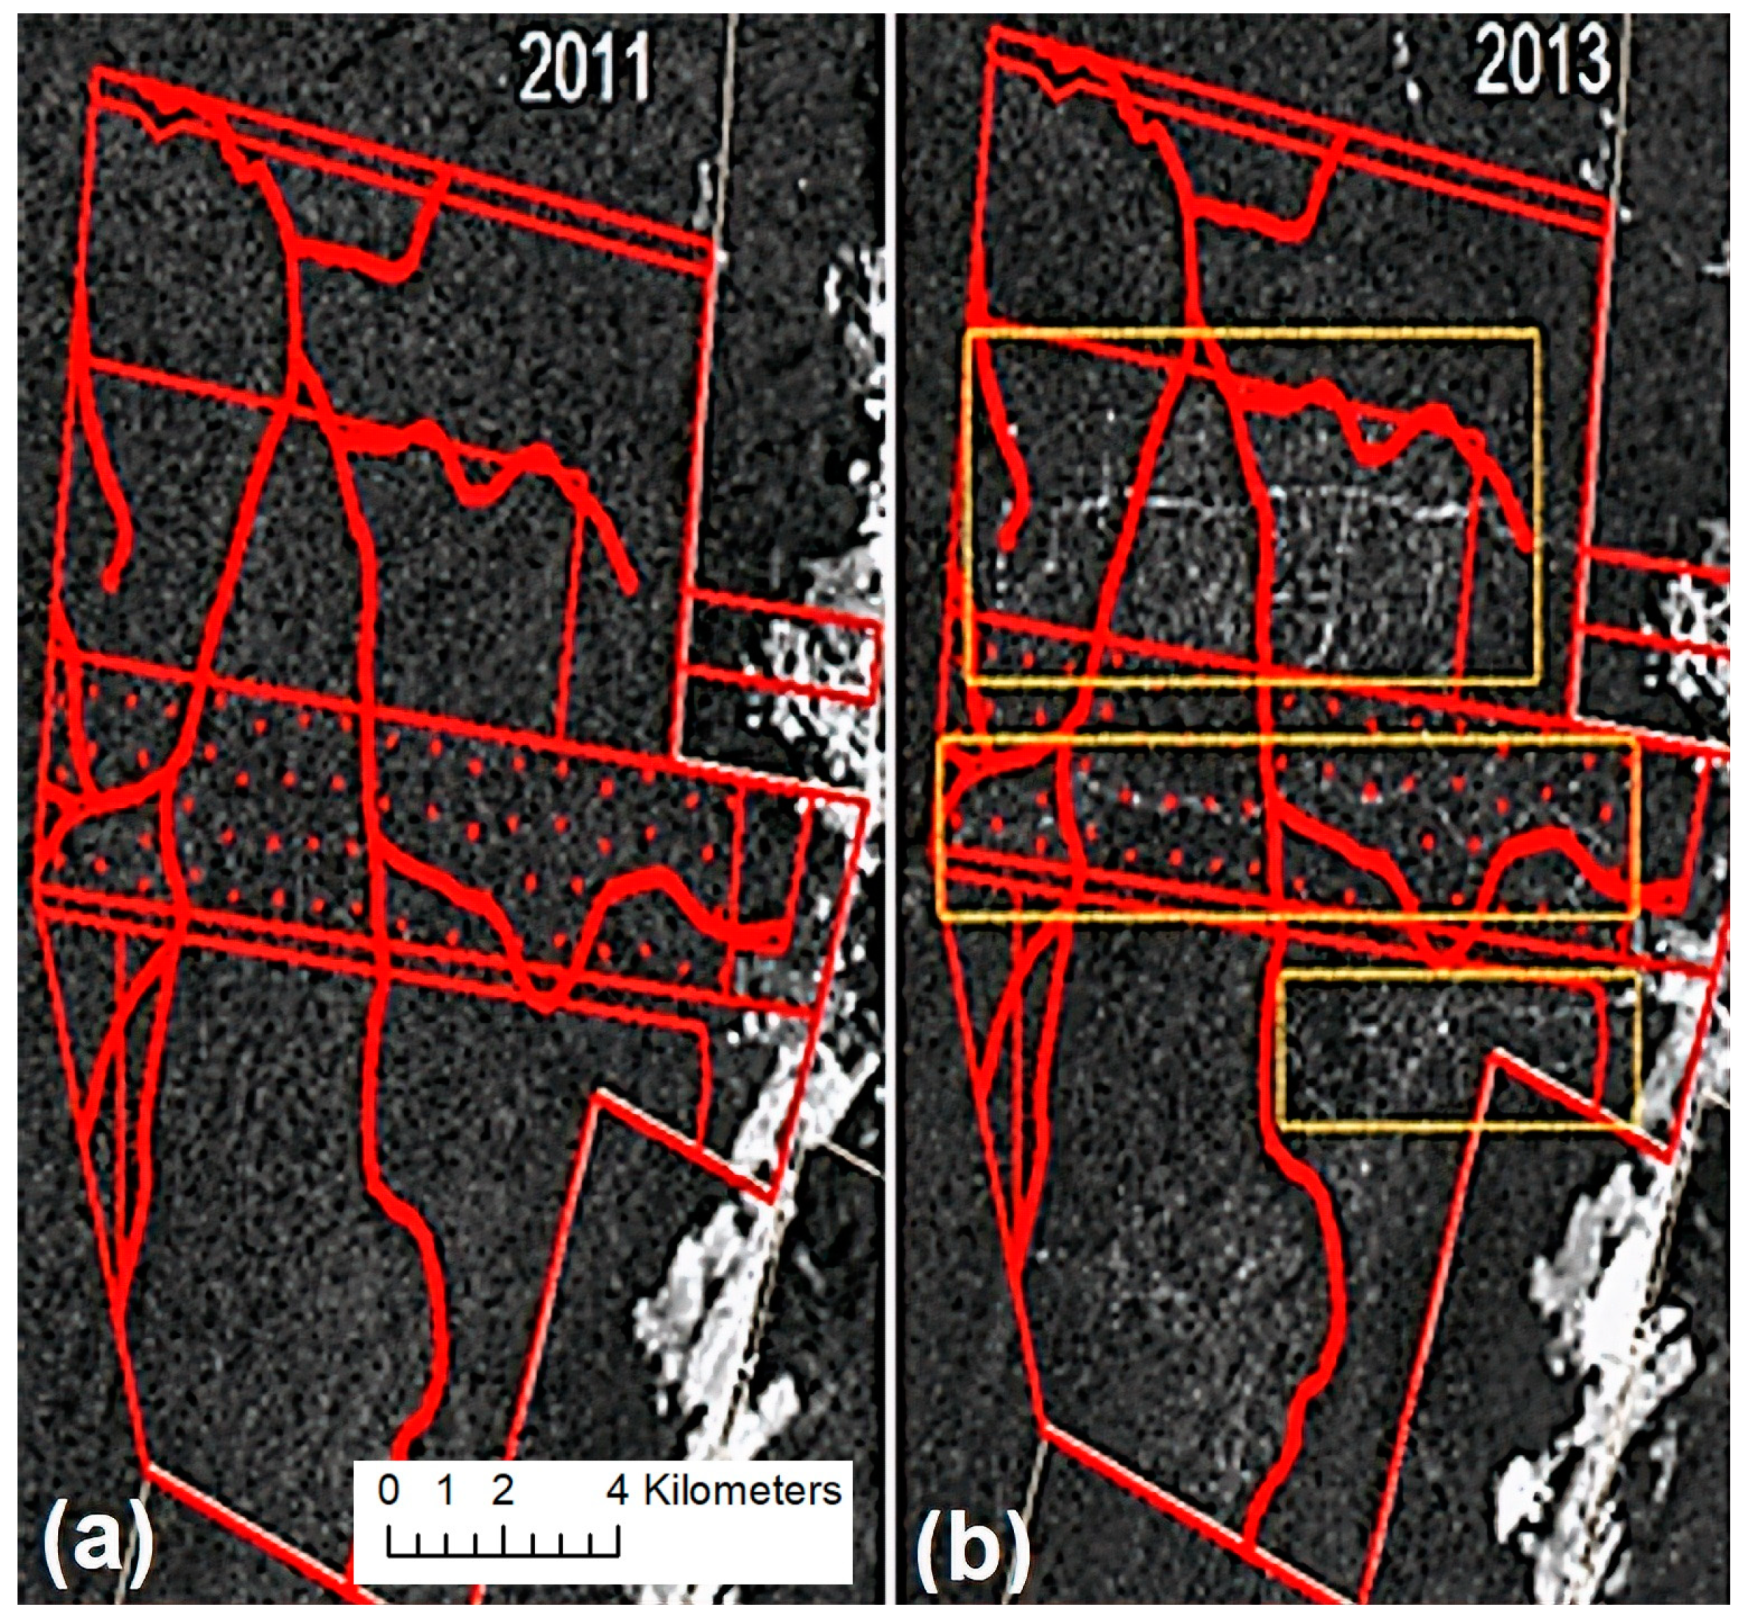
- Criterion 1.6—Exploitation held outside the polygon boundariesStandard PMFS: It was detected selective exploitation outside the authorized polygon in years 2009 and 2016 (Figure 21).MSA PMFS: 43 PMFS (52%) showed signs of exploitation (selective and/or clear cut) outside the authorized polygon limit. Figure 22 shows exploitation carried out outside PMFS (FIDs 4888, 2987 and 4191).
- (vii)
- Criterion 1.7—Exploitation in area previous embargoed by IBAMAStandard PMFS: No exploitation in area previous embargoed by IBAMA identified inside standard PMFS.83 MSA PMFS: No exploitation in area previous embargoed by IBAMA identified inside MSA 83 PMFS.
4.2.2. Non-Spatial Data
- (i)
- Criterion 2.1—Product received after valid datesSTATE OF AMAZONAS: 5.8%.MSA: 3.6%.STANDARD PMFS: 0.5%.MSA 83 PMFS: 17% of the areas issued DOFs received only later than the end of the document’s validity in a percentage greater than 5% of the total number of documents issued. The highest percentile of products received out of date was 49.7% (FID 4940), out of about 6800 m3.
- (ii)
- Criterion 2.2—DOF CanceledSTATE OF AMAZONAS: 3.2%.MSA: 3.7%.STANDARD PMFS: 0.9%.MSA 83 PMFS: 20% of the areas had DOFs canceled at a level higher than 5% of the total volume sold. FID 3303 had a canceled volume of 28.2% (of an amount of ~ 2700 m3), above all other PMFS that were between 5 and 8.1%.
- (iii)
- Criterion 2.3—DOF issued during rainy season (December to March)STATE OF AMAZONAS: 16.5%.MSA: 13.7%.STANDARD PMFS: 31.3%. It should be noted that the standard PMFS has a good access road structure and it is located close to a highway, which would, in theory, allow exploration throughout the year. Most PMFS located in Amazonas and specially in MSA, however, do not have such structure.MSA 83 PMFS: 24% of the areas had DOFs issued during the rainy season at a level higher than 15% of the total volume sold. Anyway, some of the properties had volumes extracted in the rainy season above the average such as FID 2262 (32.5%) and FID 3468 (44.7% and 37%). FIDs 4936 and 4499, despite being areas belonging to the same holder and being located very close, had their exploitation the in rainy season carried out quite differently, with 1% of exploitation during the rainy period in FID 4936, against 44.3% of exploitation at the same time for FID 4499 (Figure 23). This finding, in addition to various other irregularities found for both FIDS, may show fraudulent transactions in SisDOF. However, this is an indicator that must be evaluated in each specific case, together with other factors such as the existence of roads and adequate infrastructure for the extraction and transportation of products, distance to the recipient, etc.
- (iv)
- Criterion 2.4—Suspicious volume declaredSTATE OF AMAZONAS: 3.6%.MSA: 3.2%.STANDARD PMFS: 8%.MSA 83 PMFS: 52% of all areas had volumes of roundwood sold with no decimal places. The majority of PMFS had occurrence values below 10%. However, FID 2568 had 51.3% of their volumes traded for roundwood with no declared decimal place, out of 44,508.86 m3, traded between July and December 2013.
- (v)
- Criterion 2.5—Identity of Internet Protocol (IP) numbersSTATE OF AMAZONAS: 54.5%.MSA: 50.7%.STANDARD PMFS: 26.1%MSA 83 PMFS: 81% of all properties had transactions in SisDOF registered with the same IP number, both for the transaction of issuing and receiving the cargo.
- (vi)
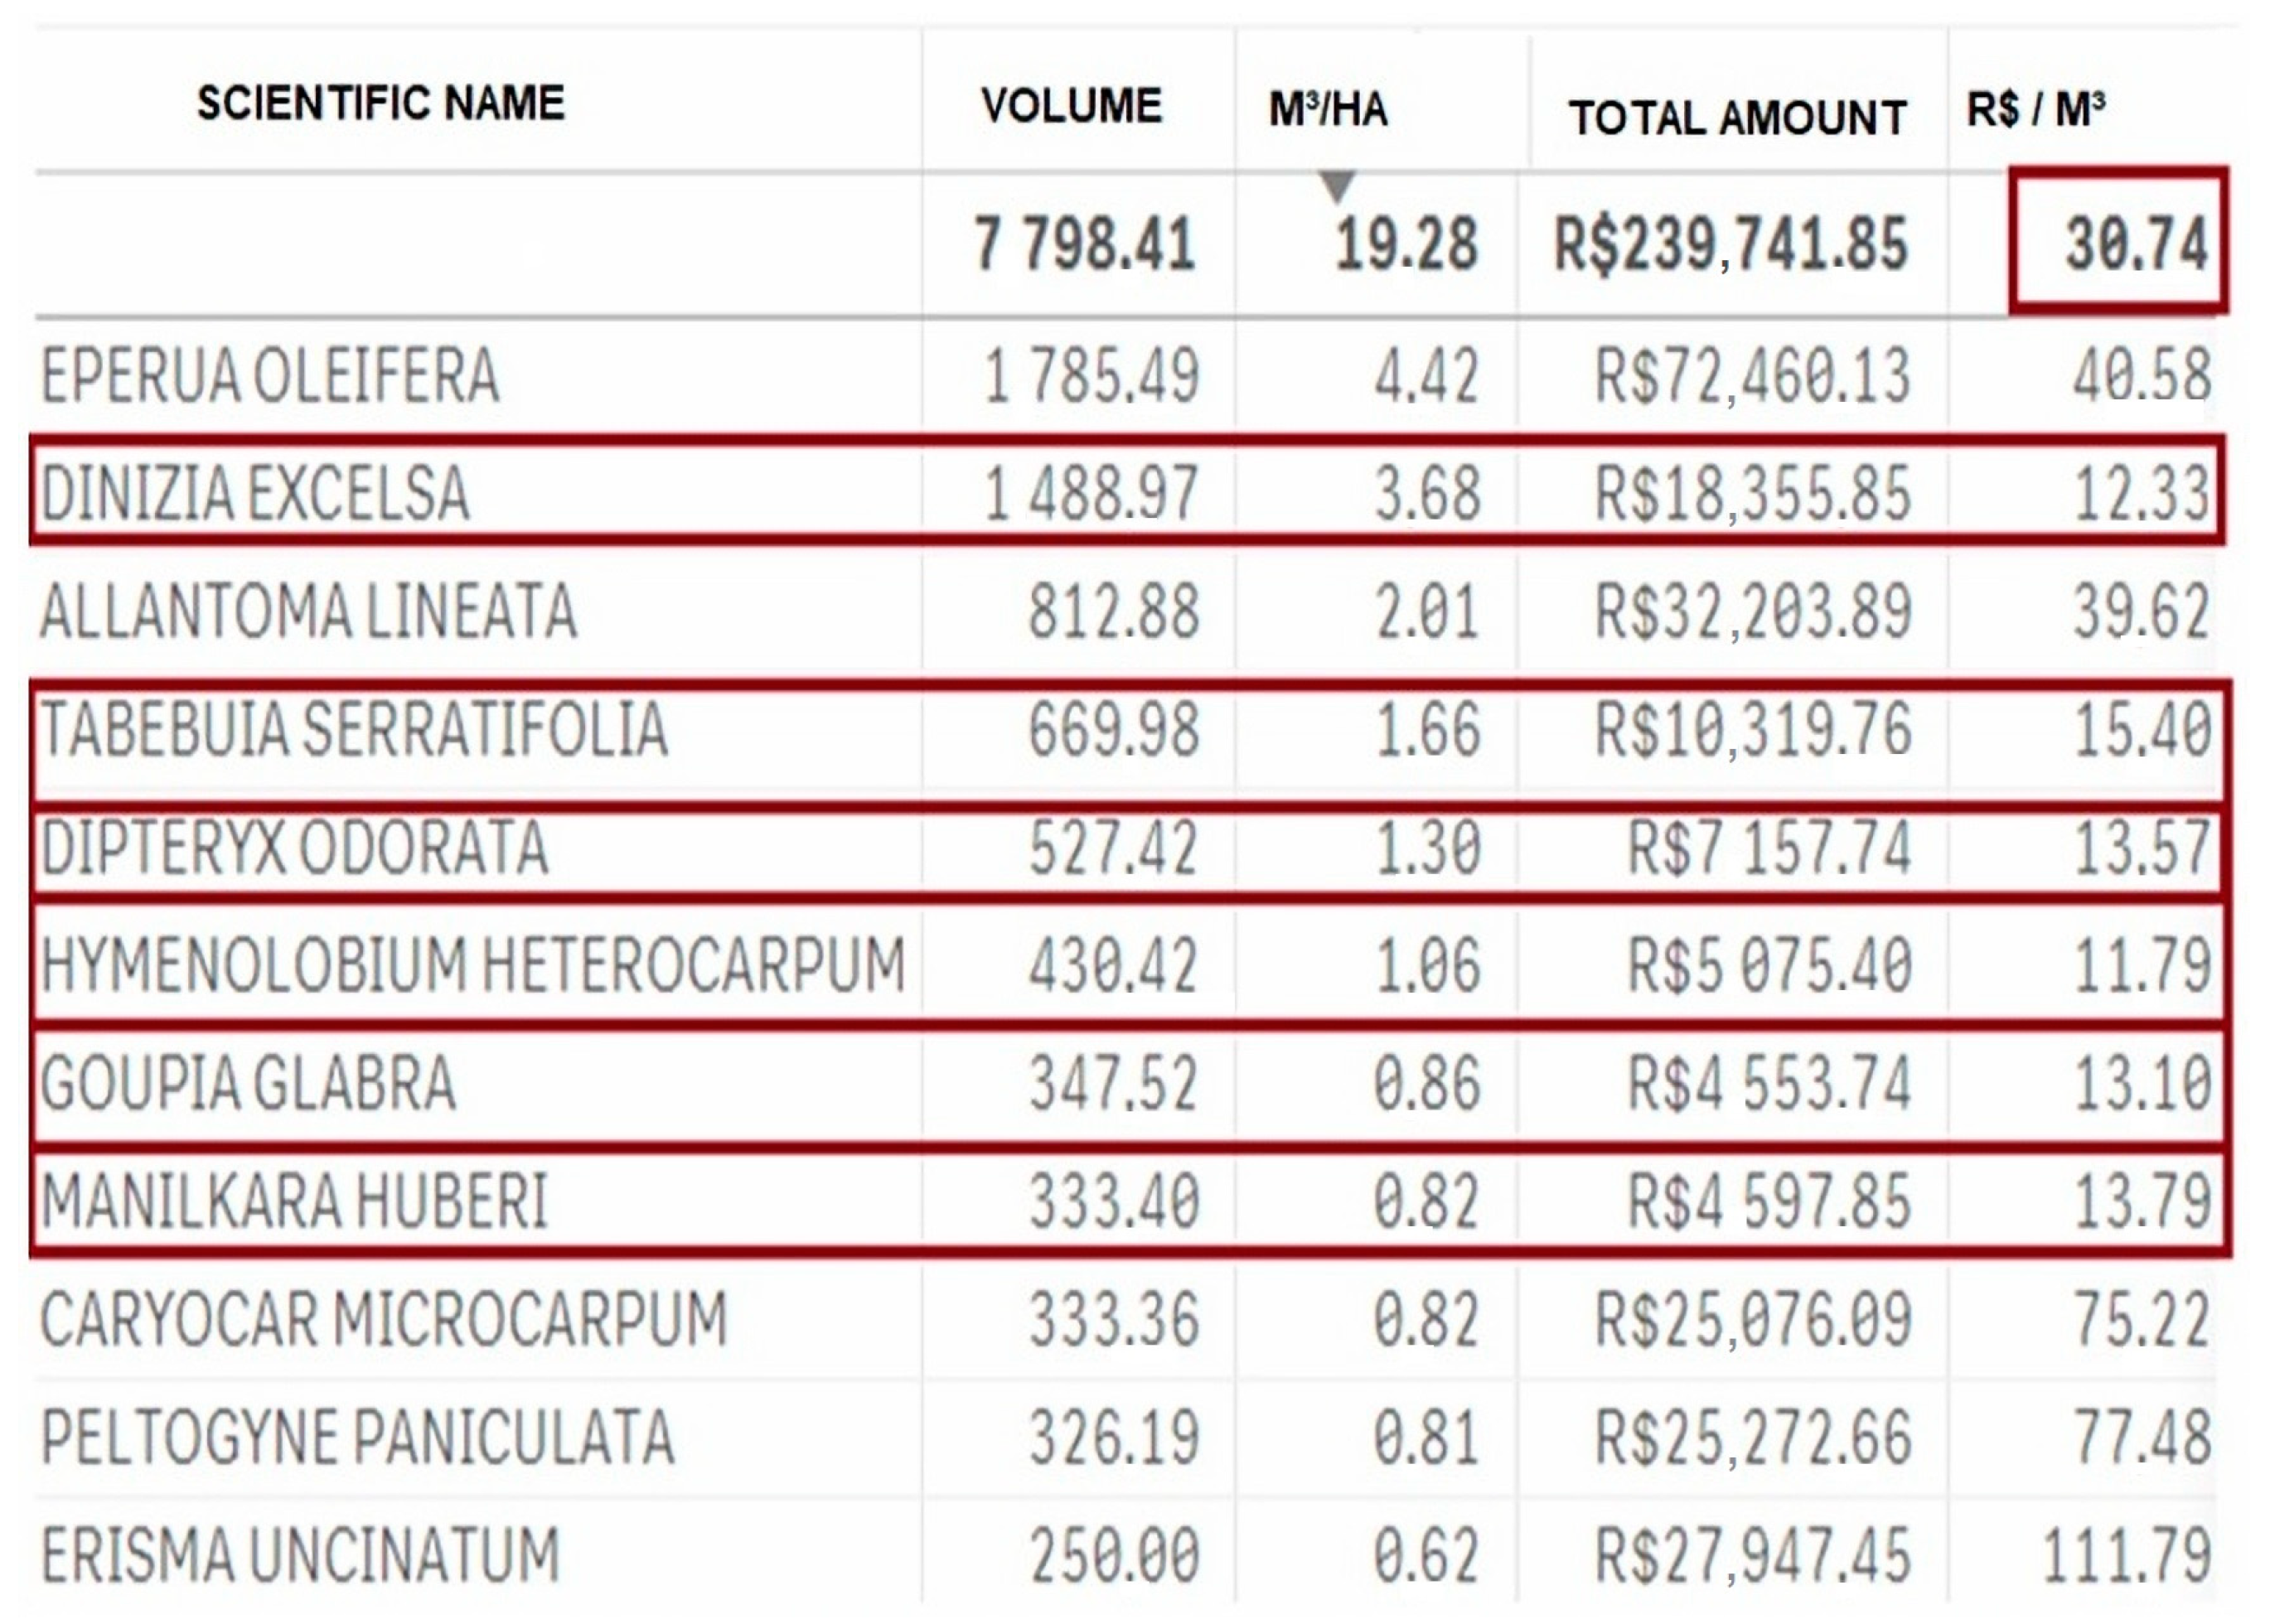
- Criterion 2.6—Price under R$66.00STATE OF AMAZONAS: 26.3%.MSA: 28.2%.STANDARD PMFS: 0%.MSA 83 PMFS: 70% of the areas recorded log sale prices under R$66.00. FID 3662 had an average value for all species was around R$ 30.00/m3, with even lower prices as demonstrated below (Figure 24).
- (vii)
- Criterion 2.7—Volume declared is incompatible with vehicleSTATE OF AMAZONAS: 1%.MSA: 0.3%STANDARD PMFS: 0%.MSA 83 PMFS: 4% of the properties declared volumes in DOFs of their issuance incompatible with the type of road transport informed. Although FID 3645 had only 0.5% of incompatibility, this amount is equivalent to a volume of about 500 m3. In turn, FID 3087 presented 81.4% of incompatibility, which despite the small volume handled by the project, is equivalent to 300 m3.
- (viii)
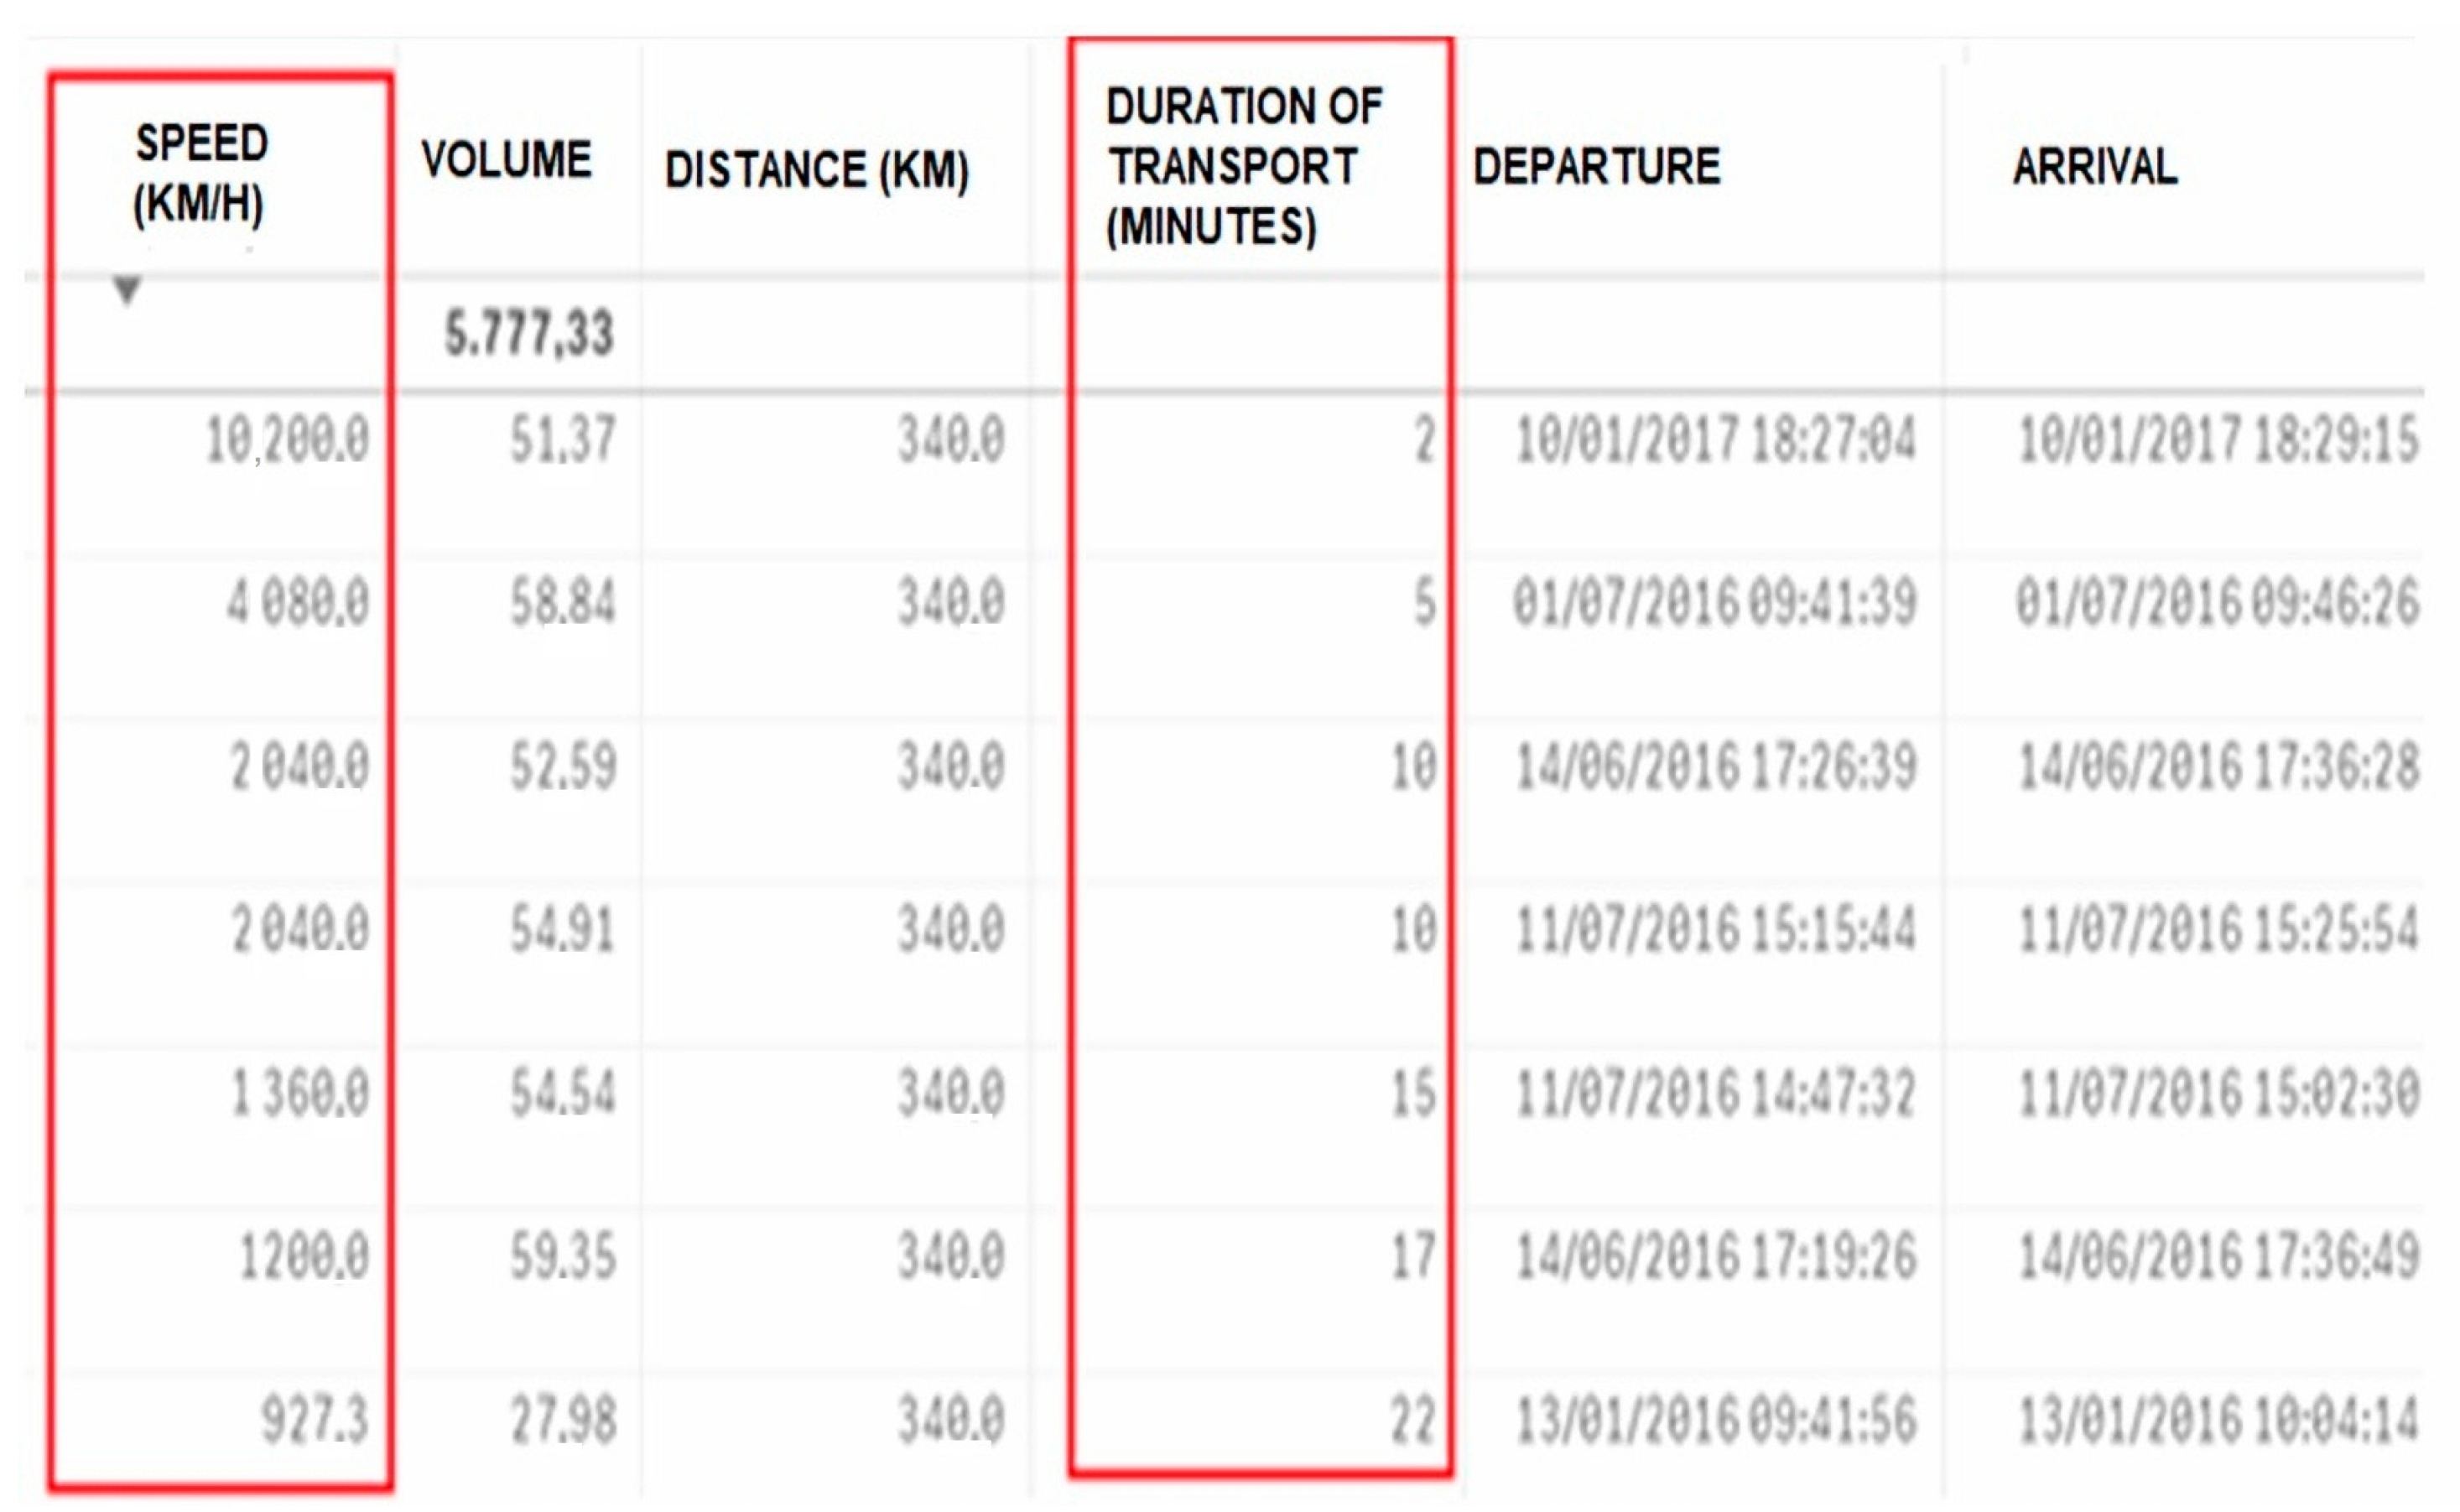
- Criterion 2.8—Transport distance greater than 200 kmSTATE OF AMAZONAS: 1.3%.MSA: 1.8%.STANDARD PMFS: 0%.MSA 83 PMFS: Three areas (4% of the sample) had logs sold to buyers located more than 200 km away (FIDs 1325, 2759 and 4034). FIDs 1325 and 2759 turn out to be suspicious, but they would require fieldwork and further analysis for an adequate conclusion. FID 4034 had a very peculiar behavior with 100% of the total volume of lumber sold (total of 5777.33 m3 of roundwood) transported to the same lumber, 340 km far in straight line. This very same PMFS presented no infrastructure compatible with forest management (item 1.2), what strongly reinforces the possibility of carrying out fraudulent transactions in the DOF for the legalization of products from other areas. This suspicion is strongly reinforced, once it was verified the existence of transactions at SisDOF whose time between the issuance of the DOF and the alleged receipt of the cargo by the recipient was less than 10 min, for an estimated distance of 340 km in a straight line.
- (ix)
- Criterion 2.9—Transport speed higher than 40 km/hSTATE OF AMAZONAS: 3.1%.MSA: 3%.STANDARD PMFS: 0%.MSA 83 PMFS: 70% of the PMFS had DOFs issued whose total transport time and distance, between the sender and the receiver, would have resulted in an average speed greater than 40 km/h. FID 4034, also mentioned in the criterion 2.8, presented transport duration times that would result in speeds above 1000 km/h (Figure 25).
- (x)
- Criterion 2.10—Fines for irregularities in the SisDOFSTANDARD PMFS: No (2014-18).MSA 83 PMFS: 6% of properties had records of administrative infractions (fines) due to the finding of irregularities in the SisDOF. This finding is quite relevant if we consider that a much higher percentage of the properties analyzed here presented strong indications of irregularities related to SisDOF.
- (xi)
- Criterion 2.11—Fines for irregularities in the PMFSSTANDARD PMFS: No (2014-18).MSA 83 PMFS: 7% of the properties had records of administrative infractions (fines) for irregularities in the execution of PMFS. The observation in the previous criterion (2.10) also applies here.
- (xii)
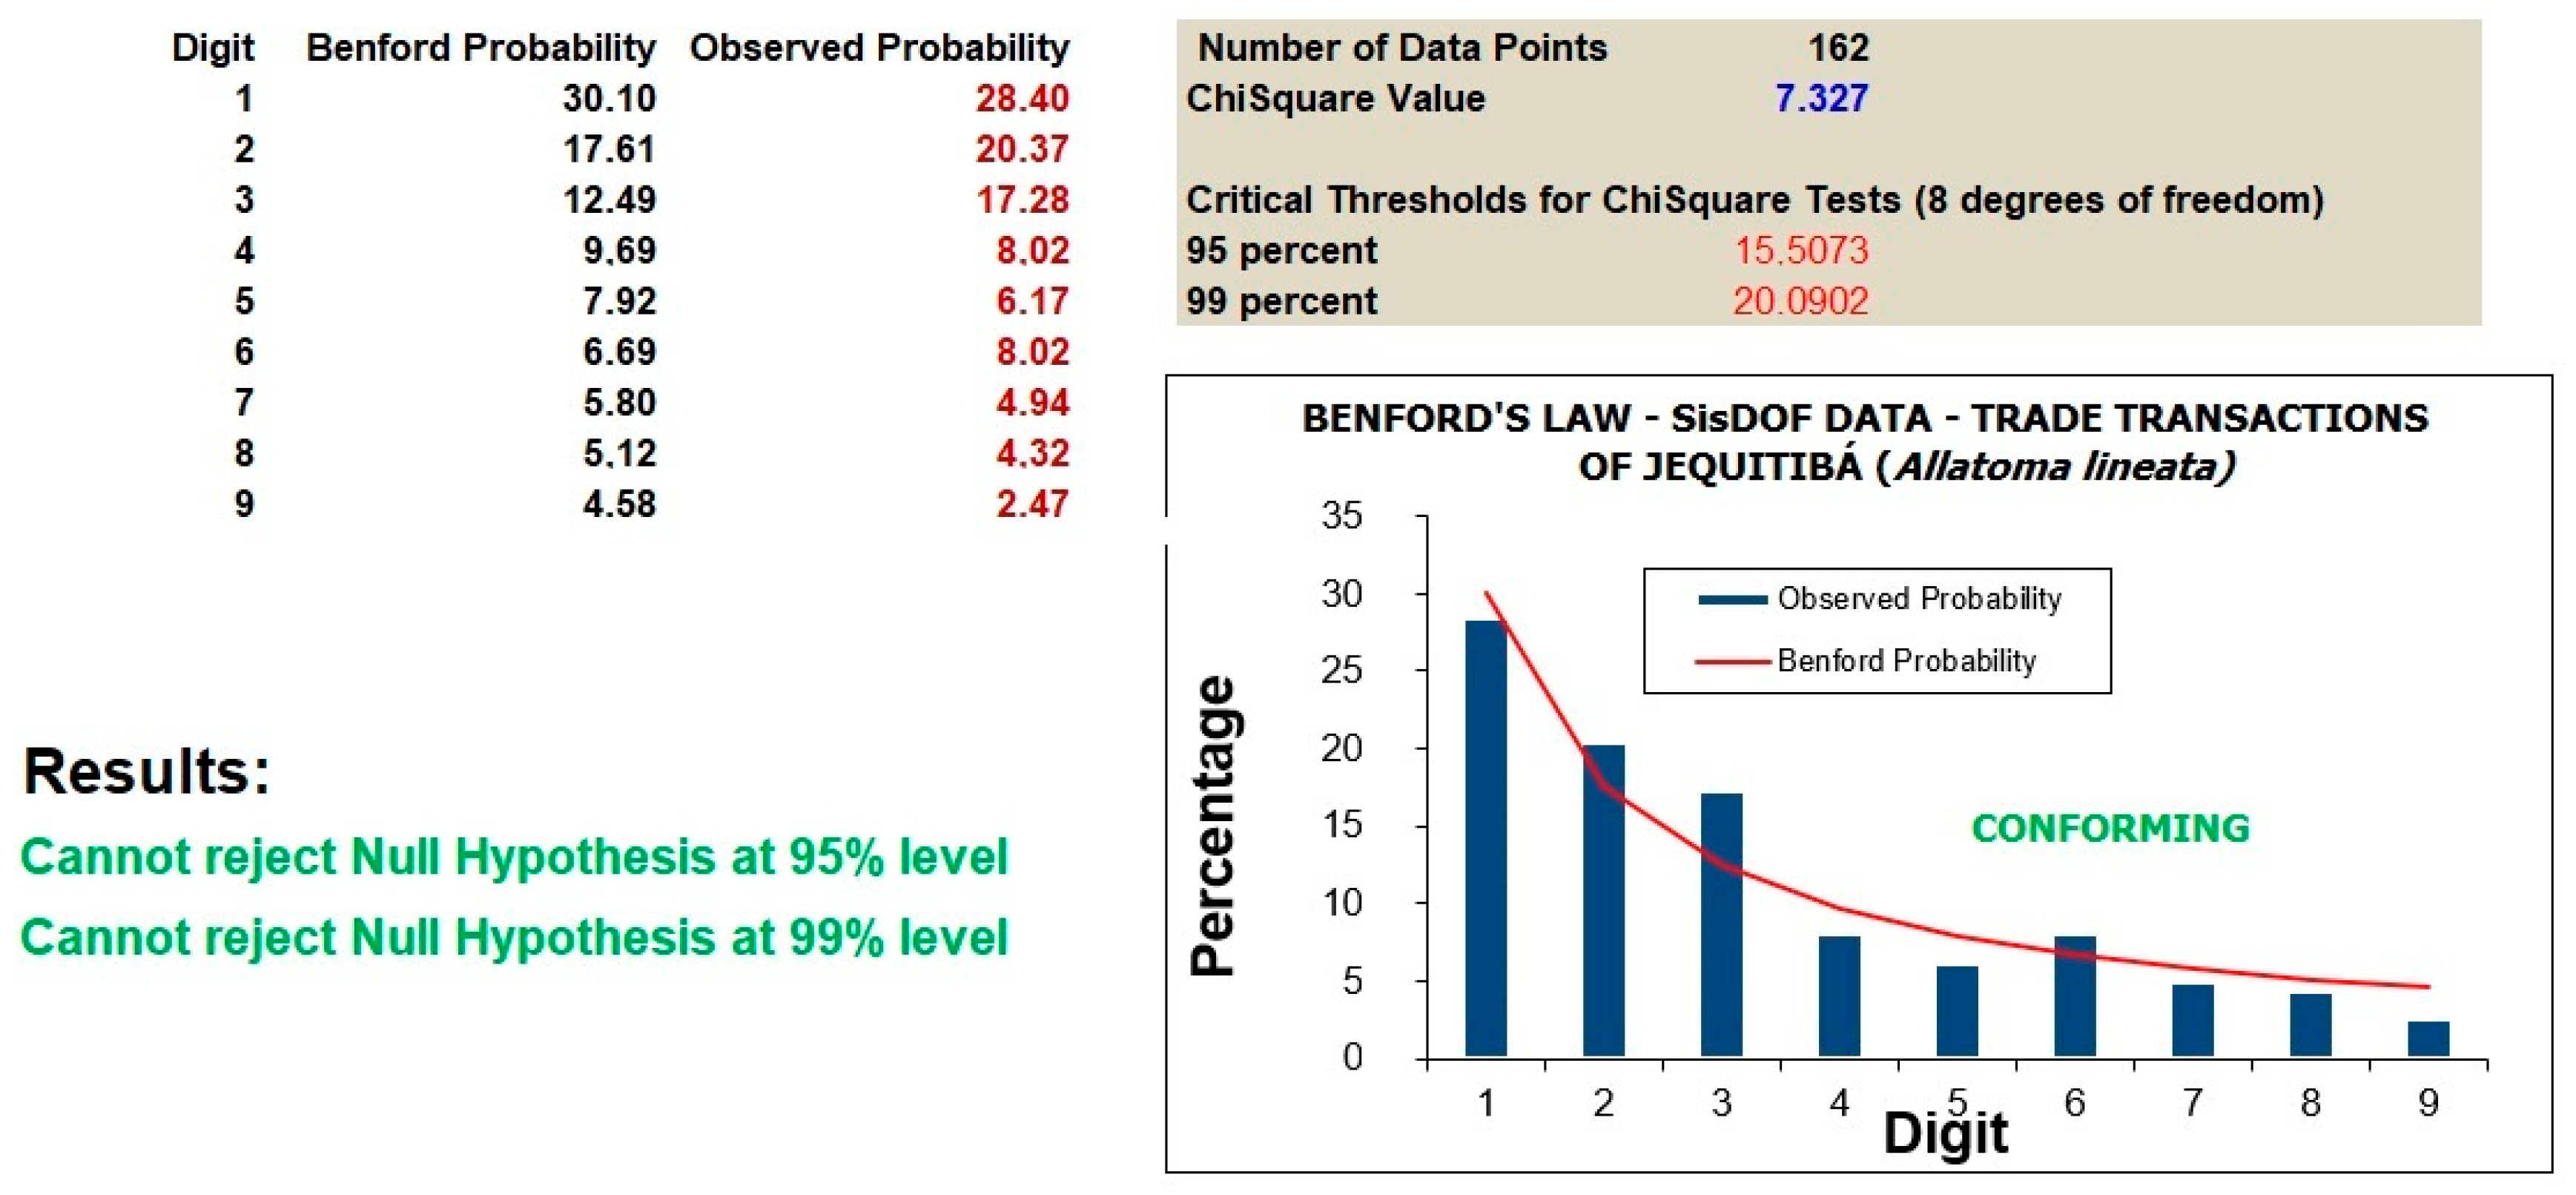
- Criterion 2.12—Irregularities related to the forestry inventorySTANDARD PMFS: No. The forestry inventory (species and m3/ha) resulted compatible with official data (RADAM Project). The volumetric data of all transactions contained in SisDOF as also individually for the 5 most exploited species resulted conforming to Benford’s law, both for the total volume, as well as the volume per hectare. The sum of the “Diameter at Breast Height” (DBH) values of all the specimens of one of the annual production unit also proved to be conforming.MSA 83 PMFS: 54% of the properties presented volumetric information incompatible with RADAM Project survey and/or not conforming with Benford’s Law.
- (xiii)
- Criterion 2.13—Total volume traded identical to the authorized volumeSTANDARD PMFS: No.MSA 83 PMFS: 02 PMFS (2% of the sample) had a total volume traded identical to the volume estimated in the forestry inventory (FIDs 4622 and 2087). Three other areas had a rate of utilization much higher than that usually found in these cases (which varied in the current sample between 75 and 90%). FID 4769 had 98%, while FID 4086 had 98.5% and FID 4343, 96%.
- (xiv)
- Criterion 2.14—Fines for labor law violationsSTANDARD PMFS: No. (2014-18).MSA 83 PMFS: One property (FID 3364) presented labor irregularities, totaling 21 fines applied by the Labor Activity Inspection Body. The same property also had 78 administrative fines from IBAMA for various environmental offenses, between 1996 and 2017. The sum exceeds R$ 50 million (approximately US$12 million in 20 February 2020), what reinforces that disrespect to labor legislation go hand in hand with environmental offenses in the Brazilian Amazon.
- (xv)
- Criterion 2.15—Exploitation intensity over 25 m3/haSTANDARD PMFS: No. The cutting intensity in the standard PMFS was 13.81 m3/ha (2014-18).MSA 83 PMFS: 5% of the PMFS has a cutting intensity greater than 25 m3/ha, with emphasis on FID 4769, whose exploitation intensity reached 33.41 m3/ha (2014-18).
5. Discussion
6. Conclusions
Supplementary Materials
Author Contributions
Funding
Acknowledgments
Conflicts of Interest
References
- Instituto Nacional de Pesquisas Espaciais (INPE). Divisão de Geração de Imagens. Available online: http://www.dgi.inpe.br (accessed on 20 January 2020).
- Instituto do Homem e Meio Ambiente da Amazônia. Mercado e Preços da Madeira Amazônica; Imazon: Belém, Brazil, 2010. [Google Scholar]
- Pontes, R.V.; Noronha, M.C.; Pontes, K.R. Desflorestamento no sul do Amazonas: Embate entre o desenvolvimento econômico e a conservação ambiental. Am. Res. Thoughts 2015, 1, 1551–1570. [Google Scholar]
- Código Florestal Brasileiro. Lei Federal Nº. 12.651/2012. Available online: http://www.planalto.gov.br/ccivil_03/_ato2011-2014/2012/lei/l12651.htm (accessed on 12 December 2019).
- Trennepohl, C.; Trennepohl, T. Licenciamento Ambiental, 7th ed.; Revista dos Tribunais: São Paulo, Brazil, 2018. [Google Scholar]
- Perazzoni, F. Criminalidade Ambiental Organizada: O Desmate Ilegal em Mato Grosso; Fórum Nacional de Segurança Pública: São Paulo, Brazil, 2009. [Google Scholar]
- Perazzoni, F. Amazonia, Organized Crime and Illegal Deforestation: Best Practices for the Protection of the Brazilian Amazon. In The 21st Century Fight for the Amazon: Environmental Enforcement in the World’s Biggest Rainforest; Ungar, M., Ed.; Palgrave Macmillan: New York, NY, USA, 2018; pp. 21–56. [Google Scholar]
- Instituto Brasileiro do Meio Ambiente e Recursos Naturais Renováveis. IBAMA. Documento de Origem Florestal (DOF); Ministério do Meio Ambiente: Brasília, Brazil. Available online: https://www.ibama.gov.br/flora-e-madeira/dof/o-que-e-dof (accessed on 20 January 2020).
- Perazzoni, F. Curso de Combate a Crimes Contra a Flora. Divisão de Repressão aos Crimes Ambientais e Contra o Patrimônio Histórico, Polícia Federal; Academia Nacional de Polícia: Brasília, Brazil, 2012. [Google Scholar]
- Perazzoni, F. Geointeligência no Combate ao Desmatamento ilegal na Amazônia: Polícia Federal e Sistemas de Informação Geográfica; Nuria Fabris: Porto Alegre, Brazil, 2014. [Google Scholar]
- Arruda, R.M. Crime Contra a Flora: Quando a Ofensa Evolui, a Investigação Também Precisa Evoluir. Monograph; Post-graduate Program in Criminal Investigation, Escola Superior de Polícia, Ministério da Justiça: Brasília, Brazil, 2014. [Google Scholar]
- Brancalion, P.H.; Almeida, D.R.; Vidal, E.; Molin, P.G.; Sontag, V.E.; Souza, S.E.; Schulze, M.D. Fake legal logging in the Brazilian Amazon. Sci. Adv. 2018, 4. [Google Scholar] [CrossRef] [PubMed] [Green Version]
- Greenpeace. Imaginary Trees, Real Destruction. How Licensing Fraud and Illegal Logging of Ipe Trees Are Causing Irreversible Damage to the Amazon Rainforest. 2018. Available online: https://www.greenpeace.org.br/hubfs/Greenpeace_Report_Imaginary_Trees_Real_Destruction_March_2018.pdf (accessed on 20 January 2020).
- Dittmar, H.; Perazzoni, F. Desmatamento Ilegal na mira da Polícia Federal. Perícia Federal 2011, 28, 19–22. [Google Scholar]
- Stone, T.; Lefebvre, P. Using multi-temporal satellite data to evaluate selective logging in Para, Brazil. Int. J. Remote Sens. 1998, 19, 2517–2526. [Google Scholar] [CrossRef]
- National Geospatial-Intelligence Agency (NGA). National System for Geospatial Intelligence (GEOINT) Basic Doctrine; National Geospatial-Intelligence Agency: Springfield, MA, USA, 2006. Available online: http://www.fas.org/irp/agency/nga/doctrine.pdf (accessed on 20 January 2020).
- Conselho Estadual de Meio Ambiente do Estado do Amazonas (CEMAN). Resolução N.º 30 de 31 de Outubro de. 2018. Available online: http://meioambiente.am.gov.br/wp-content/uploads/2018/02/30.-RESOLUÇÃO-N°-30-PMFS.pdf (accessed on 12 December 2019).
- Souza, C., Jr.; Barreto, P. An alternative approach for detecting and monitoring selective logged forests in the Amazon. Int. J. Remote Sens. 2000, 21, 173–179. [Google Scholar] [CrossRef]
- Asner, G.; Keller, M.; Pereira, R.; Zweede, J. Remote Sensing of selective logging in Amazonia Assessing limitations based on detailed Field observations, Landsat ETM+, and textural analysis. Remote Sens. Environ. 2002, 80, 483–496. [Google Scholar] [CrossRef]
- Asner, G.; Knapp, D.; Broadbent, E.; Oliveira, P.; Keller, M.; Silva, N. Selective logging in the Brazilian Amazon. Science 2005, 310, 480–482. [Google Scholar] [CrossRef] [PubMed]
- Graça, P.A.; Santos, J.R.; Soares, J.V. Desenvolvimento metodológico para detecção e mapeamento de áreas florestais sob exploração madeireira: Estudo de caso, região norte do Mato Grosso. In Proceedings of the Anais XII Simpósio Brasileiro de Sensoriamento Remoto INPE, Goiânia, Brazil, 16–21 April 2005; pp. 1555–1562. [Google Scholar]
- Monteiro, A.; Souza, C., Jr. Imagens de Satélite Para Avaliar Planos de Manejo Florestal; Imazon: Belém, Brazil, 2006. [Google Scholar]
- Monteiro, A.; Souza, C., Jr. Fotografias hemisféricas para validar o monitoramento da qualidade do manejo florestal na Amazônia Legal. In Proceedings of the Anais XVI Simpósio Brasileiro de Sensoriamento Remoto, INPE, Natal, Brazil, 25–30 April 2009; pp. 6013–6020. [Google Scholar]
- Cardoso, G.F.; Costa, J.A.; Viana, J.S.; Tancredo, N.S. Uso de Imagens NDFI para Identificar Áreas de Exploração Irregular de Madeira em Ações de Fiscalização. In Proceedings of the Anais do XV Simpósio Brasileiro de Sensoriamento Remoto, INPE, Curitiba, Brazil, 30 April–04 May 2011; pp. 2856–2862. [Google Scholar]
- Dittmar, H. Aplicação do Índice de Vegetação por Diferença Normalizada (NDVI) em estudos de caracterização da vegetação. Perícia Fed. 2013, 31, 41–46. [Google Scholar]
- Pinage, E.R.; Matricardi, E.T. Detecção da Infraestrutura para Exploração Florestal em Rondônia Utilizando Dados de Sensoriamento Remoto. Floresta E Ambiente 2015, 22, 377–390. [Google Scholar] [CrossRef] [Green Version]
- Pantoja, N.V.; Higuchi, N.; d’ Oliveira, M.N. Detecção da exploração madeireira a partir de imagens Landsat e dados LiDAR no Sudoeste da Amazônia. In Proceedings of the XVIII Simpósio Brasileiro de Sensoriamento Remoto, Santos, Brazil, 28–31 May 2017. [Google Scholar]
- Associação de Polícias das Américas. Geonteligência no combate ao crime ambiental: O projeto GAGeo da Polícia Federal do Brasil. In Buenas Práticas; AMERIPOL: Bogotá, Colombia, 2015. [Google Scholar]
- Pereira, B.M. Uso de Geointeligência como ferramenta de investigação, pela Polícia Federal, nos crimes de desmatamento. Rev. Bras. De Ciências Polic. 2017, 8, 63–97. [Google Scholar] [CrossRef] [Green Version]
- United States Geological Survey (USGS). Earth Explorer. Available online: https://earthexplorer.usgs.gov/ (accessed on 20 January 2019).
- Instituto de Proteção Ambiental do Amazonas (IPAAM). Geodatabase of polygons of Sustainable Forestry Management Plannings (PMFS) in the State of Amazonas; IPAAM: Manaus, Brazil, 2017. [Google Scholar]
- Fundação Nacional do Índio (FUNAI). Shapefile of Brazilian Indigenous Lands; Ministério da Justiça: Brasília, Brazil. Available online: http://www.funai.gov.br/index.php/shape (accessed on 12 February 2019).
- Instituto Chico Mendes de Biodiversidade (ICMBIO). Shapefile of Brazilian Conservation Units; Ministério do Meio Ambiente: Brasília, Brazil. Available online: http://www.icmbio.gov.br/portal/images/stories/servicos/geoprocessamento/DCOL/dados_vetoriais/UC_fed_julho_2019.zip (accessed on 12 February 2019).
- Instituto Brasileiro de Geografia e Estatística (IBGE). Geociências. Available online: https://www.ibge.gov.br/geociencias/downloads-geociencias.html (accessed on 12 February 2019).
- Instituto Nacional de Colonização e Reforma Agrária (INCRA). Acervo Fundiário. Shapefile of Areas Destinated To Land Reform. Available online: http://acervofundiario.incra.gov.br/acervo/acv.php (accessed on 11 January 2019).
- Instituto Brasileiro do Meio Ambiente e dos Recursos Naturais Renováveis (IBAMA). Inspection Reports on Forestry Management Areas. Jan/01/2014 to Aug/21/2018; Ministério do Meio Ambiente: Brasília, Brazil, 2018.
- Polícia Federal do Brasil. Forensic Reports on Forestry Management Areas. Jan/200 to Aug/2017; Ministério da Justiça: Brasília, Brazil, 2012.
- Instituto Brasileiro de Geografia e Estatística (IBGE). Banco de Informações Ambientais. Projeto RADAM Brasil. Available online: Ftp://geoftp.ibge.gov.br/informacoes_ambientais/vegetacao/vetores/escala_1000_mil_radambrasil/ (accessed on 12 February 2020).
- Instituto Brasileiro do Meio Ambiente e Recursos Naturais Renováveis (IBAMA). Embargo and Administrative Fines Data. Jan/1996 to Dec/2017; Ministério do Meio Ambiente: Brasília, Brazil, 2018. Available online: https://servicos.ibama.gov.br/ctf/publico/areasembargadas/ConsultaPublicaAreasEmbargadas.php (accessed on 12 December 2019).
- Secretaria de Trabalho (STME). Administrative Fines Data; Ministério da Economia: Brasília, Brazil, 2019. Available online: http://cdcit.mte.gov.br/inter/cdcit/emitir.seam (accessed on 12 December 2019).
- Instituto Brasileiro do Meio Ambiente e Recursos Naturais Renováveis (IBAMA). Vehicles Authorized to Transport Forest Products in the Amazon and Their Carrying Volume Capacity; Ministério do Meio Ambiente: Brasília, Brasil, 2019.
- Instituto Brasileiro do Meio Ambiente e dos Recursos Naturais Renováveis (IBAMA). Sistema de Controle do Documento de Origem Florestal (SisDOF). Trade data on SisDOF for the State of Amazonas. Jan/01/2014 to Aug/21/2018; Ministério do Meio Ambiente: Brasília, Brazil, 2018.
- Kahaner, L. Competitive Intelligence: How to Gather, Analyze and Use Information to Move Your Business to the Top; Touchstone: New York, NY, USA, 1997. [Google Scholar]
- Meillón, S. Geospatial Intelligence and Geospatial Information Systems; NPS-Naval Postgraduation School: Monterey, CA, USA, 2008. [Google Scholar]
- Forest Stewardship Council. FSC. Available online: http://www.fsc.org (accessed on 20 January 2019).
- Mil Madeiras Ltd. Projeto do Plano de Manejo da Mil Madeiras; Mil Madeiras: Itacoatiara, Brazil, 2018. [Google Scholar]
- Clay, J.W.; Amaral, P. Madeira tropical sustentável de florestas naturais: O caso da Precious Woods. In Esverdeando a Amazônia; IIEB: São Paulo, Brazil, 2002; pp. 163–191. [Google Scholar]
- Franca, R.R.; Mendonça, F.A. A Pluviosidade na Amazônia Meridional: Variabilidade e Teleconexões Extra-Regionais. Confins, 29. 2016. Available online: http://journals.openedition.org/confins/11580 (accessed on 20 January 2019). [CrossRef]
- Fidelis, L.R.; Dittmar, H. Forensic Report # 120/2016-SR/PF/MA. Brazilian Federal Police; Setor Técnico Científico da Polícia Federal: São Luís, Brazil, 2016. [Google Scholar]
- Silva, Z.A. Raio Econômico como um Indicativo para a Definição de Concessões Florestais: Um Estudo de Caso no Estado do Acre; II Prêmio Serviço Florestal Brasileiro em Estudos de Economia e Mercado Florestal: Brasília, Brazil, 2015. [Google Scholar]
- Benford, F. The law of anomalous numbers. Proc. Am. Philos. Soc. 1938, 78, 551–572. [Google Scholar]
- Carnegie Institution for Science. CLASlite Software. 2013. Available online: http://claslite.carnegiescience.edu/en/about/software.html (accessed on 2 September 2019).
- Asner, G.P. Biophysical and biochemical sources of variability in canopy reflectance. Remote Sens. Environ. 1998, 64, 234–253. [Google Scholar] [CrossRef]
- Rouse, J.W.; Haas, R.H.; Schell, J.A.; Deering, D.W. Monitoring vegetation systems in the Great Plains with ERTS. In Proceedings of the Third ERTS Symposium, SP351 Goddard Space Flight Center, Washington, DC, USA, 10–14 December 1973; pp. 309–317. [Google Scholar]
- Shimabukuro, Y.E. Shade Images Derived from Linear Mixing Models of Multispectral Measurements of Forested Areas. Ph.D. Thesis, Colorado State University, Fort Collins, CO, USA, 1987. [Google Scholar]
- Miller, S.J. Excel Program to test for Benfordness. 2015. Available online: https://web.williams.edu/Mathematics/sjmiller/public_html/benford/chapter01/MillerNigrini_ExcelBenfordTester_Ver401.xlsx (accessed on 20 February 2020).
- Hales, D.N.; Sridharan, V.; Radhakrishnan, A.; Chakravorty, S.S.; Siha, S.M. Testing the accuracy of employee-reported data: An inexpensive alternative approach to traditional methods. Eur. J. Oper. Res. 2008, 189, 583–589. [Google Scholar] [CrossRef] [Green Version]
- Nigrini, M. A taxpayer compliance application of Benford’s law. J. Am. Tax. Assoc. 1996, 1, 72–91. [Google Scholar]
- Amaral, F. Introdução à Ciência de Dados: Mineração de dados e Big Data; Alta Books: Rio de Janeiro, Brazil, 2016. [Google Scholar]
- Newcomb, S. Note on the Frequency of Use of the Different Digits in Natural Numbers. Am. J. Math. 1881, 4, 39–40. Available online: http://www.uvm.edu/pdodds/files/papers/others/1881/newcomb1881a.pdf (accessed on 4 February 2020). [CrossRef] [Green Version]


| Component | Characteristics |
|---|---|
| Imagery | Visual record of any resource or environment (natural or man-made), its objects, and related activities that contain the respective geographic positioning data produced by satellites, aerial platforms, unmanned aerial vehicles (UAVs), or other similar means. |
| Image Intelligence | Technique of extracting useful information from the interpretation or analysis of images (for example: the use of digital image processing techniques, vegetation indexes, classifications, etc.) and collateral data (all that may contribute to the understanding and interpretation of images, including intelligence data and information from other sources). |
| Geospatial Information | Information related to the Earth’s surface that identifies the location, geometry, and attributes of environments, constructions, objects, resources or phenomena that occupy it (maps, statistical data, tables, digital files, geoprocessing operations etc.). |
| 1. Criteria For Spatial Data | Justification |
| 1.1 Total or partial overlap of PMFS area with protected areas | Illegal activity. |
| 1.2 Lack of infrastructure compatible with PMFS | Suspicious. PMFS demands adequate infrastructure of roads and storage yards. |
| 1.3 Clear cut inside PMFS or Permanent Preservation Areas | Illegal activity. |
| 1.4 Forestry activities in the area prior to licensing | Illegal activity. |
| 1.5 Further forest exploitation after the last DOF issuing | Illegal activity. |
| 1.6 Exploitation held outside the polygon boundaries | Illegal activity. |
| 1.7 Exploitation in area previous embargoed by IBAMA | Illegal activity. |
| 2. Criteria For Non-Spatial Data | Justification |
| 2.1 Product received after valid dates | Illegal activity. |
| 2.2 DOF Canceled | Suspicious. Possible fraud for the use of a single DOF and its forest credits to transport more than one cargo. |
| 2.3 DOF issued during rainy season (December to March [48]) | Suspicious. In the rainy season, logging and transport is not viable in many regions, once transport routes are largely unpaved and in poor traffic conditions. |
| 2.4 Suspicious volume declared | Unusual frequency of repetition of identical species and volumes may indicate simulated trade transactions in SisDOF [49]. |
| 2.5 Identity of Internet Protocol (IP) numbers | Suspicious. Operations in SiSDOF practiced both by seller and buyer companies sharing the same IP numbers in a short time interval may indicate simulated trade transactions, especially when combined with criteria 2.3, 2.4, 2.6–2.9. |
| 2.6 Price under R$66.00 | Suspicious. Prices under that amount can be an indication of fraudulent transactions for timber laundering. |
| 2.7 Volume declared is incompatible with vehicle | Declared volume in the DOF must attend the maximum load supported by the vehicle. |
| 2.8 Distance up to 200 km | Suspicious. The transport of roundwood for distances greater than 200 km, by road, proves to be economically unfeasible, due to the high cost of fuel [50]. |
| 2.9 Transport speed higher than 40 km/h | Suspicious. Transport routes in the region are largely unpaved and in poor traffic conditions |
| 2.10 Fines for irregularities in the SisDOF | Demonstrates past/present irregularities. |
| 2.11 Fines for irregularities in the PMFS | Demonstrates past/present irregularities. |
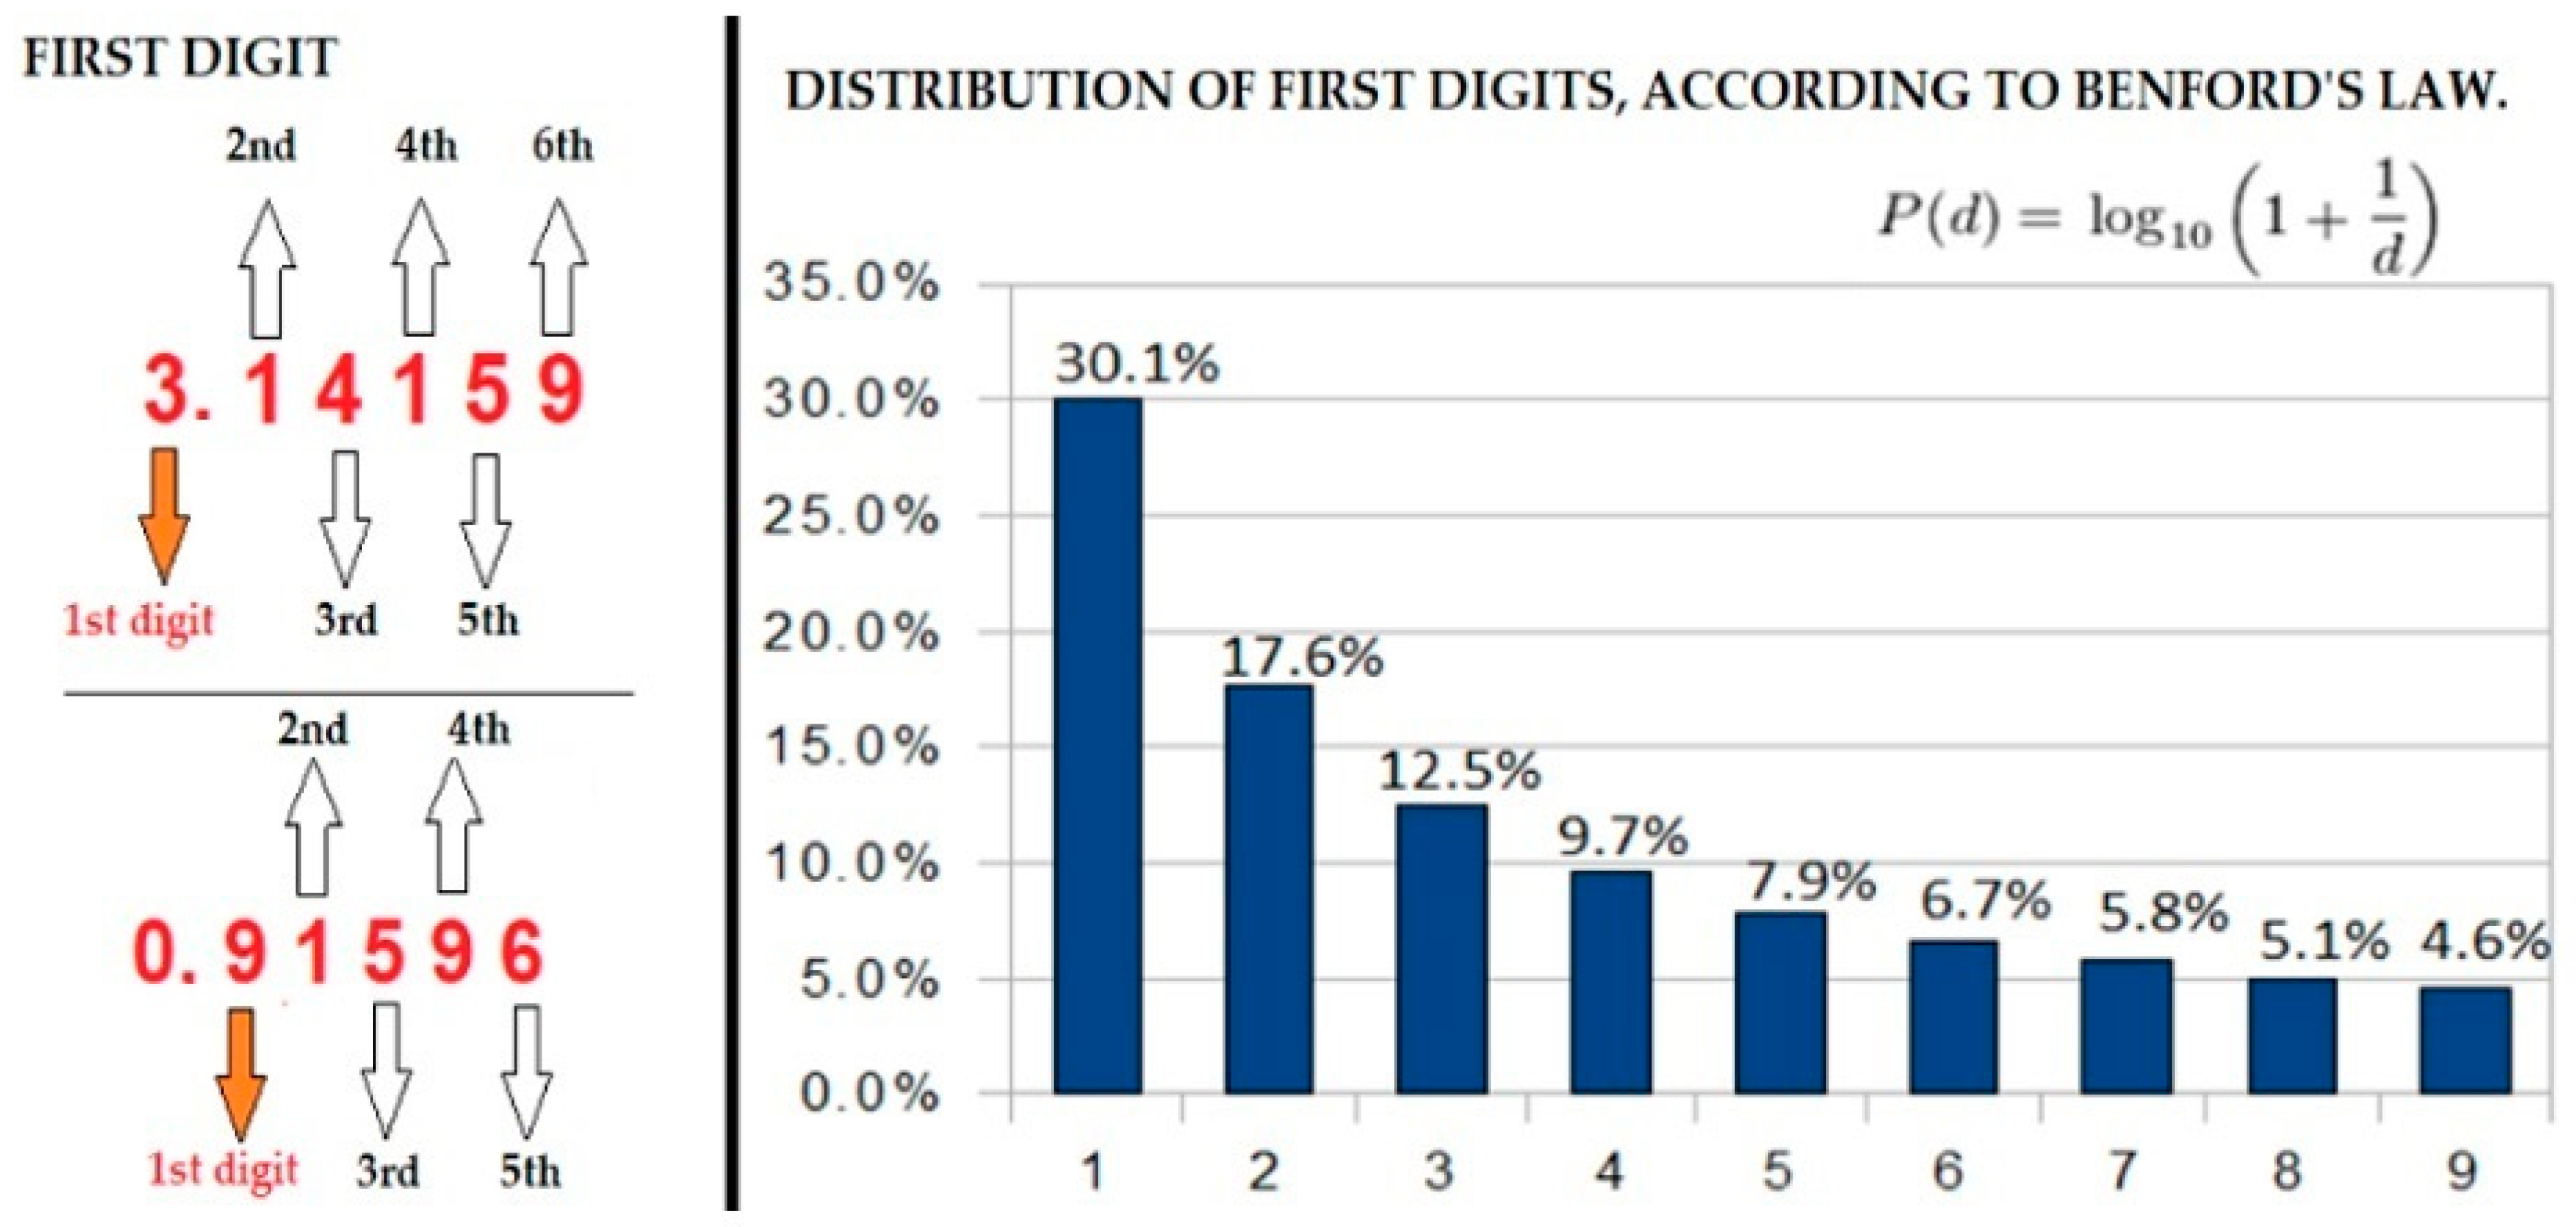
| 2.12 Irregularities related to the forestry inventory | It is possible to use the data from the RADAM project to assess whether the data on species and volumes presented in forestry inventories are consistent with those contained in the official survey [12]. In addition, the analysis carried out in this research indicates that the mathematical model of Benford [51], can also be very useful in the evaluation of forest inventories. |
| 2.13 Total volume traded identical to the authorized volume | Suspicious. Losses occurs during the process of forest exploitation (logs crack during the felling of trees), as also is common the presence of tree hollows not measured in the original forestry inventory. |
| 2.14 Fines for labor law violations | Demonstrates past/present irregularities. |
| 2.15 Exploitation intensity over 25 m3/ha | Illegal. The legislation of the state of Amazonas establishes that the maximum exploitation intensity of PMFS is up to 25 m3/ha [17]. |
| 1.Criteria For Spatial Data | f | % |
| 1.1 Total or partial overlap of PMFS area with protected areas | 8 | 10% |
| 1.2 Lack of infrastructure compatible with PMFS (courtyard and roads) | 20 | 24% |
| 1.3 Clear cut inside PMFS or Areas of Permanent Preservation (APP) | 36 | 43% |
| 1.4 Forestry activities in the area prior to licensing | 16 | 19% |
| 1.5 Further forest exploitation after the last DOF issuing | 4 | 5% |
| 1.6 Exploitation held outside the polygon boundaries | 42 | 51% |
| 1.7 Exploitation in area previous embargoed by IBAMA | 0 | 0% |
| 2.Criteria For Non-Spatial Data | f | % |
| 2.1 Product received after valid dates | 14 | 17% |
| 2.2 DOF Canceled | 17 | 20% |
| 2.3 DOF issued during rainy season | 20 | 24% |
| 2.4 Suspicious volume declared | 43 | 52% |
| 2.5 Identity of IP numbers | 67 | 81% |
| 2.6 Price under R$66.00 | 58 | 70% |
| 2.7 Volume declared is incompatible with vehicle | 3 | 4% |
| 2.8 Distance greater than 200 km | 3 | 4% |
| 2.9 Transport speed higher than 40 km/hour | 58 | 70% |
| 2.10 Fines for irregularities in the SisDOF | 5 | 6% |
| 2.11 Fines for irregularities in the PMFS | 6 | 7% |
| 2.12 Irregularities related to the forestry inventory | 45 | 54% |
| 2.13 Total volume traded identical to the authorized volume | 2 | 2% |
| 2.14 Fines for labor law violations | 1 | 1% |
| 2.15 Exploitation intensity over 25 m3/ha | 4 | 5% |
| Ranking | Criteria | f | % |
|---|---|---|---|
| 1st | 2.5 Identity of IP numbers | 67 | 81% |
| 2nd | 2.6 Price under R$66.00 | 58 | 70% |
| 2.9 Transport speed higher than 40 km/hour | 58 | 70% | |
| 4th | 2.12 Irregularities related to the forestry inventory | 45 | 54% |
| 5th | 2.4 Suspicious volume declared | 43 | 52% |
| 6th | 1.6 Exploitation held outside the polygon boundaries | 42 | 51% |
| 7th | 1.3 Clear cut inside PMFS or Areas of Permanent Preservation (APP) | 36 | 43% |
| 8th | 1.2 Lack of infrastructure compatible with PMFS (courtyard and roads) | 20 | 24% |
| 2.3 DOF issued during rainy season | 20 | 24% | |
| 10th | 2.2 DOF Canceled | 17 | 20% |
| 11th | 1.4 Forestry activities in the area prior to licensing | 16 | 19% |
| 12th | 2.1 Product received after valid dates | 14 | 17% |
| 13th | 1.1 Total or partial overlap of PMFS area with protected areas | 8 | 10% |
| 14th | 2.11 Fines for irregularities in the PMFS | 6 | 7% |
| 15th | 2.10 Fines for irregularities in the SisDOF | 5 | 6% |
| 16th | 1.5 Further forest exploitation after the last DOF issuing | 4 | 5% |
| 2.15 Exploitation intensity over 25 m3/ha | 4 | 5% | |
| 18th | 2.7 Volume declared is incompatible with vehicle | 3 | 4% |
| 2.8 Distance greater than 200 km | 3 | 4% | |
| 20th | 2.13 Total volume traded identical to the authorized volume | 2 | 2% |
| 21st | 2.14 Fines for labor law violations | 1 | 1% |
| 22nd | 1.7 Exploitation in area previous embargoed by IBAMA | 0 | 0% |
© 2020 by the authors. Licensee MDPI, Basel, Switzerland. This article is an open access article distributed under the terms and conditions of the Creative Commons Attribution (CC BY) license (http://creativecommons.org/licenses/by/4.0/).
Share and Cite
Perazzoni, F.; Bacelar-Nicolau, P.; Painho, M. Geointelligence against Illegal Deforestation and Timber Laundering in the Brazilian Amazon. ISPRS Int. J. Geo-Inf. 2020, 9, 398. https://0-doi-org.brum.beds.ac.uk/10.3390/ijgi9060398
Perazzoni F, Bacelar-Nicolau P, Painho M. Geointelligence against Illegal Deforestation and Timber Laundering in the Brazilian Amazon. ISPRS International Journal of Geo-Information. 2020; 9(6):398. https://0-doi-org.brum.beds.ac.uk/10.3390/ijgi9060398
Chicago/Turabian StylePerazzoni, Franco, Paula Bacelar-Nicolau, and Marco Painho. 2020. "Geointelligence against Illegal Deforestation and Timber Laundering in the Brazilian Amazon" ISPRS International Journal of Geo-Information 9, no. 6: 398. https://0-doi-org.brum.beds.ac.uk/10.3390/ijgi9060398