1. Introduction
To conduct an effective research activity, access to suitable data is necessary. There are many datasets related to the field of water management. It can be datasets for stream, rivers, and larger water bodies themselves, data regarding weather and rainfall, or soil in the riverbed. As stated by [
1], even data regarding the use of fertilizers on arable land in the areas surrounding water courses is essential for water pollution research. Therefore, the range of possible data may come from a wide variety of providers, some seemingly unrelated to water management.
The process of working with spatial data can be divided into four major steps [
2]: discovery, acquisition, management and analysis. Firstly, there is the discovery process, where scientists have to learn of the existence of a possible data source and locate it—whether it be on the Internet or by getting in touch with the organization, which provides said data. In this step, sources that aggregate open data are especially useful. One of such sources for European Union member countries are national geoportals tied to the INSPIRE Directive (Infrastructure for Spatial Information in the European Community) [
3]. Another option is a nationwide catalogue of open data. These alternatives often coexists, such is also the case of the Czech Republic, where both the INSPIRE Geoportal and National Catalogue of Open Data [
4] serve as primary options for data discovery.
Secondly, there is a process of data acquisition. On an intellectual property level, some data can be provided freely for anyone; sometimes there might be a registration process or license agreement requirement and a payment process in case the data is monetarily charged. The licensing requirements are generally in place to prevent sharing to third parties but can be also used in case it involves sensitive data. In some cases, datasets might be shared incompletely as a safety precaution. This means datapoints for certain locations or regions will be missing, especially when it comes to military areas, or areas that include critical country infrastructure such as nuclear powerplants, oil pipelines, etc. Then there is the actual data transfer process itself, from a technical perspective. Some data may be directly downloadable through a simple web browser; some may require advanced techniques of spatial data transferring. There is also the possibility of obtaining the data in person, in case the online publication availability is lacking for a particular dataset.
The data management step includes data storage, periodical updates if necessary and if the data was not provided in a format that is directly workable, adjustments have to be made to transform data into the format that is required. These transformations are often done utilizing tools available as part of GIS (geographical information system) software, but in cases of some niche data format, they may require dedicated software. For data where the spatial dimension is missing completely, the solution is generally a manual input of the data inside the GIS software. The last step of data analysis/processing includes the actual work with the data itself for the purposes it was obtained.
Spatial data can come in various formats. The type of format of data has important implications on both the provider of data and the final user. Different data formats utilize different types of data storage and transport. On the end user side, the variety of possible data format greatly influences the resulting usability of the data, since every user has access to different software and tools to process the data and many software solutions are the focus of a select few data formats. These interoperability issues are one of the common grievances during actual independent research, because they introduce an often-unnecessary overhead by forcing users to utilize a secondary solution to convert data into a format they can work with.
Many of the commonly used data formats are based on XML (extensible markup language). The standards and specifications for many of the various data formats are handled by OGC (Open Geospatial Consortium) which is the main authority when dealing with spatial data. The most commonly used vector data formats include [
5]: GML (geography markup language), KML (keyhole markup language), GeoJSON (JavaScript object notation), ESRI Shapefile, a proprietary format of the ESRI (Environmental Systems Research Institute) company, and GPX (Global Positioning System Exchange Format). The most used raster formats are JPEG (joint photographic experts group), TIFF and GeoTIFF (tagged image file format).
When it comes to the data acquisition, there are several common approaches. One of the simplest solutions would be to provide the data files directly for download in their original form, using the common FTP (file transfer protocol). Another option to share geospatial data are the following three web services: WMS (Web Map Service), WFS (Web Feature Service) and WCS (Web Coverage Service). These services have their standards maintained by the OGC [
6] and are essential in providing access and visualization to geospatial data [
7]. WMS utilizes a HTTP (hypertext transfer protocol) for the exchange of geographical data in raster format. A user sends a request for data and the WMS responds with an image, which is usually a JPEG or PNG (Portable Network Graphics). One of the most important features of this service is the ease of use. It can be used in both online solutions with various geoportals but also as a source of data for end users. Most desktop software GIS can establish a WMS connection to databases using a simple link copied from a website of the data provider and import an entire layer of spatial data into the map composition. However, this service has a crucial disadvantage for researchers, which is the fact that WMS does not provide the user with the actual data behind the image. Any user can, therefore, display the map layer as whole or not display it at all. It is not possible to process and analyze the data. Queries are not possible and the option to further process and analyze the data is almost non-existent. The WMS is, therefore, more suited for the public and not for experts in research. The WFS works on same general principles, but instead of sending a raw raster image to the data recipient it sends the actual data instead, usually in GML format [
8]. The WCS is the most complex of the three services. It allows for advanced querying and can, therefore, send only a portion of the data. Unlike the WFS which only sends raw GML data, the WCS enhances the data with metadata, descriptions, and semantics to improve client-side rendering and processing of the data. Out of these three main services, WMS is the most widespread, but it is the least usable one for research and spatial planning purposes [
9].
The main sources of datasets for water research purposes are usually governmental organizations since private companies do not tend to freely share their data. Depending on the level of sophistication of a given country’s information technology strategy and policy, the data discovery process itself can be quite tedious, as pointed out by [
10]. If a country is missing strong central authority to establish and enforce a unified open data sharing policy, the heterogeneity of approaches employed by various institutions is likely going to foster an open data landscape that is very hard to navigate by end users. An alternative to using existing open data sources is utilizing solutions based on networked internet of things (IoT) devices with appropriate sensory equipment. Research endeavors regarding water management entail measurements of precipitation, temperature, and flow rate. As shown by [
11], several devices can be set up within a river basin to capture not only the final outputs at a confluence, but also the entire development of the water stream.
Our case study was conducted in Vysočina region (south-east from the Czech capital city Prague). We have focused on Bořetický stream watershed with several smaller streams leading into it. It is a small part of watershed that supplies the drinking water reservoir Švihov on Želivka river, which is the main source of drinking water for the capital city Prague. We monitored water quality levels and conducted a statistical factor analysis to determine which watershed factors contribute to monitored pollution indicators. However, in this paper, we would like to focus mainly on our usage of sensory data and open data repositories, especially what type of data were required, where we obtained them, how and if we had to transform these data. Therefore, this paper provides only a concise description of how we calculated watershed factor values that served as an input for statistical analyses to evaluate the impact on water quality indicators. This hands-on experience with a model research project will help us draw relevant conclusions about general levels of accessibility and usability of open data in the field of water management in the Czech Republic.
2. Materials and Methods
The overall process of analyzing diffuse water pollution starts by data collection and preparation. More specifically, it is necessary to gather baseline data. For in situ measurements and observations, IoT devices can be utilized. Repositories of open data, such as hydrological maps, elevation models, soil maps can be accessed if available for a given region. Based on the available data, with regards to the data format and software compatibility, a GIS software is selected to conduct the spatial data processing. The outputs are then further analyzed using statistical modelling (multi-factor regression). In this section we would like to outline this overall diffuse pollution research in detail to establish and justify why we required certain datasets. The process of data discovery and acquisition as well as review of the available open data repositories in the Czech Republic is covered further in the Results section.
2.1. Model Watershed Delineation
For the purposes of our case study, a micro-catchment area with a network of monitoring profiles was selected to easily determine the direct pollution input of a populated area (only few small point sources). A GIS software application was utilized to delineate the catchment area boundaries for each profile. We utilized two main approaches: for bigger streams (I–IV in the Strahler scale), where the sampling point was near a confluence, we were able to use publicly available hydrological watershed boundaries from DIBAVOD (Digital Base of Water Management Data) [
12]. For streams that are smaller or in cases where the sampling location was too far from a confluence, we had to delineate the boundaries manually (according to contour lines). During our research we worked with two GIS applications: ArcGIS, which is a very prominent GIS software solution; and BNHelp, a GIS application that utilizes HSLayers, a modified version of OpenLayers library. BNHelp solution also provides a web-based client for remote work.
Another possible solution for watershed delineation would be to utilize a DEM (digital elevation model) as most GIS applications have the necessary tools (either in the base version or as an add-on toolbox) to delineate a custom watershed area from a DEM for a given catchment point. In the Czech Republic, the best freely available DEM is part of the ArcČR 500 map set [
13]. However, this DEM was constructed from a 50 m contour line basemap; therefore, the size of one pixel is 50 × 50 m, which is not detailed enough for small basins. Compared to manual delineation, using this raw DEM produced a higher level of inaccuracies. For better results, a higher resolution DEM would be required. There are two possible models available, the 4th and 5th generation DEMs, both from the Czech Land Surveying and Cadastre Department [
14], but both are costly. Even for the small micro-catchment area that was selected for our research, the price would be at least EUR 400 for the 4th-generation model and EUR 1250 for the 5th-generation model.
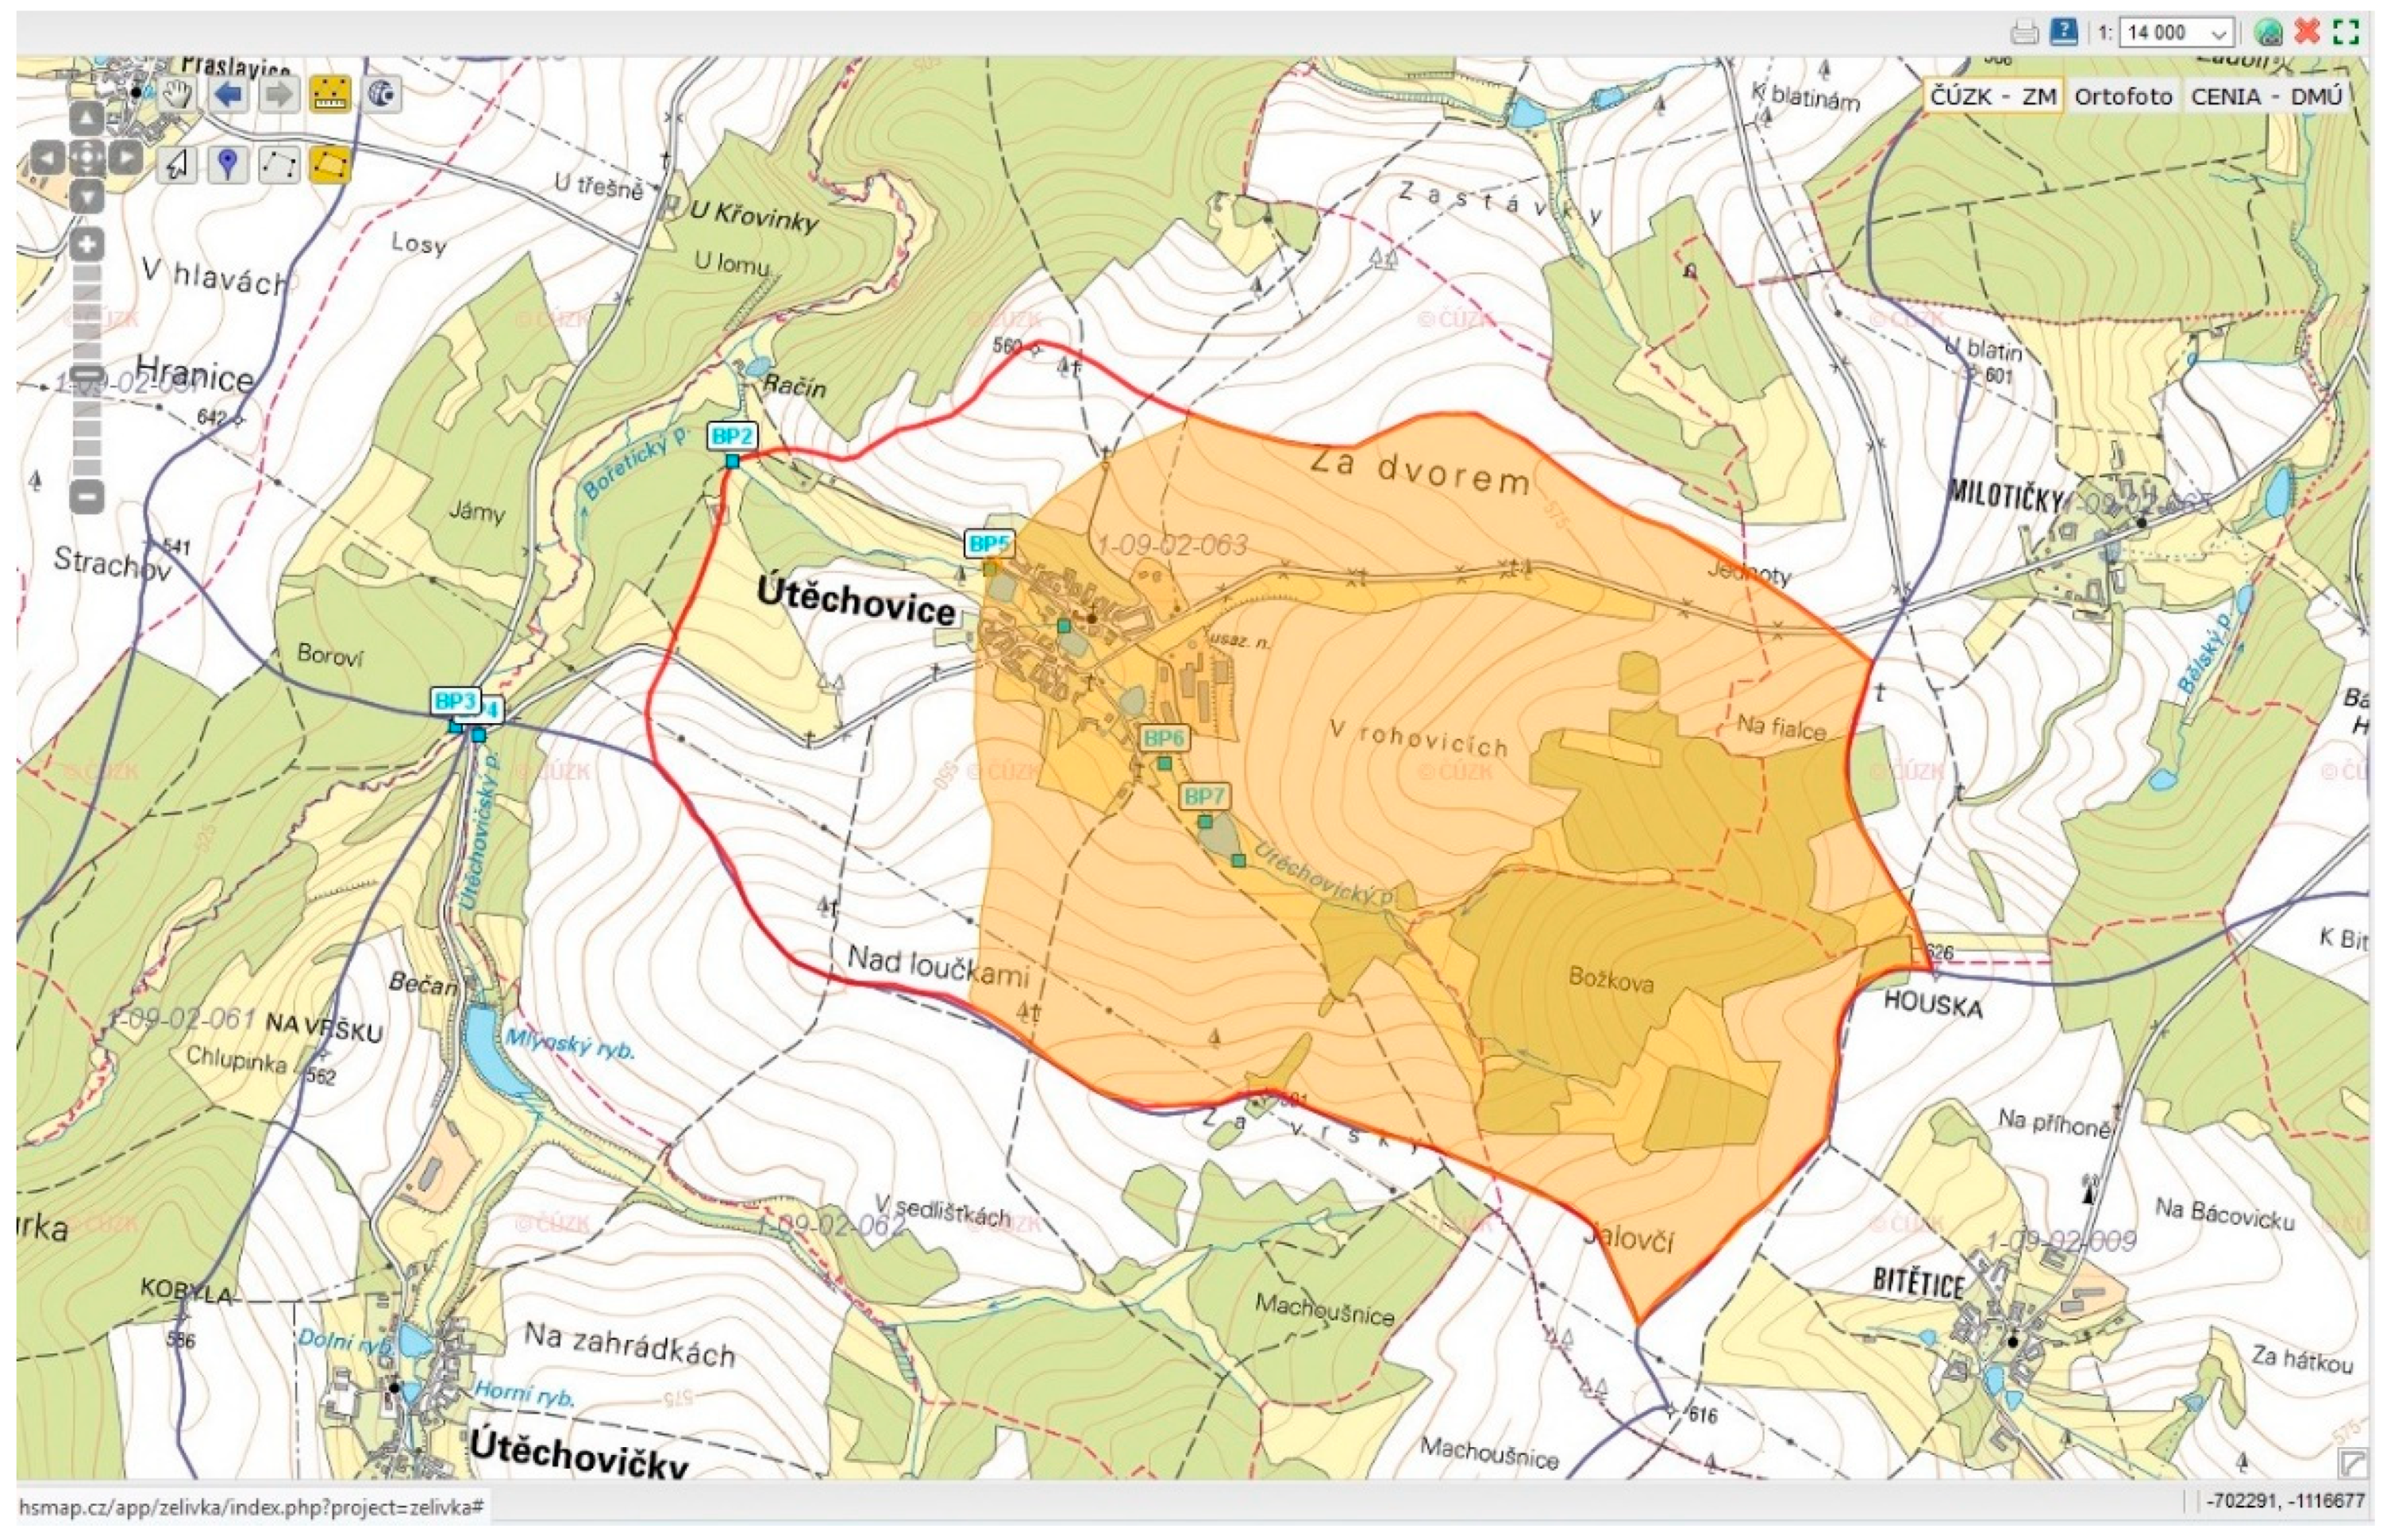
An example of the manual approach is shown in
Figure 1–the delineation of watershed boundaries/areas in the BNHelp GIS application for two of the selected profiles on Útěchovický stream, which is too small to be included in the DIBAVOD watershed boundaries dataset. Profile BP2 boundaries are displayed by a thick red line, the profile BP5 area is displayed with orange fill color.
2.2. Water Monitoring
Several key pollution indicators were selected, such as ammoniacal nitrogen, nitrate nitrogen, molybdate reactive phosphorus and COD
Cr (chemical oxygen demand—potassium dichromate method). This selection was in accordance with the established knowledge about the main organic and nutrient water pollution sources and resulting eutrophication [
15,
16,
17]. Water samples were taken monthly on each selected water profile for three years. Samples were analyzed using available test-tube methods within conjunction with photo spectrometry methods according to [
18]. Meteorological data such as daily temperatures and sum of daily rainfall, therefore, had to be recalculated into monthly averages to match the water sample periodicity. Water flows were calculated using a hydrological analogy. Direct flow measurements were conducted only during major precipitation-runoff events.
Apart from obtaining these datasets from official sources (Czech Hydrometeorological Institute), there is also a possibility to utilize networked IoT devices. For precipitation, temperature, and water flow there are fully operational devices available. Alternatively, a custom device can be built using a basekit with a conjunction of corresponding sensors. These custom devices can potentially be cheaper than solutions on the market, especially when scaling up the number of units deployed, but it requires expertise and lot of effort for the initial setup and calibration. In case of research that does not focus on the pollution factors but just on measuring the volume of pollution, a turbidity sensor can be used as proposed by [
19] to create an all-in-one measuring device.
Considering our model research was very small scale, we did not require data from multiple locations. Therefore, utilizing networked sensors was for our purposes unnecessary. We decided to purchase a single-unit measuring device to obtain the weather data, specifically a wireless meteorological station Conrad Electronics RW 53, WH 5300 from the Conrad company. The cost of this device was approximately 80 EUR.
The other option would be to purchase this data from Czech Hydrometeorological Institute. It provides a selection of data for free (from measuring stations near larger cities and on selected spots), but for data at a custom location a special commission would have to be arranged. Based on data available from a publicly available contract database, we were able to ascertain that both the precipitation data and temperature data would cost at least 50 EUR each for every year.
2.3. Pollution Factors
For each catchment profile, we also compiled a database of anthropogenic factors separated into three thematic groups: human settlement indicators, land-use categories, and agricultural production.
The main human settlement indicators were population density, volume of communal wastewater production and treatment. The number of residents living inside a delimited watershed under each profile was calculated manually. A list of city and village names was compiled from the topographic baseline map for each given profile. We then used data sources available to the public to determine the number of residents for each settlement. The data sources we used were the official population data from Czech Statistical Office as well as their local branch offices in combination with PRVKÚK (Regional development plan of water supply and wastewater treatment). Luckily, both sources provided sufficiently detailed and recent data for the area that our case study dealt with. In many other Czech regions, data about small settlements is not so easily available.
A second group of factors were acreages and percentages of all land-use categories in every model watershed within the water-quality monitoring profile. The open data repository we used for this part was the LPIS (Land Parcel Identification System), which is an information system operated by the Ministry of Agriculture. It includes a database of all registered parcel blocks with agricultural land. There are distinguished categories of arable land, permanent grasslands, other arable land cultures, and pastures. It also contains several other key information datasets for each parcel such as altitude and gradient. The data provided is downloadable free of charge and is stored in .shp layers for every cadaster territory in Czech Republic. Therefore, we first had to create an intersection of our profile boundaries with the cadaster territory map (provided within the ArcČR dataset) inside our GIS software to determine which cadasters we need to download from LPIS. After inserting and merging all the LPIS layers and intersecting it with our profiles, we could calculate the ratio of all land-use categories in our selected areas. For the calculation of the ratio of forests within model areas, we used the same approach, except the source data was the freely available GIS layer CORINE (Coordination of Information on the Environment) Land Cover 2000. To calculate the ratio of built-over areas and water surface areas, we had to delineate them manually from a topographic map. For several larger settlements, the data about built-over area was available within the Czech Statistical Office datasets (land-use categories acreage in all cadasters—data in tables are downloadable for free in .xls format).
Lastly, we conducted a monitoring of agricultural production in the area. During each agricultural production cycle, we determined which crops were being grown on arable land parcels within a model watershed on major agricultural holdings, because changes in crop variability between years can influence the resulting nutrient pollution considerably, especially for small water streams.
We analyzed all acquired data to evaluate impact of various natural and anthropogenic factors within the model watershed (population, land-use categories, agricultural production, and meteorological data) on selected indicators of water quality on monitoring profiles. Concrete results of this analysis are going to be published in a separate follow-up paper, which will be focused more on the actual values of measured data, their statistical analysis, and implications resulting from our observations/measurements.
3. Results
In the Czech Republic, most open data come from sources within the administrative bodies of the government such as ministries, research institutes under the purview of ministries, or organizations tied to various governmental institutions. The large number of data sources and the resulting fragmentation of open data in Czech Republic has a historical context; even as early as the mid-2000s there were reports [
20] about the decentralized character of data providers that stressed the necessity for a more generalized catalogue of open data. It was asserted by [
21] that this system has its advantages in terms of maintaining validity of the data through regular updates, since each provider is only responsible for the management of their own small section of the overall open data landscape. However, this comes at a cost of lower discoverability of data sources and forces researchers to know which data sources exist and where to look for them. This introduces an overhead to every research endeavor, because prior to research, subjects must conduct an exhaustive discovery process to locate all possible data sources. For this purpose, several user-driven open data source compilation web sites have emerged that are trying to keep an up to date lists of data locations.
The official aggregation site for open data in the Czech Republic is the National Catalogue of Open Data. It has been established only recently (during 2015) and most Czech institutions did not adopt publishing their open data in this catalogue immediately. The amount of available data is, therefore, still increasing as more organizations take part in the effort of opening data, so the situation is improving. However, there are several issues that are reducing the usability of this catalogue. Firstly, it includes both spatial and non-spatial data without the option to filter one type or the other. It includes filter by file format, so data in KML or GeoJSON can be assumed to have a spatial nature. But many spatial data files, especially those originally in .shp file format, are provided as .ZIP, making it impossible to distinguish them from non-spatial .ZIP data. However, as pointed out by [
22], non-spatial data can be enhanced with spatial features, so all data within the catalogue is potentially valuable and cannot be discarded outright during the data discovery process based on the data format alone. Therefore, the fact that raw machine-readable data are published in the same manner as data files that deal with transparent administration such as public procurements, contracts, retainers, and incentives are cluttering the system and reducing the discoverability of pertinent datasets.
A second major issue with the catalogue is caused by the overall heterogeneity of the datasets as well as approaches taken by individual data providers. Some institutions share country-wide data, some datasets are separated by regions, and some are split into tens of thousands individual datasets based on municipalities (each village has its own dataset). This means that a dataset including information pertinent to the whole country can be potentially buried in the middle of thousands of other files that are focused on a small location.
Another prominent data source is the INSPIRE Geoportal since it aggregates data from many organizations within Czech Republic. It is based on the 2007/2/ES INSPIRE European directive [
3], which aims to establish a European spatial data infrastructure (SDI), that will provide high-quality standardized data to support strategic environmental policies. Most standards that are used within INSPIRE fall into the ISO (International Organization for Standardization) 19,100 series, maintained by corresponding ISO Technical Committee [
23] The Czech INSPIRE is managed by CENIA (Czech Environmental Information Agency) which is part of the Ministry of Environment. In its current state, the geoportal has its own web map application for displaying maps and layers as well as WMS that provides the same data. Currently available datasets include the orthophoto map (current and historical), digital terrain model, military maps, topographic map, real estate, land cadaster map and ZABAGED (Fundamental Base of Geographic Data). The datasets are enhanced by rich metadata, which allow for filtering using a lot of parameters, such as source, time-frame, topic, location, type of service and others. The availability of metadata plays a key role during the data discovery process, which further distinguishes INSPIRE from other data sources and emphasizes its significance in the Czech open data environment.
ZABAGED is a baseline set of maps provided by the State Administration of Land Surveying and Cadaster. Among others, it includes maps regarding territorial units, buildings and roads, vegetation and land surface, terrain and geodetic points, and distribution networks and pipelines. The department runs its own geoportal with the ZABAGED maps in it, but they are also provided inside the INSPIRE Geoportal as well as in WMS and WFS forms.
LPIS is a land evidence geographical information system operated by the Ministry of Agriculture and is mainly used by farmers to input data about fertilizers, pesticides and other preparations they use for agricultural production (in order to be eligible for state-level or European subsidies). The LPIS is one the most advanced systems in terms of data sharing since it has many options how to provide data. Apart from having its own web GIS interface, the data are also available in both WMS and WFS forms as well as a direct download in .shp files. LPIS is linked to Common Agricultural Policy (CAP) payments and is, therefore, implemented in every European Union (EU) country. Apart from the required functionalities [
24], each member state has full control over their LPIS, resulting in differences between countries. The Czech LPIS has extensive public access, allowing users to view and download a large portion of the included data.
DIBAVOD is a set of maps compiled by the T.G.M. Water Research Institute. This set of maps contains mostly data about watercourses and watershed areas and serves as baseline for water related layers in ZABAGED. The whole DIBAVOD set or its parts can be downloaded on the Institute’s website in .shp format.
VÚMOP (Research Institute for Soil and Water Conservation) provides a set of maps regarding soil structure, density, erosion vulnerability, water capacity and others. Until recently, users had to formally request the data and received them on a CD/DVD disk, but the institute is currently moving towards adopting the WMS method of sharing for more of its datasets.
The Czech Hydrometeorological Institute provides data regarding weather, including rainfall. Data are available for download after filling in a short form and a license agreement. Most of the data are in .csv of .xls formats and it is, therefore, necessary to process the data to convert them into a suitable geospatial format. Among all the available data considered for research in the water management sector, the hydrometeorological dataset are the most suitable to be obtained utilizing IoT devices. Sensors that measure temperature, humidity and precipitation are available on the market. Implementing a custom-built network of devices is very likely to provide more precise data than the institute due to the localized nature of IoT deployment (sensors directly where they are needed instead of having to use data from closest meteo-station operated by the institute, which can be several kilometers away).
The Czech Statistical Office collects primarily data regarding trade, economic and industrial activity, demographics, and wages and so on. Many of those datasets are not directly linked to water management, but some are quite important (for instance, population density). However, the Czech Statistical Office does provide such data in a spatial form for fee. Free data are only provided in .xls files. Additionally, a lot of statistical data are mainly summarized and presented to public in relation to local authorities, cadasters, as regional statistics etc., therefore necessitating double manual data conversion: one conversion from tables to spatial data and secondly an integration of data over several smaller cadasters, counties, or regions.
Apart from what datasets are available and the form they take, another important aspect, especially when it comes to small-scale independent research, are the associated costs. The access to INSPIRE in the Czech Republic is without charge. Any user may display available map layers in the online Geo Portal or use WMS to display raster images in their personal GIS software. Additionally, users may register on the website which gives them access to more features, such as creating and saving their own map compositions [
25]. However, the actual raw data is not available. As part of the INSPIRE directives, such data are freely available to other public institutions that request it, but not to the public. This is a common theme even with the other data sources. The general rule is that governmental institutions share the data between themselves but require a fee when providing them to outside recipients. This is also the case with ZABAGED and other datasets provided by the Land Surveying and Cadaster Department, which only allows downloading their data after a payment (depending on the dataset usually payments per square kilometer or per 5 × 5 km square). Similarly, VÚMOP has most of their datasets locked behind a paywall as well. Data from Czech Hydrometeorological Institute have an associated fee as well, but the Institute also provides licensing options with discounts for researchers and students. There are several exceptions to the general payment schemes: LPIS allows free unlimited downloading of their source data in .shp format through a simple web interface and the DIBAVOD maps are available for download free of charge as well.
For certain datasets (in our case temperature, precipitation, and water flow) there is an alternative to the existing open data repositories and that is utilizing IoT devices for measurement. A network of sensors has the inherent advantage of low upkeep costs, higher data accuracy thanks to the localized nature, as well as customizable data velocity. These advantages are offset by higher initial costs and the required work and expertise needed to set up and calibrate the network. In the Czech Republic there are several network providers who offer services specialized to the IoT area. Sigfox is provided by SimpleCell Networks corp. LoRaWAN (long-range wide area network) is provided by the Semtech corp. in cooperation with Czech Radiocommunications. Third major technology available at the Czech market is NB-IoT (narrow-band IoT), based on the LPWA (low-power wide area), provided by mobile operator Vodafone. A common problem across these providers is that they mostly focus on implementations inside buildings, or when it comes to outdoor applications, the emphasis is on municipal areas. It is possible to find ready solutions for building monitoring, company property monitoring (for instance car park administration), factory production optimization, or smart households. Research conducted in the countryside would probably require negotiating a custom solution, especially with the regards to the potential unavailability of network coverage in the rural areas.
4. Discussion
The current situation of data accessibility for research purposes is undesirable in many aspects. The most used approach for data sharing is WMS, which is by its nature unsuitable for use in further research. Some data are available in WFS format or directly for download, but for the most part the cost of such data is too high for a typical small-scale research budget. This gives an advantage to larger, well-funded research subjects or those linked to various ministries or departments who can obtain the data for free as part of co-operative projects, state funded studies etc.
One of the major issues is also the decentralized nature of open data providers, where each institution creates datasets according to their individual know-how. There is a significant lack of aggregation of available open data, especially in the agricultural sector [
26]. There is a continuous effort for technological improvements for the available datasets as part of the INSPIRE initiative—such as incorporating linked data and increasing machine readability [
27]. Therefore, as the technological and quality requirements increase on the front end (INSPIRE Geoportal), the individual back-end provider institutions are expected to eventually adopt the new standards as well, hopefully resulting in better homogeneity of available open data in the near future.
The Czech Republic is currently in a good position as far the actual data content is concerned. Most of the datasets that are important for research in water management do exist or are being actively developed. There are possible improvements in terms of non-spatial data being reworked in proper map layers on a provider level, thus reducing costs for the end users (by eliminating the need for research teams to hire a GIS specialist to manually process the data into usable formats). The availability of open databases with data in suitable formats is also a key prerequisite for development of decision and information support systems in the agricultural area.
New datasets can also be created on a custom basis, utilizing IoT devices. High volumes of data coming from a wide range of networked sensors promise an overall improvement in data coverage, periodicity, and level of detail. But there are also limitations in the overall scale by which IoT can be deployed as well as the initial costs. Other developments could come from the field of remote sensing, which might be able to provide new avenues for water-quality monitoring [
28]. However, it is uncertain whether the current institutional capacities, both in hardware and manpower, are going to suffice to process such volumes of data effectively in order to provide them to the general public for reasonable costs or free of charge.


