Article

Supporting SDG 15, Life on Land: Identifying the Main Drivers of Land Degradation in Honghe Prefecture, China, between 2005 and 2015

1
Aerospace Information Research Institute, Chinese Academy of Sciences, Beijing 100101, China
2
EnviroSPACE Laboratory, Institute for Environmental Sciences, University of Geneva, Bd. Carl-Vogt 66, 1205 Geneva, Switzerland
3
GRID-Geneva, Institute for Environmental Sciences, University of Geneva, Bd. Carl-Vogt 66, 1205 Geneva, Switzerland
4
Department F.-A. Forel for Environmental and Aquatic Sciences, University of Geneva, Bd. Carl-Vogt 66, 1205 Geneva, Switzerland
5
Honghe Tobacco Company, Mile 652399, China
*
Author to whom correspondence should be addressed.
ISPRS Int. J. Geo-Inf. 2020, 9(12), 710; https://0-doi-org.brum.beds.ac.uk/10.3390/ijgi9120710
Submission received: 11 August 2020 / Revised: 10 November 2020 / Accepted: 23 November 2020 / Published: 27 November 2020

Abstract

:
The essence of the 2030 Agenda for Sustainable Development adopted by the United Nations is described in 17 Sustainable Development Goals (SDGs). SDG 15 focuses on Life on Land, in other words, terrestrial biodiversity and ecosystems, as well as their services. Land degradation is a severe anthropic and natural phenomenon that is affecting land use/cover globally; therefore, a dedicated target of the SDG 15 (the indicator 15.3.1) was proposed. The identification of the areas where land degradation has occurred and the analysis of its drivers allow for the design of solutions to prevent further degradation in the studied areas. We followed the methodology proposed by the United Nations Convention to Combat Desertification (UNCCD) to study the land degradation in the Honghe Prefecture in southwest China between 2005 and 2015. Through spatial analysis, we found that the degraded areas were consistent with the areas of active human activities (such as urban centers), while the impact of natural factors (such as disasters) on land degradation existed in small areas at high altitudes. Land degradation was affected primarily by the loss of land productivity and secondly by land cover changes caused by the growth of artificial areas. Changes in the soil organic carbon were not significant. We concluded that human activity was the main driver of land degradation in Honghe Prefecture. Decision makers should work to find a balance between economic development and environmental protection to restore degraded land and strive to achieve a land degradation-neutral prefecture to defend all ecosystem services.

1. Introduction

The United Nations (UN) adopted the 2030 Agenda for Sustainable Development in September 2015 [1]. The Sustainable Development Goals (SDGs) are a collection of global goals designed to be a “blueprint to achieve a better and more sustainable future for all” that includes 17 goals, 169 targets, and over 230 indicators. Increasing institutions and scholars have begun to study and evaluate the progress of different targets in different countries, working together to achieve the goals set by the UN to ensure a greener growth and a more sustainable development of the planet. Several countries on all continents have begun to evaluate SDG indicators based on statistical and earth observation data [1,2,3,4,5,6].
Life on land (SDG 15) focuses on better managing forests, combating desertification, halting and reversing land degradation, as well as halting biodiversity loss. SDG 15.3.1 takes the proportion of land that is degraded over the total land area as an indicator [7]. Land degradation is one of the important issues faced by mankind to secure the provision of natural resources and ecosystem services [8]. The factors affecting land degradation include natural and anthropogenic processes. Natural factors mainly include geology, geomorphology, climate, hydrology, vegetation, and natural disasters [9]. Anthropogenic factors include urbanization, population migration, poor land-use planning, and various wastes or pollution caused by economic development. Land degradation is a long-term process that requires approved and standardized methods for its monitoring as well as a large amount of data. The United Nations Convention to Combat Desertification (UNCCD) provides guidance to calculate the proportion of degraded land [10,11,12].
The global report from UNCCD showed that a total of 127 countries reported quantitative information on SDG indicator 15.3.1 in 2018 [13]. The data reported cover approximately 61% of the total global land area. A total of 84 countries utilized the entire SDG 15.3.1 assessment methodology, which consists of all three sub-indicators on land cover, land productivity and carbon stocks and the “one out, all out” approach in determining degradation status, while a few used customized or unspecified methods. SDG 15.3.1 is conceptually clear [7], and had an internationally established methodology; however, data are not regularly produced by countries [5,10,14], in particular, by the developing countries.
Long-term series of satellite images are important data sources for assessing land degradation at different scales. The development of data sharing practices and open-source software facilitates the computation of indicators. The United States Geological Survey (USGS), the European Space Agency (ESA), the United States Department of Agriculture (USDA), and other agencies provide data to evaluate land degradation. Google Earth Engine (GEE), Amazon Web Services (AWS), and other platforms provide data processing capacities that enable the fast processing of large amounts of geospatial data.
Trends.Earth [15] is a result of the Global Environment Facility (GEF)-funded project “Enabling the use of global data sources to assess and monitor land degradation at multiple scales”. It is an open-source Quantum GIS (QGIS) plugin for monitoring and assessing land degradation following UNCCD guidance. This tool was utilized in several articles; for instance, on a national scale in Namibia [2]. Giuliani et al. introduced a solution to obtain SDG 15.3.1 indicators at the national level using Swiss Data Cube [5] and The Virtual Laboratory Platform (VLAB) [3].
For more than 20 years, international groups have performed scientific investigations regarding the land degradation in China. Treuner et al. developed the Final Classification Matrix (FCM) approach in the Sino-German national co-operation “Sustainable Development by Integrated Land Use Planning” (SILUP) and applied it in Jiangning County of China [16,17,18]. Liu et al. provided a county-level assessment on the plains of China [4]. City-level land degradation is absent but useful because it can explain some of the patterns between urban and rural areas, particularly in areas with uneven economic development. The study area we selected included seven national-level poverty-stricken counties and five of the top 100 counties of west China in 2019.
The aim of this paper was to analyze and find drivers of the city-level land degradation in parts of the Southwest Plateau of China between 2005 and 2015, to help the decision makers formulate sustainable land management alternatives, to further prevent land degradation, to restore ecosystems services, and natural capitals [8], and then, eventually, to move closer to the SDGs.

2. Materials and Methods

2.1. Study Area

The study area was the Honghe Hani and Yi Autonomous Prefecture (Honghe Prefecture), in the Yunnan Province of China (Figure 1). This area is located between 22°26′–24°45′ N and 101°48′–104°17′ E, in the southeast of the Yunnan Province, which is adjacent to Kunming, Wenshan, and Yuxi, and bordering Vietnam in the south. The area is in a subtropical monsoon climate zone with diverse climates. There are clear dry and rainy seasons in this prefecture. The mean annual precipitation is 2026.5 mm, and the mean annual temperature is 16.3 °C. The altitude ranges between 76.4 and 3074.3 m above sea level. The prefecture government is located in Mengzi City. The Red River flows through Honghe Prefecture from west to east. To the north of the Red River are the karst plateau and the lake-basin plateau, while to the south are the Hengduan Mountains and the Ailao Mountain Canyon. The economic development of the northern areas is better than that of the southern areas.

2.2. Data Sources

The spatial resolution affects the results of land degradation assessment [19,20,21,22,23], particularly in mountainous regions, small island states, and highly fragmented landscapes [5]. Datasets with a finer spatial resolution give more detail and significantly enhance land degradation evaluation and monitoring on a local scale. However, many of these datasets will not be useful for estimating land degradation neutrality (LDN) baselines due to their limited temporal coverage [24]. The selection criteria for land cover and land productivity datasets in this research are that datasets must have global coverage to ensure the consistency, be publicly available at no cost to end users, be able to cover the time range of the study area, and the higher the spatial resolution, the better.
The data used in this article include datasets from the European Space Agency’s Climate Change Initiative Land Cover (CCI-LC) (2005–2015), the Visible Infrared Imaging Radiometer Suite (VIIRS) night light data from the National Oceanic and Atmospheric Administration (NOAA), satellite images from Google Earth, the Moderate-Resolution Imaging Spectroradiometer (MODIS) vegetation index (MOD13Q1) Collection-6 (2005–2015), Soil Type data from USDA, Soil Grids from International Soil Reference Information Centre (ISRIC), and the global distribution of the Intergovernmental Panel on Climate Change (IPCC) climate zones data [25].
The CCI-LC dataset is a time series of consistent global LC maps with a 300 m spatial resolution on an annual basis from 1992 to 2018. MOD13Q1 Collection-6 is a Level 3 product with a 250 m spatial resolution generated every 16 days [26]. The MOD13Q1 product provides the Normalized Difference Vegetation Index (NDVI) layer and the Enhanced Vegetation Index (EVI) layer used in land productivity calculation. The resolution of the Soil Type data is 250 m. Soil Grids Data are global soil property maps at six standard depth intervals at a spatial resolution of 250 m used as the reference values for the soil organic carbon (SOC) calculations.

2.3. Methodology

Following the Good Practice Guidance of UNCCD [10], the SDG 15.3.1 indicator is composed of three sub-indicators: (1) land cover and land cover change, (2) land productivity, and (3) soil organic carbon stocks. It follows the principle of “One Out, All Out”, which means that the degradation of any sub-indicator for a land unit leads to its classification as degraded.

2.3.1. Land Cover and Land Cover Change

Of the three sub-indicators, the land cover change is the easiest to calculate. First, we obtain the land cover data of a base year and a target year. Second, we use the default land cover transition matrix from [10,27], which determines, for this region, whether transitions between classes correspond to degradations or improvements (no change indicates stable), as shown in Table 1. Third, we calculate the sub-indicator of each unit, we map and create a statistical table, and then use spatial analysis tools to identify the driving factors of this change.

2.3.2. Land Productivity

Land productivity is the biological productive capacity of the land, the source of the food, fiber, and fuel that sustains humans [10]. Land productivity can be measured across large areas using observations of the Net Primary Productivity (NPP), which is the net amount of carbon assimilated after photosynthesis and autotrophic respiration over a given period time.
Two of the most commonly used proxies of NPP are NDVI and EVI. Both of them are internationally comparable. Users can find free global datasets with them easily. EVI has two versions: the three-channel EVI (EVI-3) [28], and the two-channel EVI (EVI-2) [29]. EVI-3 exhibits high uncertainties in green vegetated areas due to the disturbance of blue band reflectance [23,30]. Researchers [31] showed that the EVI-3 performed poorly when compared to the NDVI and the EVI-2 at all scales in a VI test. Data of more than 2000 points selected from the world show a very high degree of similarity between NDVI and EVI-2, which results from a greater dynamic range of NDVI than EVI-2 [23,31]. Based on numerous and rigorous studies that have identified a strong relationship between NDVI and NPP [32,33,34], UNCCD and many researchers recommend using NDVI as an indicator of changes in land productivity [10,12,23,35].
Three sub-indicators can be calculated from remotely sensed estimates of land productivity [10,11]:
  • Trend: We compute a linear regression at the pixel level to identify areas experiencing changes in primary productivity. A Mann–Kendall non-parametric significance test is then applied to statistically assess if there is a monotonic upward or downward trend [36,37], considering only significant changes that show a p-value ≤ 0.05. If significant, a positive slope of the fitted line indicates improvement, while a negative slope shows degradation. If not significant, the result is stable.
  • State: With 2005–2012 as the baseline period, we compute the frequency distribution of the NDVI for each pixel. According to the distribution, we divide the NDVI data into 10 classes, calculate the mean value of each point, and determine the class. We use the mean NDVI from 2013 to 2015 as the value of the comparison period and determine the class of each pixel. If a difference in class between the baseline and the comparison period is smaller than −2, then this pixel could be degraded. If the difference is greater than 2, this pixel is improved. Pixels with small changes between −2 and 2 are considered stable [27].
  • Performance: We calculate the mean NDVI of each pixel for the entire period. We define units having the same combination of land cover and soil type and compute the frequency distribution of all the mean NDVI in each of them. Taking the value representing the 90th percentile as the maximum NDVI for each unit, we calculate the mean NDVI/NDVImax for each pixel. If the value is less than 0.5, then the pixel is marked as degraded.
The three productivity sub-indicators are then combined, and the possible combinations of results are indicated in Table 2.

2.3.3. Soil Organic Carbon

The first 30 cm of the soil profile was used as the reference for the calculation of changes in the SOC content. Data for evaluating changes in the SOC for Asia are typically insufficient as countries often do not monitor SOC stock and its changes [38]. We used a method for monitoring the SOC based on land cover changes between different land classes [25]. The conversion coefficients (Table 3) were derived from [12,27]. As suggested by [10], a loss in SOC greater than 10% indicates degradation, and a gain of larger than 10% shows improvement.

3. Result

3.1. Land Cover and Land Cover Change

Figure 2 shows the land degradation caused by the land cover conversion, and Table 4 shows the conversion area between the different classes of the land cover from 2005 to 2015. Table 5 shows the change in the area covered by each class of the land cover. According to the transition matrix (Table 1), Table 6 gives a summary of the change in land cover degradation.
Comparing the data from 2005 and 2015, the areas with the highest growth rate were the wetlands and the artificial areas (Table 5). The increase in the wetlands mainly came from the water bodies and the forests, while the increase in the artificial areas mainly came from the croplands and the grasslands. The increase in the artificial areas resulted in a total degradation area of 92.9 km2 (Table 4), accounting for 90.3% of the total land cover degradation area (102.9 km2, Table 6).

3.2. Land Productivity

Figure 3 shows the land degradation caused by land productivity, and Table 7 gives a summary of the change in land productivity degradation.
From Figure 3, the improvement and the degradation of the land productivity were widely distributed in the counties of Honghe Prefecture, while the areas with severe land degradation were concentrated in Mile, as well as the junction of Kaiyuan, Gejiu, and Mengzi. As seen from Table 7, the land productivity changes in Honghe Prefecture were essentially stable, maintaining a stable status of 48.7%, an increase of 36.2%, and a decrease of only 14.8%.

3.3. Soil Organic Carbon

Figure 4 shows the land degradation caused by the SOC changes, and Table 8 gives a summary of the changes in SOC degradation. Land cover change occurs with an associated change in SOC: loss can be significant in a short period while accumulation occurs at a slower rate. It takes more years for the SOC to be restored to the original level than for its reduction [39,40]. From Figure 4 and Table 8, the SOC of most land remained stable. It can be seen from Table 8 that, compared with 2005, the total area of SOC improvement and SOC degradation in Honghe Prefecture in 2015 accounted for less than 0.3%.
Combining the land cover changes (Table 4) with the coefficients (Table 3), we can see that the improvement of the SOC occurred in the conversion from croplands to forests and to grasslands, while the degradation of the SOC mainly occurred in the conversions from croplands and the grasslands to the artificial areas, and from the forests and the grasslands to the croplands. However, as the evaluation threshold was limited to 10%, the actual improvement/degradation area was less than the total area above (Table 8).

3.4. SDG 15.3.1 Indicator

Figure 5 shows the land degradation of Honghe Prefecture, and Table 9 gives a summary of the SDG 15.3.1 indicator.
Through the overlay of the land productivity changes and land degradation status in 2005–2015, we conclude that the land productivity degradation had a great impact on the land degradation. Figure 6 further verifies that land productivity degradation was the main cause of land degradation.

4. Discussion

4.1. Land Cover Change Analysis
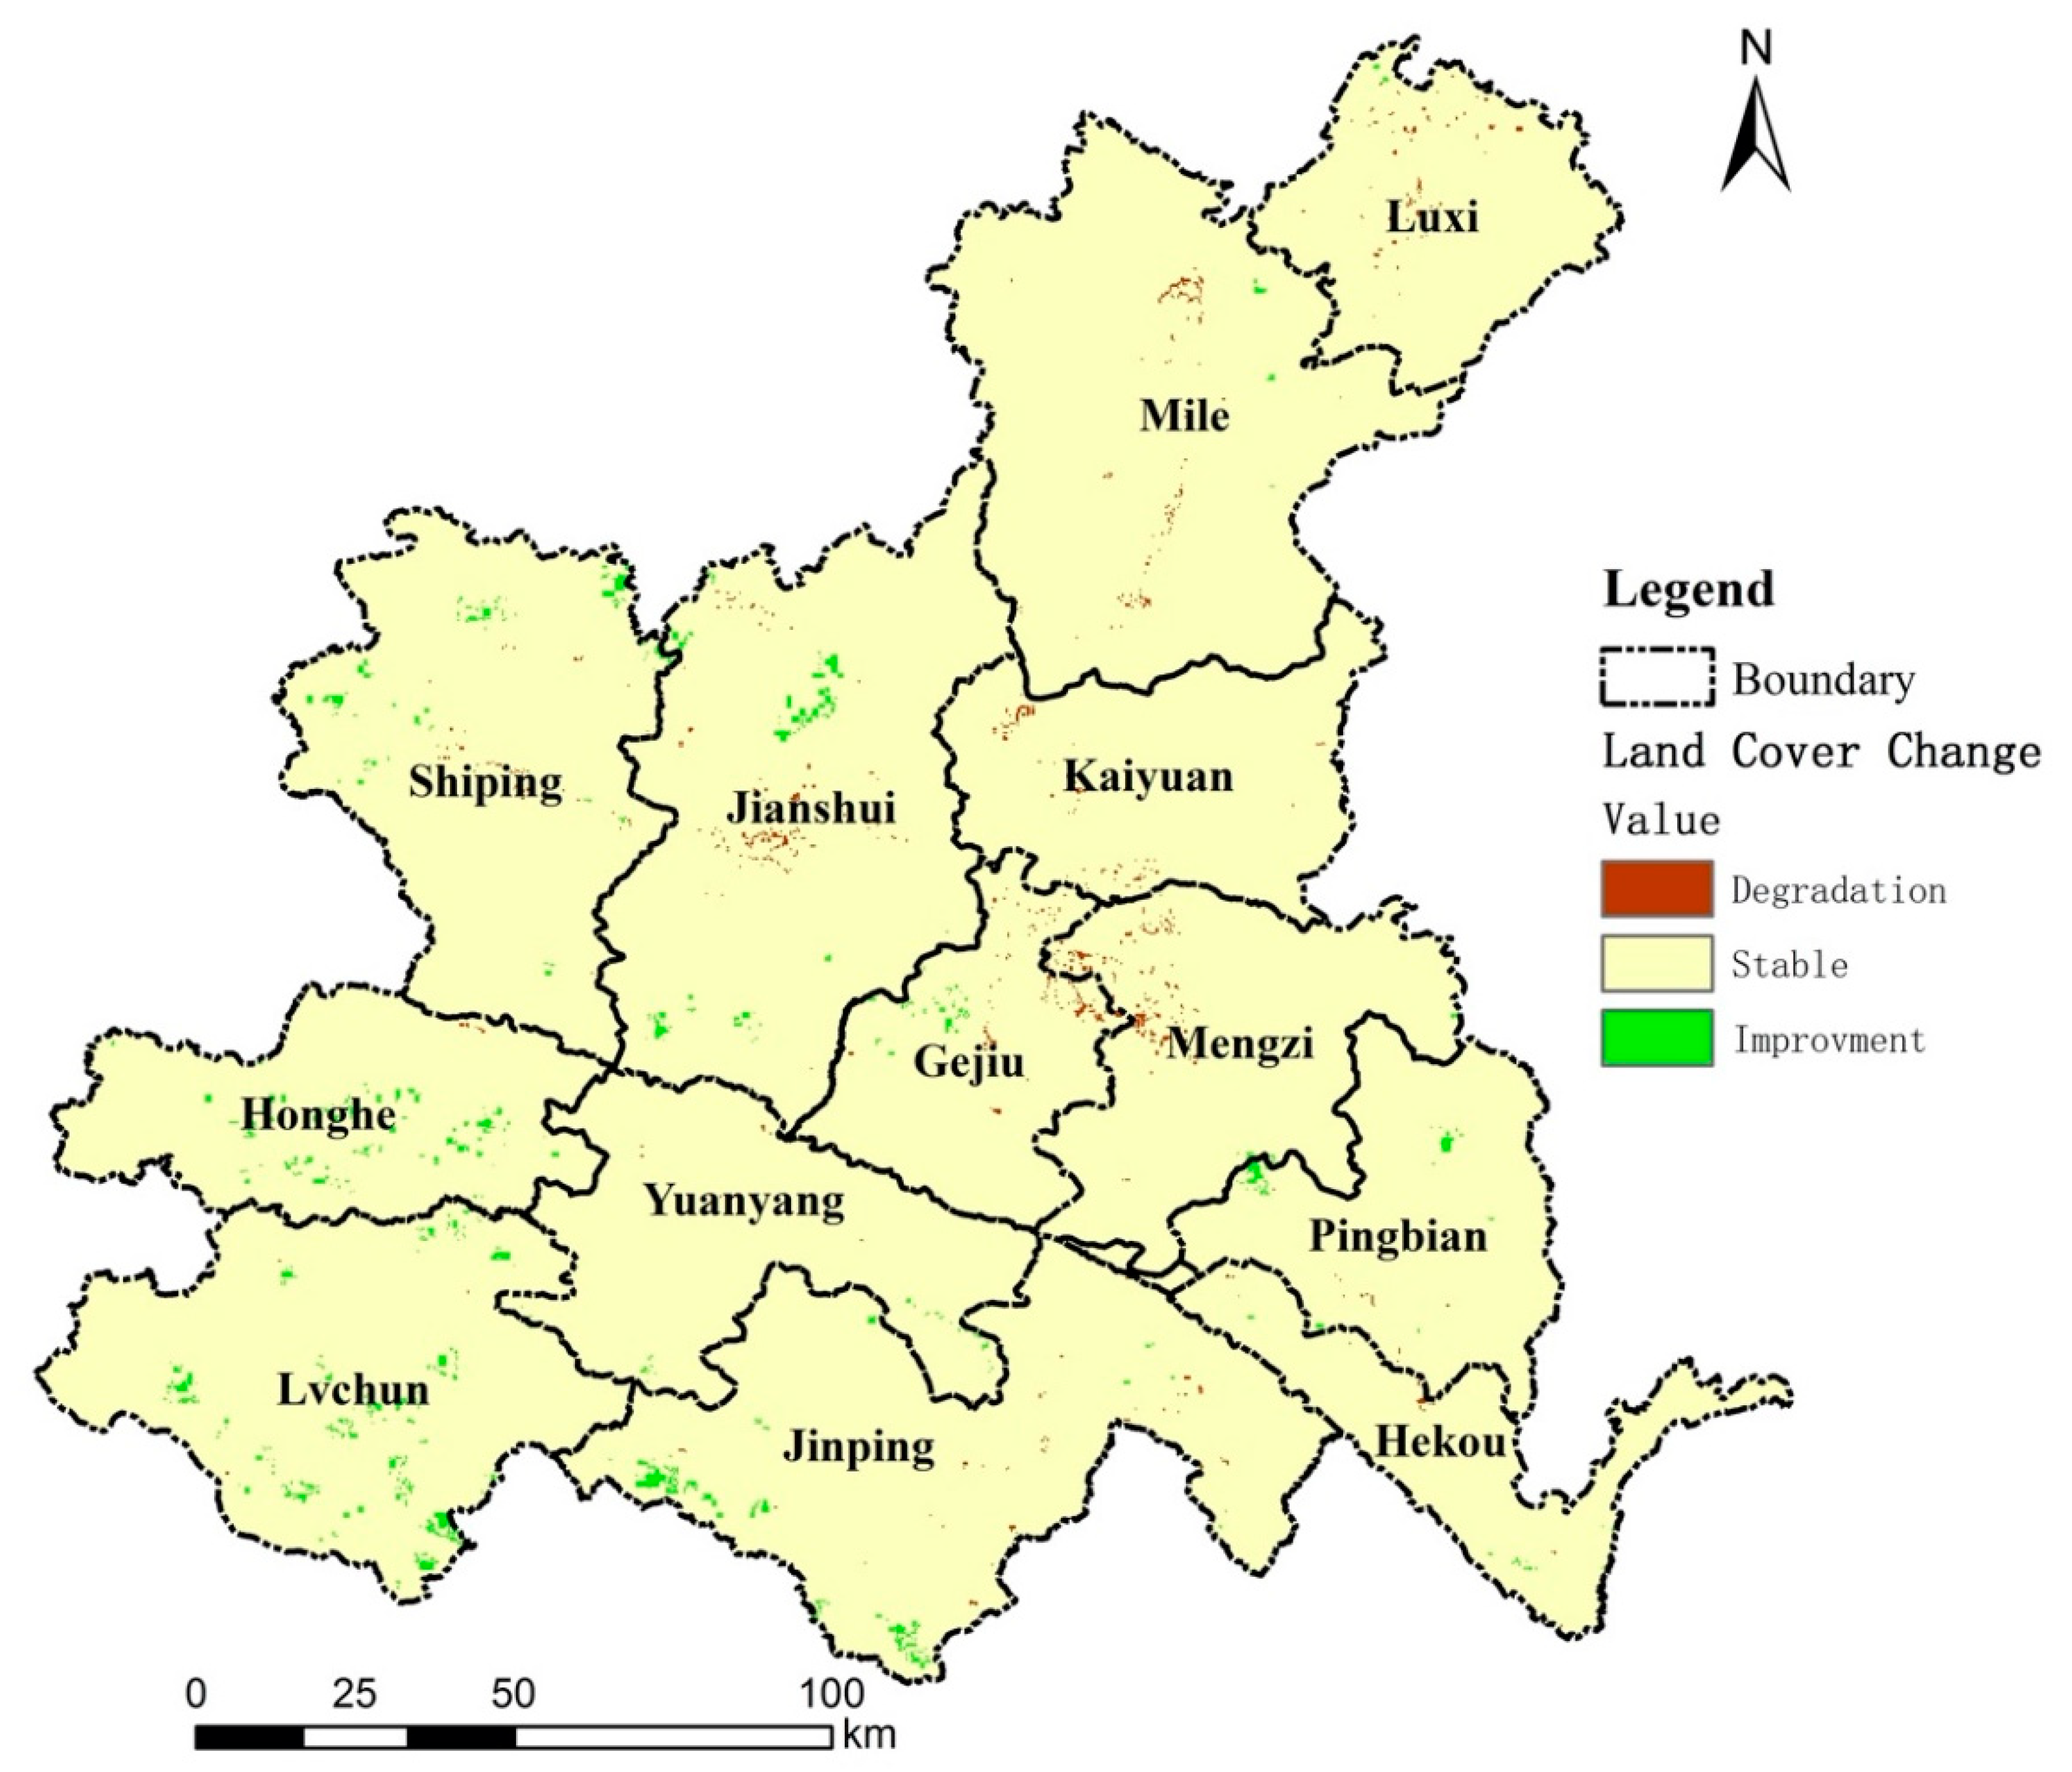
From Figure 7, the degradation was mainly located in the areas near the administrative center of the prefecture government Mengzi and the administrative centers of the counties north of the Red River. The NOAA VIIRS night light data from May 2015 was used to overlay with the degradation data, which clearly shows the correlation between the degradation and the urban expansion. In the densely populated urban center areas, the vegetation cover of the cultivated land decreased significantly. This is inseparable from the urbanization of Honghe Prefecture.
The urbanization process of Honghe Prefecture is in synchronization with China’s rapid development. Rural people increasingly work in urban centers. When they earn enough money, they buy real estate from where they originated, which requires a great deal of land to build more apartments around the county center. The investments in real estate development and the urban infrastructure construction caused a sharp reduction in the cultivated land resources around the center, which is one of the important causes of land degradation in Honghe Prefecture, which is driven by the population growth and migration.
The fastest changing area is at the junction of Mengzi and Gejiu, which may be due to two reasons. First, the Honghe Prefecture government began to relocate in 2003, and there were a large number of factories and enterprises moving with the government agencies. Therefore, the demand for the land near the new administrative center of the government increased dramatically. Second, Gejiu is the tin capital of China, and Datun is one of the main producing areas of tin. With strong financial support, the government has planned the Datun New District. This area is changing rapidly with the two benefits of being close to the prefecture government and establishing a new district.
Google Earth was used to validate the land cover change. Figure 8 shows the image near G326 (China National Highway) at the junction of Mengzi and Gejiu on 10 November 2006, from which we can see that most of the area is cropland. In contrast, Figure 9 shows that man-made buildings became the main type of land cover in this area on 23 January 2015.
The urban expansion and the construction of the new functional areas directly and indirectly occupy a large number of land resources, which have become important factors in the land resources degradation in Honghe Prefecture. The driver of the land degradation in Chenggong District, Kunming City, Yunnan Province is similar to that of this region [41]. The urban expansion of Honghe Prefecture mainly occupied croplands and grasslands around urban areas, a rule that also applies to the farming-pastoral ecotone of northern China [42]. In the process of industrialization and urbanization of the Shazand Watershed in Iran, a large number of grasslands and rain-fed agricultural lands were converted into artificial areas [43].
With the reduction of croplands and the continuous population growth, cutting shrubs and reclaiming grasslands became a measure to compensate for the reduction of croplands [44]. A total of 6.47 km2 of forests and 2.23 km2 of grasslands in Honghe Prefecture were converted into croplands in 10 years. Unlike the practice of felling wood as fuel in Ethiopia [44,45], coal is the main fuel in Honghe Prefecture. The deforestation in Tanzania is due to the energy demand for curing tobacco leaves [46]. Honghe Prefecture is the second main tobacco producing area in Yunnan, where coal and electricity are mainly used for flue-cured tobacco.
Another area with significant changes is in the middle of Mile. It is distributed along a stripe pattern, which is consistent with the direction and location of the G80 National Highway, which was completed in 2012. Based on the above reasons, human land use is a dominant driver of the land degradation in Honghe Prefecture.
The largest increase in land improvement in the land cover change is from the conversion of grasslands to forests, with an area of 227.58 km2, accounting for 94.27% of the total improvement area of 241.42 km2, mainly distributed in Honghe (county), Lvchun, Shiping, Jianshui, and the south of Jinping. Most of these forests occur in remote mountainous areas in each county, which may be related to the Grain for Green Program (GGP) launched in China in 1999.
The GGP is the largest ecological restoration project in China and is closely related to land use and cover change (LUCC) [47]. The project accelerated the process of national afforestation, and the forest coverage rates in the project areas increased by an average of more than four percentage points [48]. An article of Nature Sustainability stated that China alone accounted for 25% of the global net increase in leaf area with only 6.6% of the global vegetated area from 2000 to 2017. The greening in China is from forests (42%) and croplands (32%) [49]. This program underlines that government policy can play an important role in the modification of landscapes [45].
Land expropriation is a significant source of revenue for municipal governments. To improve the government’s fiscal performance, the newly amended Land Administration Law grants greater autonomy to local governments over land conversions and farmland acquisitions. The new land policy will accelerate the conversion of good-quality farmlands into artificial areas, and the lost farmlands will be made up of grasslands and forests, aggravating land degradation and destroying the local ecosystem. The Honghe prefecture government should reduce the scale of conversion from cultivated land to construction land year by year, to protect high-quality arable land. They should also strengthen the water conservancy construction to improve the quality of land, use resources scientifically, stabilize the scale of the city, and cut down on the demand from the natural environment.

4.2. Land Productivity Analysis

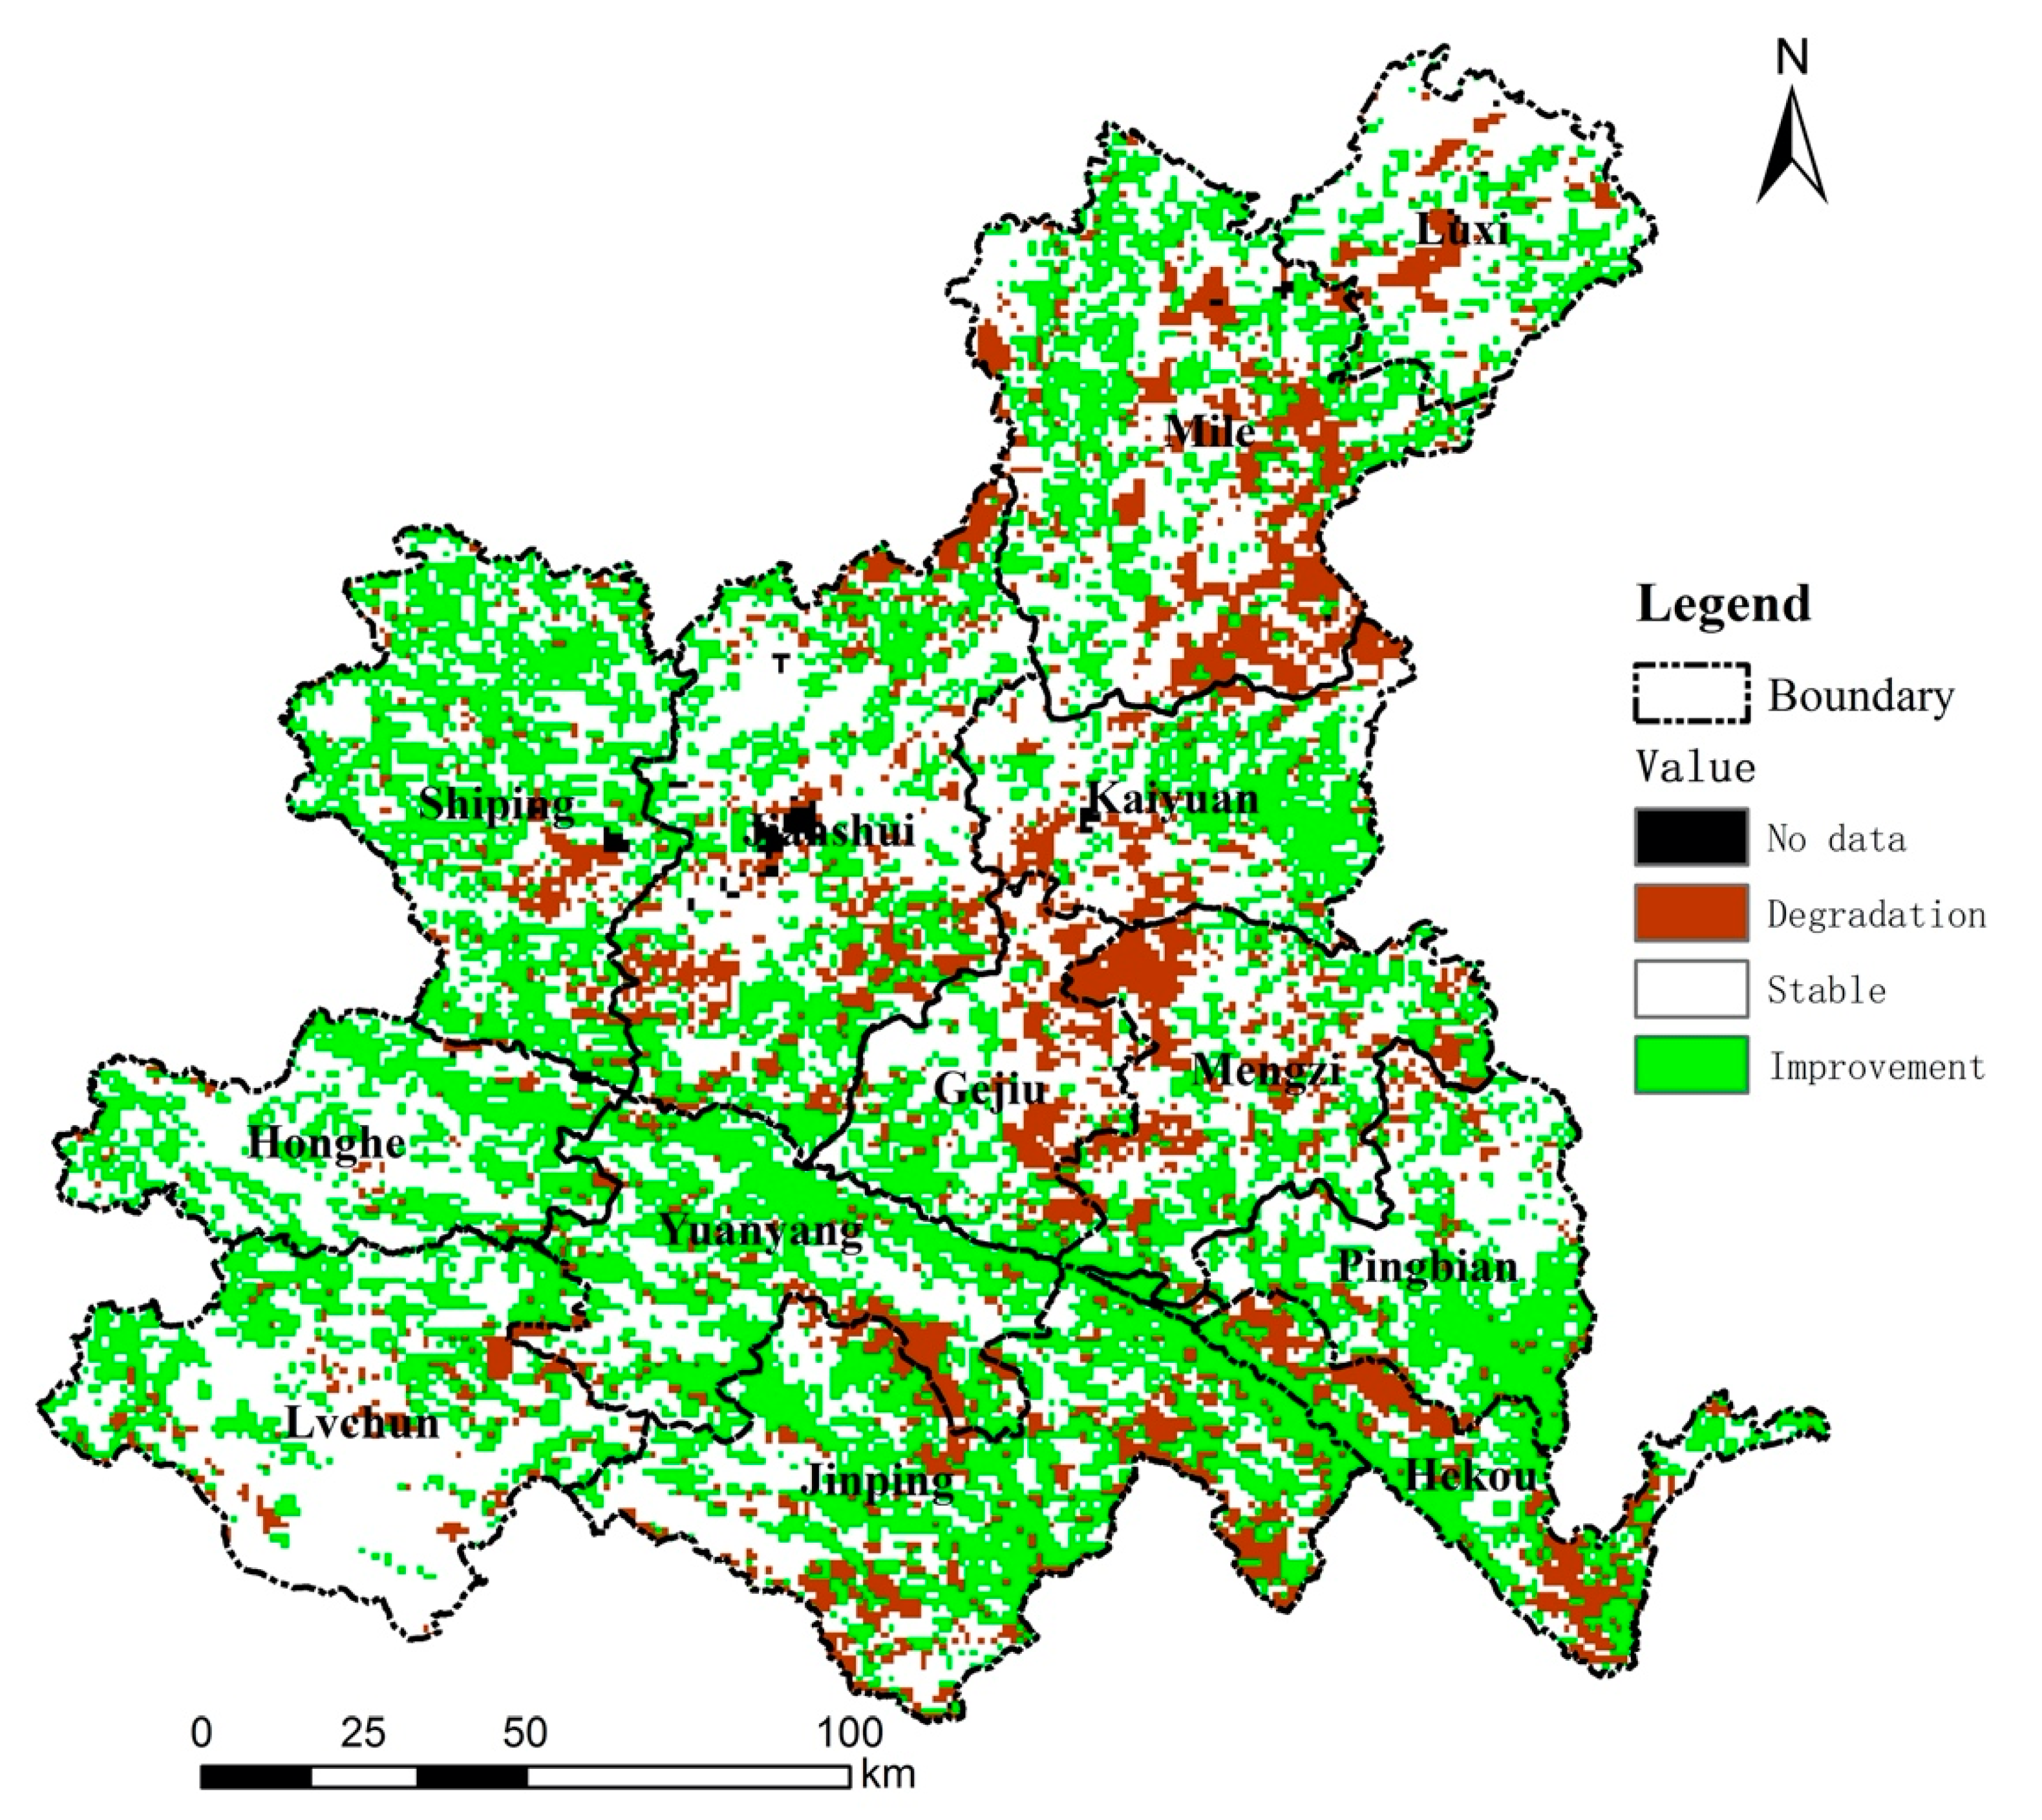
According to our results, the changes in land productivity occurred mainly in the forests, the grasslands, and the croplands. Degradation or improvement mainly occurred within the same land class. The overall trend showed that, regardless of the land cover class, the area of improvement was greater than the area of degradation (Table 10), which indicates that the land productivity improved over time. This is consistent with the changes in the characteristics of the three land cover classes in China during the same period as derived by Wang Zhen et al. [50]. In recent years, the Chinese government attached great importance to environmental protection. Through returning farmland to forests, returning grazing land to grasslands, and the development and use of desert areas, the vegetation coverage indices of all land cover classes increased significantly.
Although there is a lag in the response of the NDVI to the temperature and precipitation in the Red River Basin [51], the lag time is less than 1 year. The lag effect can be reduced or eliminated by calculating the average annual NDVI each year from 2005 to 2012 and the 2013–2015 average value. However, geological disasters caused by rainfall may cause sharp changes in the local NDVI value. The degradation of the land productivity in Jinping mainly occurred on the top of the mountain over 2000 m above sea level. Disasters caused by rainfall may be the main cause of ecological degradation in high-altitude areas [52]. The special geographical environment and complex geological structure of Honghe Prefecture and even Yunnan Province, coupled with the unreasonable exploitation and utilization by human beings, brought more frequent natural disasters. In particular, since the 1990s, the collapses, landslides, and debris flows in Yunnan Province have shown an increasing trend, causing huge losses [53].
As the area distribution of land productivity degradation north of the Red River overlapped very well with the night light data, we infer that this is related to the distribution of the county centers. These areas also have densely distributed agricultural land and populations [54]. In addition, the degradation of southeast Mile is also significant. Since 2005, we used remote sensing data to monitor the planting distribution of the cash crops north of the Red River. We found that the cash crops tended to shift from low to high altitudes, and from the basins to the slopes and mountains.
Cash crops with a smaller average area, in particular 
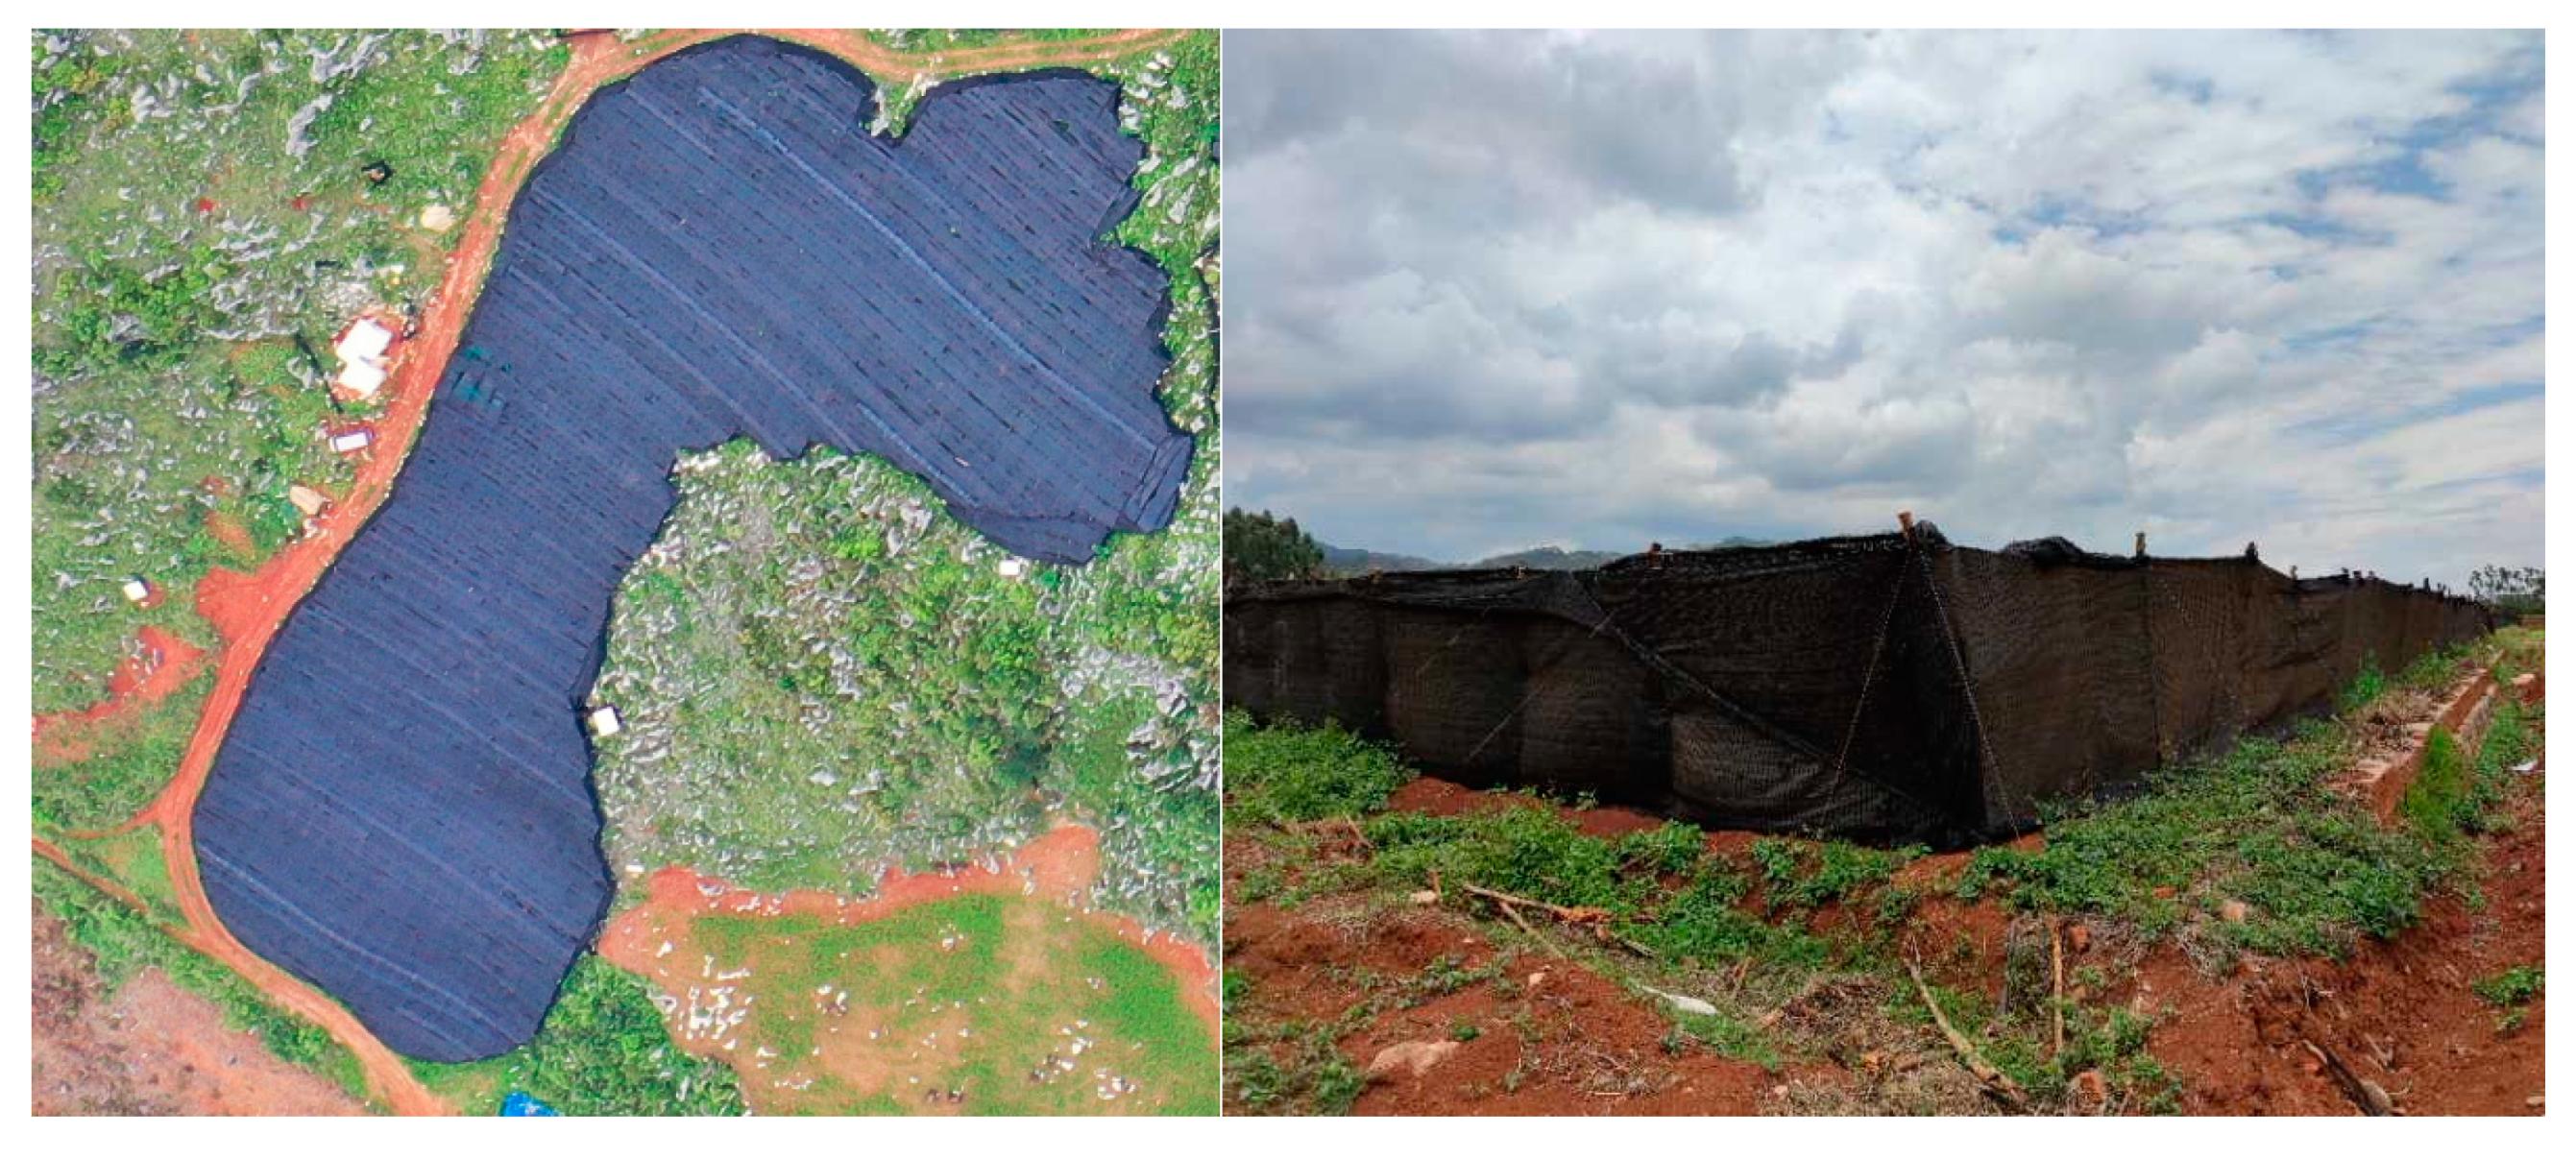
Panax notoginseng and the greenhouse vegetables, might be the cause of land productivity degradation in the grasslands, the forests, and the croplands. Panax notoginseng prefers shaded environments, distributed in the forests or the grasslands, and is often covered with black plastic nets (Figure 10). Figure 11 and Figure 12 show images of the same area in Luxi County before and after planting Panax notoginseng in Google Earth. Greenhouse vegetables are mainly distributed in the fields and covered with polyethylene films, which affect the NDVI acquired from the satellite images. Panax notoginseng and vegetables are cultivated in small fields covered with thin films and shade nets, which will lead to a lower assessment of the land productivity. In addition, climate change and geological factors can also result in the NPP degradation of irrigated farmland [43].
The NDVI decreased in areas with high economic development near administrative centers. In contrast, the NDVI increased significantly in the areas with low human activities [55]. Benefiting from the implementation of the GGP, forests and grasslands in the remote areas were well protected. An upward trend of NDVI indicates that the implementation of ecological projects effectively improved the regional environment [54].

4.3. Soil Organic Carbon Analysis

Land cover conversions strongly influence ecosystem services, such as the soil organic carbon, for climate mitigation [56,57]. Articles [47,58] demonstrated that the GGP in China led to greatly increased soil organic carbon. The SOC accumulation rates were significantly higher under the Conversion of Croplands to Forest (CCF) compared with under the Conversion of Croplands to Grasslands (CCG) at depths of 0–20 cm and 20–40 cm, which implies that CCF is a more efficient way to accumulate carbon in the soil compared with CCG [47].
The SOC is central to soil health, fertility, quality, and productivity [59]. A long time is needed to significantly increase the SOC after the conversion of cultivated land to forest or grassland. Our results show only a 10-year change, while it typically takes 14 to 30 years to significantly increase the SOC value as the accumulation speed is affected by the SOC content before conversion [47]. Another article on the Yunnan Province showed that the value of SOC had significant relationships with the rainfall, temperature, and altitude [60].

4.4. SDG 15.3.1 Indicator Land Degradation

According to the principle of “One Out, All Out”, the result of the SDG 15.3.1 land degradation can be extracted by merging the degradation areas of the three sub-indicators. From these data tables (Table 6, Table 7, Table 8 and 
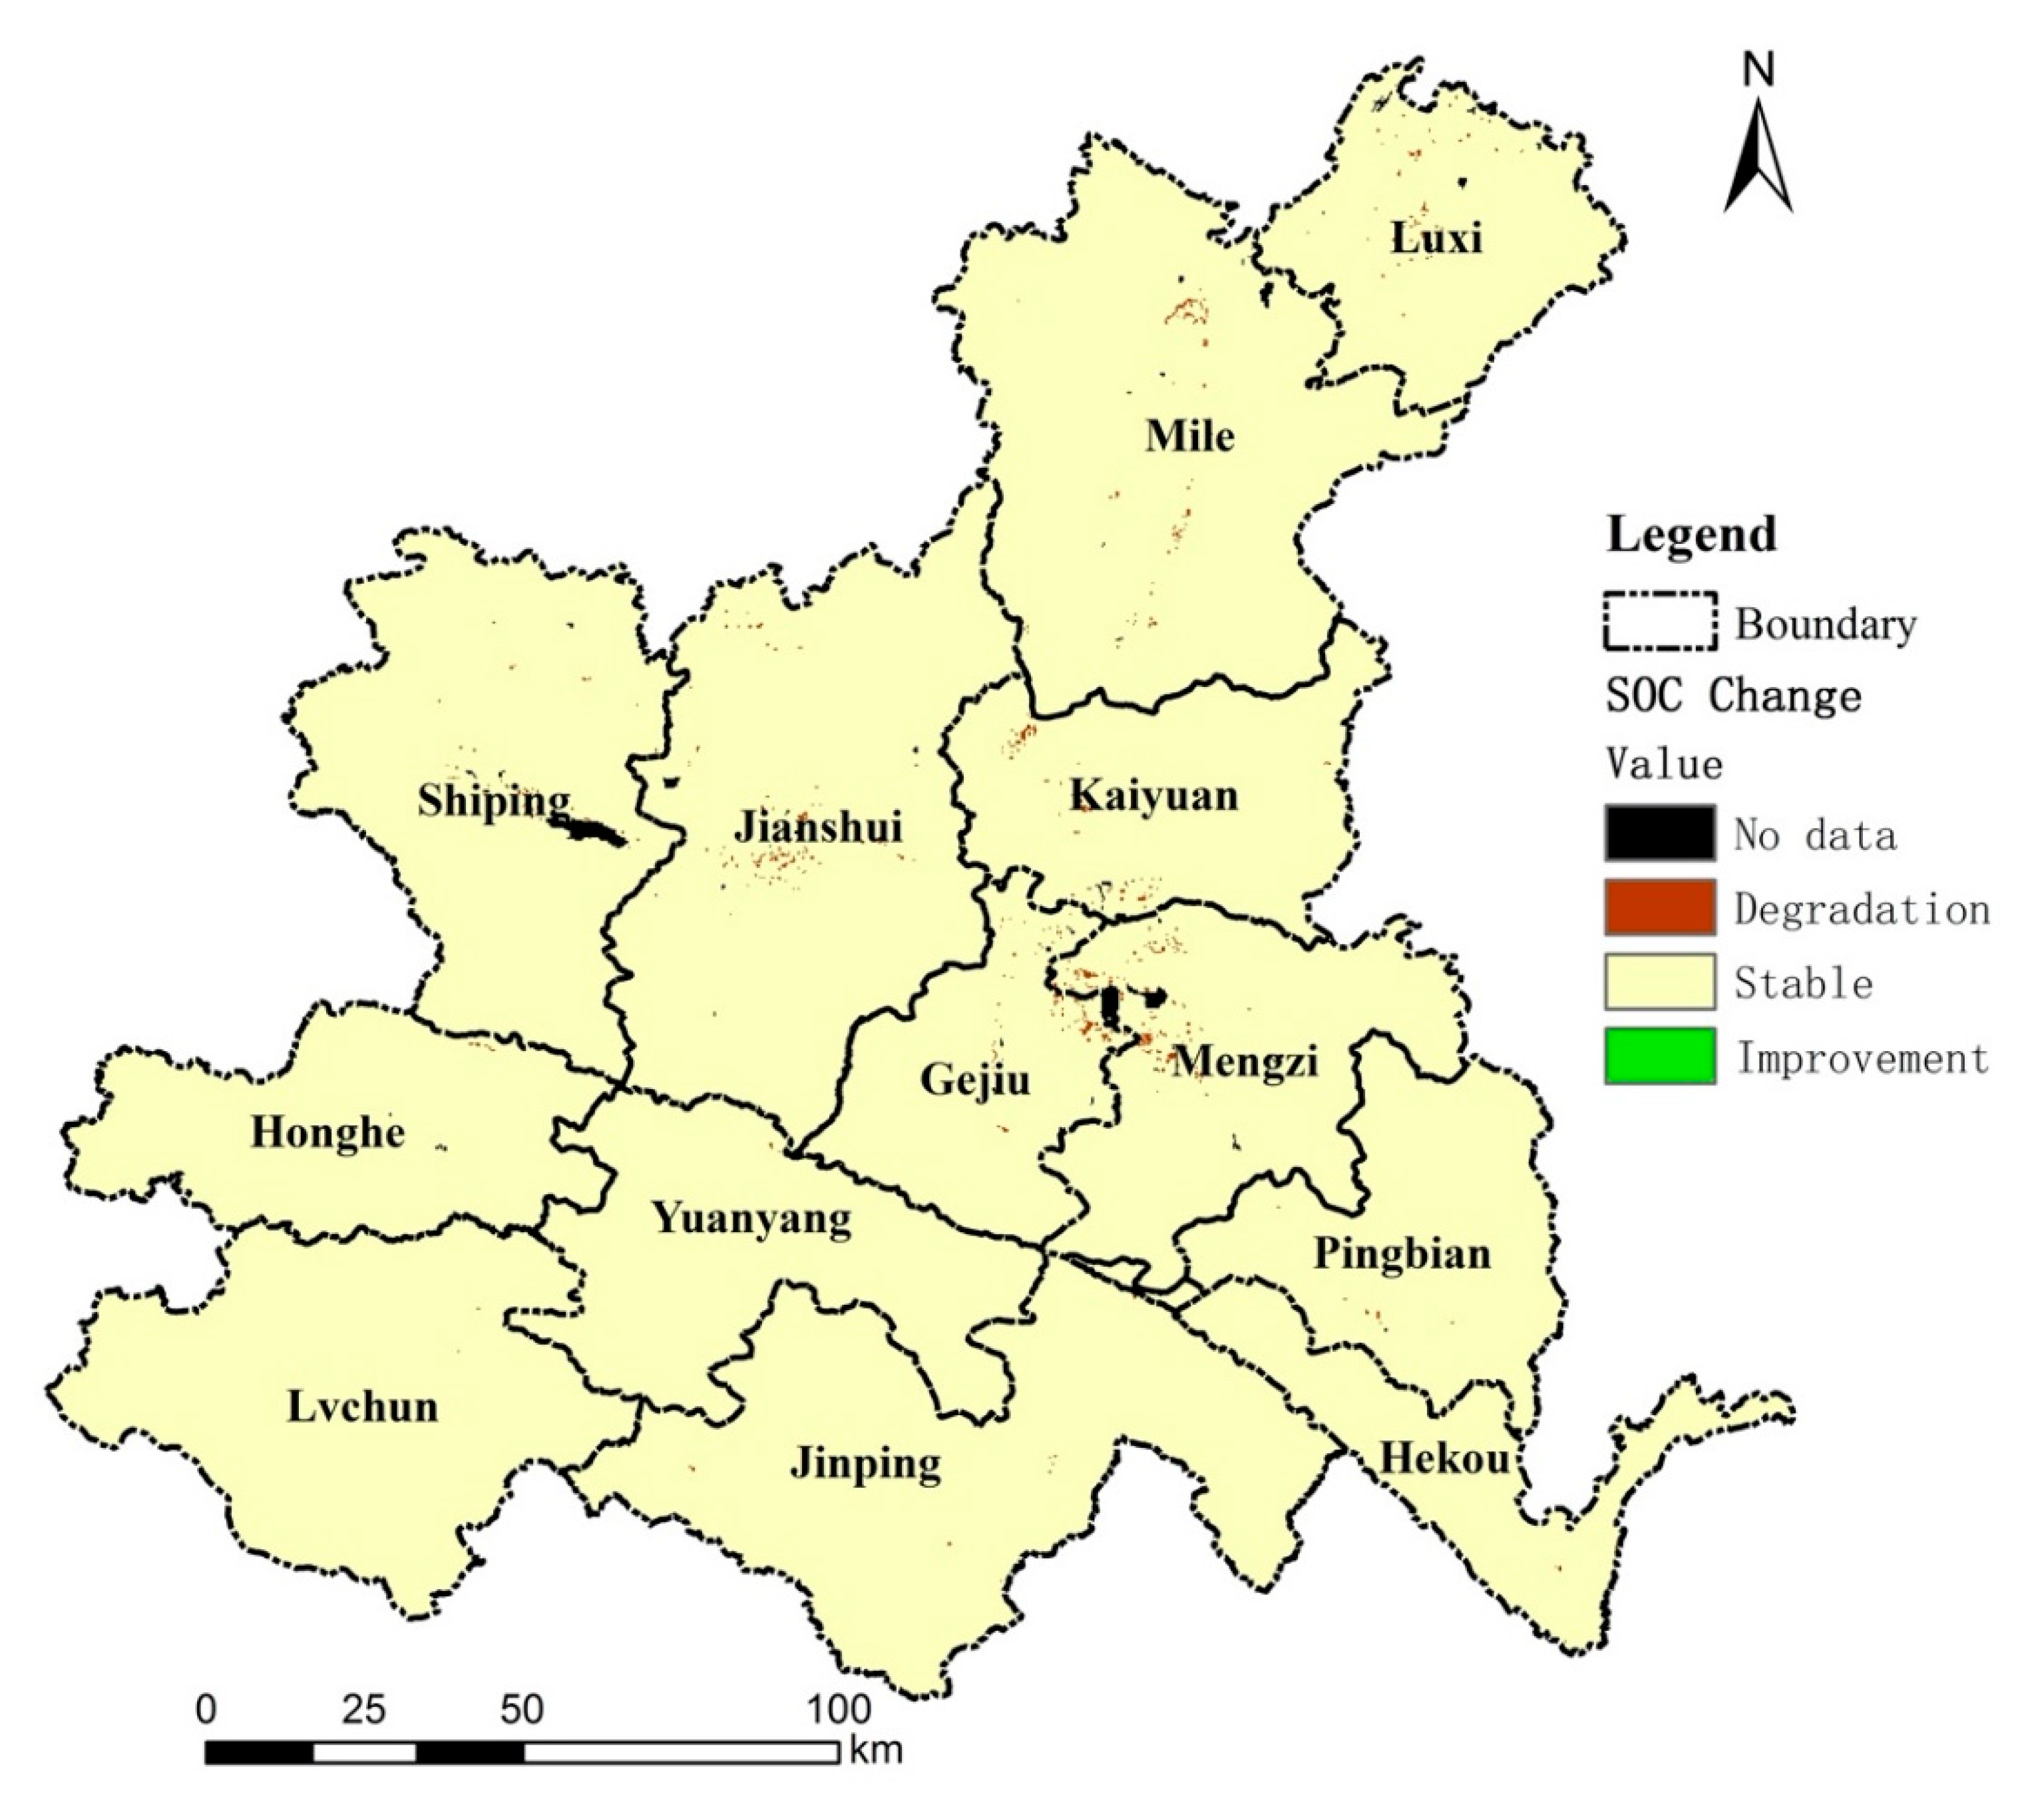
Table 9), we concluded that there was an overlap among the degradation areas of the sub-indicators. Among the three sub-indicators, the area of land productivity degradation was the largest, which accounted for 98.7% of the total SDG 15.3.1 land degradation area. Land productivity degradation mainly occurs internally, which indicates the need for good plans to protect the forests and the grasslands, as well as crop planting programs to prevent further degradation.
As one of the important factors of human activities, urbanization is the dominant driver of land cover degradation in Honghe Prefecture, and road construction and mining development have directly occupied croplands, grasslands, and forests. Mining development also consumes a great deal of water resources, which indirectly leads to a change in vegetation [61]. According to our field survey, urbanization and population migration in Honghe Prefecture did not cause land abandonment, which was observed in Srpska [62]. Despite the residents’ great demand for croplands, they still responded to the national policies and converted part of the croplands into grasslands and forests.
Land degradation shows obvious urban–rural differences. Urban land degradation is serious; however, the land in rural areas demonstrated a clear trend of improvement. Serious land degradation occurred in Mengzi, Gejiu, Kaiyuan, Mile, and Jianshui, which are in the top 100 counties of west China with better economic development, while the area of land improvement in the national-level poverty-stricken counties, such as Yuanyang, Honghe, and Jinping, is limited.
Comparing the land degradation results is difficult due to the different methods and evaluative indicators employed and the lack of uniform standards [63]. The guidance provided by UNCCD and the SDG implementation of Trends.Earth are conducive to the unification of methods and parameters among different countries and regions. This will improve the consistency of assessing land degradation for reporting on SDG indicator 15.3.1. We used the recommend datasets in Honghe Prefecture. LUCC datasets with the highest possible precision, high-spatial-resolution NDVI datasets, and detailed SOC datasets are encouraged to be used for land degradation as they will improve the accuracy of reports on SDG indicator 15.3.1.

5. Conclusions

We analyzed the land degradation in Honghe Prefecture from three aspects and found that human activities, such as urbanization, road construction, and mining development directly led to changes in the land cover, and the population growth accelerated this process [64,65]. Frequent human activities led to significant degradation of the land productivity in the radiation area from the city center, while unreasonable farming plans and cropland management were important causes of cropland degradation. The large-scale cultivation of cash crops affected our assessment of land productivity using the earth observation data, but this does not hinder the conclusion that human activities are the main cause of land degradation in Honghe Prefecture.
Research has confirmed in many countries and regions that human activities are the main driver of land degradation, but studies are also showing that climate change is the key factor affecting land degradation in certain areas [66]. National-level data and world-scale data cannot accurately reflect the real situation in certain areas. There are comparatively distinct land degradation differences between urban and rural areas. As different regions will produce different results, we should produce corresponding strategies according to different situations. The policymakers should formulate new sustainable development measures based on the population and the land carrying capacity to ease the effect of human activities, particularly urbanization [61]. The aim should be to achieve a land-degradation-neutral world while ensuring economic development and the improvement of people’s living conditions.
Two limitations need to be considered. First, we used moderate-resolution geospatial datasets in this paper, and the effect of the high-resolution earth observation data on the results requires further verification. Second, only by fully understanding how human activities affect the productivity degradation of forests, grasslands, and croplands can policies be better formulated, which will be the focus of further research.

Author Contributions

Conceptualization, Anthony Lehmann and Gregory Giuliani; data analysis, Tuo Wang and Yangming Jiang; visualization and manuscript writing, Tuo Wang; Validation, Xiaodong Shao, Liping Li, and Huihui Zhao; writing—review and editing, Anthony Lehmann, Gregory Giuliani, and Liping Li. All authors have read and agreed to the published version of the manuscript.

Funding

This research was funded by Strategic Priority Research Program of the Chinese Academy of Sciences (grant number: XDA19030104), CAS Scholarship and Honghe Tobacco Quality Big Data Analysis Application Platform Technology R&D (grant number: 2019530000241035).

Acknowledgments

The authors would like to thank the ESA CCI Land Cover project for the land cover dataset.

Conflicts of Interest

The authors declare no conflict of interest.

References

  1. Big Earth Data Program. Big Earth Data in Support. of the Sustainable Development Goals; Chinese Academy of Sciences: Beijing, China, 2019. [Google Scholar]
  2. Mariathasan, V.; Bezuidenhoudt, E.; Olympio, K.R. Evaluation of Earth Observation Solutions for Namibia’s SDG Monitoring System. Remote Sens. 2019, 11, 1612. [Google Scholar] [CrossRef] [Green Version]
  3. Giuliani, G.; Mazzetti, P.; Santoro, M.; Nativi, S.; Van Bemmelen, J.; Colangeli, G.; Lehmann, A. Knowledge generation using satellite earth observations to support sustainable development goals (SDG): A use case on Land degradation. Int. J. Appl. Earth Obs. Geoinf. 2020, 88, 102068. [Google Scholar] [CrossRef]
  4. Liu, S.Y.; Bai, J.J.; Chen, J. Measuring SDG 15 at the County Scale: Localization and Practice of SDGs Indicators Based on Geospatial Information. ISPRS Int. J. Geo-Inf. 2019, 8, 515. [Google Scholar] [CrossRef] [Green Version]
  5. Giuliani, G.; Chatenoux, B.; Benvenuti, A.; Lacroix, P.; Santoro, M.; Mazzetti, P. Monitoring land degradation at national level using satellite Earth Observation time-series data to support SDG15—Exploring the potential of data cube. Big Earth Data 2020, 4, 1–20. [Google Scholar] [CrossRef] [Green Version]
  6. Scott, G.; Rajabifard, A. Sustainable development and geospatial information: A strategic framework for integrating a global policy agenda into national geospatial capabilities. Geo. Spat. Inf. Sci. 2017, 20, 59–76. [Google Scholar] [CrossRef] [Green Version]
  7. UNCCD. Indicator 15.3.1: Proportion of Land that Is Degraded over Total Land Area. Available online: https://unstats.un.org/sdgs/metadata/files/Metadata-15-03-01.pdf (accessed on 10 August 2020).
  8. Ouyang, Z.; Zheng, H.; Xiao, Y.; Polasky, S.; Liu, J.; Xu, W.; Wang, Q.; Zhang, L.; Xiao, Y.; Rao, E.; et al. Improvements in ecosystem services from investments in natural capital. Science 2016, 352, 1455–1459. [Google Scholar] [CrossRef]
  9. Mahala, A. Identifying the factors and status of land degradation in a tropical plateau region. GeoJournal 2019, 84, 1199–1218. [Google Scholar] [CrossRef]
  10. Sims, N.; Green, C.; Newnham, G.; England, J.; Held, A.; Wulder, M.; Herold, M.; Cox, S.; Huete, A.; Kumar, L. Good Practice Guidance. SDG Indicator 15.3.1, Proportion of Land that Is Degraded Over Total Land Area; United Nations Convention to Combat Desertification (UNCCD): Bonn, Germany, 2017. [Google Scholar]
  11. Sims, N.C.; England, J.R.; Newnham, G.J.; Alexander, S.; Green, C.; Minelli, S.; Held, A. Developing good practice guidance for estimating land degradation in the context of the United Nations Sustainable Development Goals. Environ. Sci. Policy 2019, 92, 349–355. [Google Scholar] [CrossRef]
  12. Daniela Mattina, H.E.E.; Wheeler, I.; Crossman, N. Default Data: Methods and Interpretation. A Guidance Document for the 2018 UNCCD Reporting; United Nations Convention to Combat Desertification (UNCCD): Bonn, Germany, 2018. [Google Scholar]
  13. UNCCD. Preliminary Analysis—Strategic Objective 1: To Improve the Condition of Affected Ecosystems, combat Desertification/Land Degradation, Promote Sustainable Land Management and Contribute to Land Degradation Neutrality; UNCCD: Georgetown, Guyana, 2018. [Google Scholar]
  14. Anderson, K.; Ryan, B.; Sonntag, W.; Kavvada, A.; Friedl, L. Earth observation in service of the 2030 Agenda for Sustainable Development. Geo. Spat. Inf. Sci. 2017, 20, 77–96. [Google Scholar] [CrossRef]
  15. Gonzalez-Roglich, M.; Zvoleff, A.; Noon, M.; Liniger, H.; Fleiner, R.; Harari, N.; Garcia, C. Synergizing global tools to monitor progress towards land degradation neutrality: Trends.Earth and the World Overview of Conservation Approaches and Technologies sustainable land management database. Environ. Sci. Policy 2019, 93, 34–42. [Google Scholar] [CrossRef]
  16. Raumer, S.V.; Ju, J. Concepts of Land Use Data Integration: SILUP Experience. In Proceedings of the International Conference on Land Use Planning and Policy Sustainable Land Use Decisions in Economically Dynamic and Densely Populated Areas, Beijing, China, 10 May 2004. [Google Scholar]
  17. Balz, T.; Fritsch, D. Remote Sensing and Geo-Information Systems as Tools for Sustainable Development by Integrated Land Use Planing in China. Int. Arch. Photogramm. Remote Sens. Spat. Inf. Sci. 2003, 34, 547–552. [Google Scholar]
  18. Treuner, P.; She, Z.; Ju, J. Sustainable Development by Integrated Land Use Planning: (SILUP); Final Report on a Co-Operative Research Project; Institute of Spatial and Regional Planning, University of Stuttgart: Stuttgart, Germany, 2001. [Google Scholar] [CrossRef]
  19. Sun, P.; Liu, S.; Liu, J.; Li, C.; Lin, Y.; Jiang, H. Derivation and validation of leaf area index maps using NDVI data of different resolution satellite imageries. Sheng Tai Xue Bao 2006, 26, 3826–3834. [Google Scholar] [CrossRef]
  20. Laidler, G.J.; Treitz, P.M.; Atkinson, D.M. Remote sensing of arctic vegetation: Relations between the NDVI, spatial resolution and vegetation cover on Boothia Peninsula, Nunavut. Arctic 2008, 61, 1–13. [Google Scholar] [CrossRef] [Green Version]
  21. Yin, H.; Udelhoven, T.; Fensholt, R.; Pflugmacher, D.; Hostert, P. How Normalized Difference Vegetation Index (NDVI) Trends from Advanced Very High Resolution Radiometer (AVHRR) and Systeme Probatoire d’Observation de la Terre VEGETATION (SPOT VGT) Time Series Differ in Agricultural Areas: An Inner Mongolian Case Study. Remote Sens. 2012, 4, 3364–3389. [Google Scholar] [CrossRef] [Green Version]
  22. Munyati, C.; Mboweni, G. Variation in NDVI values with change in spatial resolution for semi-arid savanna vegetation: A case study in northwestern South Africa. Int. J. Remote Sens. 2013, 34, 2253–2267. [Google Scholar] [CrossRef]
  23. Yengoh, G.T.; Dent, D.; Olsson, L.; Tengberg, A.E.; Tucker, C.J., III. Use of the Normalized Difference Vegetation Index (NDVI) to Assess. Land Degradation at Multiple Scales: Current Status, Future Trends, and Practical Considerations; Springer: Berlin/Heidelberg, Germany, 2015. [Google Scholar] [CrossRef]
  24. Daldegan, G.A.; Noon, M.; Zvoleff, A.; Gonzalez-Roglich, M. A Review of Publicly Available Geospatial Datasets and Indicators in Support. of Land Degradation Monitoring; VA, USA, 2018; Available online: https://www.tools4ldn.org/s/ci-6-Tools4LDN-report-FNL_web_spreads1.pdf (accessed on 26 November 2020).
  25. Eggleston, H.; Buendia, L.; Miwa, K.; Ngara, T.; Tanabe, K. IPCC Guidelines for National Greenhouse Gas Inventories; Institute for Global Environmental Strategies: Hayama, Japan, 2006; Volume 4. [Google Scholar]
  26. USGS. MOD13Q1 v006. Available online: https://lpdaac.usgs.gov/products/mod13q1v006/ (accessed on 14 June 2020).
  27. Conservation International. Trends.Earth. Available online: http://trends.earth/docs/en/ (accessed on 10 June 2020).
  28. Huete, A.; Didan, K.; Miura, T.; Rodriguez, E.P.; Gao, X.; Ferreira, L.G. Overview of the radiometric and biophysical performance of the MODIS vegetation indices. Remote Sens. Environ. 2002, 83, 195–213. [Google Scholar] [CrossRef]
  29. Jiang, Z.Y.; Huete, A.R.; Didan, K.; Miura, T. Development of a two-band enhanced vegetation index without a blue band. Remote Sens. Environ. 2008, 112, 3833–3845. [Google Scholar] [CrossRef]
  30. Lu, L.L.; Kuenzer, C.; Wang, C.Z.; Guo, H.D.; Li, Q.T. Evaluation of Three MODIS-Derived Vegetation Index Time Series for Dryland Vegetation Dynamics Monitoring. Remote Sens. 2015, 7, 7597–7614. [Google Scholar] [CrossRef] [Green Version]
  31. Tucker, C.; Pinzon, J. Using Spectral Vegetation Indices to Measure Gross Primary Productivity as an Indicator of Land Degradation; VA, USA, 2017; Available online: http://vitalsigns.org/sites/default/files/VS_GEFLDMP_Report1_C1_R3_WEB_HR.pdf (accessed on 26 November 2020).
  32. Field, C.B.; Randerson, J.T.; Malmstrom, C.M. Global Net Primary Production—Combining Ecology and Remote-Sensing. Remote Sens. Environ. 1995, 51, 74–88. [Google Scholar] [CrossRef] [Green Version]
  33. Prince, S.D.; Goward, S.N. Global primary production: A remote sensing approach. J. Biogeogr. 1995, 22, 815–835. [Google Scholar] [CrossRef]
  34. Vlek, P.L.; Le, Q.B.; Tamene, L. Assessment of land degradation, its possible causes and threat to food security in Sub-Saharan Africa. In Food Security and Soil Quality; CRC Press: Boca Raton, FL, USA, 2010; pp. 57–86. [Google Scholar] [CrossRef]
  35. Higginbottom, T.P.; Symeonakis, E. Assessing Land Degradation and Desertification Using Vegetation Index Data: Current Frameworks and Future Directions. Remote Sens. 2014, 6, 9552–9575. [Google Scholar] [CrossRef] [Green Version]
  36. Mann, H.B. Nonparametric Tests against Trend. Econometrica 1945, 13, 245–259. [Google Scholar] [CrossRef]
  37. Kendall, M.G. Rank Correlation Methods; C. Griffin: Glasgow, UK, 1948. [Google Scholar]
  38. Montanarella, L.; Badraoui, M.; Chude, V.; Baptista Costa, I.D.S.; Mamo, T.; Yemefack, M.; Singh Aulakh, M.; Yagi, K.; Young Hong, S.; Vijarnsorn, P. Status of the World’s Soil Resources Main Report; Food and Agricultural Organization (FAO): Rome, Italy, 2015. [Google Scholar]
  39. Xing, J.; Xiaoyu, Z.; Yu, W.; Yangyang, C. Influence of land use changes on soil total organic carbon and dissolved organic carbon in wetland. Zhejiang Nong Ye Xue Bao 2020, 32, 475–482. [Google Scholar] [CrossRef]
  40. Guo, L.B.; Gifford, R.M. Soil carbon stocks and land use change: A meta analysis. Glob. Chang. Biol. 2002, 8, 345–360. [Google Scholar] [CrossRef]
  41. Zhang, Z.-K.; Yang, K.; Wang, J.-S. Remote Sensing Monitoring of Cultivated Land Degradation Supported by SVM Algorithm—A Case of Chenggong District, Kunming City. J. Anhui Agric. Sci. 2017, 45, 190–192. [Google Scholar] [CrossRef]
  42. Liu, Z.J.; Liu, Y.S.; Li, Y.R. Anthropogenic contributions dominate trends of vegetation cover change over the farming-pastoral ecotone of northern China. Ecol. Indic. 2018, 95, 370–378. [Google Scholar] [CrossRef]
  43. Kiani-Harchegani, M.; Sadeghi, S.H. Practicing land degradation neutrality (LDN) approach in the Shazand Watershed, Iran. Sci. Total Environ. 2020, 698, 134319. [Google Scholar] [CrossRef]
  44. Sewnet, A.; Abebe, G. Land use and land cover change and implication to watershed degradation by using GIS and remote sensing in the Koga watershed, North Western Ethiopia. Earth Sci. Inform. 2018, 11, 99–108. [Google Scholar] [CrossRef]
  45. Gebremicael, T.G.; Mohamed, Y.A.; van der Zaag, P.; Hagos, E.Y. Quantifying longitudinal land use change from land degradation to rehabilitation in the headwaters of Tekeze-Atbara Basin, Ethiopia. Sci. Total Environ. 2018, 622–623, 1581–1589. [Google Scholar] [CrossRef]
  46. Jew, E.K.K.; Dougill, A.J.; Sallu, S.M. Tobacco cultivation as a driver of land use change and degradation in the miombo woodlands of south-west Tanzania. Land Degrad. Dev. 2017, 28, 2636–2645. [Google Scholar] [CrossRef] [Green Version]
  47. Song, X.; Peng, C.; Zhou, G.; Jiang, H.; Wang, W. Chinese Grain for Green Program led to highly increased soil organic carbon levels: A meta-analysis. Sci. Rep. 2014, 4, 4460. [Google Scholar] [CrossRef] [PubMed] [Green Version]
  48. Xinhua. China returns over 33.5 mln hectares of farmland to forests, grasslands. China Daily, 9 July 2019. [Google Scholar]
  49. Chen, C.; Park, T.; Wang, X.; Piao, S.; Xu, B.; Chaturvedi, R.K.; Fuchs, R.; Brovkin, V.; Ciais, P.; Fensholt, R. China and India lead in greening of the world through land-use management. Nat. Sustain. 2019, 2, 122–129. [Google Scholar] [CrossRef] [PubMed]
  50. Zhen, W.; Wende, Y.; Shuguang, L.; Chao, G.; Xiaoyong, C. Spatial-temporal characteristics of three main land-use types in China based on MODIS data. Sheng Tai Xue Bao 2017, 37. [Google Scholar] [CrossRef] [Green Version]
  51. Li, Y.; He, D. The spatial and temporal variation of NDVI and its relationships to the climatic factors in Red River Basin. J. Mt. Sci. 2009, 27, 333–340. [Google Scholar]
  52. Li, Y.; Hu, J.; He, D.; Liu, J. Variability of frequency and intensity of heavy rainfall events and its impacts in the Red River Basin during 1960–2007. Geogr. Res. 2013, 32, 64–72. [Google Scholar] [CrossRef]
  53. Wang, J.; Zhou, Y. Status of Land Degradation and Its Causes and Countermeasures in Yunnan Province. Saf. Environ. Eng. 2005, 12, 1–4. [Google Scholar] [CrossRef]
  54. Gu, Z.J.; Duan, X.W.; Shi, Y.D.; Li, Y.; Pan, X. Spatiotemporal variation in vegetation coverage and its response to climatic factors in the Red River Basin, China. Ecol. Indic. 2018, 93, 54–64. [Google Scholar] [CrossRef]
  55. Peng, J.; Liu, Y.H.; Shen, H.; Han, Y.; Pan, Y.J. Vegetation coverage change and associated driving forces in mountain areas of Northwestern Yunnan, China using RS and GIS. Environ. Monit. Assess. 2012, 184, 4787–4798. [Google Scholar] [CrossRef]
  56. Collard, S.J.; Zammit, C. Effects of land-use intensification on soil carbon and ecosystem services in Brigalow (Acacia harpophylla) landscapes of southeast Queensland, Australia. Agric. Ecosyst. Environ. 2006, 117, 185–194. [Google Scholar] [CrossRef] [Green Version]
  57. Yang, Y.J.; Wang, K.; Liu, D.; Zhao, X.Q.; Fan, J.W. Effects of land-use conversions on the ecosystem services in the agro-pastoral ecotone of northern China. J. Clean. Prod. 2020, 249, 119360. [Google Scholar] [CrossRef]
  58. Liu, D.; Chen, Y.; Cai, W.W.; Dong, W.J.; Xiao, J.F.; Chen, J.Q.; Zhang, H.C.; Xia, J.Z.; Yuan, W.P. The contribution of China’s Grain to Green Program to carbon sequestration. Landsc. Ecol. 2014, 29, 1675–1688. [Google Scholar] [CrossRef]
  59. Lorenz, K.; Lal, R.; Ehlers, K. Soil organic carbon stock as an indicator for monitoring land and soil degradation in relation to United Nations’ Sustainable Development Goals. Land Degrad. Dev. 2019, 30, 824–838. [Google Scholar] [CrossRef]
  60. Duan, X.; Rong, L.; Hu, J.; Zhang, G. Soil organic carbon stocks in the Yunnan Plateau, southwest China: Spatial variations and environmental controls. J. Soils Sediments 2014, 14, 1643–1658. [Google Scholar] [CrossRef]
  61. Wieland, R.; Lakes, T.; Hu, Y.F.; Nendel, C. Identifying drivers of land degradation in Xilingol, China, between 1975 and 2015. Land Use Policy 2019, 83, 543–559. [Google Scholar] [CrossRef]
  62. Solomun, M.K.; Barger, N.; Cerda, A.; Keesstra, S.; Markovic, M. Assessing land condition as a first step to achieving land degradation neutrality: A case study of the Republic of Srpska. Environ. Sci. Policy 2018, 90, 19–27. [Google Scholar] [CrossRef]
  63. Han, W.Y.; Liu, G.H.; Su, X.K.; Wu, X.; Chen, L. Assessment of potential land degradation and recommendations for management in the south subtropical region, Southwest China. Land Degrad. Dev. 2019, 30, 979–990. [Google Scholar] [CrossRef]
  64. Riebsame, W.E.; Meyer, W.B.; Turner, B.L. Modeling land use and cover as part of global environmental change. Clim. Chang. 1994, 28, 45–64. [Google Scholar] [CrossRef]
  65. Ganaie, T.A.; Jamal, S.; Ahmad, W.S. Changing land use/land cover patterns and growing human population in Wular catchment of Kashmir Valley, India. GeoJournal 2020. [Google Scholar] [CrossRef]
  66. Zhuge, W.Y.; Yue, Y.J.; Shang, Y.R. Spatial-Temporal Pattern of Human-Induced Land Degradation in Northern China in the Past 3 Decades-RESTREND Approach. Int. J. Environ. Res. Public Health 2019, 16, 2258. [Google Scholar] [CrossRef] [Green Version]
Figure 1. Location of the study area: (a) Location of Yunnan Province in China. (b) Location of Honghe Prefecture in Yunnan. (c) Map of Honghe Prefecture with the Red River in blue.
Ijgi 09 00710 g001
Figure 2. Land cover changes of Honghe Prefecture.
Ijgi 09 00710 g002
Figure 3. Land productivity changes of Honghe Prefecture.
Ijgi 09 00710 g003
Figure 4. Soil organic carbon (SOC) changes of Honghe Prefecture.
Ijgi 09 00710 g004
Figure 5. Land degradation of Honghe Prefecture.
Ijgi 09 00710 g005
Figure 6. Data comparison of the SDG 15.3.1 and the land productivity.
Ijgi 09 00710 g006
Figure 7. Overlay of land cover change, night light, and administrative centers.
Ijgi 09 00710 g007
Figure 8. Satellite image at the junction of Mengzi and Gejiu on 10 November 2006.
Ijgi 09 00710 g008
Figure 9. Satellite image at the junction of Mengzi and Gejiu on 23 January 2015.
Ijgi 09 00710 g009
Figure 10. Panax notoginseng with black plastic nets.
Ijgi 09 00710 g010
Figure 11. Croplands without black plastic nets in 2010.
Ijgi 09 00710 g011
Figure 12. Croplands with some black plastic nets in 2014.
Ijgi 09 00710 g012
Table 1. Land cover transition matrix.
Final Class
ForestsGrasslandsCroplandsWetlandsArtificial AreasOther LandsWater Bodies
Original ClassForests0− *0
Grasslands+0+− *0
Croplands+0− *0
Wetlands00
Artificial areas++++0+0
Other lands++++00
Water bodies0000000
+: improved; −: degraded; 0: stable; *: inundation.
Table 2. Aggregation of the productivity sub-indicators.
Sub-IndicatorIndicator
TrendStatePerformanceProductivity
++0+
+++
+00+
+0+
+0+
+
0+00
0+0
0000
00
00
0
+0
+
00
0
0
+: improved; −: degraded; 0: stable.
Table 3. Conversion coefficients for the changes in land cover.
Land Cover (LC) CoefficientsForestsGrasslandsCroplandsWetlandsArtificial AreasOther LandsWater Bodies
Forests11f10.10.11
Grasslands11f10.10.11
Croplands1/f1/f11/0.710.10.11
Wetlands110.7110.10.11
Artificial areas2222111
Other lands2222111
Water bodies1111111
Different coefficients for each of the main global climatic regions: Temperate Dry (f = 0.80), Temperate Moist (f = 0.69), Tropical Dry (f = 0.58), Tropical Moist (f = 0.48), and Tropical Montane (f = 0.64).
Table 4. Land Cover (LC) transition area (km2) from 2005 to 2015.
LC Classes in 2005LC Classes in 2015 (km2)
ForestsGrasslandsCroplandsWetlandsArtificial AreasOther LandsWater Bodies
Forests13,115.14.21.51.30.100
Grasslands227.69967.17.40.112.902.3
Croplands6.52.28513.40.18000.2
Wetlands0.3005.8000
Artificial areas0000133.900
Other lands0000000
Water bodies0.31.92.74.10085.7
Table 5. Land cover changes by cover class.
Area of 2005 (km2)Area of 2015 (km2)Change in Area (km2)Change in Area
Forests13,122.213,349.8227.61.7%
Grasslands10,217.49975.4−242−2.4%
Croplands8602.48525−77.4−0.9%
Wetlands6.111.45.386.9%
Artificial areas133.9226.99369.5%
Other lands0000.0%
Water bodies94.788.2−6.5−6.9%
Table 6. Summary of the changes in land cover (km2).
Land CoverImprovementStableDegradation
Forests013,115.17.1
Grasslands2359969.413
Croplands6.58513.482.5
Wetlands05.80.3
Artificial areas0133.90
Other lands000
Water bodies094.70
Total241.531,832.3102.9
Table 7. Summary of the changes in productivity.
Area (km2)Percent of Total Land Area
Total land area32,176.7100.0%
Land area with improved productivity11,664.136.2%
Land area with stable productivity15,656.348.7%
Land area with degraded productivity4761.614.8%
Land area with no data for productivity94.70.3%
Table 8. Summary of the changes in the SOC.
Area (km2)Percent of Total Land Area
Total land area32,176.7100.0%
Land area with improved SOC0.50.0%
Land area with stable SOC32,080.799.7%
Land area with degraded SOC79.80.3%
Land area with no data for SOC15.70.0%
Table 9. Summary of the Sustainable Development Goal (SDG) 15.3.1 indicator.
Area (km2)Percent of Total Land Area
Total land area32,176.7100.0%
Land area improved11,803.136.7%
Land area stable15,456.548.0%
Land area degraded4822.415.0%
Land area with no data94.70.3%
Table 10. Summary of changes for three land cover classes in productivity (km2).
ImprovementStableDegradation
Forests4931.36484.41698.3
Grasslands3783.44815.91363.2
Croplands2857.94014.61584.9
Sum of three classes11,572.615,314.94646.4
Total Area11,664.115,656.34761.6
Rate of three classes99.2%97.8%97.6%
Publisher’s Note: MDPI stays neutral with regard to jurisdictional claims in published maps and institutional affiliations.

