Form Follows Content: An Empirical Study on Symbol-Content (In)Congruences in Thematic Maps


Department of Geodesy and Geoinformation, Research Division Cartography, TU Wien—Vienna University of Technology, 1040 Vienna, Austria
ISPRS Int. J. Geo-Inf. 2020, 9(12), 719; https://0-doi-org.brum.beds.ac.uk/10.3390/ijgi9120719
Submission received: 30 September 2020
/
Revised: 11 November 2020
/
Accepted: 30 November 2020
/
Published: 2 December 2020
(This article belongs to the Special Issue Geovisualization and Map Design)
Abstract
:Through signs and symbols, maps represent geographic space in a generalized and abstracted way. Cartographic research is, therefore, concerned with establishing a mutually shared set of signs and semiotic rules to communicate geospatial information successfully. While cartographers generally strive for cognitively congruent maps, empirical research has only started to explore the different facets and levels of correspondences between external cartographic representations and processes of human cognition. This research, therefore, draws attention to the principle of contextual congruence to study the correspondences between shape symbols and different geospatial content. An empirical study was carried out to explore the (in)congruence of cartographic point symbols with respect to positive, neutral, and negative geospatial topics in monothematic maps. In an online survey, 72 thematic maps (i.e., 12 map topics × 6 symbols) were evaluated by 116 participants in a between-groups design. The point symbols comprised five symmetric shapes (i.e., Circle, Triangle, Square, Rhomb, Star) and one Asymmetric Star shape. The study revealed detailed symbol-content congruences for each map topic as well as on an aggregated level, i.e., by positive, neutral, and negative topic clusters. Asymmetric Star symbols generally showed to be highly incongruent with positive and neutral topics, while highly congruent with negative map topics. Symmetric shapes, on the other hand, emerged to be of high congruence with positive and neutral map topics, whilst incongruent with negative topics. As the meaning of point symbols showed to be susceptible to context, the findings lead to the conclusion that cognitively congruent maps require profound context-specific considerations when designing and employing map symbols.
1. Introduction
When we look at maps, “we see symbols spread out on the space of a document, on paper or a computer screen” and we expect these symbols to refer to geographic space [1] (p. 21). Through the mediation of signs, maps enable us to relate to spatial phenomena and events from a viewpoint beyond direct experience [2]. By this, maps enable us to imagine near as well as distant events, some of which we would never encounter otherwise. As such, cartographic maps are a form of communication, a means of conceiving, articulating, and structuring the human world [3].
However, albeit a map may be designed to convey a single focus of interest, it does not convey a single universal message [4]. The elements of a map are independent associative signs and symbols with a reference fixed by convention but not fixed by a single, unequivocal reference [5,6]. The map-making process must, therefore, follow particularly informed choices and deliberate decisions since the variety of methods and visual variables available to represent information allow for strikingly different results based on a single dataset [4].
One of the first decisions made by the cartographer concerns the type of symbolization to employ for a given topic [7]. Yet, to this day, the cartographer faces the challenge—as well as the creative joy—of near-infinite variations of signs and symbols to choose from. This challenging fact is addressed by cartographic semiotic frameworks, which aim to provide theoretical and practical guidance for cartographic design decisions. Still, which visual variables are most suitable for a given context? Which ones most congruent with a given type of spatial information, object, or phenomenon? While existing semiotic frameworks provide some theoretical direction, the selection for the most adequate visual signifier remains a difficult task [8]. At the same time, cartographic semiotic frameworks have so far predominantly addressed the dimension of cognitive, analytical congruence to help guide the selection between different types of visual variables [5]. These frameworks, however, do not encompass the dimensions of contextual congruences, such as when to employ a particular shape symbol for a given type of content. Such decisions are, yet, crucial, since they will affect how map-readers respond to the cartographic representation [9,10].
This research, therefore, draws attention to cartographic symbols as communication vehicles of contextual congruence. Point symbols in the form of different shapes are considered a core visual variable in cartography as well as over a wide range of visual disciplines [5,11,12]. In cartography, point symbols are prevalently employed in thematic maps to represent nominal data and to refer to and to locate geospatial events and objects. This research introduces the principle of contextual congruence to study the correspondence between shape symbols and different geospatial contents. This paper, first, outlines semiotic perspectives on the dimensions and relations of signs as communication vehicles (see Section 2). It further reports an empirical study that aimed to identify contextual (in)congruences between cartographic point symbols and different positive, neutral, and negative geospatial topics in monothematic maps (see Section 3 and Section 4). Finally, findings and implications for future research are addressed and discussed in Section 5 and Section 6.
2. Theoretical Background
Congruence is a quality or state of agreeing or coinciding [13], a condition of broadly corresponding to something or being in agreement with it in its essentials. Effective graphics are considered to follow the principle of congruence, where “the structure and content of the external representation should correspond to the desired structure and content of the internal representation” [14] (p. 249). Cartographic maps are such external representations. They depict a particular selection of geographic space on a spatial scale smaller than 1:1 [15]. As maps are restraint by scale, they require cartographic generalization [16]. Maps, therefore, simplify and regularize, reduce dimensionality, omit some information, and exaggerate others. The way maps schematize information is considered to be comparable to the way human minds schematize information [17]. High congruence between external representations and internal representations are recognized to be beneficial, such as to enhance cognitive processing fluency [17,18] and problem-solving [17,19]. High processing fluency is regarded to even be hedonically marked, i.e., eliciting positive affective reactions [20]. Contrariwise, “visualizations that do not match the mental schema require cognitive transformations to make the visualization and mental representation align” [21] (p. 3f). The mental effort needed for correcting mental mismatches and to resolve cognitive discrepancies can increase errors, increase the time to complete a task, and demand higher working memory [21,22]. Cartographers, therefore, strive to create cognitively congruent maps, such as by employing map symbols which are somehow associative to the type of information they refer to [5]. Maps are, however, a result of a myriad of choices, such as towards the type of information to include which to omit, as well as towards how to communicate information through specific cartographic signs. Cartographic maps are, therefore, considered selective representations [23], never value-free or neutral [24], but “culturally determined and ethnocentric in origin” [16] (p. 447).
As such, cartographic communication is a complex process between the map maker and map user [23,25,26], “wherein thought originating in one human mind is converted by that mind into physical forms according to rules developed by the culture in which he [she] lives” [27] (p. 184). The map and its elements are apprehended by the map reader, who constructs meaning by interpreting its symbols, colors, visual expressions, and the like [4,27]. Cartographic communication from a semiotic perspective is considered a triadic, interrelated process between the sign-vehicle, which refers to the physical sign, the referent, which stands for the phenomenon or object of reference the sign-vehicle refers to, and the interpretant, which comprises the sign-vehicle’s effects on the interpreter, such as its meaning [28,29,30]. As meanings are mental events, they are difficult to measure and challenging to distinctively define [30,31]. Due to its imprecision, the semiotician Charles Morris even deliberately excluded the concept of meaning from his semiotic theory [29]. Later, theorists have attempted to decompose the “many meanings of ‘meaning’” [31] (p. 2), suggesting two core dimensions: the dimension of reference and the dimension of sense [30]. On the dimension of reference, all cartographic sign-vehicles can be considered identifiers which either apprise, inform, state, designate, indicate, label, or denote [30,32]. Map signs may, however, also connote, prescribe, express, and stimulate ideas [2,32]. Hence, whilst map signs may be analytically congruent with a specific type of content, some may be more—and others less—contextually congruent, such that different map signs may stimulate different associations and ideas about a depicted geospatial phenomenon. Cartographic maps and the signs therein are, therefore, regarded to communicate on both semiotic dimensions of meaning, i.e., on the dimension of reference and on the dimension of sense [30,32].
Throughout recent decades, cartographic semioticians have aspired to establish a mutually shared set of signs and semiotic rules to enhance the communication of geospatial information. Yet, most of these frameworks have focused on the dimension of reference, such as to aptly inform, state, indicate, or label geospatial information. One of the most prominent examples of such cartographic semiotic frameworks was established in the 1970s by the French cartographer Jacques Bertin, who appeared to be the first to formally propose semiotic rules aiming to help guide the cartographic design process [5]. He proposed a set of six fundamental visual variables for two-dimensional maps (i.e., size, color value, texture, color hue, orientation, and shape). He further proposed a set of rules to guide their cartographic employment, such as when they may be considered suitable to represent quantitative, ordinal, or nominal data [5]. Bertin’s semiotic framework aimed to cover the core “manipulable primitives of graphic sign vehicles from which any information graphic can be built” [33] (p. 2497).
While Bertin’s framework is still generally accepted in information visualization and cartography [33], it has also been criticized to be dogmatic, limitedly empirically verified, and incomplete [32]. Bertin’s semiology has, therefore, been expanded over the years, such as to meet the characteristics of different map types and map uses (e.g., static tactile maps, dynamic visual maps, dynamic audio maps) [32] as well as for different data characteristics, such as for visualizing geospatial uncertainty [33,34]. In recent years, cartographic semiotic research has further begun to empirically assess the effects of cartographic design decisions on human responses. Empirical research, for example, showed that cognitive congruent visualizations, i.e., those of greater cognitive fit, will produce faster and more effective decisions [21]. A draw to cognitive congruent map symbols can already be found in school children, indicated by the associative and metaphorical use of signs and symbols even at an early age [8,35]. Empirical assessments on the influence of cartographic design decisions on human responses further showed that supposedly simple changes of cartographic sign-vehicles can lead to substantially different experiences and responses, such as different visual map styles will influence map readers’ judgments, trust, liking, and recall [9,36], as well as emotional responses [37,38]. Likewise, the style of line shapes in origin-destination flow maps (e.g., curved versus straight flow lines) showed to significantly impact the map users’ preferences and to influence judgment accuracy [10]. Empirical research, moreover, highlights a significant impact on map reading intuitiveness, judgments, and preferences towards maps based on how uncertainty is cartographically visualized [33,39,40,41]. Empirical research on abstract map symbols further suggests a significant influence on detection speed in visual search tasks [42] as well as on associative and affective responses [43,44] based on symbol type.
While cartography allows for a sheer infinite variety of signs and symbols to visualize geospatial information, the aforementioned empirical findings strongly suggest that only a few of those may be considered to be effective and suitable for a given context and content. Cartographic semiotic research has so far strongly focused on the dimension of reference, i.e., on analytic congruences between sign and meaning. Theorists, however, further emphasize the dimension of sense as a crucial factor in cartographic communication processes, such that the meaning of signs may vary by context. Such semiotic differentiations have, however, often been neglected in cartographic research and applications of semiotics. “Despite a large number of papers dealing with communication in cartography, relatively few have pursued in detail the analysis of map symbols, and the relationships between map symbols and semiotic theory” [2] (p. 179). Consequently, “the difference of what a map sign means and what it represents has become blurred” [32] (p. 245). Research highlights the persisting need for a differentiated understanding of how visual variables can be used to congruently represent geospatial information by taking into consideration the different dimensions of meaning. The present research, therefore, draws attention to cartographic point symbols employed in thematic maps and explores their congruence with different geospatial contexts.
3. Materials and Methods
An empirical study was carried out to explore how congruent—as well as incongruent—cartographic point symbols are experienced in different geospatial contexts. Geospatial context, in the present study, referred to three types of content, i.e., geospatial topics of positive, neutral, or negative character. For each of the three content groups, monothematic maps were created, in which point symbols for representing a given map topic were systematically varied. The final set of monothematic maps was used as stimulus material and the perceived symbol-content congruence of each map was rated by study participants. The following sections describe the materials and methods of this empirical study in detail.
3.1. Materials and Study Design
An online survey was set up to empirically assess the (in)congruence of abstract map symbols with respect to different thematic map content. Twelve map topics were selected a priori by the experimenter, i.e., four positive, four neutral, and four negative topics, to test for symbol-content congruences (see Table 1).
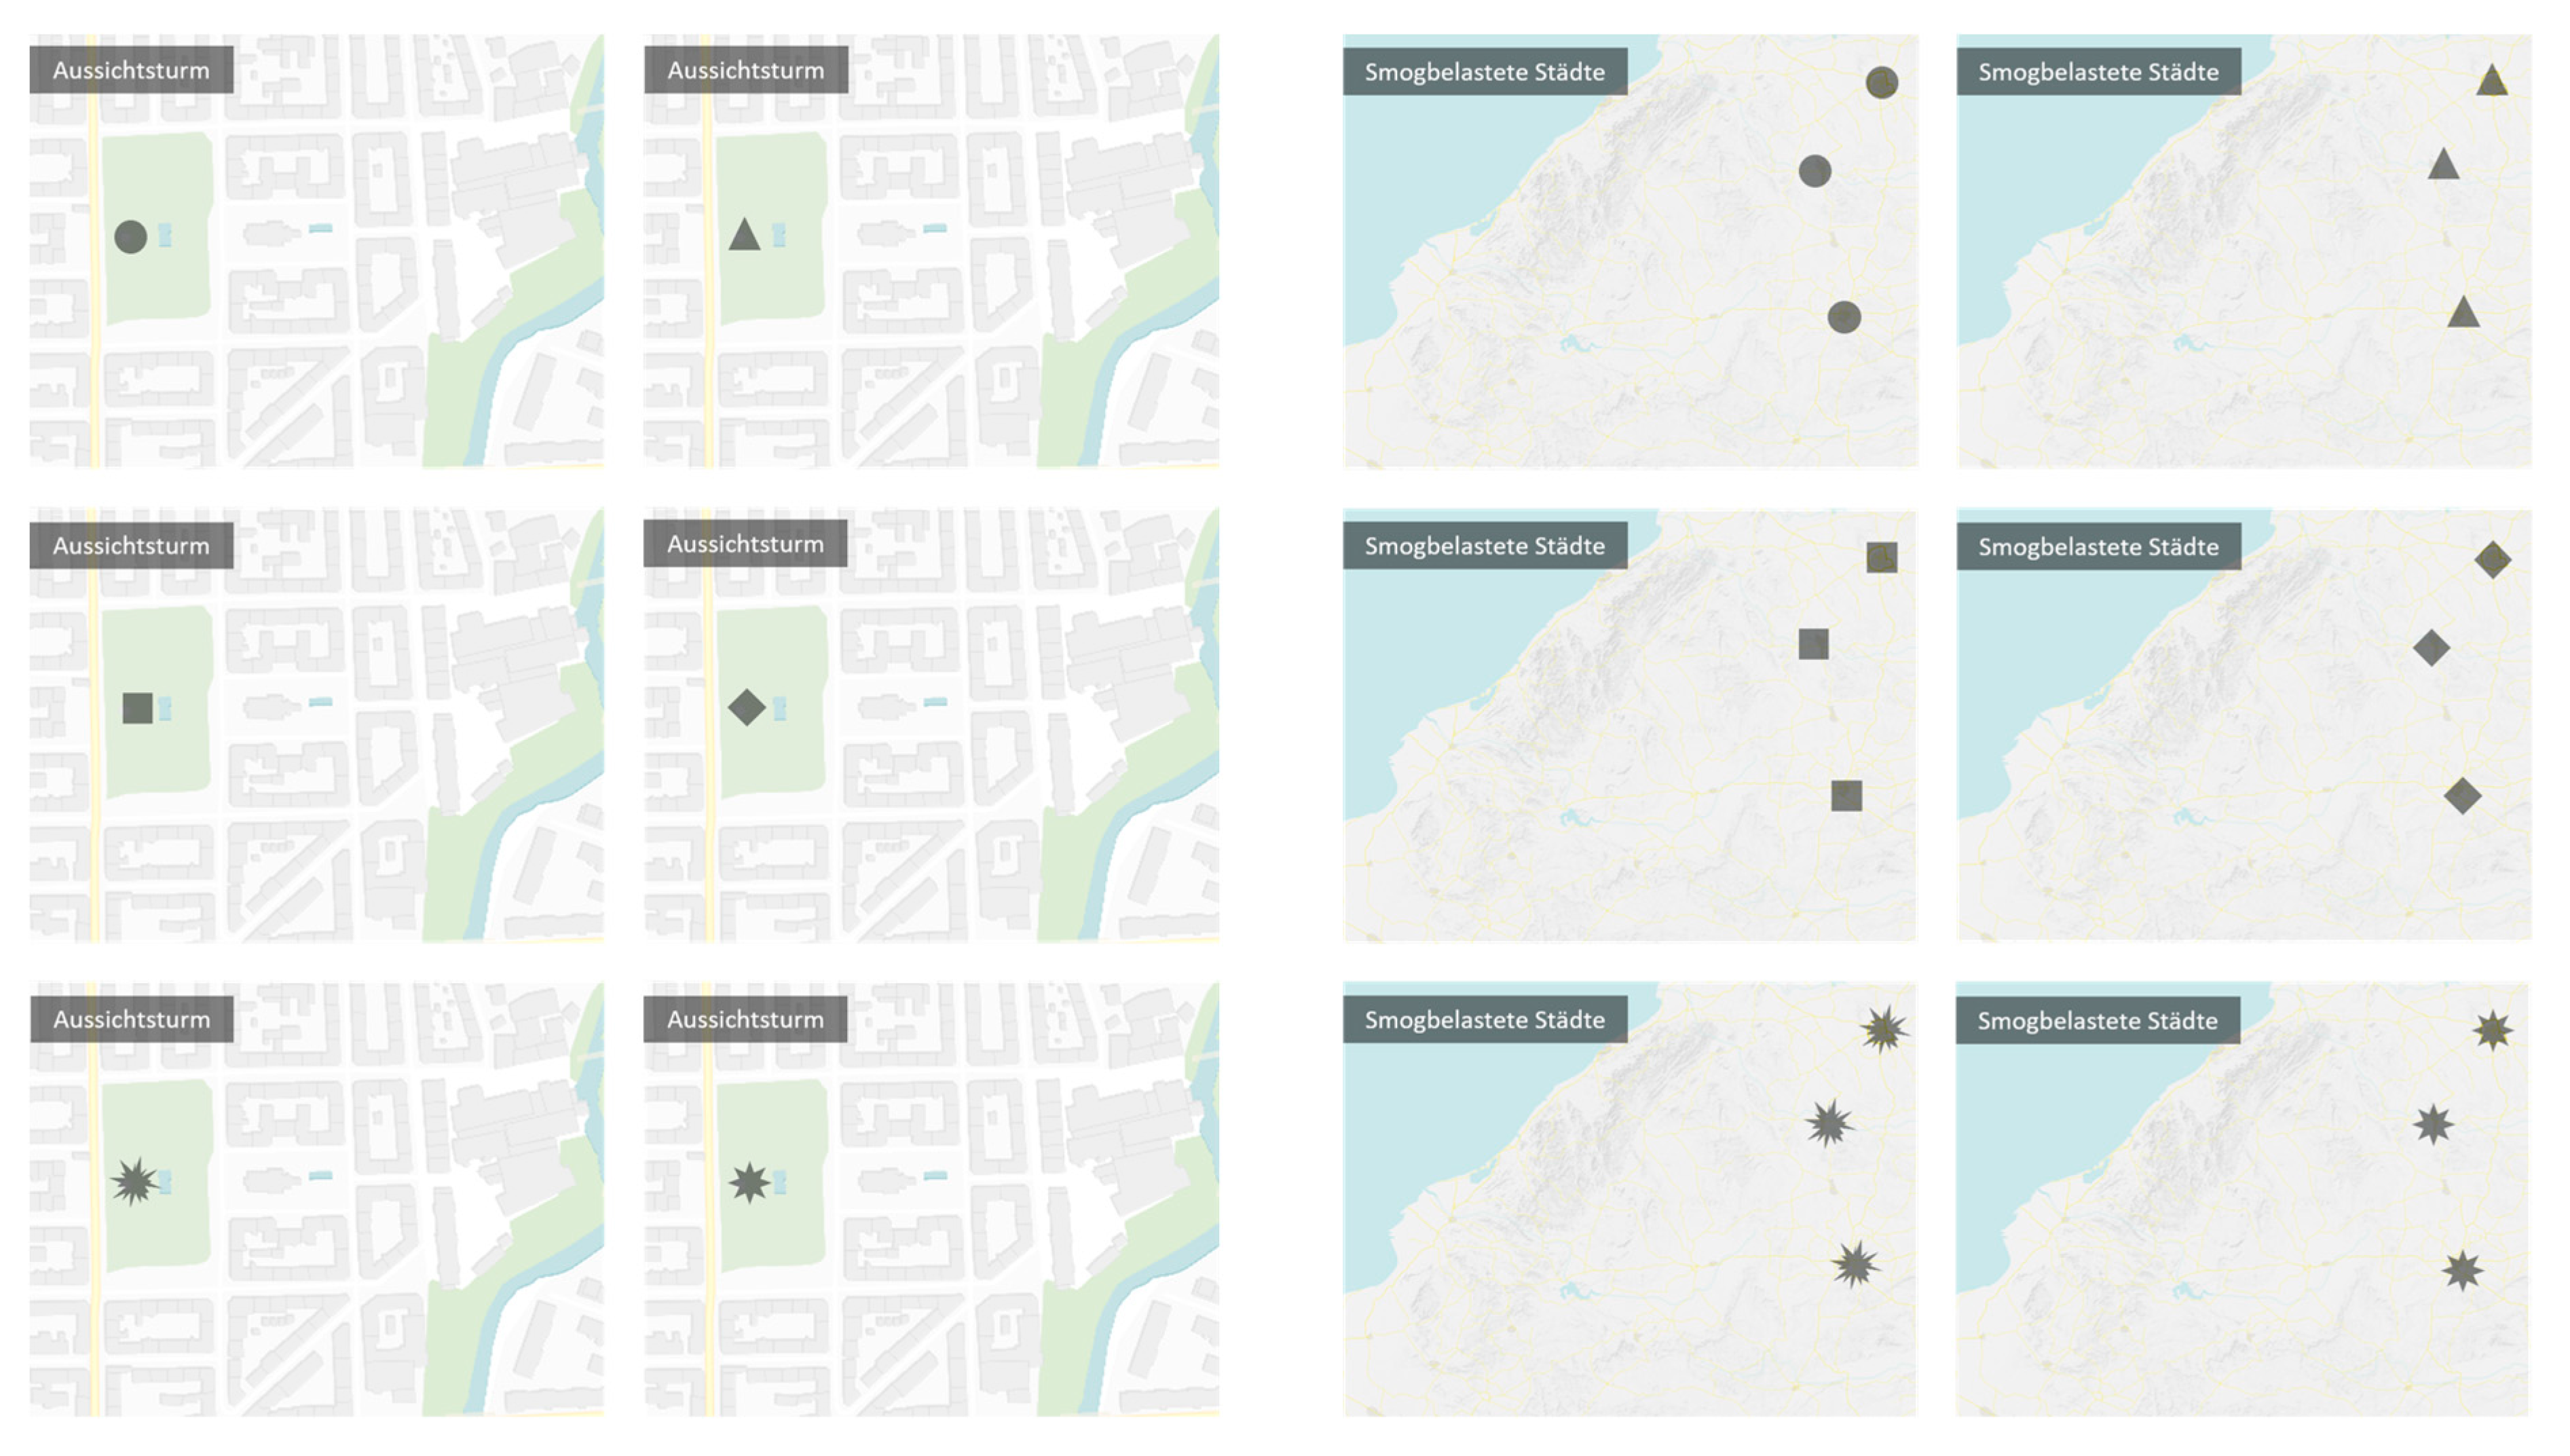
For each map topic, a set of six thematic maps were created, where each map depicted one of six abstract shape symbols, i.e., Circle, Triangle, Square, Rhomb, Star, and Asymmetric Star (for examples see Figure 1). The map symbols used in the present study refer to commonly used symmetric shapes in thematic cartography and related visual disciplines [5,45]. In addition, one asymmetric star shape was incorporated into the stimulus set, as related literature indicates particular perceptual qualities of asymmetric shapes, such as quicker detection times in visual search tasks [46], and distinct negative hedonic qualities of asymmetric star symbols [44]. Map symbols were displayed in black in 50 percent transparency, on light-hued basemaps. Basemaps were created to thematically correspond with each map topic. As a result, the basemaps used for the twelve map topics varied by content and scale. For example, the basemap for illustrating a “Traffic accident” displayed a street network, while the basemap for locating a “Lookout tower” indicated urban structures and settlements. Topics that referred to events of a single location were depicted by maps displaying one map symbol, while topics referring to events of multiple locations were represented by three map symbols (see Figure 1 for examples). The final stimulus set comprised 72 maps, as a result of six map stimuli employed for each of the twelve map topics.
A between-groups design was applied, which randomly assigned participants to one of two stimulus groups. This approach aimed to minimize learning and response transfer across the stimulus conditions. As a result, each participant assessed half of the stimulus set, i.e., 36 maps. The online survey was carried out in the German language by using the software LimeSurvey [47].
After the survey briefly introduced the aim of the study, which was phrased as to explore how shape symbols and maps are subjectively perceived, participants were instructed to proceed with map evaluation tasks. In these tasks, participants were asked to rate the (in)congruence between each map topic and its cartographic representation on a unipolar 6-point rating scale. The rating scale ranged from 0 (i.e., the cartographic representation does not suit the topic at all) to 5 (i.e., the representation suits the topic very well). Each map stimulus was presented individually, consecutively, and in a randomized order, at a size of 5.
After the map evaluation task, participants rated each map topic on an 11-point Likert scale, from −5 (very negative) to +5 (very positive). These topic ratings were later subjected to empirically identify homogeneous topic clusters of positive, neutral, and negative valence (see Section 4.1).
Sociodemographic data were gathered at the end of the survey, regarding the participants’ affinity for graphic design (self-evaluation on a unipolar 4-point rating scale, from “not at all” to “very affine”, with the additional option for “no answer”), their affinity for maps or cartography (unipolar 4-point rating scale, from “not at all” to “very affine”, or “no answer”), age, and gender. At the end of the survey, participants were also asked to indicate the devices they used for completing the survey (i.e., desktop PC, laptop, tablet, or smartphone).
3.2. Participants
Bachelor’s students of Regional Planning were recruited from a course on “Thematic Cartography in Regional Planning” held in winter term 2019 at TU Wien—Vienna University of Technology, Austria. Students participated voluntarily and received course credits in the form of bonus points, which counted towards their final grades. The online survey was sent to students in December 2019.
In total, 116 students completed the survey (49 males, 64 females, one person of diverse gender, two missing responses). Participants were randomly assigned to one of two stimulus groups, resulting in 63 participants who completed stimulus material A and 53 individuals who completed stimulus material B, which both comprised a set of 36 map stimuli. Of all participants, 109 persons indicated their age (M = 22.10, SD = 3.29, Min = 18, Max = 35). The majority of participants used laptops to complete the questionnaire (85.3%), followed by desktop PCs (10.3%), tablets (3.4%), and smartphones (0.9%, i.e., one person). Most participants indicated their affinity for graphic design to be moderate to high (somewhat affine = 29.3%; quite affine = 37.9%; very affine = 25.9%), while one person reported to have no interest in graphic design (0.9%). Seven individuals (6.0%) did not answer this question. The participants’ affinity for cartographic design showed to be moderate in most cases (somewhat affine = 30.2%; quite affine = 50.9%) and high in 12.9% of the cases. Seven individuals (6.0%) did not report their affinity for cartographic design.
4. Results
The study collected symbol-content congruency ratings for 72 map stimuli (12 maps × 6 stimulus conditions) from 116 participants in a between-groups study design. It also collected valence ratings for each of the twelve topics. These two sets of data were statistically analyzed by using the statistical software package SPSS [48] and XLStat addon for Microsoft Excel [49].
First, valence ratings were subjected to statistical analyses to identify homogeneous topic clusters (see Section 4.1. for details). These topic clusters were subsequently used to analyze the participants’ symbol-content congruency ratings on a cluster-level as well as individually by each map topic (see Section 4.2).
4.1. Topic Analysis
Twelve map topics were used in the present study and were selected a priori. To empirically assess each topic’s connotative quality, the participants’ valence ratings for each topic were subjected to statistical analyses. The topics’ valence ratings generally ranged from very negative (−5) to very positive (+5). The descriptive statistics of these ratings are summarized in the Supplementary Material Table S1.
A hierarchical cluster analysis was performed based on the topics’ valence ratings to statistically identify topic clusters of similar qualities. An agglomerative clustering approach was applied, which starts with each item as a cluster and progressively links the items based on their estimate of distances to one another. A cluster distance measure of average linkage was employed, which balances the limitations of single and complete linkage methods, i.e., using information about all pairs of distances to assign cluster membership not just the nearest or the farthest item pairs.
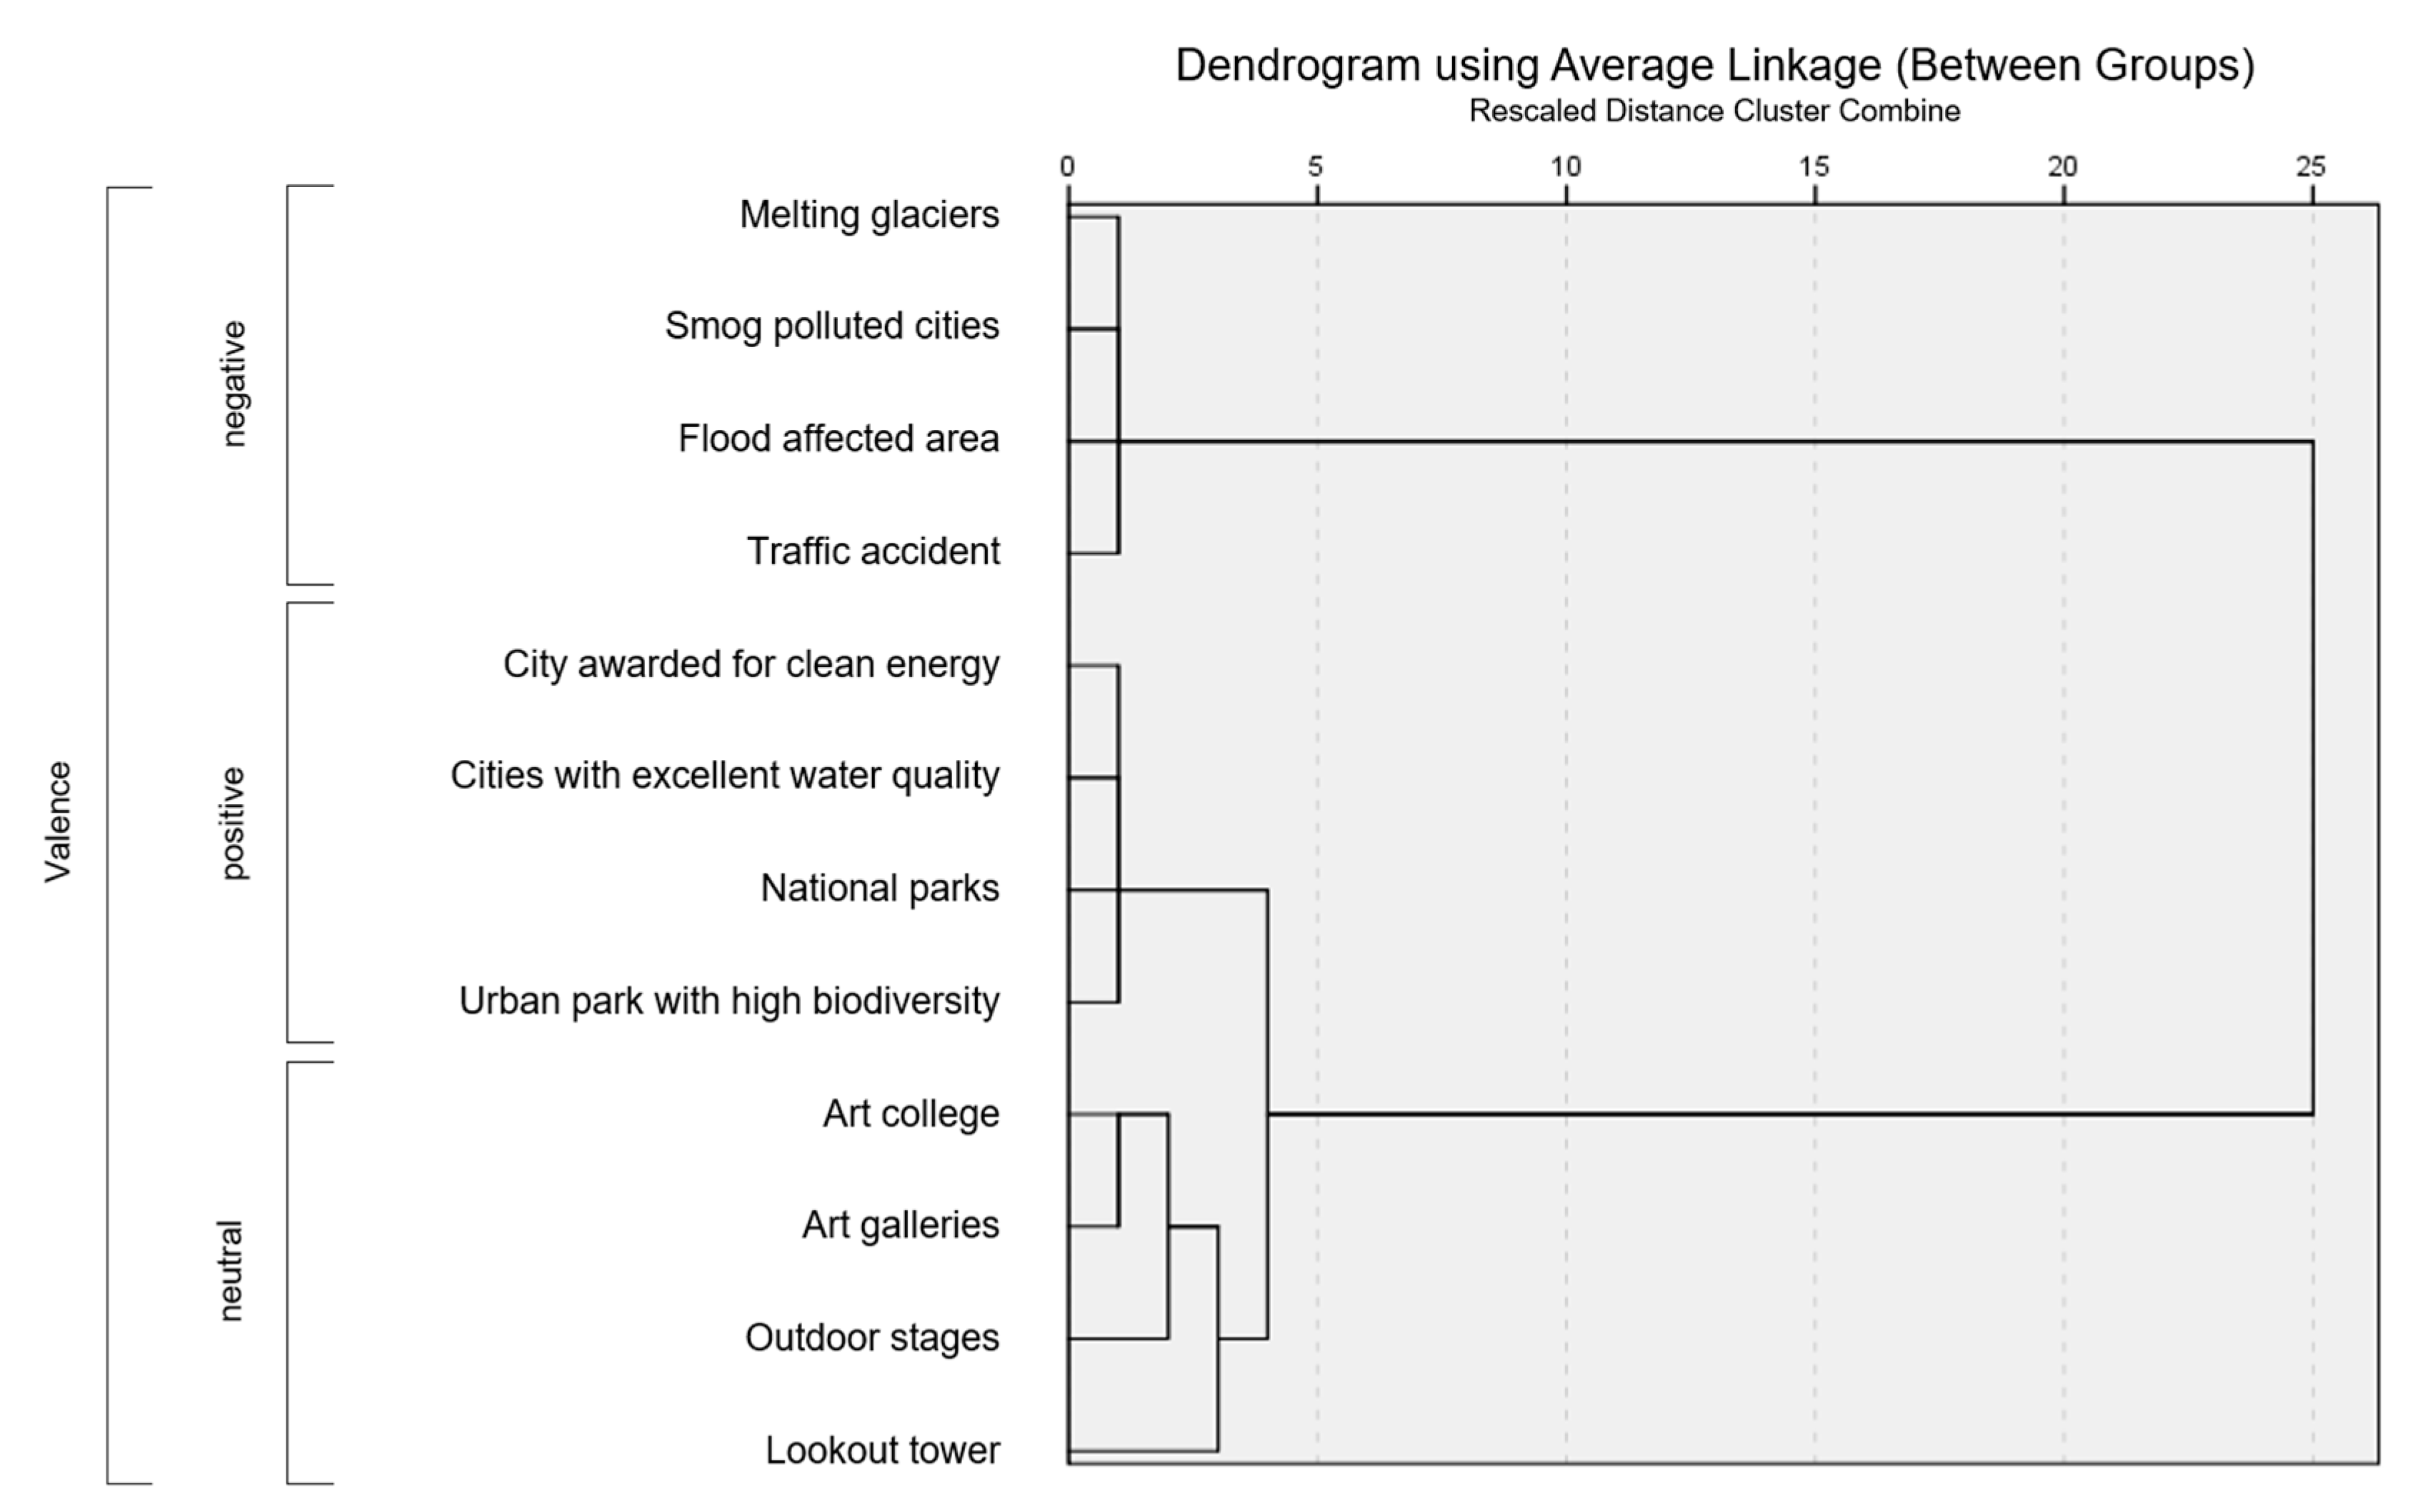
Results indicate a three-cluster solution (see Figure 2) and confirm the three clusters of positive, neutral, and negative topics that had been initially compiled a priori by the experimenter (see Table 1). The cluster analysis dendrogram further indicates a metaproximity between neutral topics and positive topics, suggesting a more proximal relation between the selected neutral and positive topics and a more distant relation of both towards the negative topic cluster.
The findings from hierarchical cluster analysis were subsequently used for the next stages of data analysis, where the twelve thematic maps were assigned to their corresponding positive, neutral, or negative topic cluster. In the next stages of analysis, differences between symbol-content congruency ratings were, first, statistically analyzed by each topic cluster, before they were assessed individually by each map topic (see Section 4.2).
4.2. Map Analysis
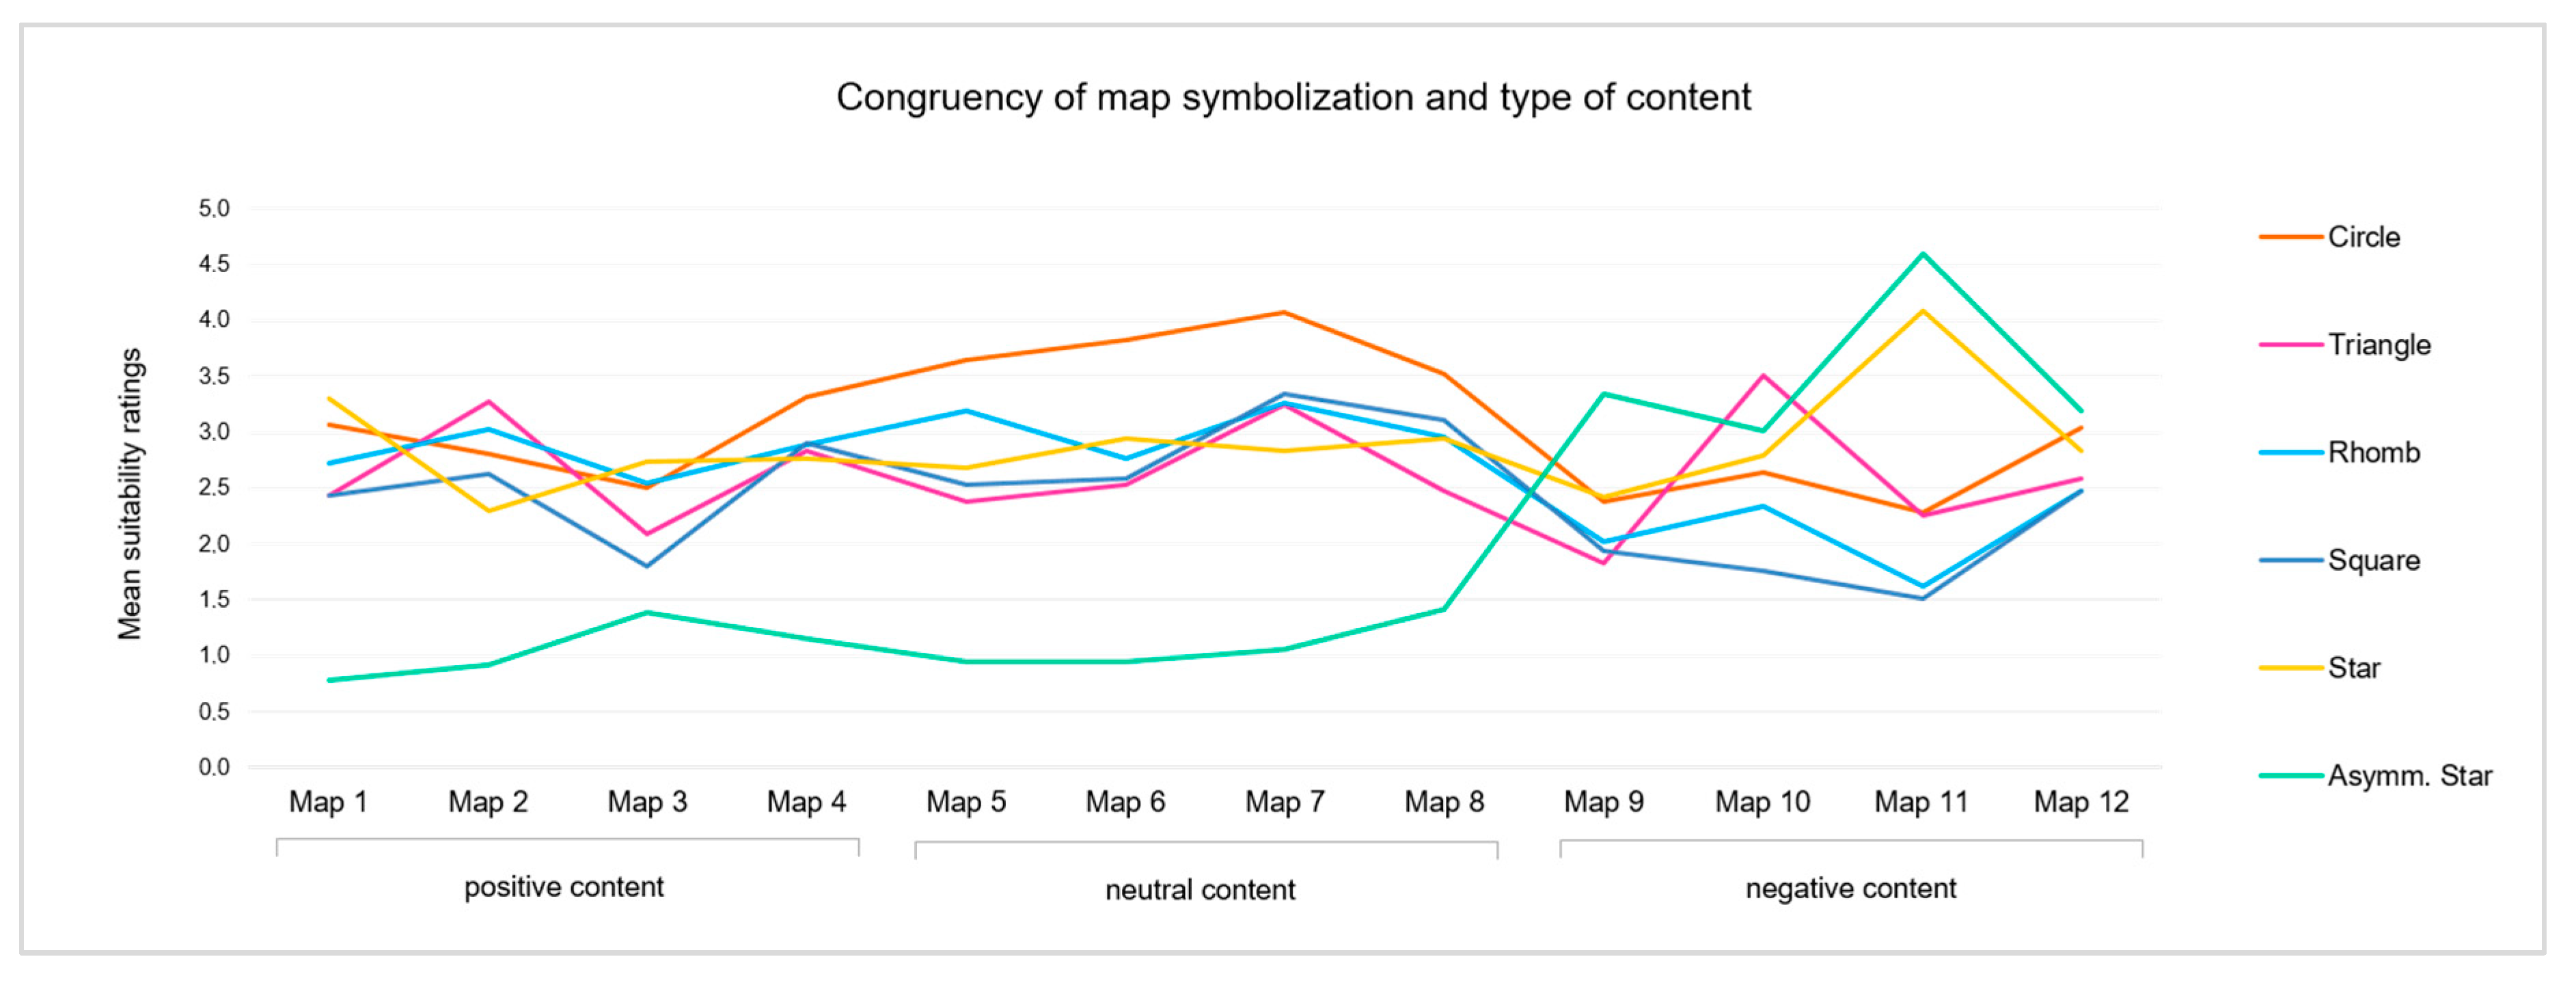
Based on participants’ symbol-content congruency ratings of the 72 thematic map stimuli (i.e., 12 map topics × 6 symbols), mean ratings were computed for each map and each map symbol. Figure 3 visualizes the results, indicating fairly similar ratings for symmetric map symbols when representing positive or negative content, while the Asymmetric Star symbol appeared to be rated least suitable for referring to positive or neutral map content. In contrast, Asymmetric Star symbols showed to be rated as most congruent for cartographically relating to negative geospatial topics.
To explore for significant differences between the map stimuli, participants’ symbol-content (in)congruency ratings were subjected to statistical analyses. First, participants’ responses were analyzed on an aggregated level, i.e., according to the three topic clusters identified by agglomerative hierarchical cluster analysis (see Section 4.2.1). Second, symbol-content congruences were analyzed individually, i.e., according to each of the twelve map topics (see Section 4.2.2, Section 4.2.3, and Section 4.2.4).
Both stages of analysis followed a two-step procedure. Symbol-content (in)congruency ratings were first subjected to a Durbin-Skillings-Mack test for nonparametric data to identify overall significant differences. The Durbin-Skillings-Mack procedure reveals if the null hypothesis must be rejected, i.e., if at least one result of symbol-content congruence significantly differs from another. The Durbin-Skillings-Mack test can be considered as an extension of the Friedman test. While the Friedman test can only be used in cases of complete paired samples, the Durbin-Skillings-Mack test applies a block design and, thus, allows to compare paired samples of unequal size [50]. To follow up on significant findings, post hoc Conover-Iman analyses were applied subsequently to identify subsets of homogeneous symbol-content congruences in greater detail. The post hoc Conover-Iman procedure performs multiple pairwise comparisons for nonparametric data based on rank differences [51]. Post hoc procedures generally explore the data for between-group differences by comparing all possible combinations of pairs [52]. As such statistical procedures conduct multiple pairwise comparisons, they also correct the significance levels such that the overall Type I error rate (i.e., significance level α, which is the probability of rejecting the null hypothesis given that it is true) across all comparisons remains 0.05 [52]. Hence, a Bonferroni correction was applied as part of the post hoc Conover-Iman analyses to ensure that despite multiple pairwise comparisons the cumulative Type I error remains below 0.05.
4.2.1. Topic Clusters and Symbol Congruence
In the first stage of analysis, participants’ congruency ratings were aggregated and analyzed according to the three positive, neutral, and negative topic clusters, which had been identified by agglomerative hierarchical cluster analysis. For each of the three valence clusters, a Durbin-Skillings-Mack procedure was performed, revealing highly significant differences (p < 0.001) between the symbol congruency ratings for either of the three topic clusters (see Table 2).
To follow up on these findings, Conover-Iman post hoc tests were performed for each of the three map clusters. As part of the analysis, a Bonferroni correction was applied which controls for Type I error by dividing α by the number of pairwise comparisons. The ratings of six map symbols were pairwise compared within each map cluster and resulted in 15 pairwise combinations. The Bonferroni correction, therefore, set the significance levels at α = 0.0033 (i.e., Bonferroni corrected α = 0.5/15), and differences between the multiple pairwise comparisons were interpreted accordingly (for detailed Conover-Iman test results see Supplementary Material Table S2).
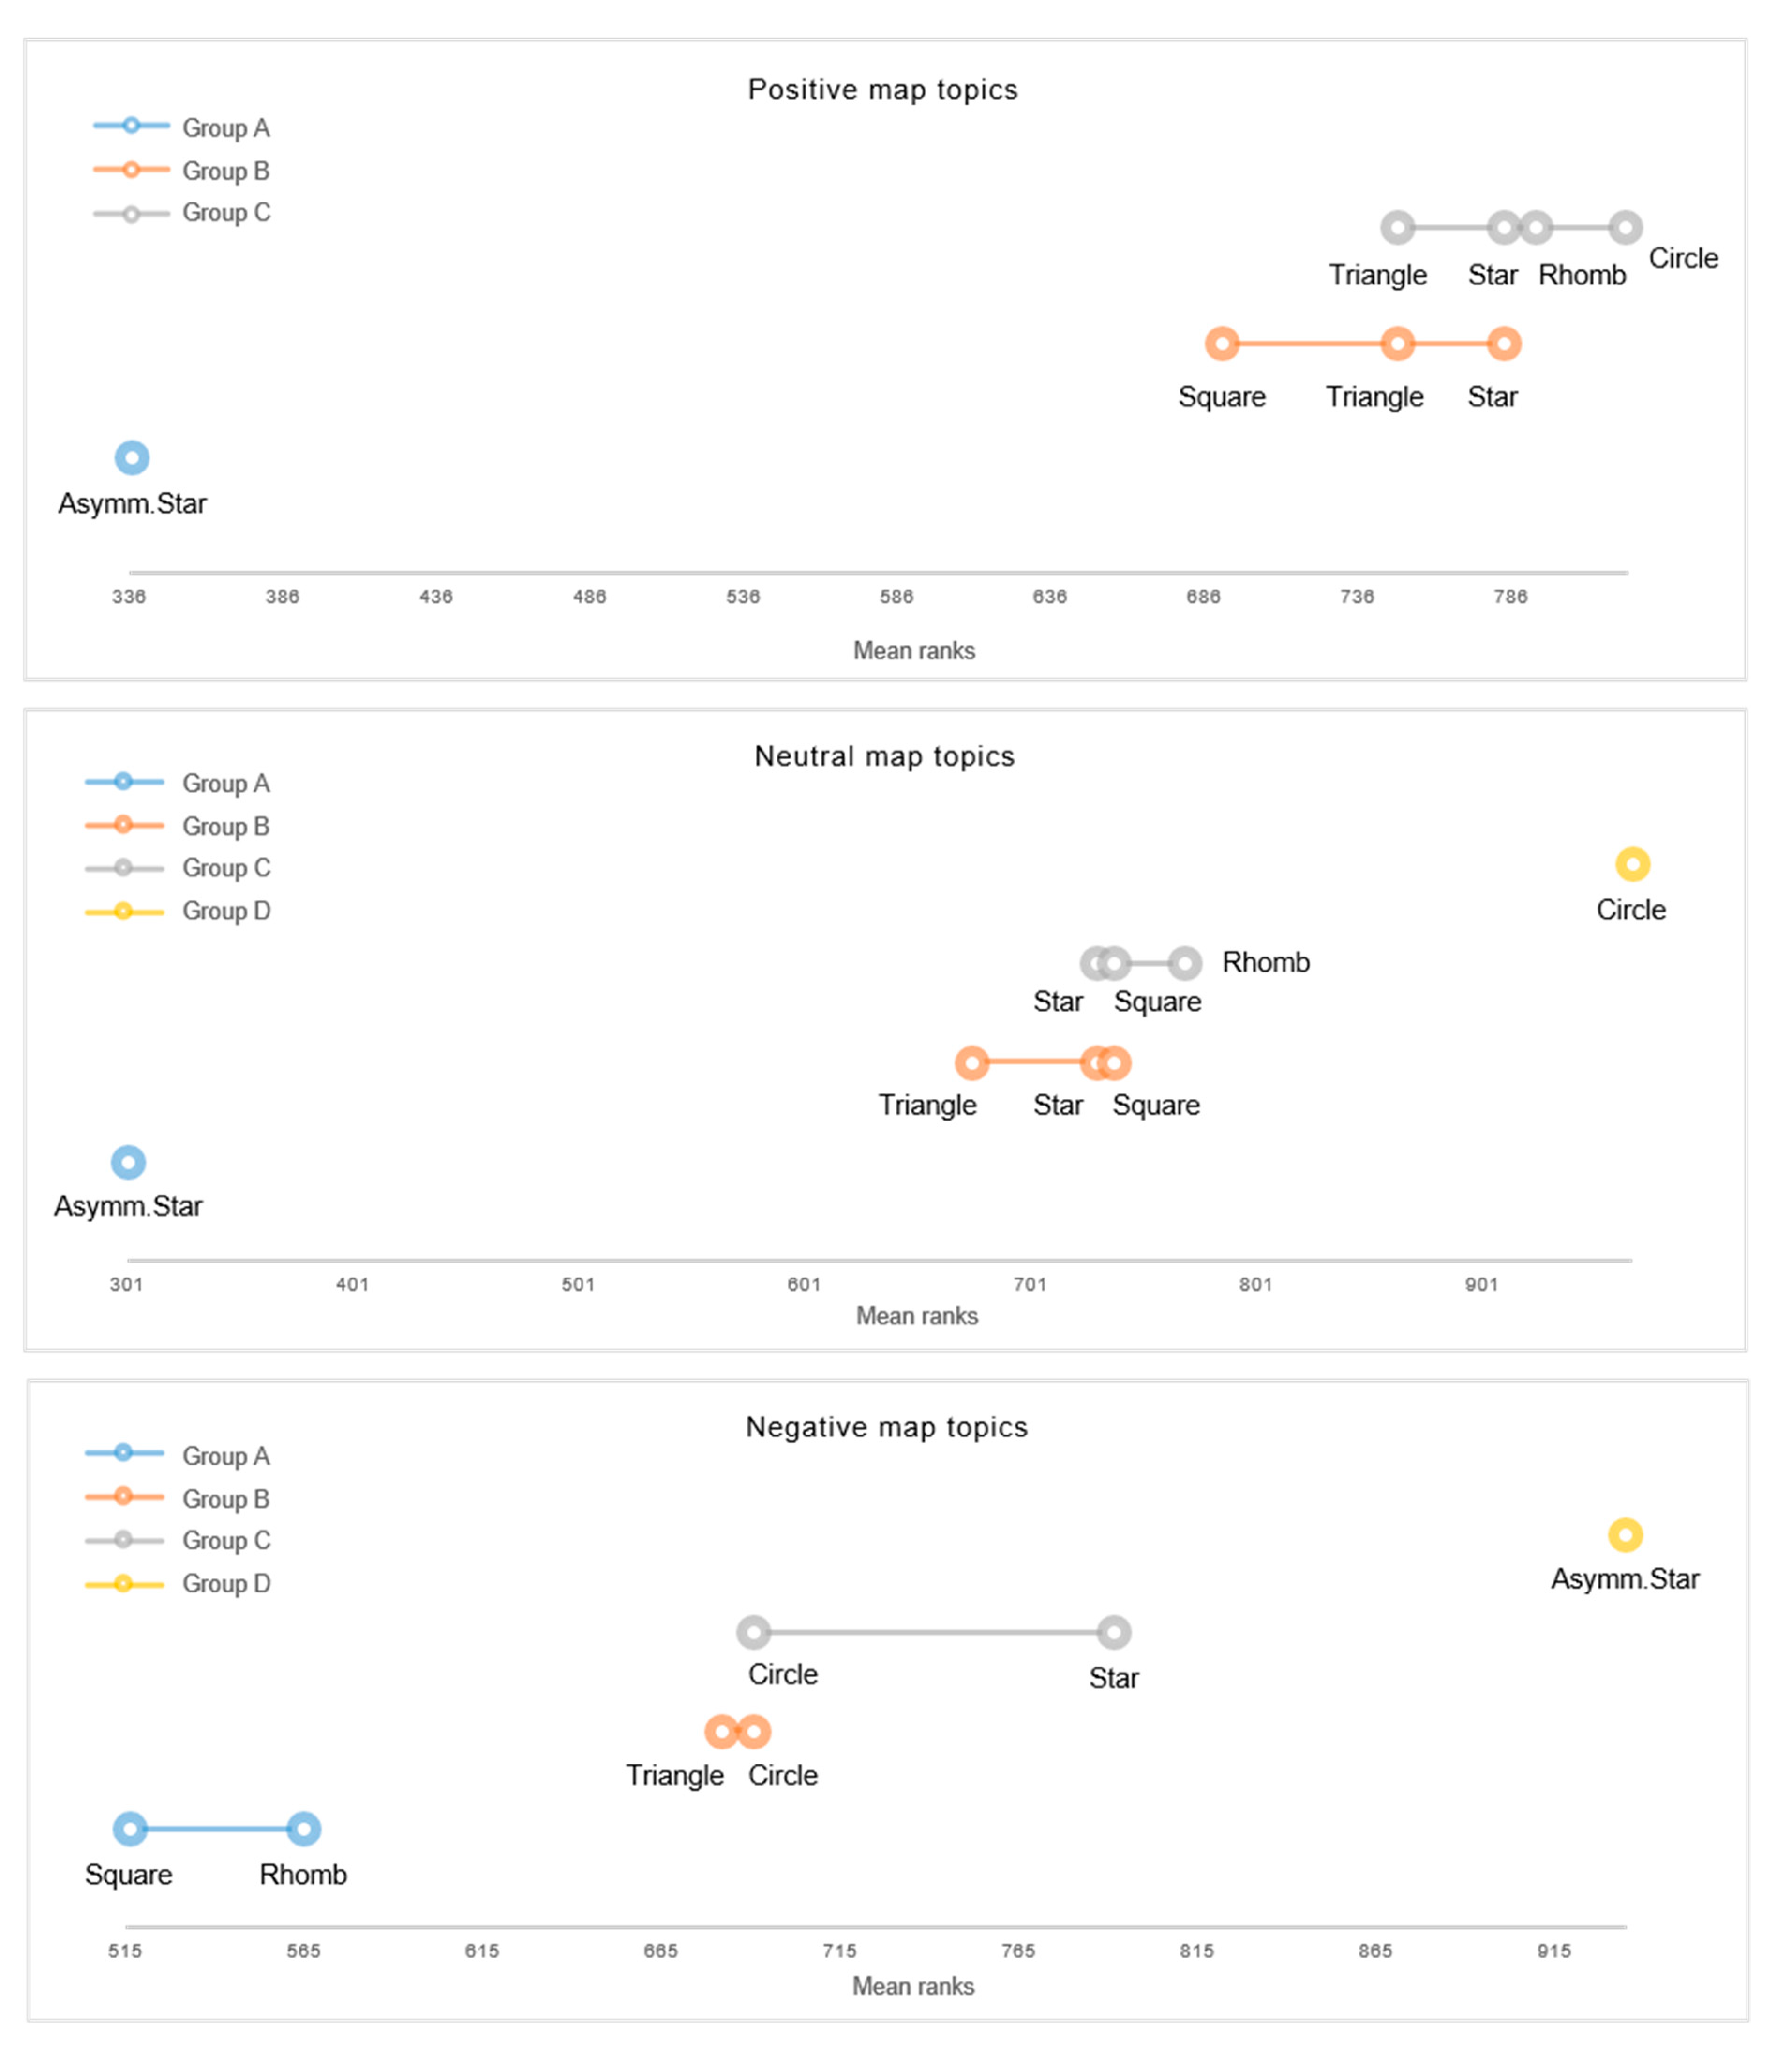
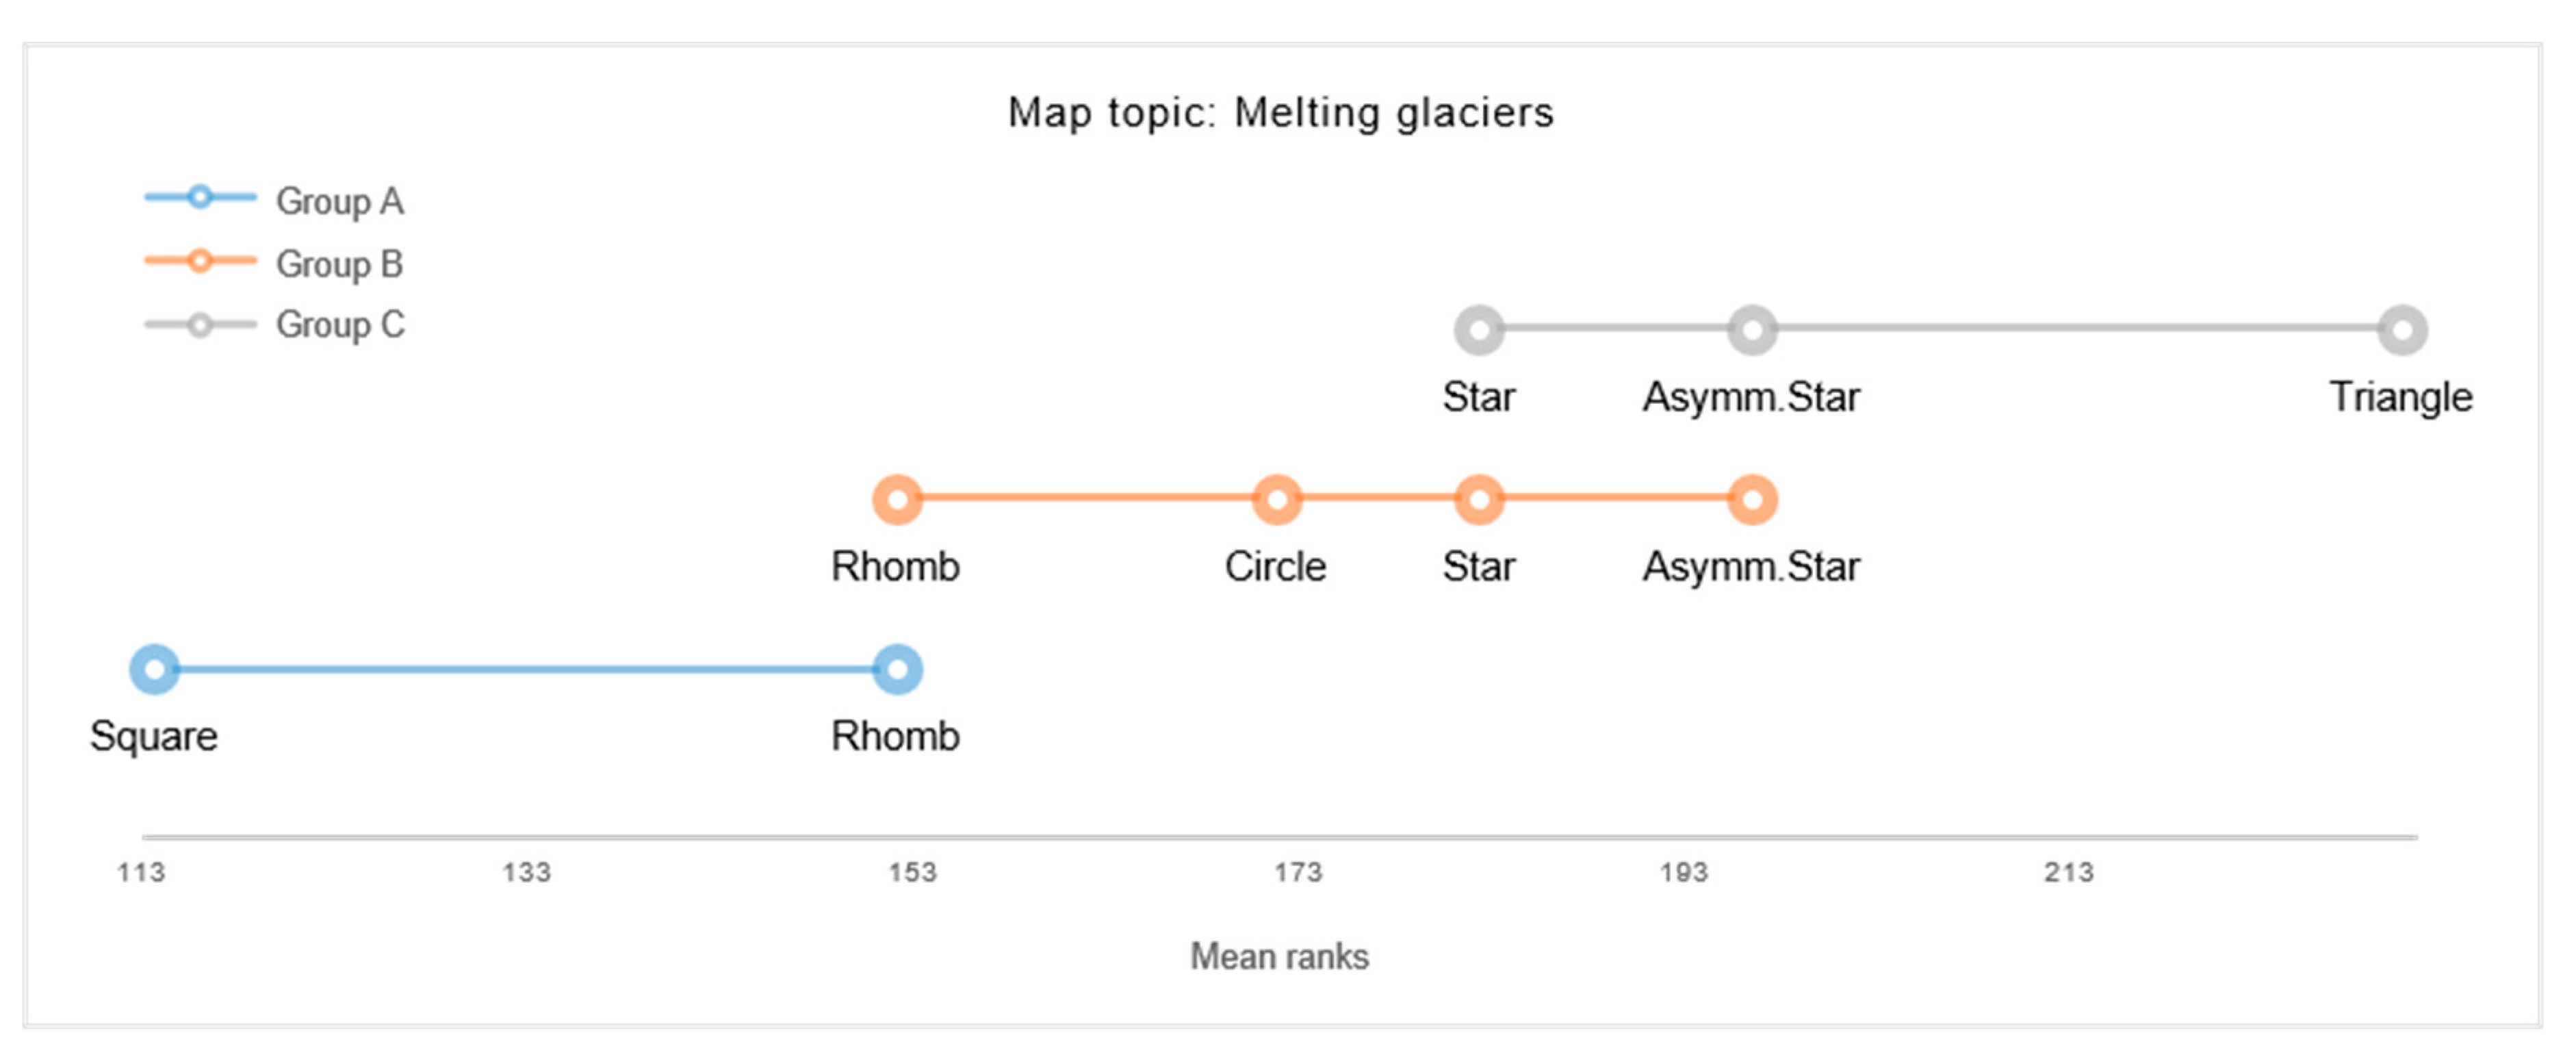
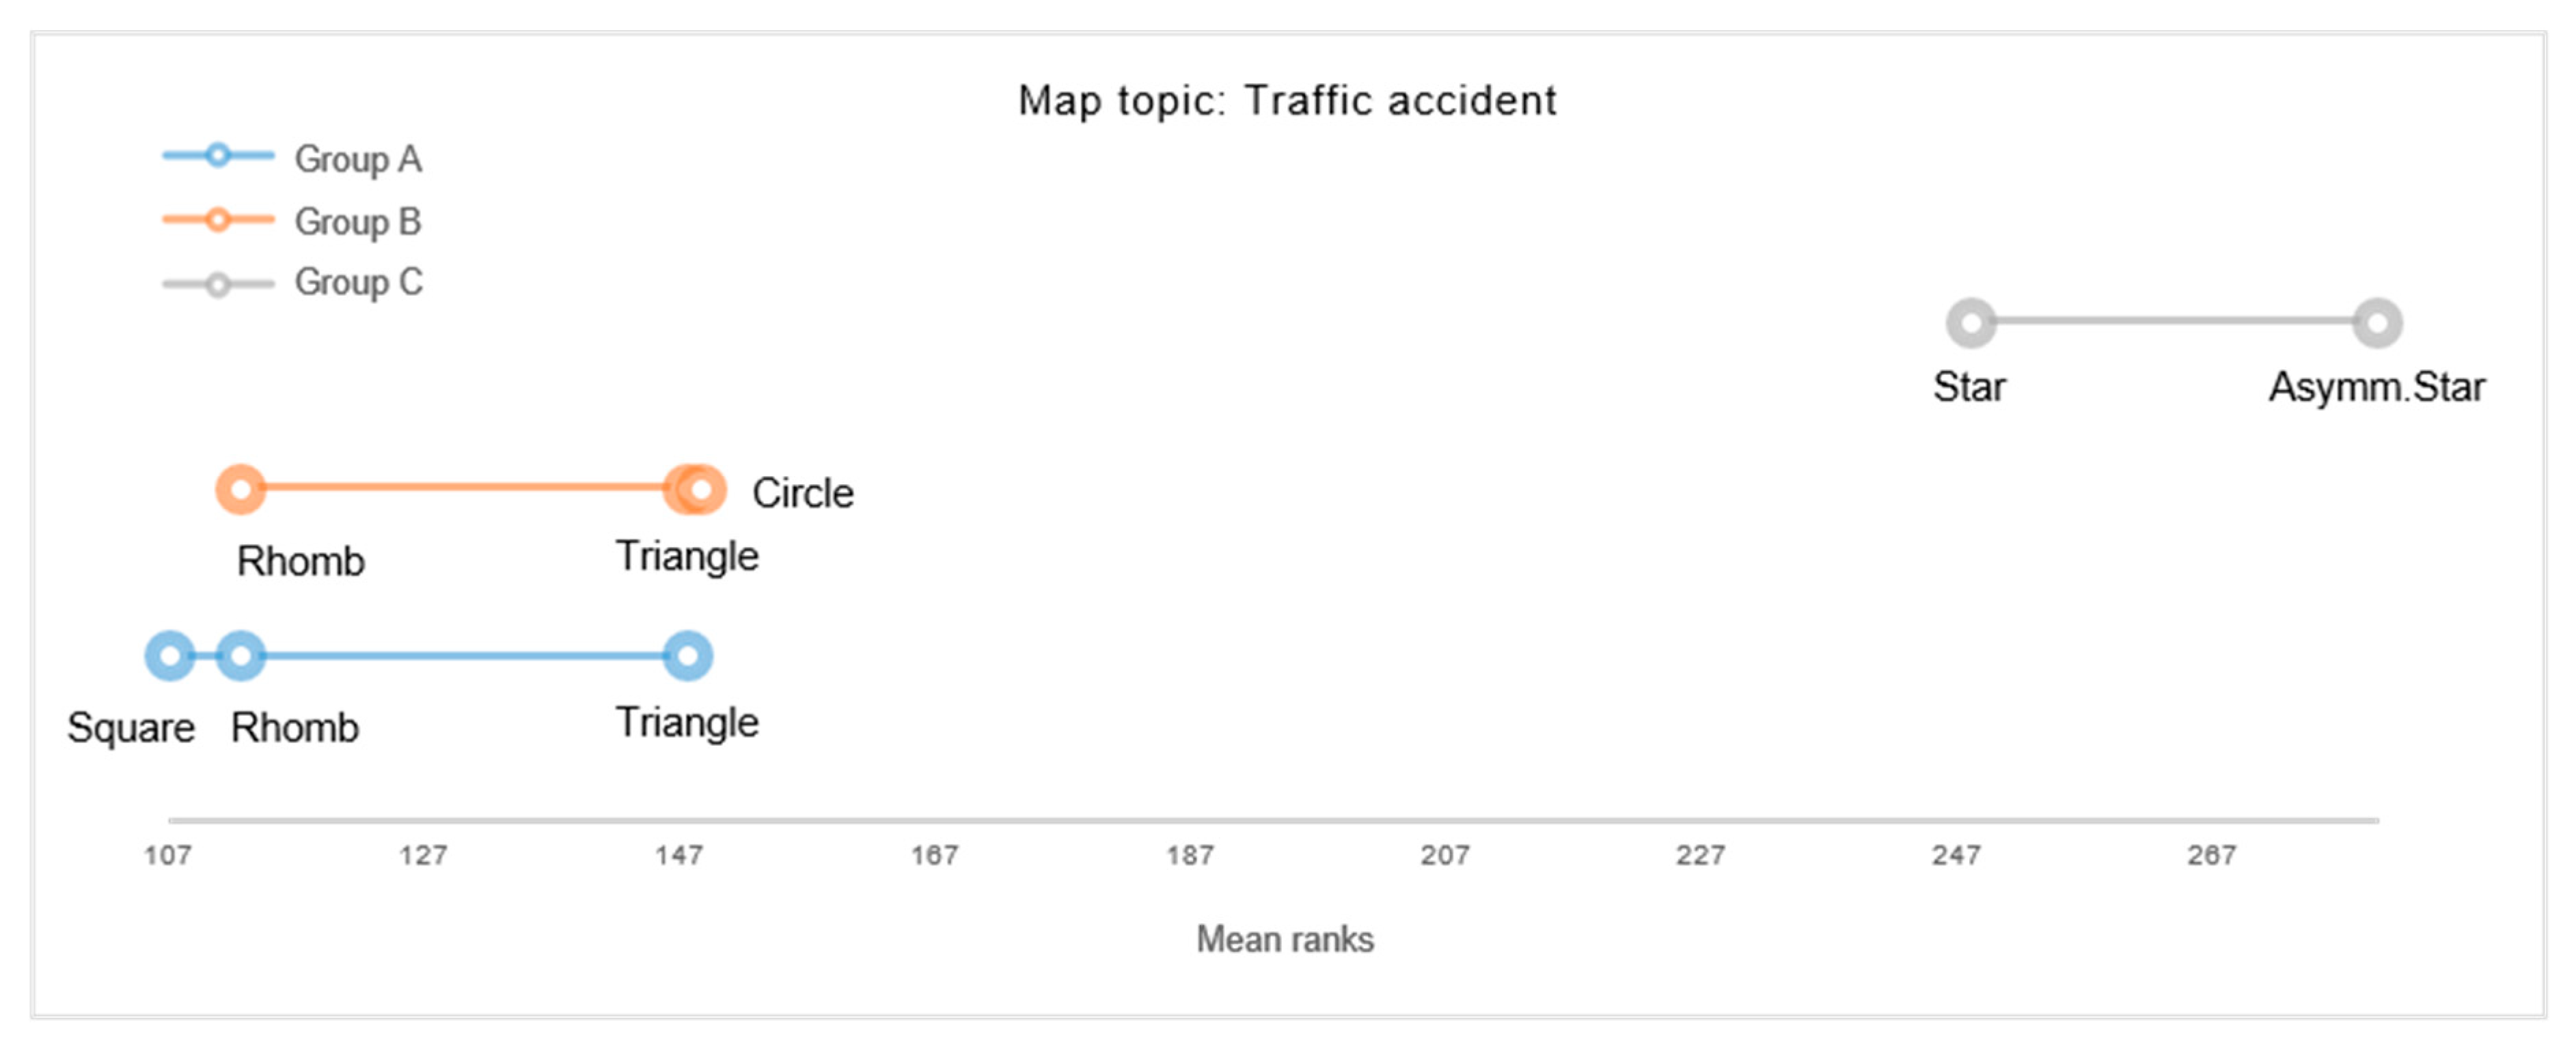
Based on the results of the Conover-Iman post hoc procedure, Demšar graphs were computed to visualize the results of critical differences within and between the map symbols for each topic cluster (see Figure 4) [53]. Demšar graphs illustrate critical differences between mean ranks in a way that groups that are not significantly different are connected by horizontal lines. In those cases, the null hypothesis cannot be rejected, i.e., that the pairs’ mean ranks must be considered equal. In contrast, any pair which is not connected with a horizontal line can be considered to differ with statistical significance.
Positive topic cluster. Based on the set of six shape symbols, a Conover-Iman post hoc analysis suggests three homogeneous symbol subsets when depicting positive map topics (see Group A, B, and C in Figure 4 top). The results showed that symmetric shapes were rated most suitable for depicting positive content. Among the symmetric shapes, two particular symbol subsets emerged (Group B and Group C). Group C refers to map symbols of highest congruency ratings, i.e., Circle, Rhomb, Star, and Triangle, followed by Group B of second highest congruence, i.e., Star, Triangle, and Square. Conover-Iman also discloses some similarities between Group B and C, illustrated by overlaps of Star and Triangle in Figure 4. The third subset comprises the Asymmetric Star symbol, which was rated as least suitable for depicting positive map topics (see Group A).
Neutral topic cluster. When depicting neutral map topics, Conover-Iman post hoc analysis suggests four homogenous subsets among the six-point symbols studied (see Figure 4 center). The first subset comprises Circles, which were rated as most congruent with neutral map topics (see Group D). The four symmetric polygonal shapes were assigned to two homogeneous, yet partially overlapping subsets (see Group C and D). The results further found that Asymmetric Stars were rated as significantly least congruent for representing neutral geospatial topics (see Group A).
Negative topic cluster. For the negative map topic cluster, the Conover-Iman analysis suggests four homogeneous symbol subsets (see Figure 4 bottom). The results revealed that the Asymmetric Stars were generally rated most congruent for depicting negative map topics (see Group D). Two subsets of moderate congruence further emerged, i.e., Circle and Star (see Group C) and Triangle and Circle (see Group B), with partial overlaps between them. The fourth group referred to the map symbols Square and Rhomb, which formed a distinct subset of lowest congruency ratings when to cartographically depicting negative topics (see Group A).
4.2.2. Positive Map Topics and Symbol Congruence
At the next stage, statistical analyses were performed for each map topic to explore topic-symbol correspondences in greater detail. Findings from Durbin-Skillings-Mack tests suggest highly significant differences (p < 0.001) between the six map symbols for each of the four positive map topics (see Table 3 for details).
To follow up on these findings, congruency ratings were subsequently subjected to Conover-Iman post hoc analyses to specifically identify which of the shape symbols significantly differed. Detailed results are discussed for each map topic in the following.
Map #1: City awarded for clean energy. Conover-Iman test suggests three subsets of congruences for the given map topic (for detailed test results see Supplementary Material Table S2). Demšar significance graphs further visualize the critical differences between these three congruence subsets (see Group A, B, C in Figure 5). The results show that the Asymmetric Star significantly differed from all other shapes, characterized by the lowest congruency ratings for the given map topic (see Group A). The other two homogeneous subsets comprise the five symmetric shape symbols (see Groups B and C). Group C revealed to comprise the symbol subset of highest content-congruency ratings, i.e., Star, Circle, and Rhomb, followed by the subset of Circle, Rhomb, Triangle, and Square (see Group B). These results, however, further indicate some similarities between Groups B and C, as illustrated in Figure 5 (see Rhomb and Circle).
Map #2: National parks. Conover-Iman’s multiple pairwise comparisons suggest three homogeneous symbol-subsets for the given map topic (for detailed test results see Supplementary Material Table S4). Demšar graphs further illustrate these results (see Group A, B, C in Figure 6). The Asymmetric Star was found to form a distinct subset (see Group A), characterized by significantly lowest congruency ratings. In contrast, the five symmetric shape symbols were rated to correspond significantly better for depicting the map topic “National parks” (see Groups B and C). Overall, the Triangular shape emerged to be most congruent with the given map topic, followed by Rhomb, Circle, and Square (see Group C). Conover-Iman results further suggest some similarities between Group B and Group C, as indicated by overlaps between some of the shapes of these two subsets (see Figure 6).
Map #3: Urban park with high biodiversity. Three homogeneous symbol subsets were identified by Conover-Iman post hoc analysis for this map topic, yet, also revealing some overlaps between the three groups (for detailed test results see Supplementary Material Table S5). Demšar graphs illustrate the critical differences between the three subsets (see Figure 7). The first subset of lowest congruency ratings comprises the Asymmetric Star, followed by Square and Triangle (see Group A). The second subset of moderate to high congruence refers to the Square, Triangle, Circle, and Rhomb (see Group B). The third homogeneous symbol subset comprises the asymmetric Star, which was rated as most congruent with the given map topic, followed by Rhomb, Circle, and Triangle (see Group C). As mentioned, despite uncovering three homogeneous subsets, the results also indicate partial overlaps, suggesting some similarities between the three symbol groups (see Figure 7).
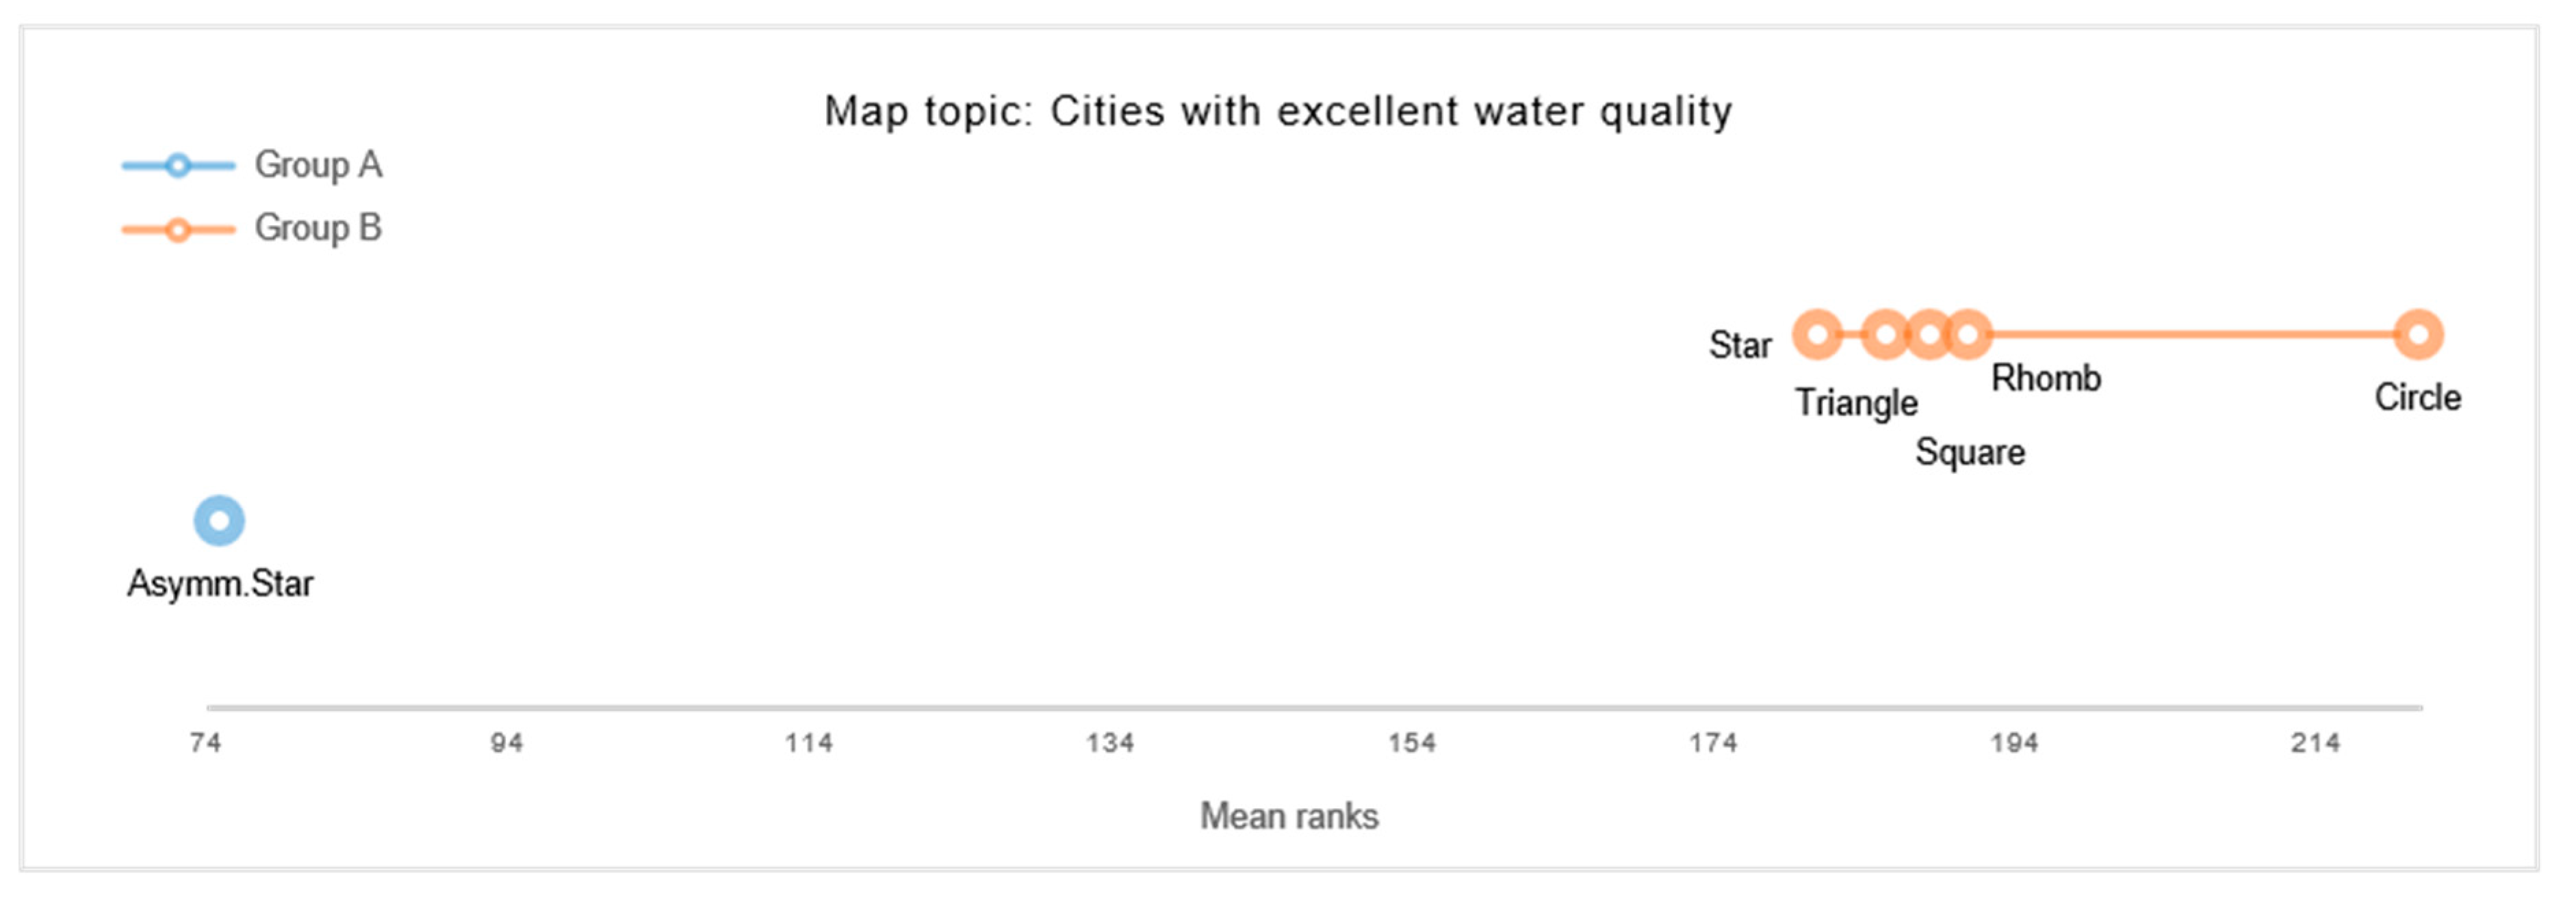
Map #4: Cities with excellent water quality. Two distinct symbol subsets were found for the given map topic based on a Conover-Iman analysis (for test results see Supplementary Material Table S6). One subset refers to the Asymmetric Star which is characterized by significantly lowest congruency ratings (see Group A in Figure 8). The other distinct subset comprises the five symmetric shapes which were rated to be significantly more congruent with the given topic (see Group B). Within that group, the Circle was rated as most congruent, followed by Rhomb, Square, Triangle, and Star (see Group B in Figure 8). Hence, the results revealed a significant preference towards symmetric map symbols when representing “Cities with excellent water quality”.
4.2.3. Neutral Map Topics and Symbol Congruence
For each of the four neutral topics identified by agglomerative hierarchical cluster analysis (see Section 4.1), Durbin-Skillings-Mack tests were performed to explore for significant differences between their perceived symbol-content congruences. The results revealed highly significant differences within each map set, suggesting that some map symbols were experienced to be more congruent—and others less—within either of the four neutral topics (see Table 4 for details).
To follow up on the findings of the Durbin-Skillings-Mack analysis, participants’ congruency ratings were subjected to Conover-Iman post hoc tests in the next step of the analysis. With this, the differences between the six map symbols were explored for each map topic in greater detail.
Map #5: Art college. Conover-Iman’s multiple pairwise comparisons identified four subsets of homogeneous symbol-content congruency for this map topic (for detailed test results see Supplementary Material Table S7). Demšar diagrams were computed to illustrate the results (see Groups A, B, C, D in Figure 9). The Asymmetric Star was revealed to refer to a distinct subset (see Group A), characterized by significantly lowest congruency ratings. In contrast, the Circular shape was rated as most congruent with the map topic, followed by Rhomb (see Group D). Rhomb, Star, and Square were found to comprise a subset of second highest congruence (Group C), followed by Star, Square, and Triangle (see Group B). The results further imply some similarities between the three homogeneous subsets of symmetric shapes, as partially overlapping graphs in Figure 9 illustrate (see Group B, C, D).
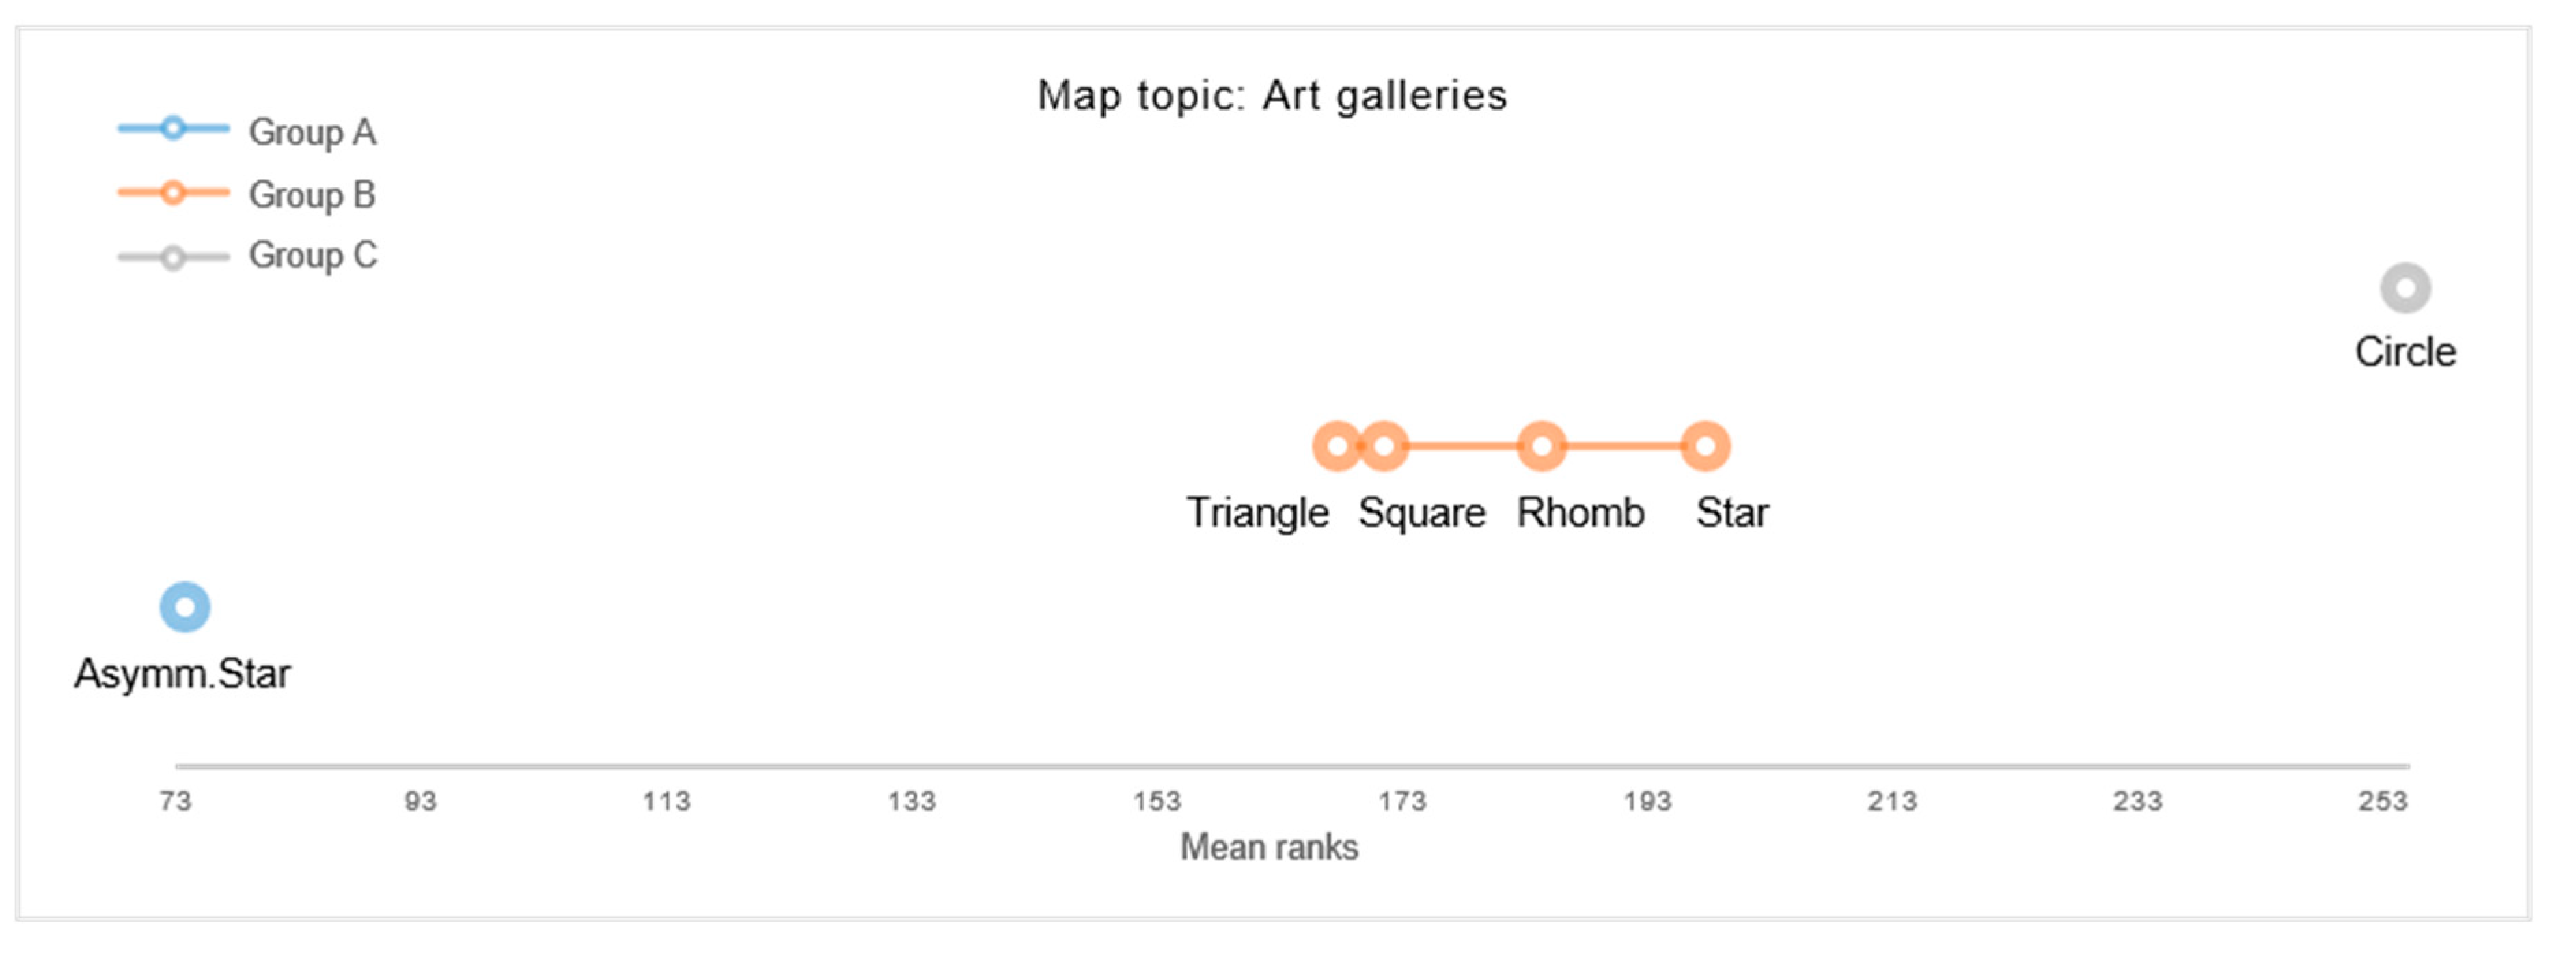
Map #6: Art galleries. For cartographically representing “Art galleries”, Conover-Iman post hoc analysis suggests three distinct homogeneous symbol subsets (for Conover-Iman test results see Supplementary Material Table S8). Demšar graphs, again, illustrate these findings (see Groups A, B, C in Figure 10). The first subset refers to the Asymmetric Star shape (Group A), which revealed significantly lowest congruency ratings. In contrast, the Circular map symbol was found to form a distinct subset of highest congruence (see Group C), whilst the subset of Star, Rhomb, Square, and Triangle was found to be of distinct, moderate congruence (see Group B).
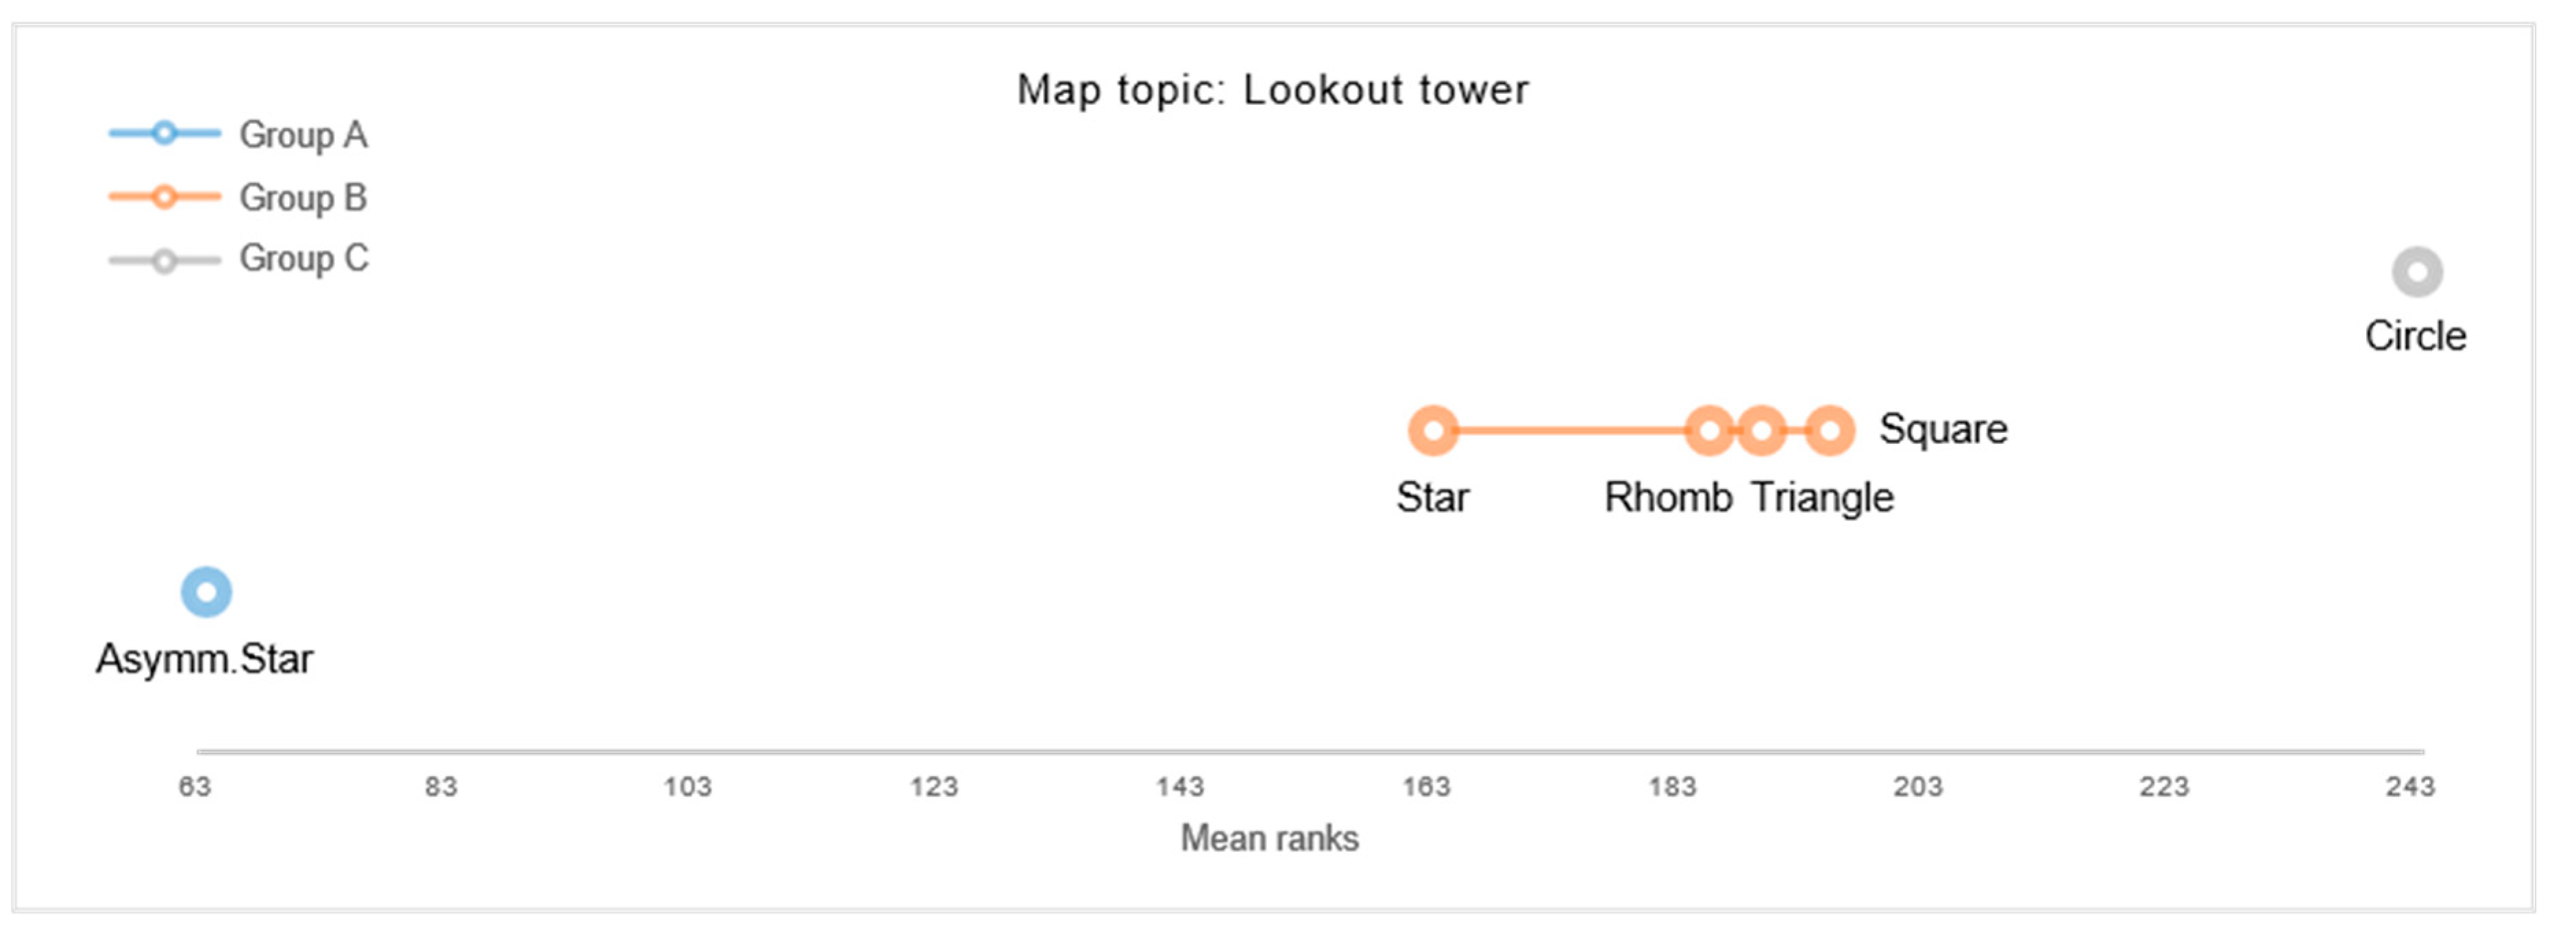
Map #7: Lookout tower. Within the set of six map symbols used to cartographically indicate a “Lookout tower”, the Conover-Iman test suggests three distinct symbol subsets (for detailed results see Supplementary Material Table S9). Demšar graphs illustrate these results (see Groups A, B, C in Figure 11). The subset comprising the Asymmetric Star was found to be least congruent with the given map topic (see Group A), while the Circular shape revealed to refer to a distinct subset of high congruence (Group C). The four polygonal shapes of Square, Triangle, Rhomb, and Star (Group B) were revealed to form a distinct homogeneous subset of moderate symbol-content congruence.
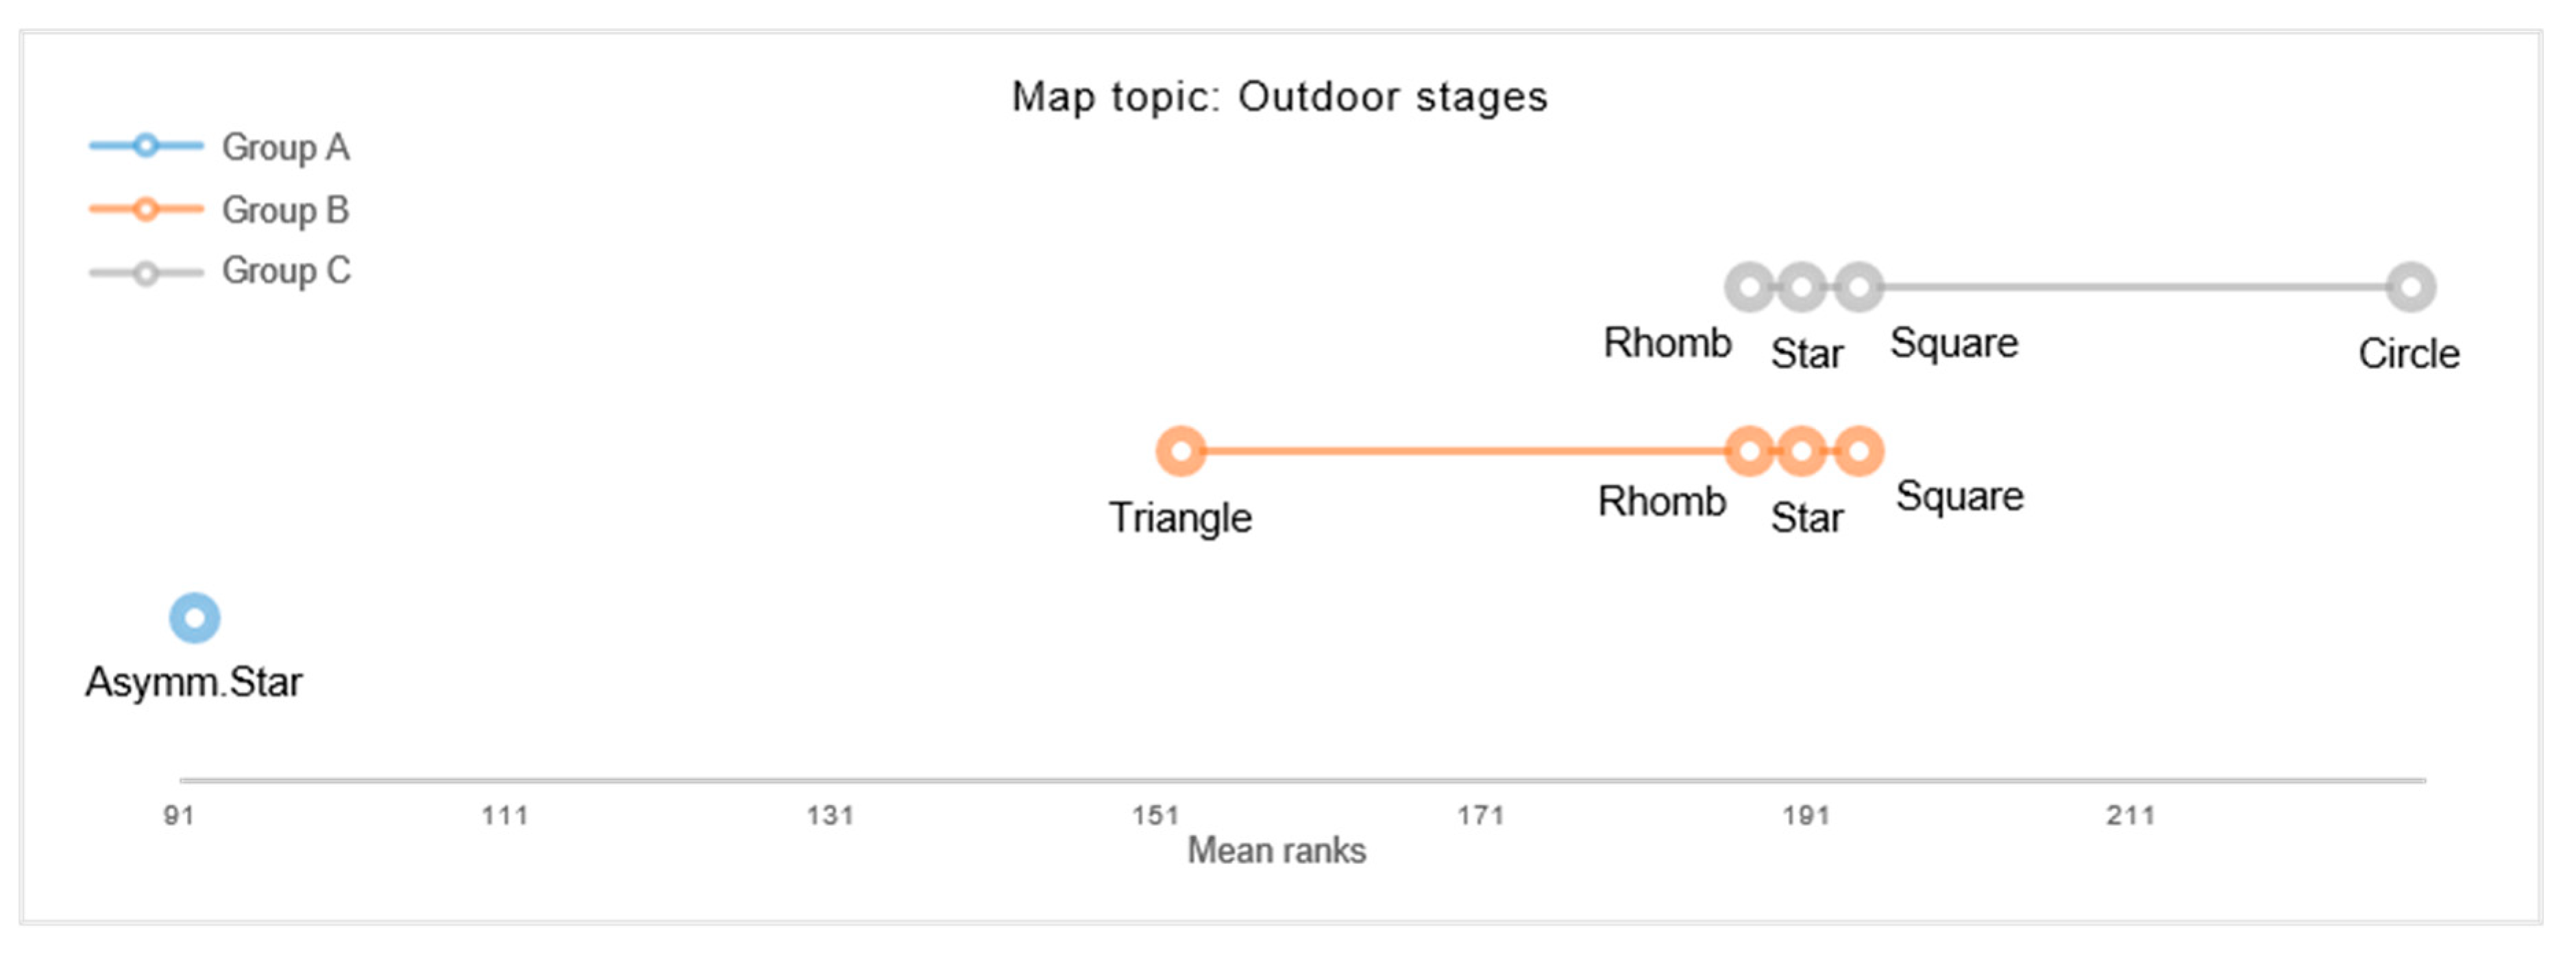
Map #8: Outdoor stages. Within the set of six map symbols used to cartographically refer to “Outdoor stages”, a Conover-Iman post hoc analysis revealed three homogeneous symbol-subsets (for detailed results see Supplementary Material Table S10). The critical differences between the three subsets are illustrated in Figure 12 (see Groups A, B, C). The first subset refers to the Asymmetric Star, which revealed significantly lowest congruency ratings (see Group A). In contrast, the Circle was rated as most congruent for representing the map topic, followed by Square, Star, and Rhomb (see Group C). The third homogeneous subset comprises the four polygonal shapes Square, Star, Rhomb, and Triangle (see Group B). The results further suggest overlaps between some of the polygonal shapes of Group C and B (see Square, Star, and Rhomb), which indicate some similarity between these subsets (for details see Demšar graphs of Figure 12).
4.2.4. Negative Map Topics and Symbol Congruence
Durbin-Skillings-Mack tests were performed for each of the four negative map topics, to explore for negative topic-symbol relations. The results suggest significant differences within three of the four negative map topics (see Table 5 for details). Highly significant differences between the set of six map symbols were found for the three maps indicating “Floods”, Melting glaciers”, and “Traffic accident”. No statistically significant differences were found between the map symbols depicting “Smog polluted cities”, indicating that the six map symbols were experienced to be equally congruent when depicting this particular topic.
To follow up on these findings, Conover-Iman post hoc tests were performed for each of the four map topics.
Map #9: Flood affected area. Results of the Conover-Iman analysis suggest two homogeneous symbol subsets when indicating “Flood affected areas” (see Group A and B in Figure 13; for Conover-Iman test results see Supplementary Material Table S11). Symmetric shapes refer to one of the two distinct, homogeneous symbol subset (see Group A in Figure 13), with the Triangle rated as least congruent, followed by Square, Rhomb, Circle, and Star. In contrast, the Asymmetric Star was rated as most congruent with the given map topic, thus, forming a distinct symbol subset of high congruence (see Group B).
Map #10: Melting glaciers. Between the six map symbols used to cartographically indicate “Melting glaciers”, Conover-Iman multiple pairwise comparisons identified three symbol subsets of homogenous congruence (see Group A, B, C in Figure 14; for detailed Conover-Iman test results see Supplementary Material Table S12). The first subset comprises Square and Rhomb, characterized by low congruence (see Group A). The second symbol subset was found to be of moderate congruence, comprising Rhomb, Circle, Star, and Asymmetric Star (see Group B). The subset of highest congruency ratings emerged to refer to the Triangular symbol, followed by Asymmetric Star and Star (Group C). Despite the homogeneity within each of the three subsets, Conover-Iman further discloses partial overlaps between some symbols of the three subsets, suggesting some similarity between them (for details see Figure 14).
Map #11: Traffic accident. A Conover-Iman post hoc analysis revealed three subsets of homogeneous symbol-topic congruence for the map topic “Traffic accident” (for detailed test results see Supplementary Material Table S13). Demšar graphs further visualize the subsets’ critical differences (see Figure 15), suggesting two subsets of particularly low congruency ratings. One of these subsets uncover the Square as a symbol of least congruence, followed by Rhomb, and Triangle (see Group A). The second subset comprises Rhomb, Triangle, and Circle (see Group B), which can be regarded as fairly similar to Group A (see Figure 15 for details). The subset of highest congruency ratings was found to refer to the Asymmetric Star and symmetric Star (see Group C). Hence, in the present study, the two-star symbols appeared to be most suitable to cartographically depict traffic accidents.
Map #12: Smog polluted cities. When cartographically referring to “Smog polluted cities” Durbin-Skillings-Mack revealed no significant differences between the participants’ symbol-topic congruency ratings (see Table 5). Pairwise comparisons between the six map symbols based on the Conover-Iman analysis support this finding (for detailed results see Supplementary Material Table S14). Besides the highest congruency ratings for the Asymmetric Star symbol and lowest congruency scores for Rhomb and Square, these ratings cannot be considered to be significantly different, as statistical analysis showed and which Demšar graphs further illustrate (see Figure 16).
5. Discussion
As visual means of communication, maps employ signs and symbols to relate to geospatial phenomena and events. As such, maps support the communication and imagination of geographic space and related events from a viewpoint beyond direct experience. At the same time, maps are selective and based on a myriad of decisions. The visual variables employed in maps, such as map signs and symbols, are based on abstractions and generalizations. When using visual variables, cartographers generally strive for congruence, where the schematization of the external representation aims to correspond to structures of the internal representation. Cartography is, therefore, concerned with establishing a mutually shared set of signs and semiotic rules to communicate geospatial information successfully. Yet, in as far as cartographic semiotics provide some guidance for the selection of visual variables from an analytic perspective, such as when to employ visual variables for a given type of data, it does not address contextual congruence, such as when to use a particular shape symbol for a given type of geospatial content. This research, therefore, aimed to contribute to closing this research gap by investigating the contextual congruence of cartographic point symbols with respect to different types of geospatial information.
In detail, the present study empirically assessed the perceived (in)congruence of a set of six-point symbols in monothematic maps of positive, neutral, and negative valence. The six-point symbols comprised five symmetric shapes (i.e., Circle, Triangle, Square, Rhomb, Star) and one Asymmetric Star shape. In an online survey, 72 maps (i.e., twelve map topics in six symbol variations) were evaluated by 116 participants in a between-groups design. Participants evaluated the congruence between each map topic and its depiction by the different point symbols on a 6-point rating scale. Four positive, four neutral, and four negative map topics were assessed by the participants. Participants’ congruency ratings were subjected to statistical analyses. First, symbol-content congruency ratings were analyzed on an aggregated level, i.e., by the three positive, neutral, and negative topic clusters. Second, symbol-content congruency ratings were analyzed individually, i.e., by each of the twelve map topics.
The clustered congruency ratings showed that Asymmetric Stars were rated to be least suitable to cartographically represent positive content. In contrast, the five symmetric shapes were generally found to be of high congruence with positive map topics. Congruency ratings for neutral topics revealed similar results, such as Asymmetric Stars were perceived least congruent, while polygonal, symmetric shapes were found to correspond significantly better with neutral map content. Results further disclosed a significant preference for Circular map symbols for depicting neutral map topics. Hence, results suggest that neutral topics may best be represented by Circular point symbols, while symmetric polygonal map symbols may be considered as second-best alternatives. Whilst incongruent with both positive and neutral topics, Asymmetric Star symbols were significantly preferred for depicting negative events. In contrast, Star, Circle, and Triangle were generally rated as moderately congruent with negative topics, while Square and Rhomb were experienced as least congruent for cartographically referring to negative events.
While the present findings on a cluster-level propose general tendencies of symbol-topic relations, some topic-specific visualization preferences were revealed at a more detailed level of analysis. For example, Triangles were rated to best correspond to representing “National parks” and “Melting glaciers”, whilst symmetric Stars showed to be the preferred choice for representing “Cities awarded for clean energy” and “Urban parks with high biodiversity”. For depicting “Traffic accidents”, the Asymmetric Star and symmetric Star were both found to be significantly favored. These findings may imply particular preferences towards iconic map symbols. Iconicity refers to the conceived similarity or analogy between the form of a sign-vehicle and its meaning. Abstract, geometric shapes are generally considered to be of low iconicity, whilst associative and pictorial point symbols are regarded as moderately to highly iconic [32]. The results of the present study indicate that the iconicity of abstract map symbols may have been amplified by the cartographic context. The topic of “Melting glaciers”, for example, may have been associated with mountains, which may be visually associated and abstracted by triangular shapes. Traffic accidents, on the other hand, may be associated with collision and conflict, often graphically abstracted by star-like shapes. In the present study, contextually more iconic symbols may have been experienced as more congruent with the given map topics, as participants’ draw towards those map symbols indicate. Yet, as the present findings only allow to conjecture the influence of iconicity on congruence, future research is needed to systematically and empirically explore such an influence in depth.
Related research further suggests that when people make evaluative judgments, they draw on a range of different processes [20]. Such processes may relate to cognitive as well as to affective responses [18]. Winkielman et al. even stress that some affective response is always involved in evaluative judgments. These affective responses may be based on stimulus attributes as well as be caused by the dynamics of information processing, i.e., by processing fluency [20]. Processing fluency is considered to be hedonically marked, such as that high fluency elicits positive affective reactions [20]. A tendency towards affectively congruent map symbols may also be supported by the findings of this study. Negative map topics in the present study referred to rather dynamic spatiotemporal events (e.g., smog, floods, traffic accident), where in contrast, positive and neutral topics predominantly related to rather static geospatial occurrences (e.g., national parks, biodiversity, art galleries, lookout tower). These different qualities may have influenced participants’ congruence judgments, such as towards favoring symbols of dynamic character for dynamic topics. Osgood et al., for example, referred to such dynamic qualities of stimuli as the affective dimension of activity, for which he found “some relation to physical sharpness or abruptness” [31] (p. 38). Such particular stimulus-affect correspondences are moreover supported by related empirical research on map symbols, which found that asymmetric star symbols were experienced as highly dynamic and of negative valence, whereas symmetric shapes were regarded as neutral or slightly positive and of rather static quality [44]. Related research further showed that point symbols may be experienced visually, associatively, and affectively [43]. Map topic-specific visualization preferences may therefore result due to either of these dimensions. Hence, while the present findings and related literature strongly suggest that the principle of congruence may be a crucial factor for cartographic communication, such as to enhance map design, future research is needed to dissect its dimensions and explore its effects in greater detail.
So far, the present research provides first empirical insights into symbol-content relations of such kind. Yet, the study also encompasses some shortcomings:
The present study used a limited set of six map symbols. Besides the attempt to incorporate the most common abstract cartographic point symbols, the possible number of map symbols is sheer unlimited. At the same time, cartographic nominal point symbols used in practice may not only be manipulated by shape but also by color, size, and other qualities. Such symbol properties have been excluded deliberately from the present study in order to allow for a systematic study on the influence of shape by controlling for potential confounders, such as different symbol colors and symbol size. Future research may, however, expand on the set of point symbols by considering additional manipulable symbol qualities. Future studies may also consider increasing the complexity and the interaction of different visual map features, as the findings of the present study, are limited to monothematic maps of low visual complexity. In addition, the number of geospatial topics used in the present study was limited to a selection of twelve topics, which certainly limits the findings’ transferability. Hence, despite a greater variety of point symbols and thematic maps of differing visual complexity, a larger set of map topics must also be considered in future studies to expand upon the present findings and to ensure the findings’ external validity.
Another shortcoming refers to the selection of map topics, which was undertaken a priori by the experimenter. Topics were selected to be of positive, neutral, and negative character. Whilst statistical analysis confirmed such three homogenous clusters, results further showed a more proximal relation between the neutral and positive topic clusters with a greater distance towards the negative cluster. Mean ratings further showed that neutral topics in the present study were rated slightly positive and may, therefore, not be considered to be purely neutral. The selection of maps towards a set of distinctively positive, neutral, and negative geospatial topics may be improved in future studies, such as by conducting prestudies for prior topic assessments.
Future research also needs to take into account more heterogeneous groups of participants, as this study relied on students only. Participants of the present study can be characterized as young adults, with high education, and a moderate to high affinity to graphic design and cartography. The findings of the present study must, therefore, be considered to be restricted to this fairly homogeneous user group as the study did not embrace the vast diversity of map users. Social semiotics further stress that “people respond culturally and engage emotionally with data and their visualizations” [54] (p. 50). This is supported by research in cartography, which found that cultural backgrounds influence map perception and performance in cartographic visual search tasks [42]. Such findings strongly imply the impact of cultural sign-conventions on map reading performances. It is, therefore crucial to continue exploring the effects of cartographic design decisions from the perspectives and backgrounds of different user groups.
6. Conclusions
Maps are a form of communication: a means of conceiving, articulating, and structuring the human world [3]. Through cartographic signs and symbols, maps refer to phenomena and entities in geographic space in a generalized and abstracted way. To communicate geospatial information successfully, cartography generally strives for cognitively congruent map design. Cartographic research has, however, only started to understand the myriad of relations between the map as an external representation and internal human processes.
This research, therefore, drew attention to the principle of contextual congruence and empirically explored the cognitive correspondences between cartographic point symbols and different positive, neutral, and negative geospatial contexts. Findings strongly imply that context matters. Overall results revealed high congruences of Asymmetric Star symbols when representing negative map topics, whilst highly incongruent when depicting positive or neutral geospatial content. Symmetric shapes, on the other hand, generally emerged to highly correspond with positive and neutral map topics, whilst incongruent with negative content. As the meaning of point symbols showed to be susceptible to context, the findings lead to the conclusion that cognitive congruence can be enhanced by integrating context-specific information into the cartographic design, such as when form follows content.
Yet, while this research provided first empirical insights, the present findings aim to be expanded upon. Future research is needed to continue exploring the different semiotic dimensions of sign meanings and their role in cartographic communication processes. A profound understanding of the various context-related communication effects of cartographic signs may allow for more deliberate and informed design decisions, and with this, may contribute to enhancing cartographic communication.
Supplementary Materials
The following are available online at https://0-www-mdpi-com.brum.beds.ac.uk/2220-9964/9/12/719/s1, Table S1. Mean valence of twelve topics, based on ratings of 116 participants, Table S2. Map clusters: Conover-Iman test results, Table S3. Map #1: Conover-Iman test results, Table S4. Map #2: Conover-Iman test results, Table S5. Map #3: Conover-Iman test results, Table S6. Map #4: Conover-Iman test results, Table S7. Map #5: Conover-Iman test results, Table S8. Map #6: Conover-Iman test results, Table S9. Map #7: Conover-Iman test results, Table S10. Map #8: Conover-Iman test results, Table S11. Map #9: Conover-Iman test results, Table S12. Map #10: Conover-Iman test results, Table S13. Map #11: Conover-Iman test results, Table S14. Map #12: Conover-Iman test results.
Funding
This research received no external funding.
Acknowledgments
The author thanks Georg Gartner for his valuable feedback and support in this research. The author thanks the four anonymous reviewers for their comments and suggestions. The author acknowledges TU Wien University Library for financial support through its Open Access Funding Program.
Conflicts of Interest
The author declares no conflict of interest.
References
- Eide, Ø. Media Boundaries and Conceptual Modelling: Between Texts and Maps; Palgrave Macmillan: London, UK, 2016; ISBN 978-1349566235. [Google Scholar]
- Keates, J.S. Understanding Maps, 2nd ed.; Addison Wesley Longman Limited: New York, NY, USA, 1996. [Google Scholar]
- Harley, J.B. Maps, knowledge, and power. In Geographic Thought: A Praxis Perspective; Henderson, G., Waterstone, M., Eds.; Routledge: London, UK, 2009. [Google Scholar]
- Thompson, M.A.; Lindsay, J.M.; Gaillard, J. The influence of Probabilistic Volcanic Hazard Map Properties on Hazard Communication. J. Appl. Volcanol. 2015, 4. [Google Scholar] [CrossRef] [Green Version]
- Bertin, J. Graphische Semiologie: Diagramme, Netze, Karten; Walter de Gruyter: Berlin, Germany, 1974. [Google Scholar]
- Langer, S.K. Feeling and Form: A Theory of Art; Charles Scribner’s Sons: New York, NY, USA, 1953. [Google Scholar]
- MacEachren, A.M. The Role of Complexity and Symbolization Method in Thematic Map Effectiveness. Ann. Assoc. Am. Geogr. 1982, 72, 495–513. [Google Scholar] [CrossRef]
- Michaelidou, E.; Filippakopoulou, V.; Nakos, B.; Petropoulou, A. Designing point map symbols: The effect of preattentive attributes of shape. In Proceedings of the 22th International Cartographic Association Conference, A Coruna, Spain, 9–16 July 2005. [Google Scholar]
- Muehlenhaus, I. If Looks Could Kill: The Impact of Different Rhetorical Styles on Persuasive Geocommunication. Cartogr. J. 2012, 49, 361–375. [Google Scholar] [CrossRef]
- Jenny, B.; Stephen, D.M.; Muehlenhaus, I.; Marston, B.E.; Sharma, R.; Zhang, E.; Jenny, H. Design principles for origin-destination flow maps. Cartogr. Geogr. Inf. Sci. 2016, 45, 62–75. [Google Scholar] [CrossRef]
- Arnheim, R. Art and Visual Perception: A Psychology of the Creative Eye; University of California Press: Berkeley, CA, USA, 1974; ISBN 0520243838. [Google Scholar]
- Klee, P. Schöpferische Konfession: Paul Klee. In Tribüne der Kunst und Zeit—Eine Schriftensammlung, Band XIII.; Edschmid, K., Ed.; Erich Reiß Verlag: Berlin, Germany, 1920; pp. 28–40. [Google Scholar]
- Merriam-Webster Congruence. Available online: https://www.merriam-webster.com/dictionary/congruence (accessed on 30 July 2020).
- Tversky, B.; Morrison, J.B.; Betrancourt, M. Animation: Can it facilitate? Int. J. Human Comput. Stud. 2002, 57, 247–262. [Google Scholar] [CrossRef] [Green Version]
- Klippel, A.; Richter, K.-F.; Barkowsky, T.; Freksa, C. The Cognitive Reality of Schematic Maps. In Map-based Mobile Services: Theories, Methods and Implementations; Meng, L., Zipf, A., Reichenbacher, T., Eds.; Springer: Berlin/Heidelberg, Germany, 2005; pp. 55–71. ISBN 3540230556. [Google Scholar]
- Axelsen, B.; Jones, M. Are all Maps Mental Maps? Available online: https://0-www-jstor-org.brum.beds.ac.uk/stable/41144136 (accessed on 2 September 2020).
- Tversky, B. Some Ways that Maps and Diagrams Communicate. In Lecture Notes in Computer Science; Springer: Berlin, Germany, 2000; pp. 72–79. [Google Scholar]
- Winkielman, P.; Schwarz, N.; Reber, R.; Fazendeiro, T.A. Cognitive and affective consequences of visual fluency: When seeing is easy on the mind. In Advertising and Consumer Psychology. Persuasive Imagery: A Consumer Response Perspective; Scott, L.M., Batra, R., Eds.; Lawrence Erlbaum Associates Publishers: Mahwah, NJ, USA, 2003; pp. 75–89. ISBN 0-8058-4202-0. [Google Scholar]
- Vessey, I. Cognitive Fit: A Theory-Based Analysis of the Graphs Versus Tables Literature. Decis. Sci. 1991, 22, 219–240. [Google Scholar] [CrossRef]
- Winkielman, P.; Schwarz, N.; Fazendeiro, T.A.; Reber, R.; Erlbaum, L.; We thank John Cacioppo, N.; Clore, J.; Niedenthal, P.; Nowak, A. The Hedonic Marking of Processing Fluency: Implications for Evaluative Judgment. In The Psychology of Evaluation: Affective Processes in Cognition and Emotion; Musch, J., Christoph, K.K., Eds.; Lawrence Erlbaum Associates: London, UK, 2003; pp. 189–217. [Google Scholar]
- Padilla, L.M.; Creem-Regehr, S.H.; Hegarty, M.; Stefanucci, J.K. Decision making with visualizations: A cognitive framework across disciplines. Cogn. Res. Princ. Implic. 2018, 3. [Google Scholar] [CrossRef]
- Vessey, I.; Zhang, P.; Galletta, D. The theory of cognitive fit. In Human-Computer interaction and Management Information Systems: Foundations; Shneiderman, B., Zhang, P., Galletta, D., Eds.; M. E. Sharpe: Armonk, NY, USA, 2006; Volume 5, pp. 141–183. [Google Scholar]
- Kent, A.J. Form Follows Feedback: Rethinking Cartographic Communication. Westminst. Pap. Commun. Cult. 2018, 13, 96–112. [Google Scholar] [CrossRef]
- Wood, D. Rethinking the Power of Maps; The Guilford Press: New York, NY, USA, 2010. [Google Scholar]
- Koláčný, A. Cartographic Information—A Fundamental Concept and Term in Modern Cartography. Cartogr. J. 1969, 6, 47–49. [Google Scholar] [CrossRef]
- Board, C. Cartographic Communication. In The Map Reader: Theories of Mapping Practice and Cartographic Representation; Dodg, M., Kitchin, R., Perkins, C., Eds.; John Wiley & Sons, Ltd: Hoboken, NJ, USA, 2011; pp. 37–47. [Google Scholar]
- Petchenik, B.B. Cognition in Cartography. Cartogr. Int. J. Geogr. Inf. Geovis. 1977, 14, 117–128. [Google Scholar] [CrossRef] [Green Version]
- Morris, C.W. Foundations of the Theory of Signs; University of Chicago Press: Chicago, IL, USA, 1938; pp. 1–59. [Google Scholar]
- Lorch, S. Signs, Language and Behavior, 1st ed.; George Braziller, Inc.: New York, NY, USA, 1946. [Google Scholar]
- Nöth, W. Handbook of Semiotics; Indiana University Press: Blomington, Indiana, 1995; ISBN 978-0-253-20959-7. [Google Scholar]
- Osgood, C.E.; Suci, G.J.; Tannenbaum, P.H. The Measurement of Meaning; University of Illinois Press: Champaign, IL, USA, 1967. [Google Scholar]
- MacEachren, A.M. How Maps Work: Representation, Visualization, and Design; The Guilford Press: New York, NY, USA, 1995; ISBN 0-89862-589-0. [Google Scholar]
- MacEachren, A.M.; Roth, R.E.; O’Brien, J.; Li, B.; Swingley, D.; Gahegan, M. Visual Semiotics and Uncertainty Visualization: An Empirical Study. IEEE Trans. Vis. Comput. Graph. 2012, 18, 2496–2505. [Google Scholar] [CrossRef] [PubMed]
- McKenzie, G.; Hegarty, M.; Barrett, T.; Goodchild, M. Assessing the effectiveness of different visualizations for judgments of positional uncertainty. Int. J. Geogr. Inf. Sci. 2015, 30, 221–239. [Google Scholar] [CrossRef]
- Voženílek, V.; Morkesová, P.; Vondrakova, A. Cognitive Aspects of Map Symbology in the World School Atlases. Procedia Soc. Behav. Sci. 2014, 112, 1121–1136. [Google Scholar] [CrossRef] [Green Version]
- Muehlenhaus, I. The design and composition of persuasive maps. Cartogr. Geogr. Inf. Sci. 2013, 40, 401–414. [Google Scholar] [CrossRef]
- Fabrikant, S.I.; Christophe, S.; Papastefanou, G.; Maggi, S. Emotional Response to Map Design Aesthetics. In Proceedings of the 7th International Conference on Geographical Information Science, Columbus, OH, USA, 18–21 September 2012; pp. 18–21. [Google Scholar]
- Christophe, S.; Hoarau, C. Expressive Map Design Based on Pop Art: Revisit of Semiology of Graphics? Cartogr. Perspect. 2013, 73, 61–74. [Google Scholar] [CrossRef] [Green Version]
- Padilla, L.M.; Ruginski, I.T.; Creem-Regehr, S.H. Effects of ensemble and summary displays on interpretations of geospatial uncertainty data. Cogn. Res. Princ. Implic. 2017, 2, 1–16. [Google Scholar] [CrossRef] [Green Version]
- Kinkeldey, C.; MacEachren, A.M.; Schiewe, J. How to Assess Visual Communication of Uncertainty? A Systematic Review of Geospatial Uncertainty Visualisation User Studies. Cartogr. J. 2014, 51, 372–386. [Google Scholar] [CrossRef]
- Cheong, L.; Bleisch, S.; Kealy, A.; Tolhurst, K.; Wilkening, T.; Duckham, M. Evaluating the impact of visualization of wildfire hazard upon decision-making under uncertainty. Int. J. Geogr. Inf. Sci. 2016, 30, 1377–1404. [Google Scholar] [CrossRef] [Green Version]
- Stachoň, Z.; Šašinka, Č.; Čeněk, J.; Angsuesser, S.; Kubíček, P.; Štěrba, Z.; Bilíková, M. Effect of Size, Shape and Map Background in Cartographic Visualization: Experimental Study on Czech and Chinese Populations. ISPRS Int. J. Geo-Inf. 2018, 7, 427. [Google Scholar] [CrossRef] [Green Version]
- Klettner, S. Why Shape Matters—On the Inherent Qualities of Geometric Shapes for Cartographic Representations. ISPRS Int. J. Geo-Inf. 2019, 8, 217. [Google Scholar] [CrossRef] [Green Version]
- Klettner, S. Affective Communication of Map Symbols: A Semantic Differential Analysis. ISPRS Int. J. Geo-Inf. 2020, 9, 289. [Google Scholar] [CrossRef]
- Arnheim, R. Kunst und Sehen: Eine Psychologie des schöpferischen Auges; Walter de Gruyter: Berlin, Germany, 1978; ISBN 3110066823. [Google Scholar]
- Treisman, A.; Gormican, S. Feature Analysis in Early Vision: Evidence from Search Asymmetries. Psychol. Rev. 1988, 95, 15–48. [Google Scholar] [CrossRef]
- LimeSurvey: An Open Source Survey Tool; LimeSurvey GmbH: Hamburg, Germany, 2019.
- IBM SPSS Statistics for Windows; Version 25.0; IBM Corp: Armonk, NY, USA, 2017.
- Addinsoft XLSTAT 2020; Addinsoft: New York, NY, USA, 2020.
- Chatfield, M.; Mander, A. The Skillings Mack Test (Friedman Test when There are Missing Data). Stata J. 2009, 9, 299–305. [Google Scholar] [CrossRef]
- Conover, W.J.; Iman, R.L. On Multiple-Comparisons Procedures; University of California: Los Alamos Scientific Laboratory: Los Alamos, Mexico, 1979. [Google Scholar]
- Field, A. Discovering Statistics Using IBM SPSS Statistics, 3rd ed.; SAGE Publications Ltd.: Thousand Oaks, CA, USA, 2009. [Google Scholar]
- Demšar, J. Statistical Comparisons of Classifiers over Multiple Data Sets. JMLR 2006, 7, 1–30. [Google Scholar]
- Aiello, G. Inventorizing, situating, transforming: Social semiotics and data visualization. In Data Visualization in Society; Walter de Gruyter: Berlin, Germany, 2020; pp. 49–62. [Google Scholar]
Figure 1.
Examples of two map sets. Left map set: locating a “Lookout tower” by one-point symbol per map. Right map set: locating “Smog polluted cities” by three symbols on each map.
Figure 1.
Examples of two map sets. Left map set: locating a “Lookout tower” by one-point symbol per map. Right map set: locating “Smog polluted cities” by three symbols on each map.

Figure 2.
Dendrogram based on agglomerative hierarchical cluster analysis of topic valence ratings.

Figure 3.
Mean ratings of map content and symbolization (in)congruence.

Figure 4.
Demšar graphs based on Conover-Iman multiple pairwise comparisons, illustrating the (in)congruence between map symbols when depicting positive, neutral, and negative topics.
Figure 4.
Demšar graphs based on Conover-Iman multiple pairwise comparisons, illustrating the (in)congruence between map symbols when depicting positive, neutral, and negative topics.

Figure 5.
Map #1: Results of multiple pairwise comparisons, indicating groups of (dis)similar symbol-content congruence.
Figure 5.
Map #1: Results of multiple pairwise comparisons, indicating groups of (dis)similar symbol-content congruence.

Figure 6.
Map #2: Results of multiple pairwise comparisons, indicating groups of (dis)similar symbol-content congruence.
Figure 6.
Map #2: Results of multiple pairwise comparisons, indicating groups of (dis)similar symbol-content congruence.

Figure 7.
Map #3: Results of multiple pairwise comparisons, indicating groups of (dis)similar symbol-content congruence.
Figure 7.
Map #3: Results of multiple pairwise comparisons, indicating groups of (dis)similar symbol-content congruence.

Figure 8.
Map #4: Results of multiple pairwise comparisons, indicating groups of (dis)similar symbol-content congruence.
Figure 8.
Map #4: Results of multiple pairwise comparisons, indicating groups of (dis)similar symbol-content congruence.

Figure 9.
Map #5: Results of multiple pairwise comparisons, indicating groups of (dis)similar symbol-content congruence.
Figure 9.
Map #5: Results of multiple pairwise comparisons, indicating groups of (dis)similar symbol-content congruence.

Figure 10.
Map #6: Results of multiple pairwise comparisons, indicating groups of (dis)similar symbol-content congruence.
Figure 10.
Map #6: Results of multiple pairwise comparisons, indicating groups of (dis)similar symbol-content congruence.

Figure 11.
Map #7: Results of multiple pairwise comparisons, indicating groups of (dis)similar symbol-content congruence.
Figure 11.
Map #7: Results of multiple pairwise comparisons, indicating groups of (dis)similar symbol-content congruence.

Figure 12.
Map #8: Results of multiple pairwise comparisons, indicating groups of (dis)similar symbol-content congruence.
Figure 12.
Map #8: Results of multiple pairwise comparisons, indicating groups of (dis)similar symbol-content congruence.

Figure 13.
Map #9: Results of multiple pairwise comparisons, indicating groups of (dis)similar symbol-content congruence.
Figure 13.
Map #9: Results of multiple pairwise comparisons, indicating groups of (dis)similar symbol-content congruence.

Figure 14.
Map #10: Results of multiple pairwise comparisons, indicating groups of (dis)similar symbol-content congruence.
Figure 14.
Map #10: Results of multiple pairwise comparisons, indicating groups of (dis)similar symbol-content congruence.

Figure 15.
Map #11: Results of multiple pairwise comparisons, indicating groups of (dis)similar symbol-content congruence.
Figure 15.
Map #11: Results of multiple pairwise comparisons, indicating groups of (dis)similar symbol-content congruence.

Figure 16.
Map #12: Results of multiple pairwise comparisons, indicating two groups of symbol-content congruence, yet, of insignificant statistical differences.
Figure 16.
Map #12: Results of multiple pairwise comparisons, indicating two groups of symbol-content congruence, yet, of insignificant statistical differences.


Table 1.
Map topics used in the present study.
| Valence | Map ID | Map Topics | No. of Symbols |
|---|---|---|---|
| positive | 1 | City awarded for clean energy | ° |
| 2 | National parks | °°° | |
| 3 | Urban park with high biodiversity | ° | |
| 4 | Cities with excellent water quality | °°° | |
| neutral | 5 | Art college | ° |
| 6 | Art galleries | °°° | |
| 7 | Lookout tower | ° | |
| 8 | Outdoor stages | °°° | |
| negative | 9 | Flood affected area | ° |
| 10 | Melting glaciers | °°° | |
| 11 | Traffic accident | ° | |
| 12 | Smog polluted cities | °°° |
Note: ° indicates one map symbol, °°° indicates three map symbols.
Table 2.
Results of Durbin-Skillings-Mack analysis of symbol-content congruence by three map clusters.
Table 2.
Results of Durbin-Skillings-Mack analysis of symbol-content congruence by three map clusters.
| Map Topic Cluster | Q | df | p |
|---|---|---|---|
| Positive map cluster | 229.34 | 5 | < 0.001 *** |
| Neutral map cluster | 308.87 | 5 | < 0.001 *** |
| Negative map cluster | 143.12 | 5 | < 0.001 *** |
Note: Q represents Durbin-Skillings-Mack test statistics. Significance level: α = 0.05. *** p < 0.001.
Table 3.
Results of Durbin-Skillings-Mack analyses of symbol-content congruence of four positive map topics.
Table 3.
Results of Durbin-Skillings-Mack analyses of symbol-content congruence of four positive map topics.
| ID | Positive Map Topics | Q | df | p |
|---|---|---|---|---|
| 1 | City awarded for clean energy | 59.75 | 5 | < 0.001 *** |
| 2 | National parks | 60.41 | 5 | < 0.001 *** |
| 3 | Urban park with high biodiversity | 20.70 | 5 | < 0.001 *** |
| 4 | City with excellent water quality | 45.40 | 5 | < 0.001 *** |
Note: Q represents Durbin-Skillings-Mack test statistics. Significance level: α = 0.05. *** p < 0.001.
Table 4.
Results of the Durbin-Skillings-Mack test for neutral map topics.
| ID | Neutral Map Topics | Q | df | p |
|---|---|---|---|---|
| 5 | Art colleges | 62.72 | 5 | <0.001 *** |
| 6 | Art galleries | 60.68 | 5 | <0.001 *** |
| 7 | Lookout tower | 64.08 | 5 | <0.001 *** |
| 8 | Outdoor stages | 39.69 | 5 | <0.001 *** |
Note: Q represents Durbin-Skillings-Mack test statistics. Significance level: α = 0.05. *** p < 0.001.
Table 5.
Results of the Durbin-Skillings-Mack test for negative map topics.
| ID | Negative Map Topics | Q | df | p |
|---|---|---|---|---|
| 9 | Flood affected area | 18.89 | 5 | 0.002 ** |
| 10 | Melting glaciers | 36.05 | 5 | <0.001 *** |
| 11 | Traffic accident | 115.17 | 5 | <0.001 *** |
| 12 | Smog polluted cities | 9.80 | 5 | 0.081 |
Note: Q represents Durbin-Skillings-Mack test statistics. Significance level: α = 0.05. ** p < 0.01. *** p < 0.001.
Publisher’s Note: MDPI stays neutral with regard to jurisdictional claims in published maps and institutional affiliations. |
© 2020 by the author. Licensee MDPI, Basel, Switzerland. This article is an open access article distributed under the terms and conditions of the Creative Commons Attribution (CC BY) license (http://creativecommons.org/licenses/by/4.0/).
Share and Cite
MDPI and ACS Style
Klettner, S. Form Follows Content: An Empirical Study on Symbol-Content (In)Congruences in Thematic Maps. ISPRS Int. J. Geo-Inf. 2020, 9, 719. https://0-doi-org.brum.beds.ac.uk/10.3390/ijgi9120719
AMA Style
Klettner S. Form Follows Content: An Empirical Study on Symbol-Content (In)Congruences in Thematic Maps. ISPRS International Journal of Geo-Information. 2020; 9(12):719. https://0-doi-org.brum.beds.ac.uk/10.3390/ijgi9120719
Chicago/Turabian StyleKlettner, Silvia. 2020. "Form Follows Content: An Empirical Study on Symbol-Content (In)Congruences in Thematic Maps" ISPRS International Journal of Geo-Information 9, no. 12: 719. https://0-doi-org.brum.beds.ac.uk/10.3390/ijgi9120719
Note that from the first issue of 2016, this journal uses article numbers instead of page numbers. See further details here.