Structural Elements Detection and Reconstruction (SEDR): A Hybrid Approach for Modeling Complex Indoor Structures


Abstract
:1. Introduction
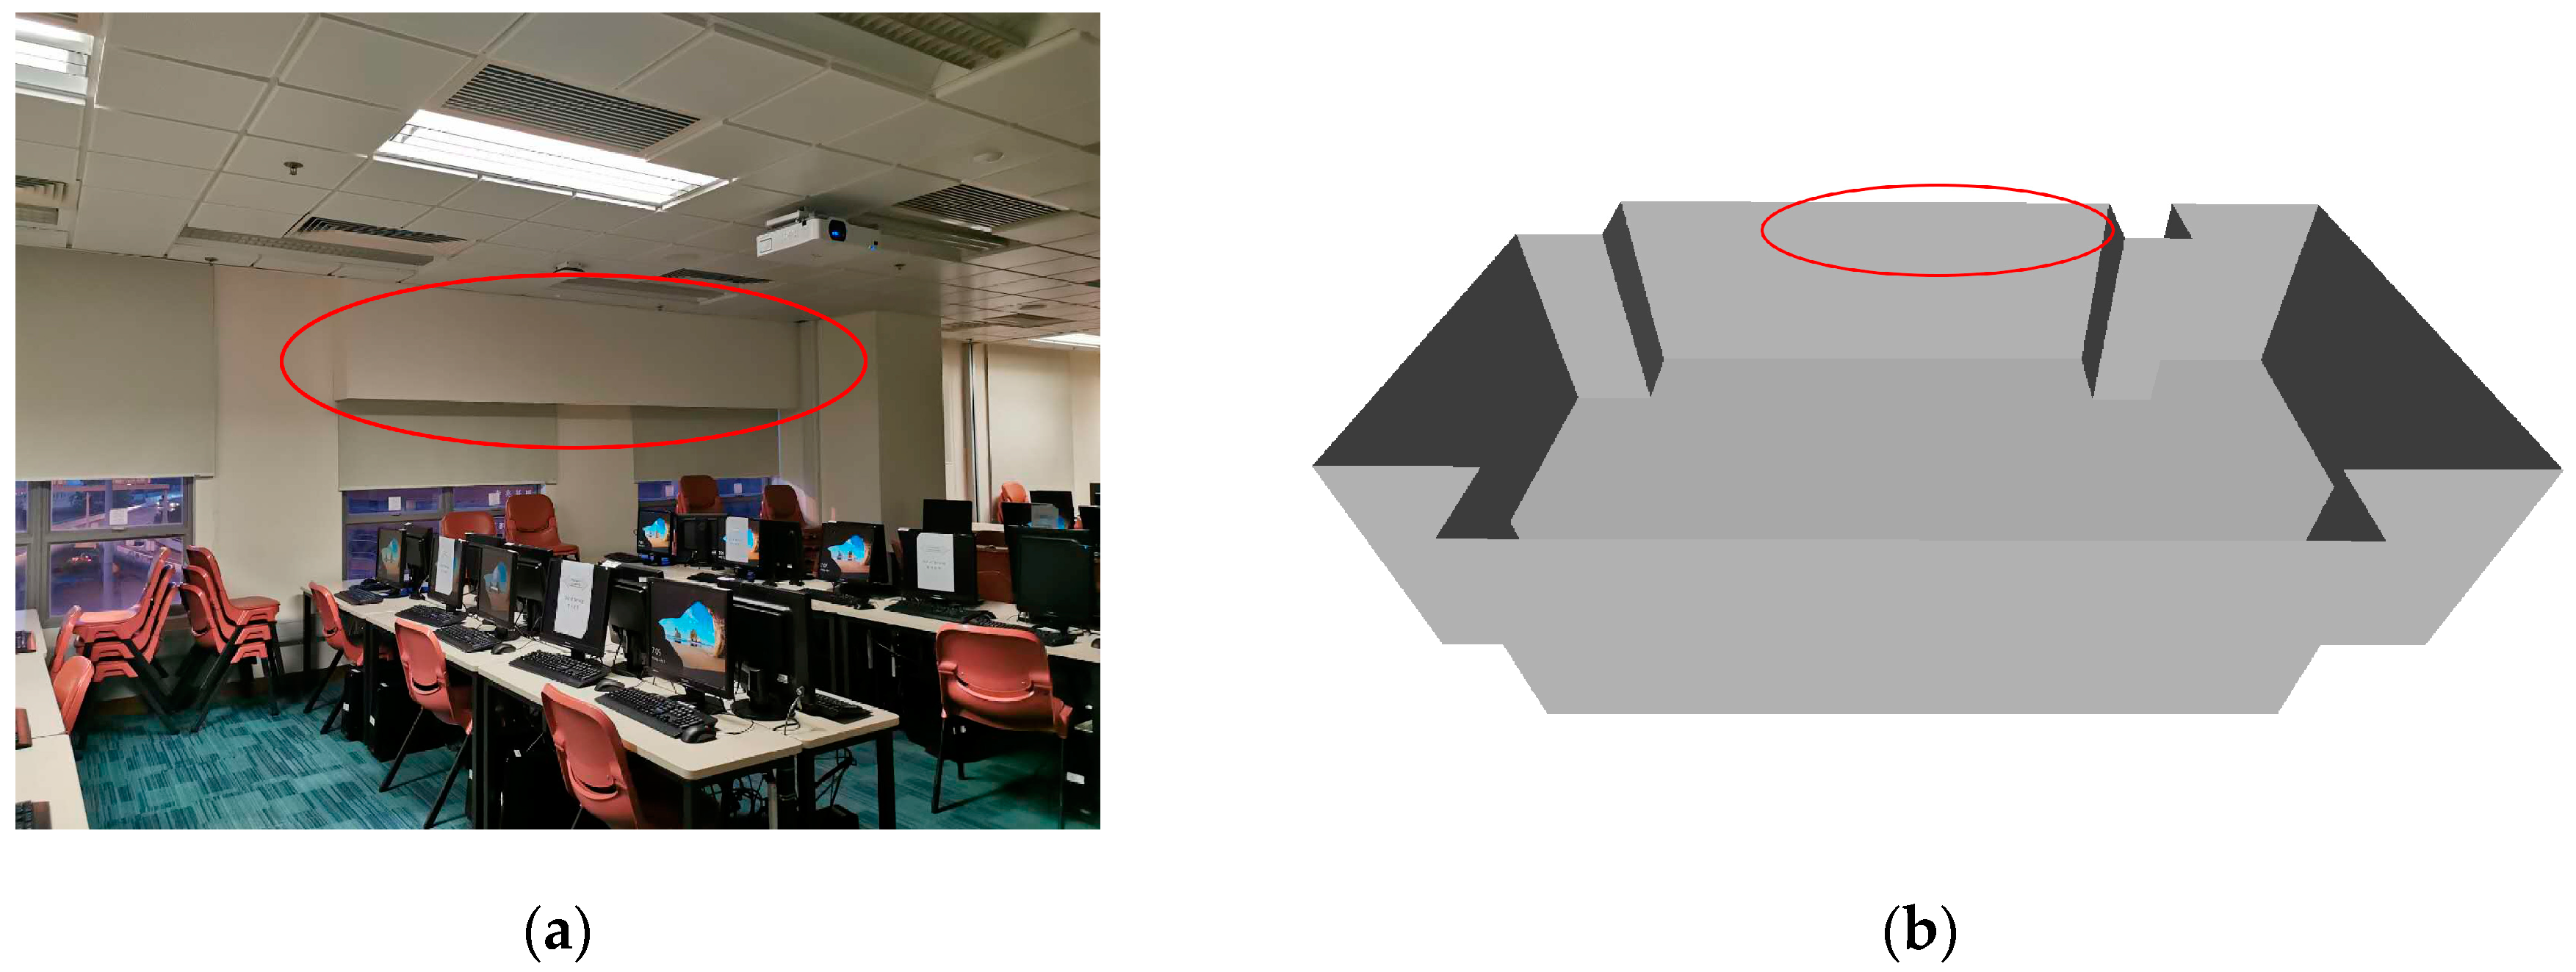
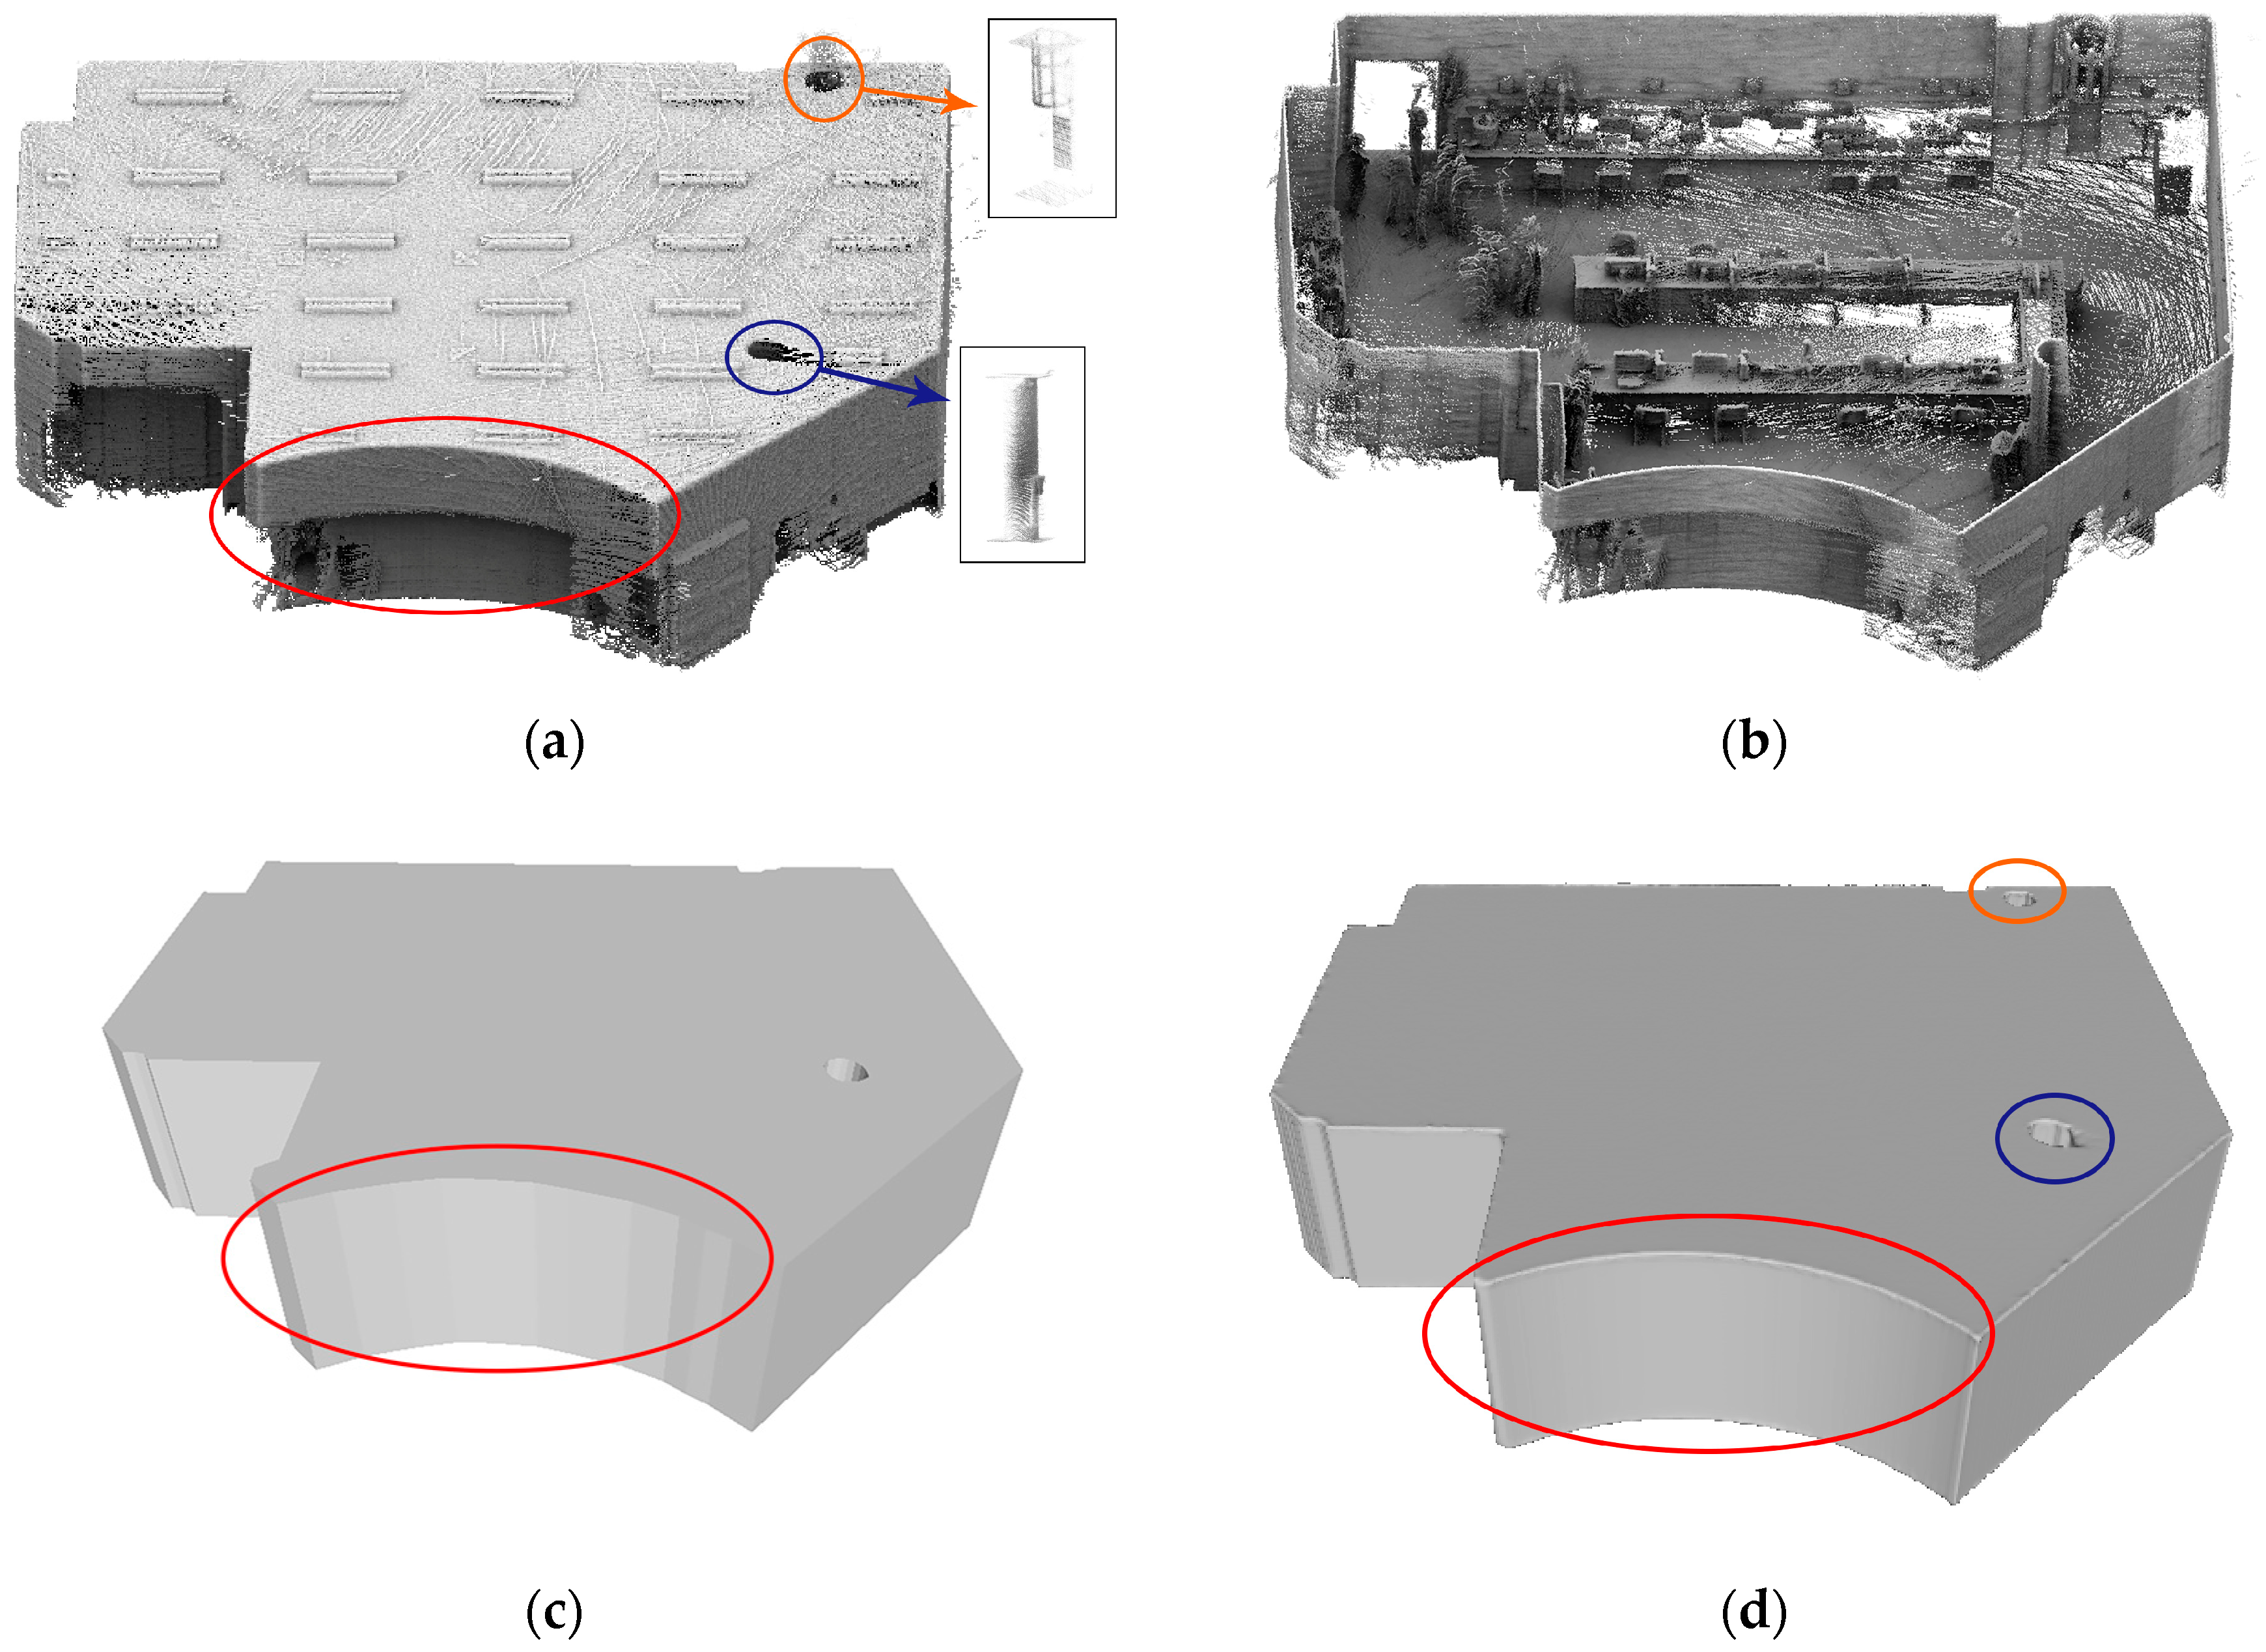
- A hybrid approach of data-driven and model-driven approach for reconstructing indoor structure elements is presented. The proposed approach detects and models curved wall structures in the 3D domain.
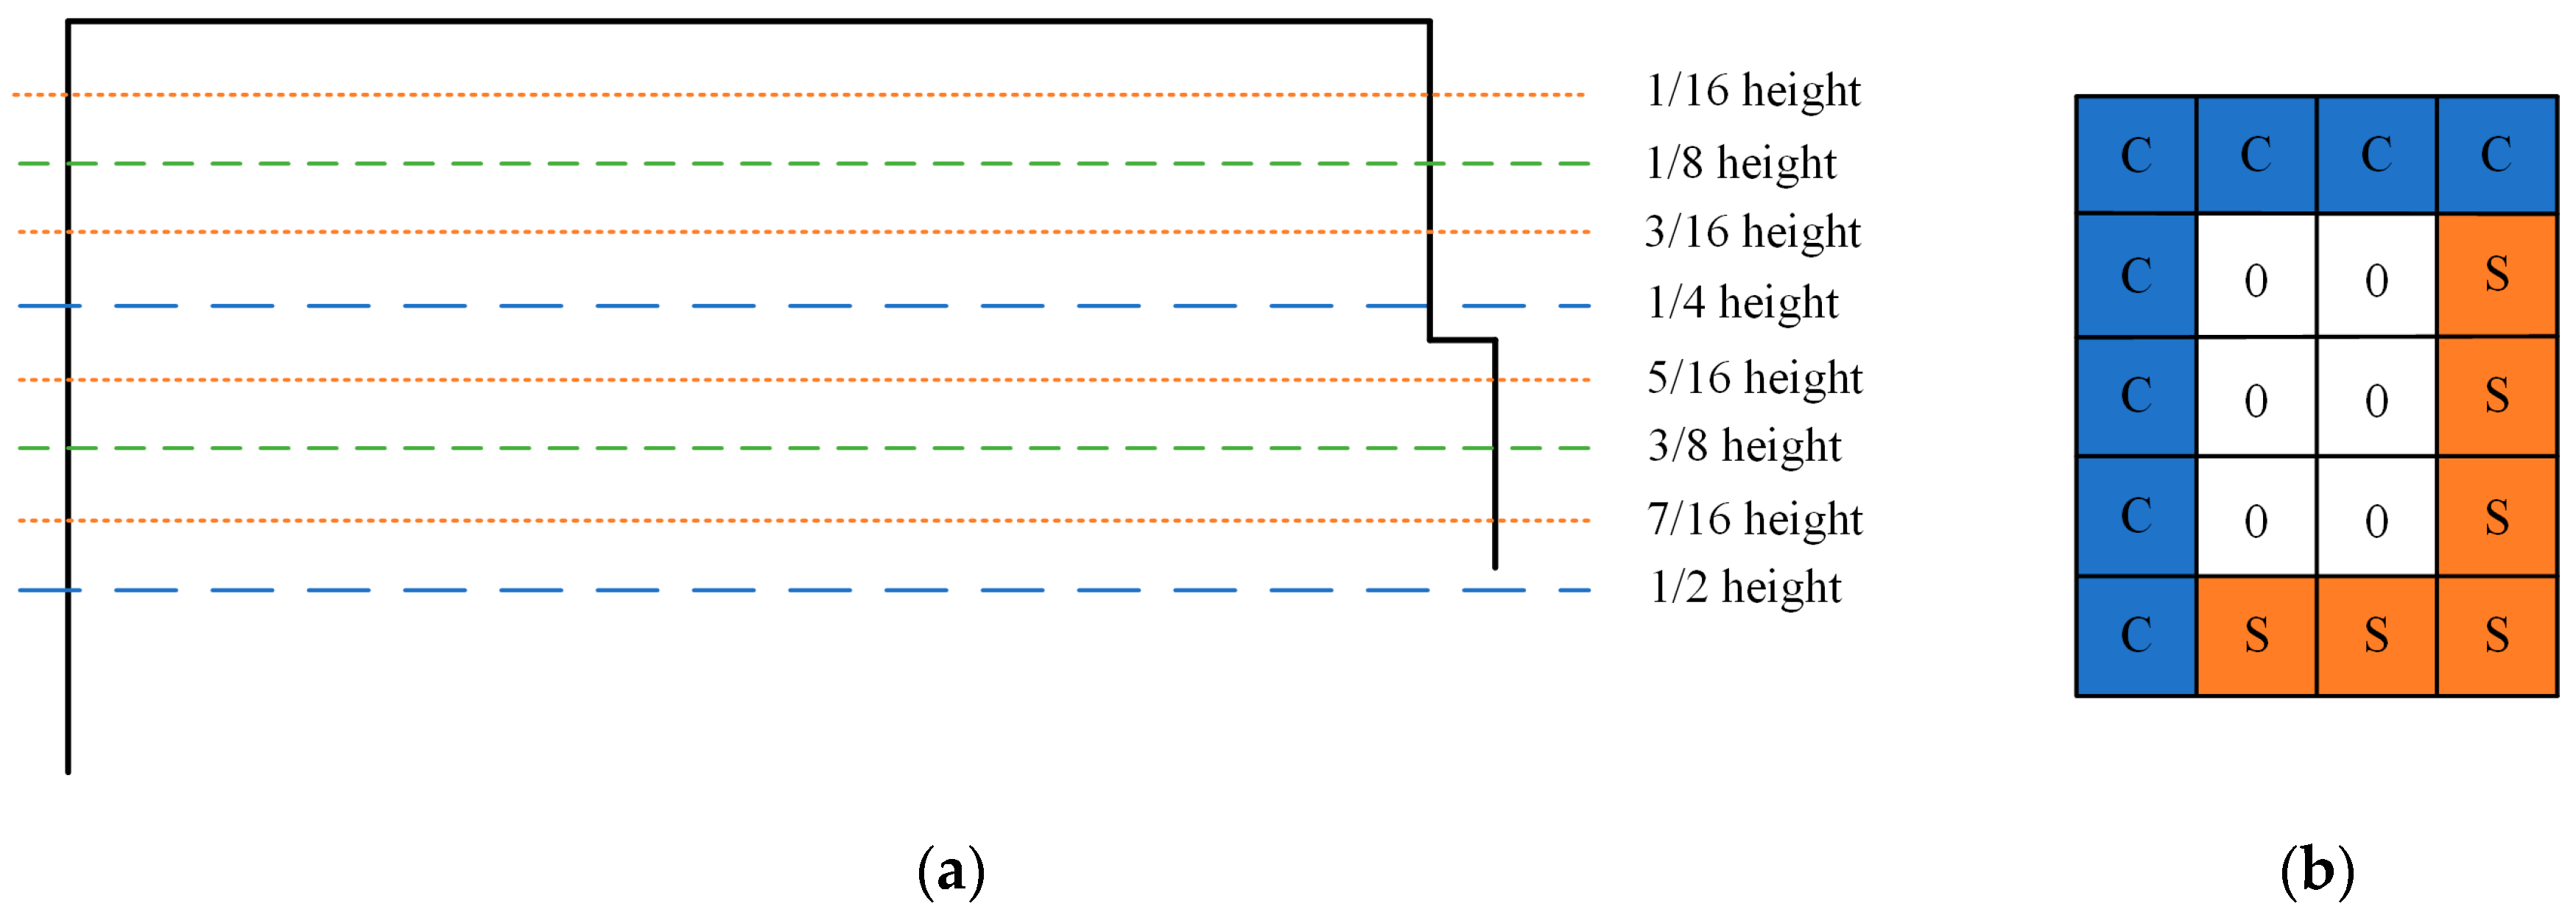
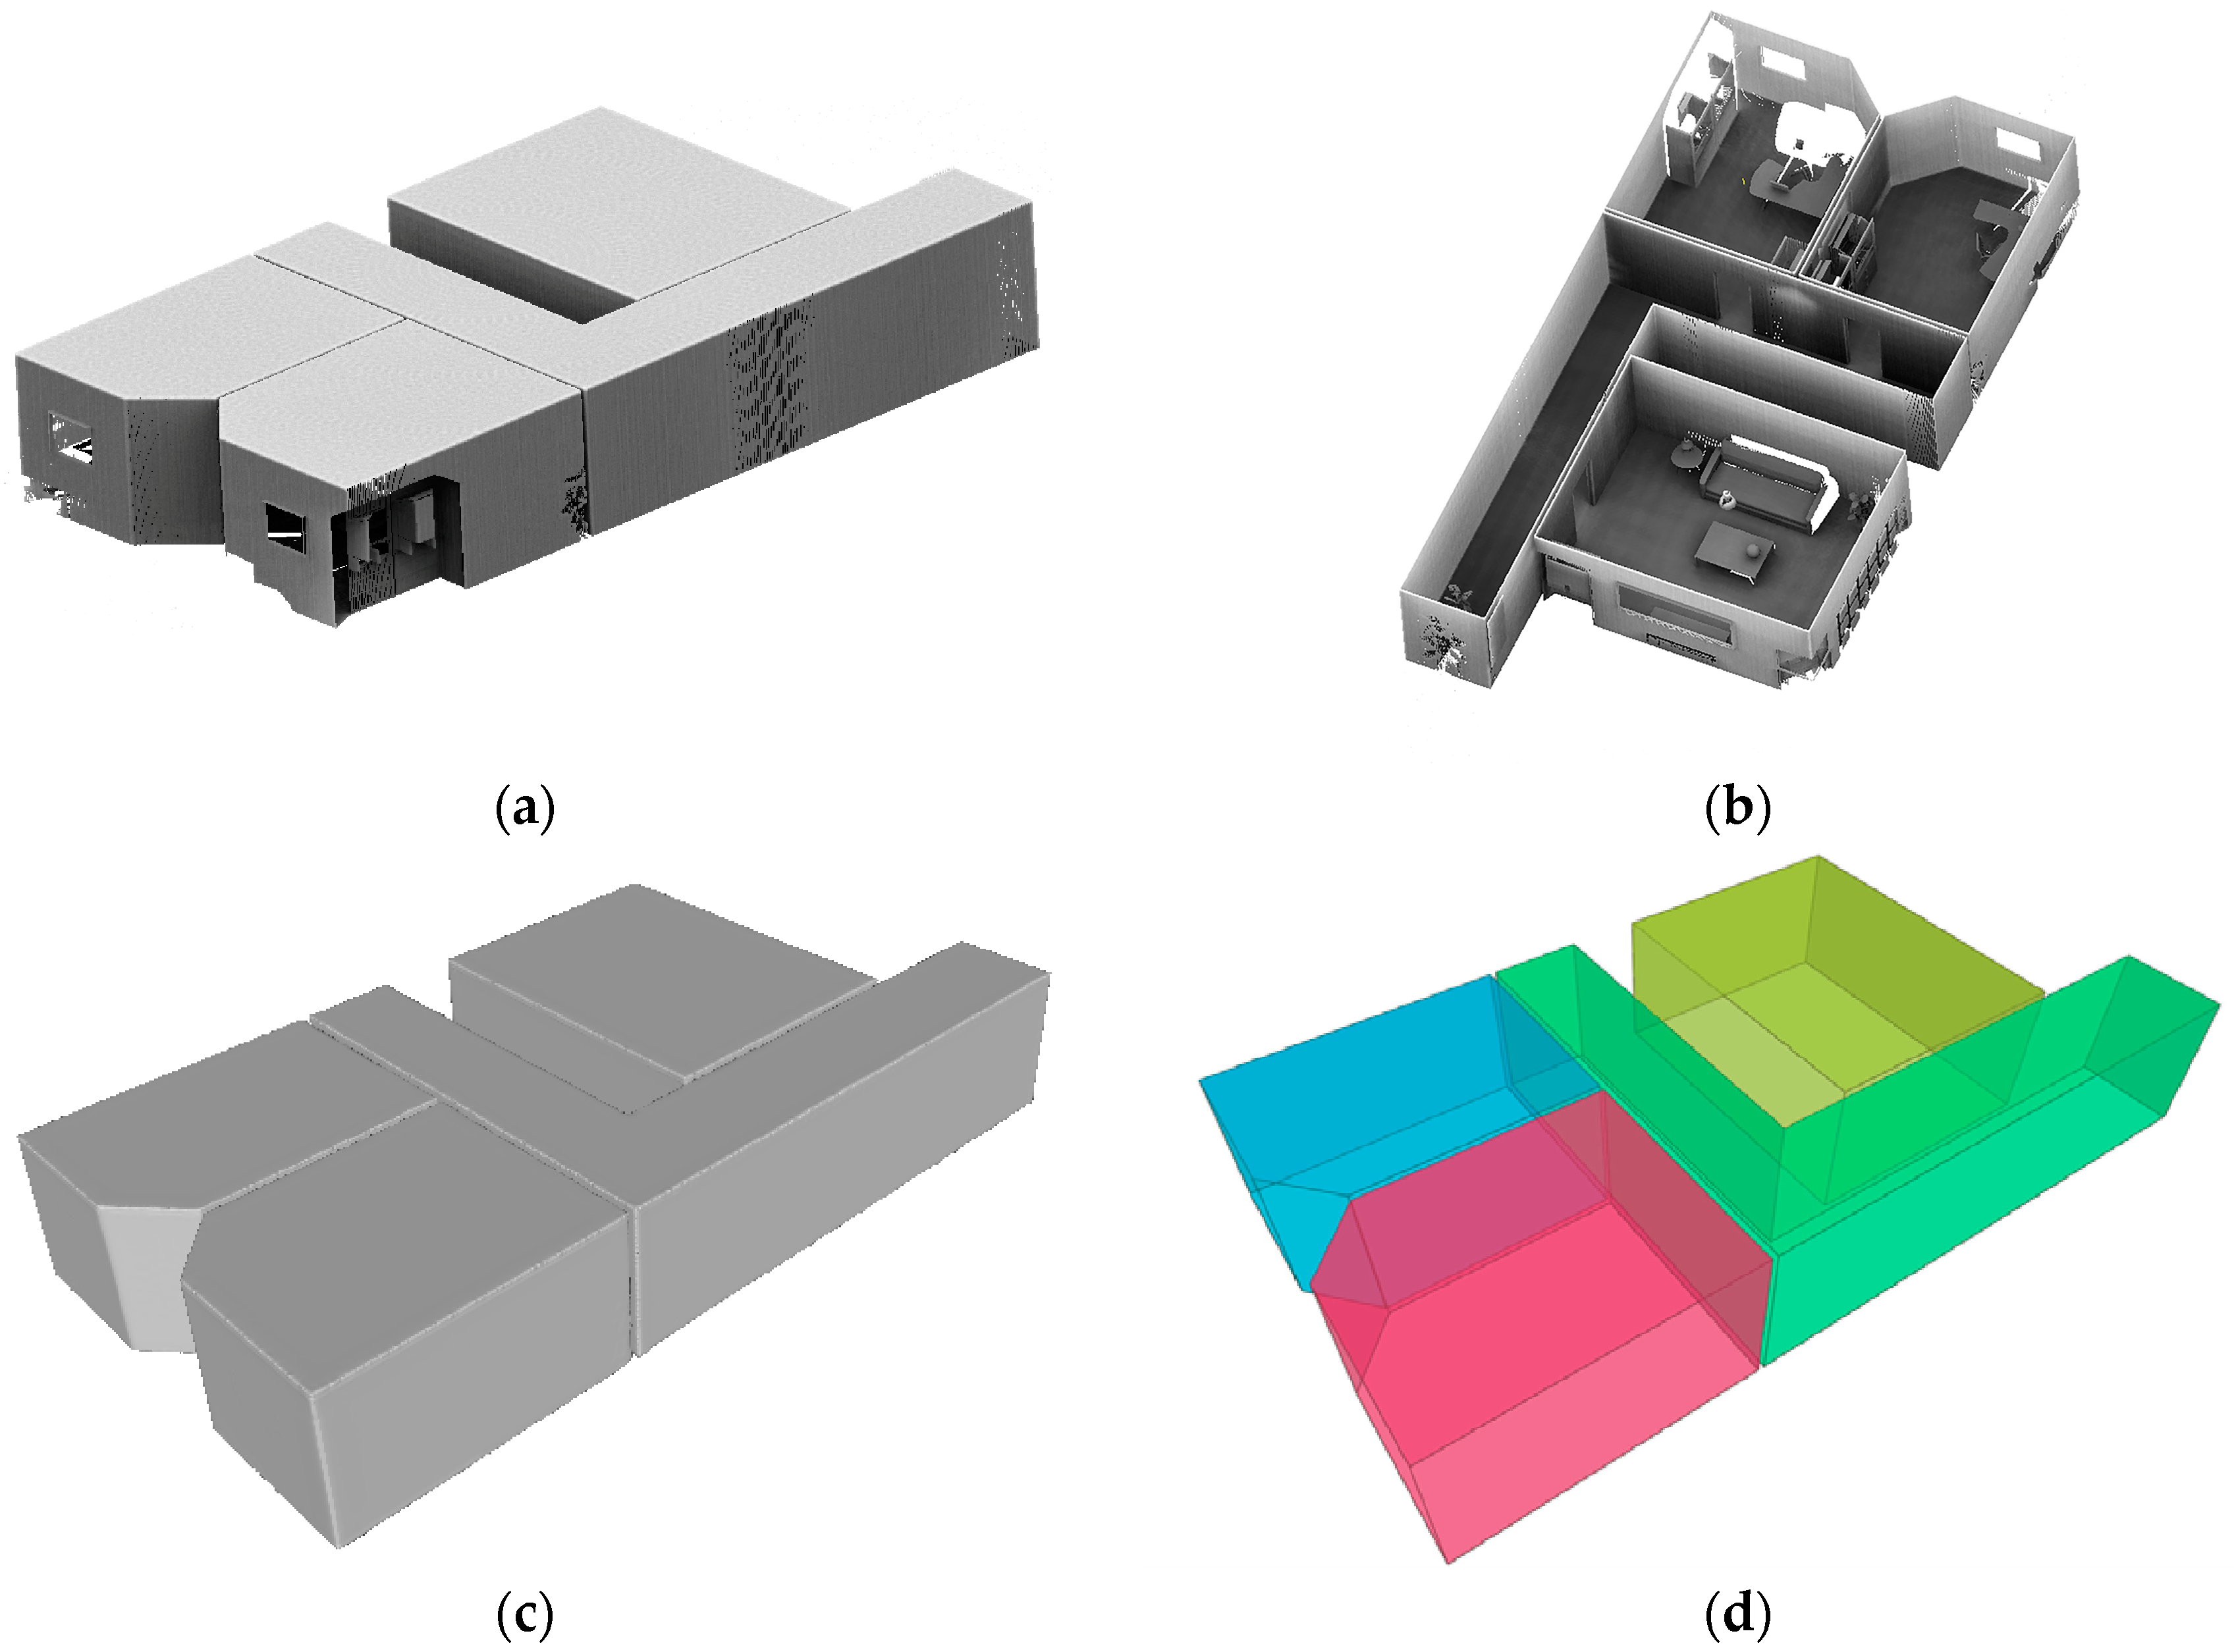
- A fusion of grid and slice strategy to detect detailed structures of the indoor scenario.
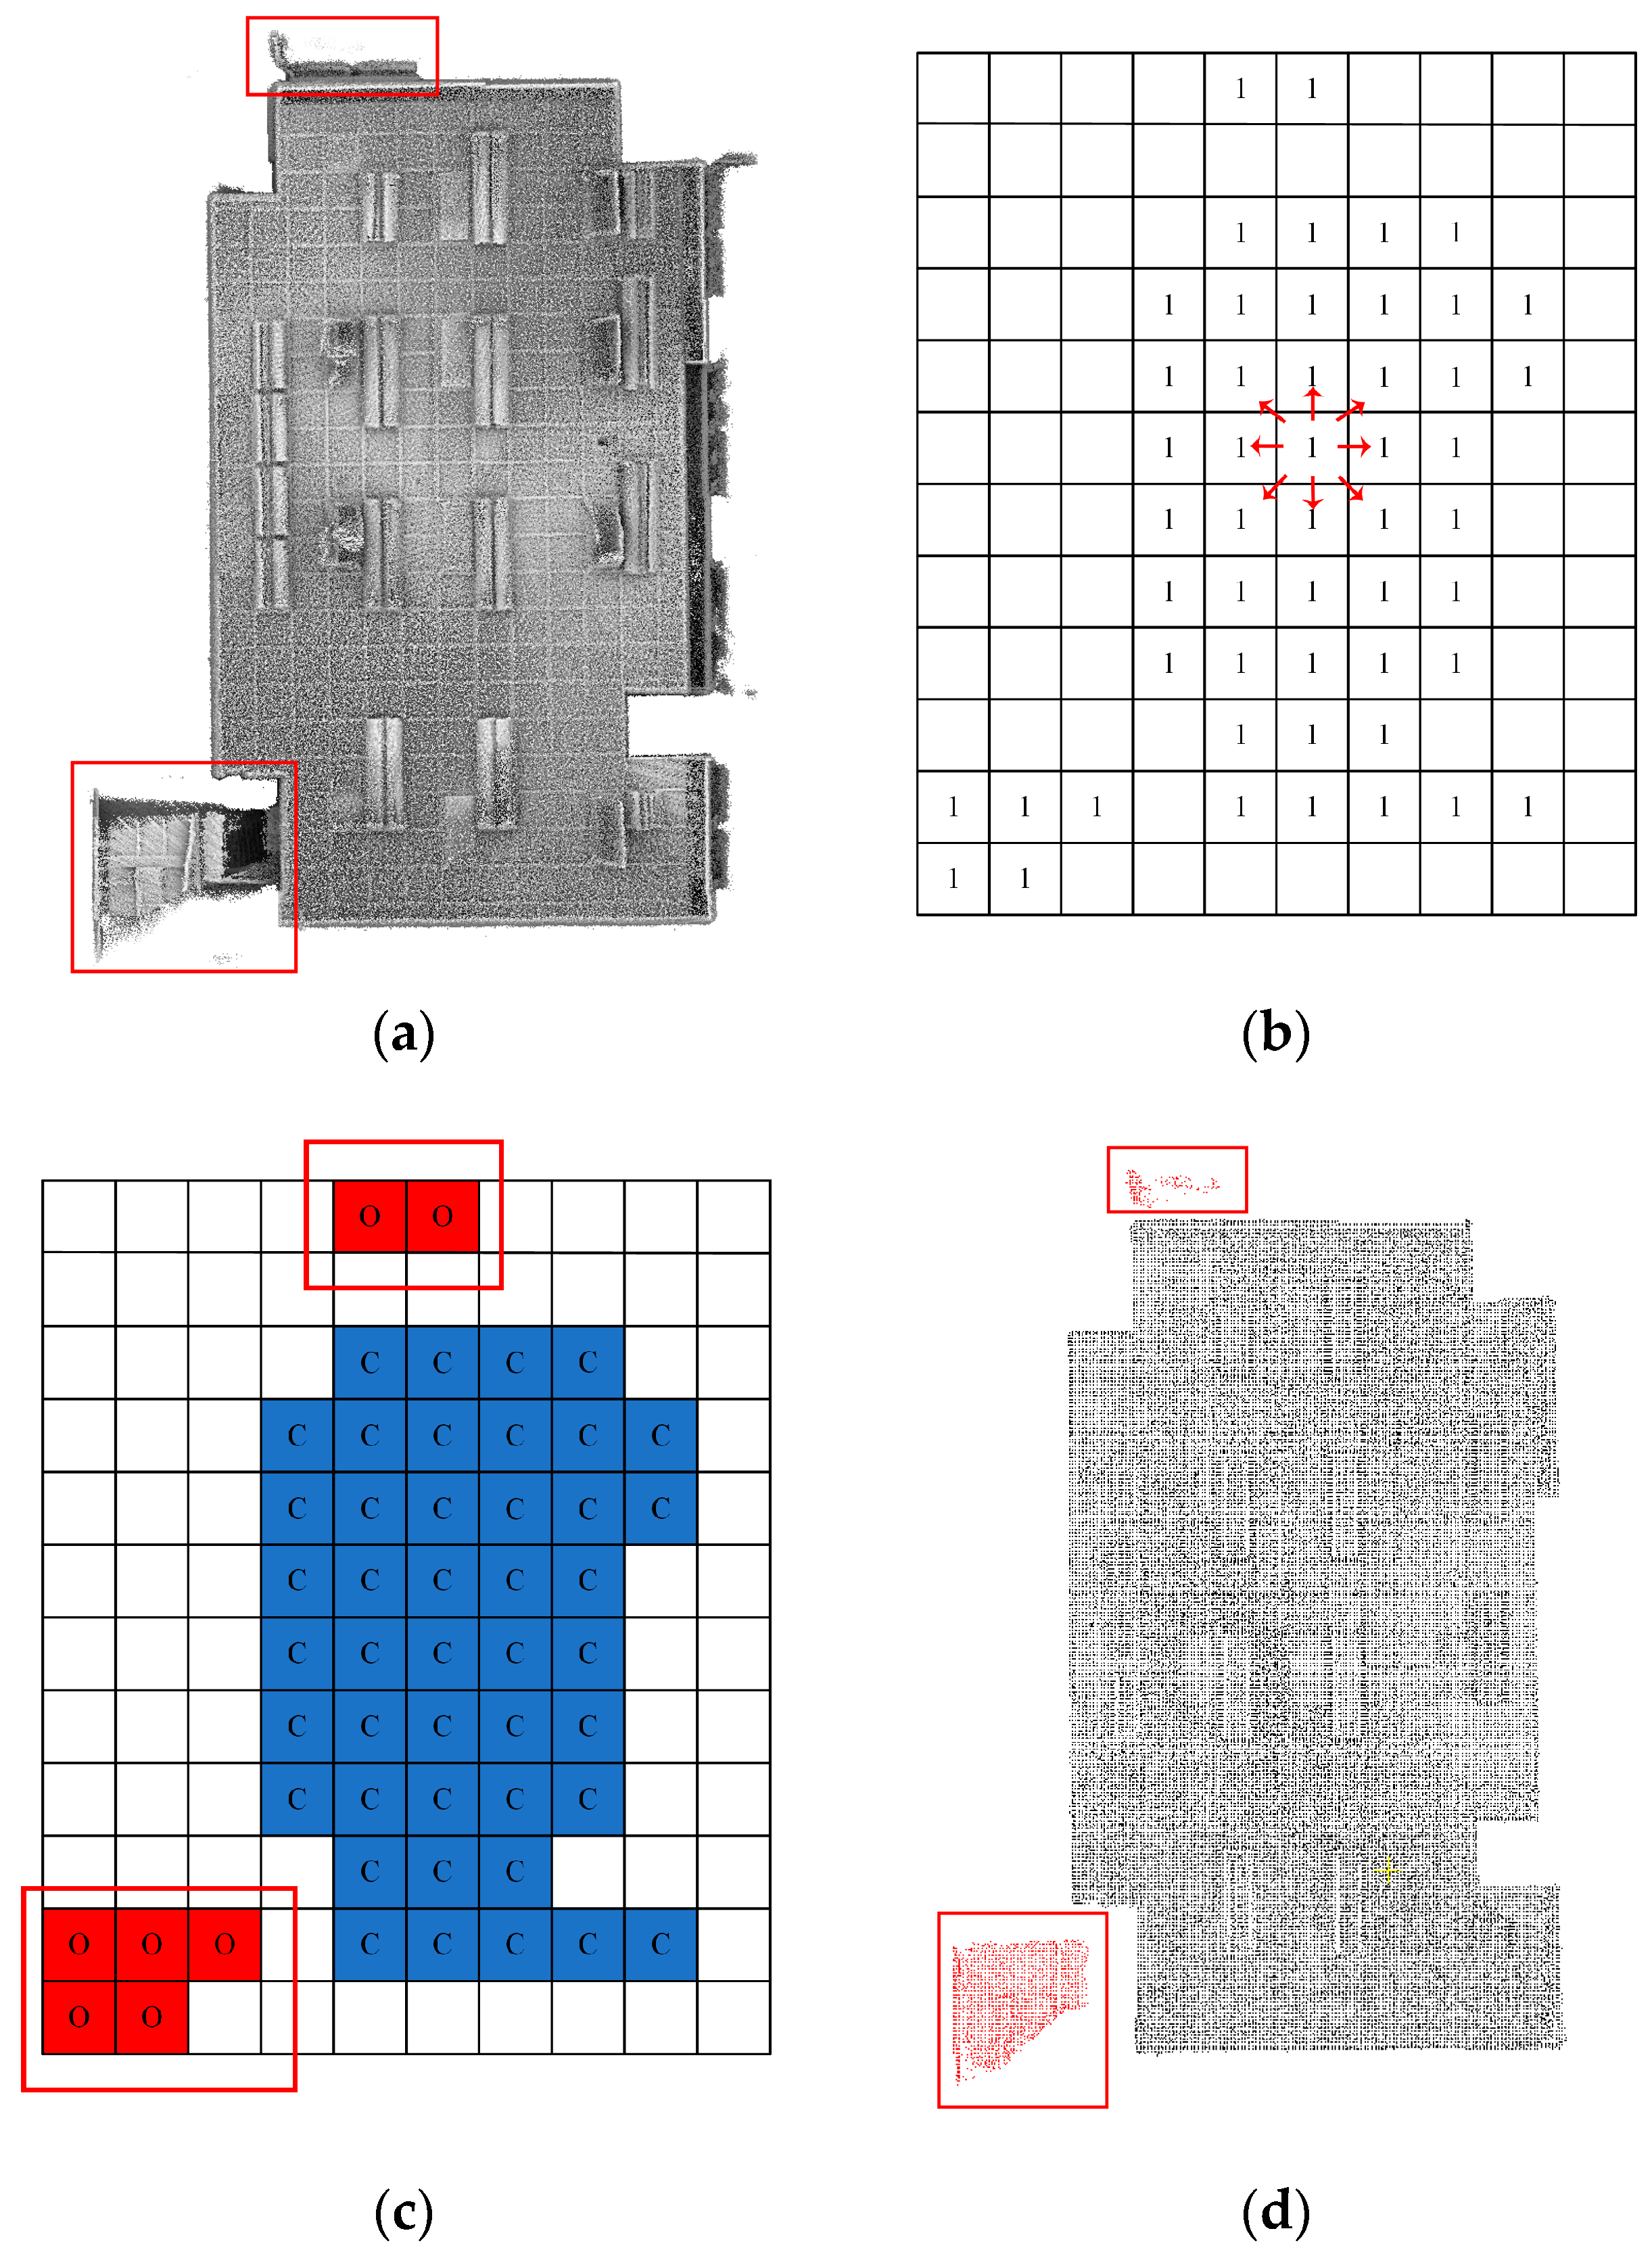
- An eight-connected domain algorithm that can keep the main structures not affected in outlier removal.
2. Methodology
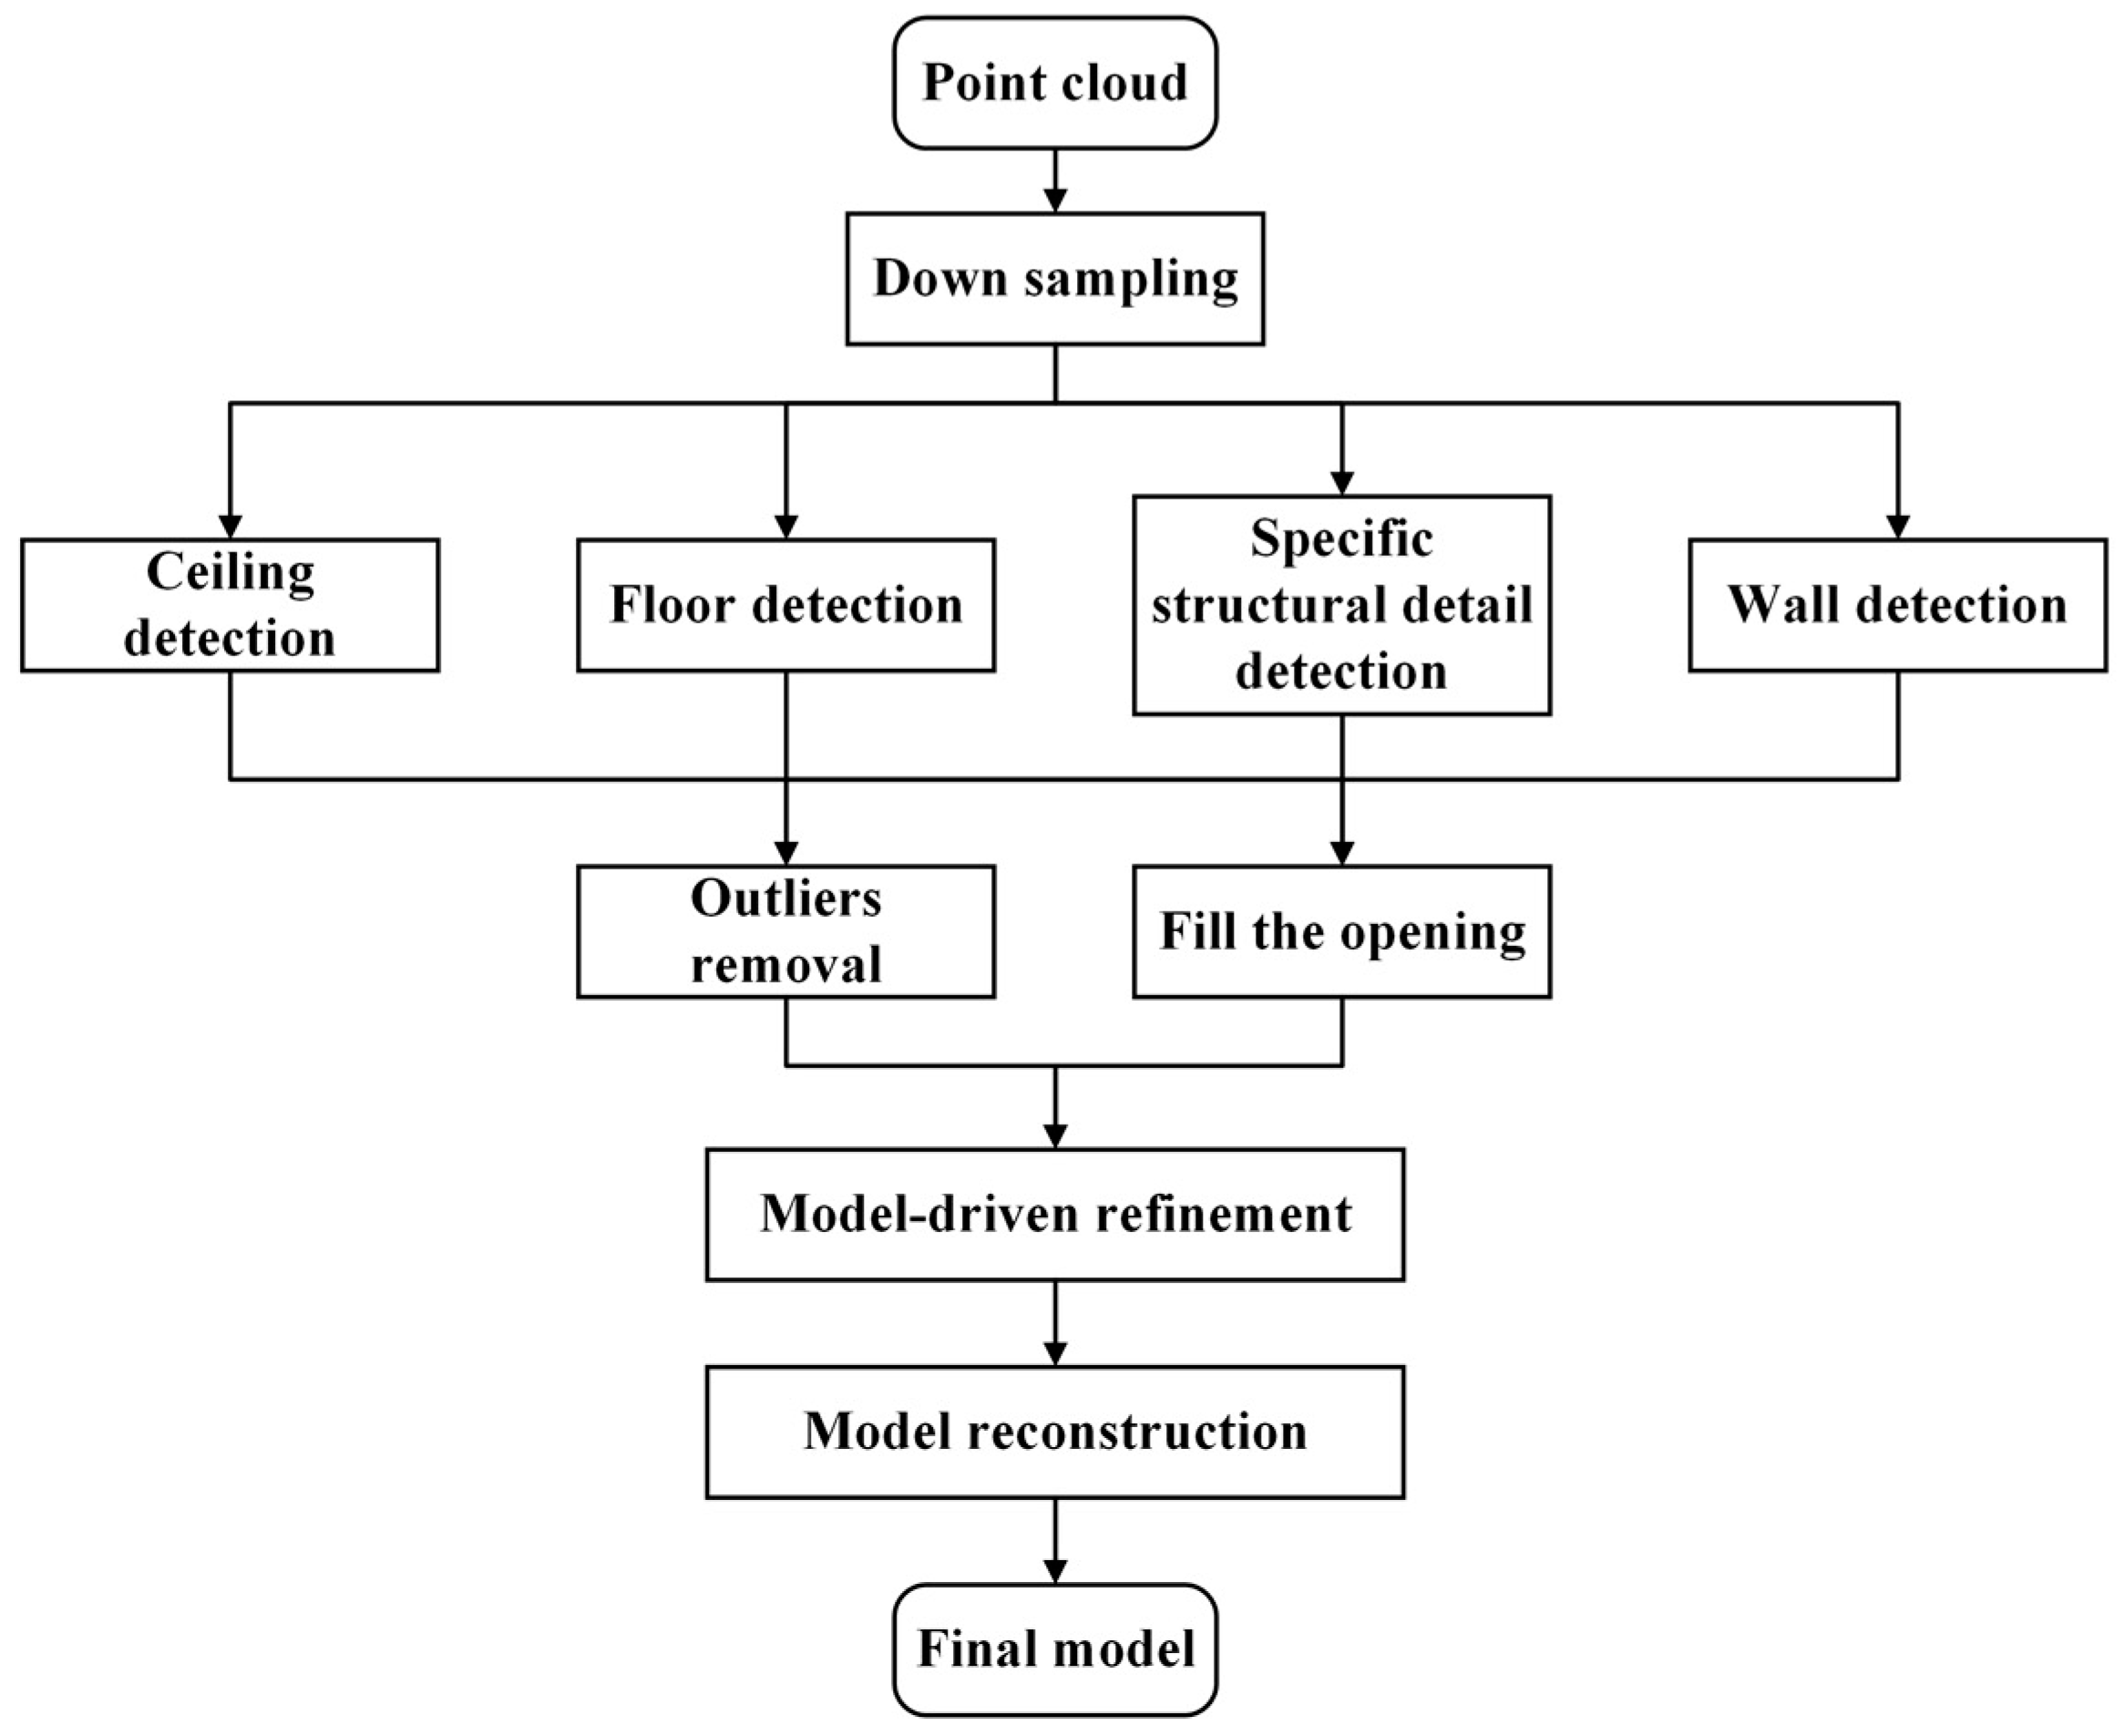
2.1. Overview
2.2. Pre-Process
2.3. Structural Elements Detection
2.3.1. Ceiling and Floor Detection
2.3.2. Wall Detection
2.4. Refinement and Reconstruction
3. Experiments and Discussion
3.1. Datasets Description and Parameters Settings
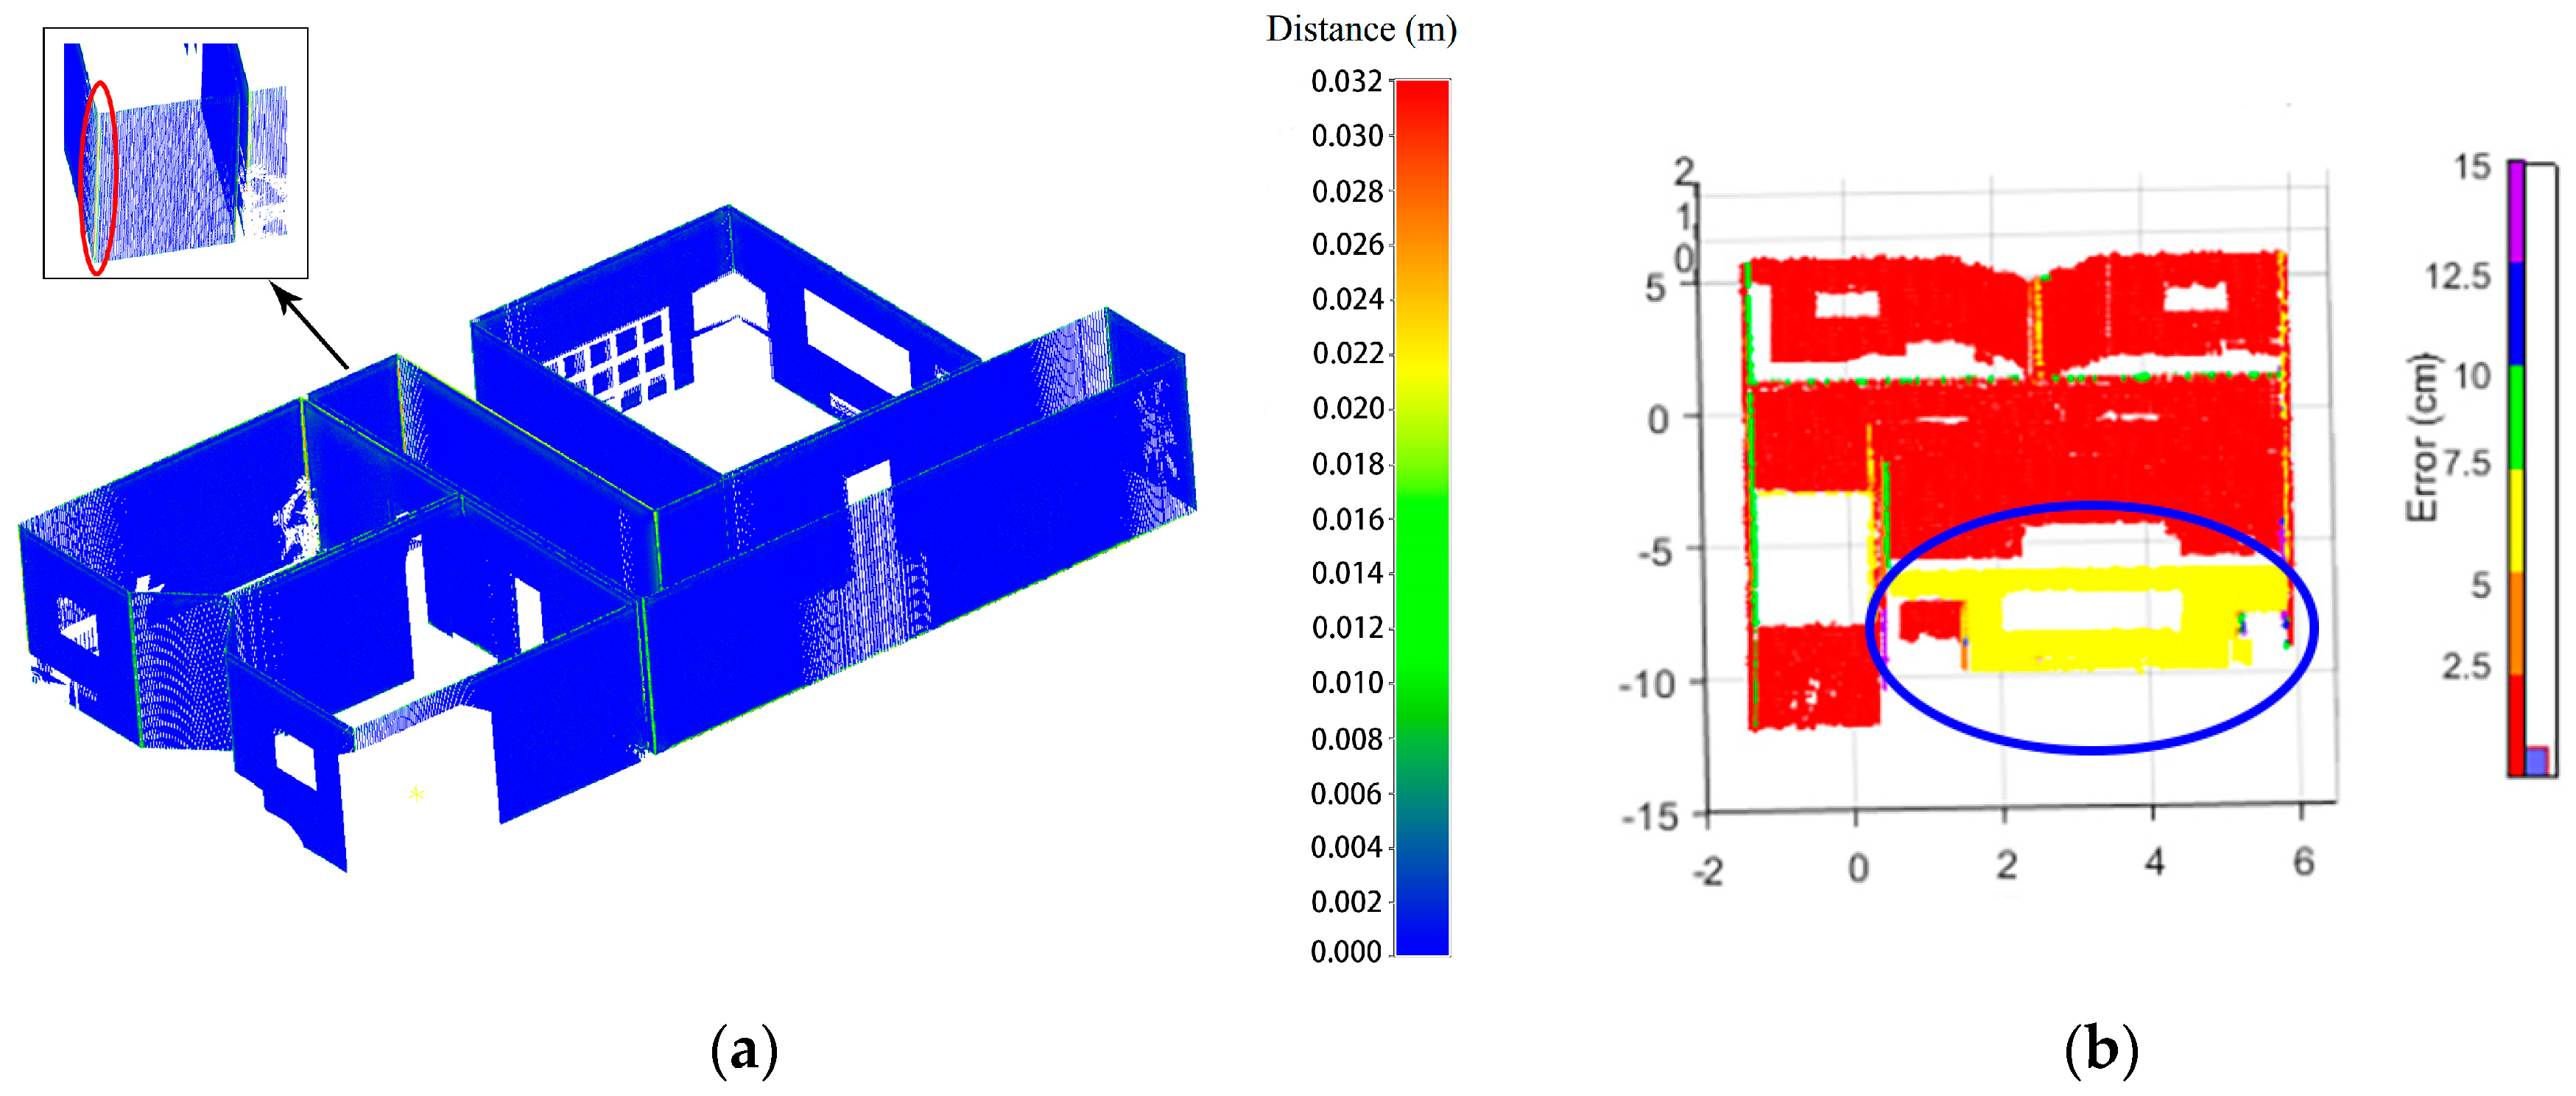
3.2. Reconstruction Quality
4. Conclusions
Author Contributions
Funding
Acknowledgments
Conflicts of Interest
References
- Lehtola, V.; Kaartinen, H.; Nüchter, A.; Kaijaluoto, R.; Kukko, A.; Litkey, P.; Honkavaara, E.; Rosnell, T.; Vaaja, M.; Virtanen, J.-P.; et al. Comparison of the Selected State-Of-The-Art 3D Indoor Scanning and Point Cloud Generation Methods. Remote Sens. 2017, 9, 796. [Google Scholar] [CrossRef] [Green Version]
- Fellner, I.; Huang, H.; Gartner, G. “Turn Left after the WC, and Use the Lift to Go to the 2nd Floor”—Generation of Landmark-Based Route Instructions for Indoor Navigation. ISPRS Int. J. Geo Inf. 2017, 6, 183. [Google Scholar] [CrossRef] [Green Version]
- Natephra, W.; Motamedi, A.; Fukuda, T.; Yabuki, N. Integrating building information modeling and virtual reality development engines for building indoor lighting design. Vis. Eng. 2017, 5, 1–21. [Google Scholar] [CrossRef] [Green Version]
- Jung, J.; Stachniss, C.; Ju, S.; Heo, J. Automated 3D volumetric reconstruction of multiple-room building interiors for as-built BIM. Adv. Eng. Inform. 2018, 38, 811–825. [Google Scholar] [CrossRef]
- Volk, R.; Stengel, J.; Schultmann, F. Building Information Modeling (BIM) for existing buildings—Literature review and future needs. Autom. Constr. 2014, 38, 109–127. [Google Scholar] [CrossRef] [Green Version]
- Fan, W.; Shi, W.; Xiang, H.; Ding, K. A Novel Method for Plane Extraction from Low-Resolution Inhomogeneous Point Clouds and its Application to a Customized Low-Cost Mobile Mapping System. Remote Sens. 2019, 11, 2789. [Google Scholar] [CrossRef] [Green Version]
- Tang, S.; Zhu, Q.; Chen, W.; Darwish, W.; Wu, B.; Hu, H.; Chen, M. Enhanced RGB-D Mapping Method for Detailed 3D Indoor and Outdoor Modeling. Sensors 2016, 16, 1589. [Google Scholar] [CrossRef] [PubMed] [Green Version]
- Mura, C.; Mattausch, O.; Villanueva, A.J.; Gobbetti, E.; Pajarola, R. Automatic room detection and reconstruction in cluttered indoor environments with complex room layouts. Comput. Graph. 2014, 44, 20–32. [Google Scholar] [CrossRef] [Green Version]
- Yang, F.; Zhou, G.; Su, F.; Zuo, X.; Tang, L.; Liang, Y.; Zhu, H.; Li, L. Automatic Indoor Reconstruction from Point Clouds in Multi-room Environments with Curved Walls. Sensors 2019, 19, 3798. [Google Scholar] [CrossRef] [PubMed] [Green Version]
- Nikoohemat, S.; Diakité, A.; Zlatanova, S.; Vosselman, G. Indoor 3D reconstruction from point clouds for optimal routing in complex buildings to support disaster management. Autom. Constr. 2020, 113, 103109. [Google Scholar] [CrossRef]
- Trimble RealWorks. Available online: www.meteo.ru (accessed on 2 September 2020).
- CloudCompare. Available online: http://www.cloudcompare.org/ (accessed on 15 September 2020).
- 3DReshaper. Available online: http://www.3dreshaper.com/en/ (accessed on 15 September 2020).
- Macher, H.; Landes, T.; Grussenmeyer, P. From Point Clouds to Building Information Models: 3D Semi-Automatic Reconstruction of Indoors of Existing Buildings. Appl. Sci. 2017, 7, 1030. [Google Scholar] [CrossRef] [Green Version]
- Murali, S.; Speciale, P.; Oswald, M.R.; Pollefeys, M. Indoor Scan2BIM: Building information models of house interiors. In Proceedings of the 2017 IEEE/RSJ International Conference on Intelligent Robots and Systems (IROS), Vancouver, BC, Canada, 24–28 September 2017; pp. 6126–6133. [Google Scholar]
- Planner 5D. Available online: http://www.planner5d.com/ (accessed on 15 September 2020).
- Previtali, M.; Díaz-Vilariño, L.; Scaioni, M. Indoor Building Reconstruction from Occluded Point Clouds Using Graph-Cut and Ray-Tracing. Appl. Sci. 2018, 8, 1529. [Google Scholar] [CrossRef] [Green Version]
- Rhinoceros. Available online: https://www.rhino3d.com/ (accessed on 24 January 2020).
- FreeCAD. Available online: https://www.freecadweb.org/ (accessed on 15 September 2020).
- Wang, R.; Xie, L.; Chen, D. Modeling Indoor Spaces Using Decomposition and Reconstruction of Structural Elements. Photogramm. Eng. Remote Sens. 2017, 83, 827–841. [Google Scholar] [CrossRef]
- Shi, W.; Ahmed, W.; Li, N.; Fan, W.; Xiang, H.; Wang, M. Semantic Geometric Modelling of Unstructured Indoor Point Cloud. ISPRS Int. J. Geo Inf. 2018, 8, 9. [Google Scholar] [CrossRef] [Green Version]
- Xie, L.; Wang, R.; Ming, Z.; Chen, D. A Layer-Wise Strategy for Indoor As-Built Modeling Using Point Clouds. Appl. Sci. 2019, 9, 2904. [Google Scholar] [CrossRef] [Green Version]
- Budroni, A.; Böhm, J. Automatic 3D Modelling of Indoor Manhattan-World Scenes from Laser Data. In Proceedings of the International Archives of Photogrammetry, Remote Sensing and Spatial Information Sciences, Volume XXXVIII, Part 5 Commission V Symposium, Newcastle Upon Tyne, UK, 1–5 October 2010; pp. 115–120. [Google Scholar]
- Sánchez, V.; Zakhor, A. Planar 3D modeling of building interiors from point cloud data. In Proceedings of the 2012 19th IEEE International Conference on Image Processing, Orlando, FL, USA, 30 September–3 October 2012; pp. 1777–1780. [Google Scholar]
- Ochmann, S.; Vock, R.; Klein, R. Automatic reconstruction of fully volumetric 3D building models from oriented point clouds. ISPRS J. Photogramm. Remote Sens. 2019, 151, 251–262. [Google Scholar] [CrossRef] [Green Version]
- Tran, H.; Khoshelham, K. Procedural Reconstruction of 3D Indoor Models from Lidar Data Using Reversible Jump Markov Chain Monte Carlo. Remote Sens. 2020, 12, 838. [Google Scholar] [CrossRef] [Green Version]
- MeshLab. Available online: https://www.meshlab.net/ (accessed on 15 September 2020).
- Point Cloud Library. Available online: https://pointclouds.org/ (accessed on 15 September 2020).
- Lauterbach, H.A.; Borrmann, D.; Heß, R.; Eck, D.; Schilling, K.; Nüchter, A. Evaluation of a Backpack-Mounted 3D Mobile Scanning System. Remote Sens. 2015, 7, 13753–13781. [Google Scholar] [CrossRef] [Green Version]
- Kazhdan, M.; Hoppe, H. Screened poisson surface reconstruction. ACM Trans. Graph. 2013, 32, 1–13. [Google Scholar] [CrossRef] [Green Version]


| Parameter | Descriptions | BLS | HLS | SYN |
|---|---|---|---|---|
| Voxel size | The size of a voxel in down-sampling | 0.05 m | 0.05 m | 0.05 m |
| Tolerance of plane | The distance tolerance of RANSAC in detecting plane | 0.07 m | 0.1 m | 0.1 m |
| Grid size | The size of the grid in outlier removal and grid-slices | 0.05 m | 0.05 m | 0.05 m |
| Angle and neighbors | The angle and neighbor points of boundary estimation | 60° 200 | 60° 200 | 90° 100 |
| Minimum of grids | The minimum number of grids in the structural detail region | 20 | 20 | 20 |
| Tolerance of boundary | The tolerance of RANSAC in wall refinement | 0.05 m | 0.05 m | 0.01 m |
| Tree depth | The maximum tree depth in Screen Poisson Reconstruction | 9 | 9 | 9 |
Publisher’s Note: MDPI stays neutral with regard to jurisdictional claims in published maps and institutional affiliations. |
© 2020 by the authors. Licensee MDPI, Basel, Switzerland. This article is an open access article distributed under the terms and conditions of the Creative Commons Attribution (CC BY) license (http://creativecommons.org/licenses/by/4.0/).
Share and Cite
Wu, K.; Shi, W.; Ahmed, W. Structural Elements Detection and Reconstruction (SEDR): A Hybrid Approach for Modeling Complex Indoor Structures. ISPRS Int. J. Geo-Inf. 2020, 9, 760. https://0-doi-org.brum.beds.ac.uk/10.3390/ijgi9120760
Wu K, Shi W, Ahmed W. Structural Elements Detection and Reconstruction (SEDR): A Hybrid Approach for Modeling Complex Indoor Structures. ISPRS International Journal of Geo-Information. 2020; 9(12):760. https://0-doi-org.brum.beds.ac.uk/10.3390/ijgi9120760
Chicago/Turabian StyleWu, Ke, Wenzhong Shi, and Wael Ahmed. 2020. "Structural Elements Detection and Reconstruction (SEDR): A Hybrid Approach for Modeling Complex Indoor Structures" ISPRS International Journal of Geo-Information 9, no. 12: 760. https://0-doi-org.brum.beds.ac.uk/10.3390/ijgi9120760