
1H NMR-Based Metabolic Profiling Reveals the Effects of Fluoxetine on Lipid and Amino Acid Metabolism in Astrocytes

Abstract
:1. Introduction
2. Results
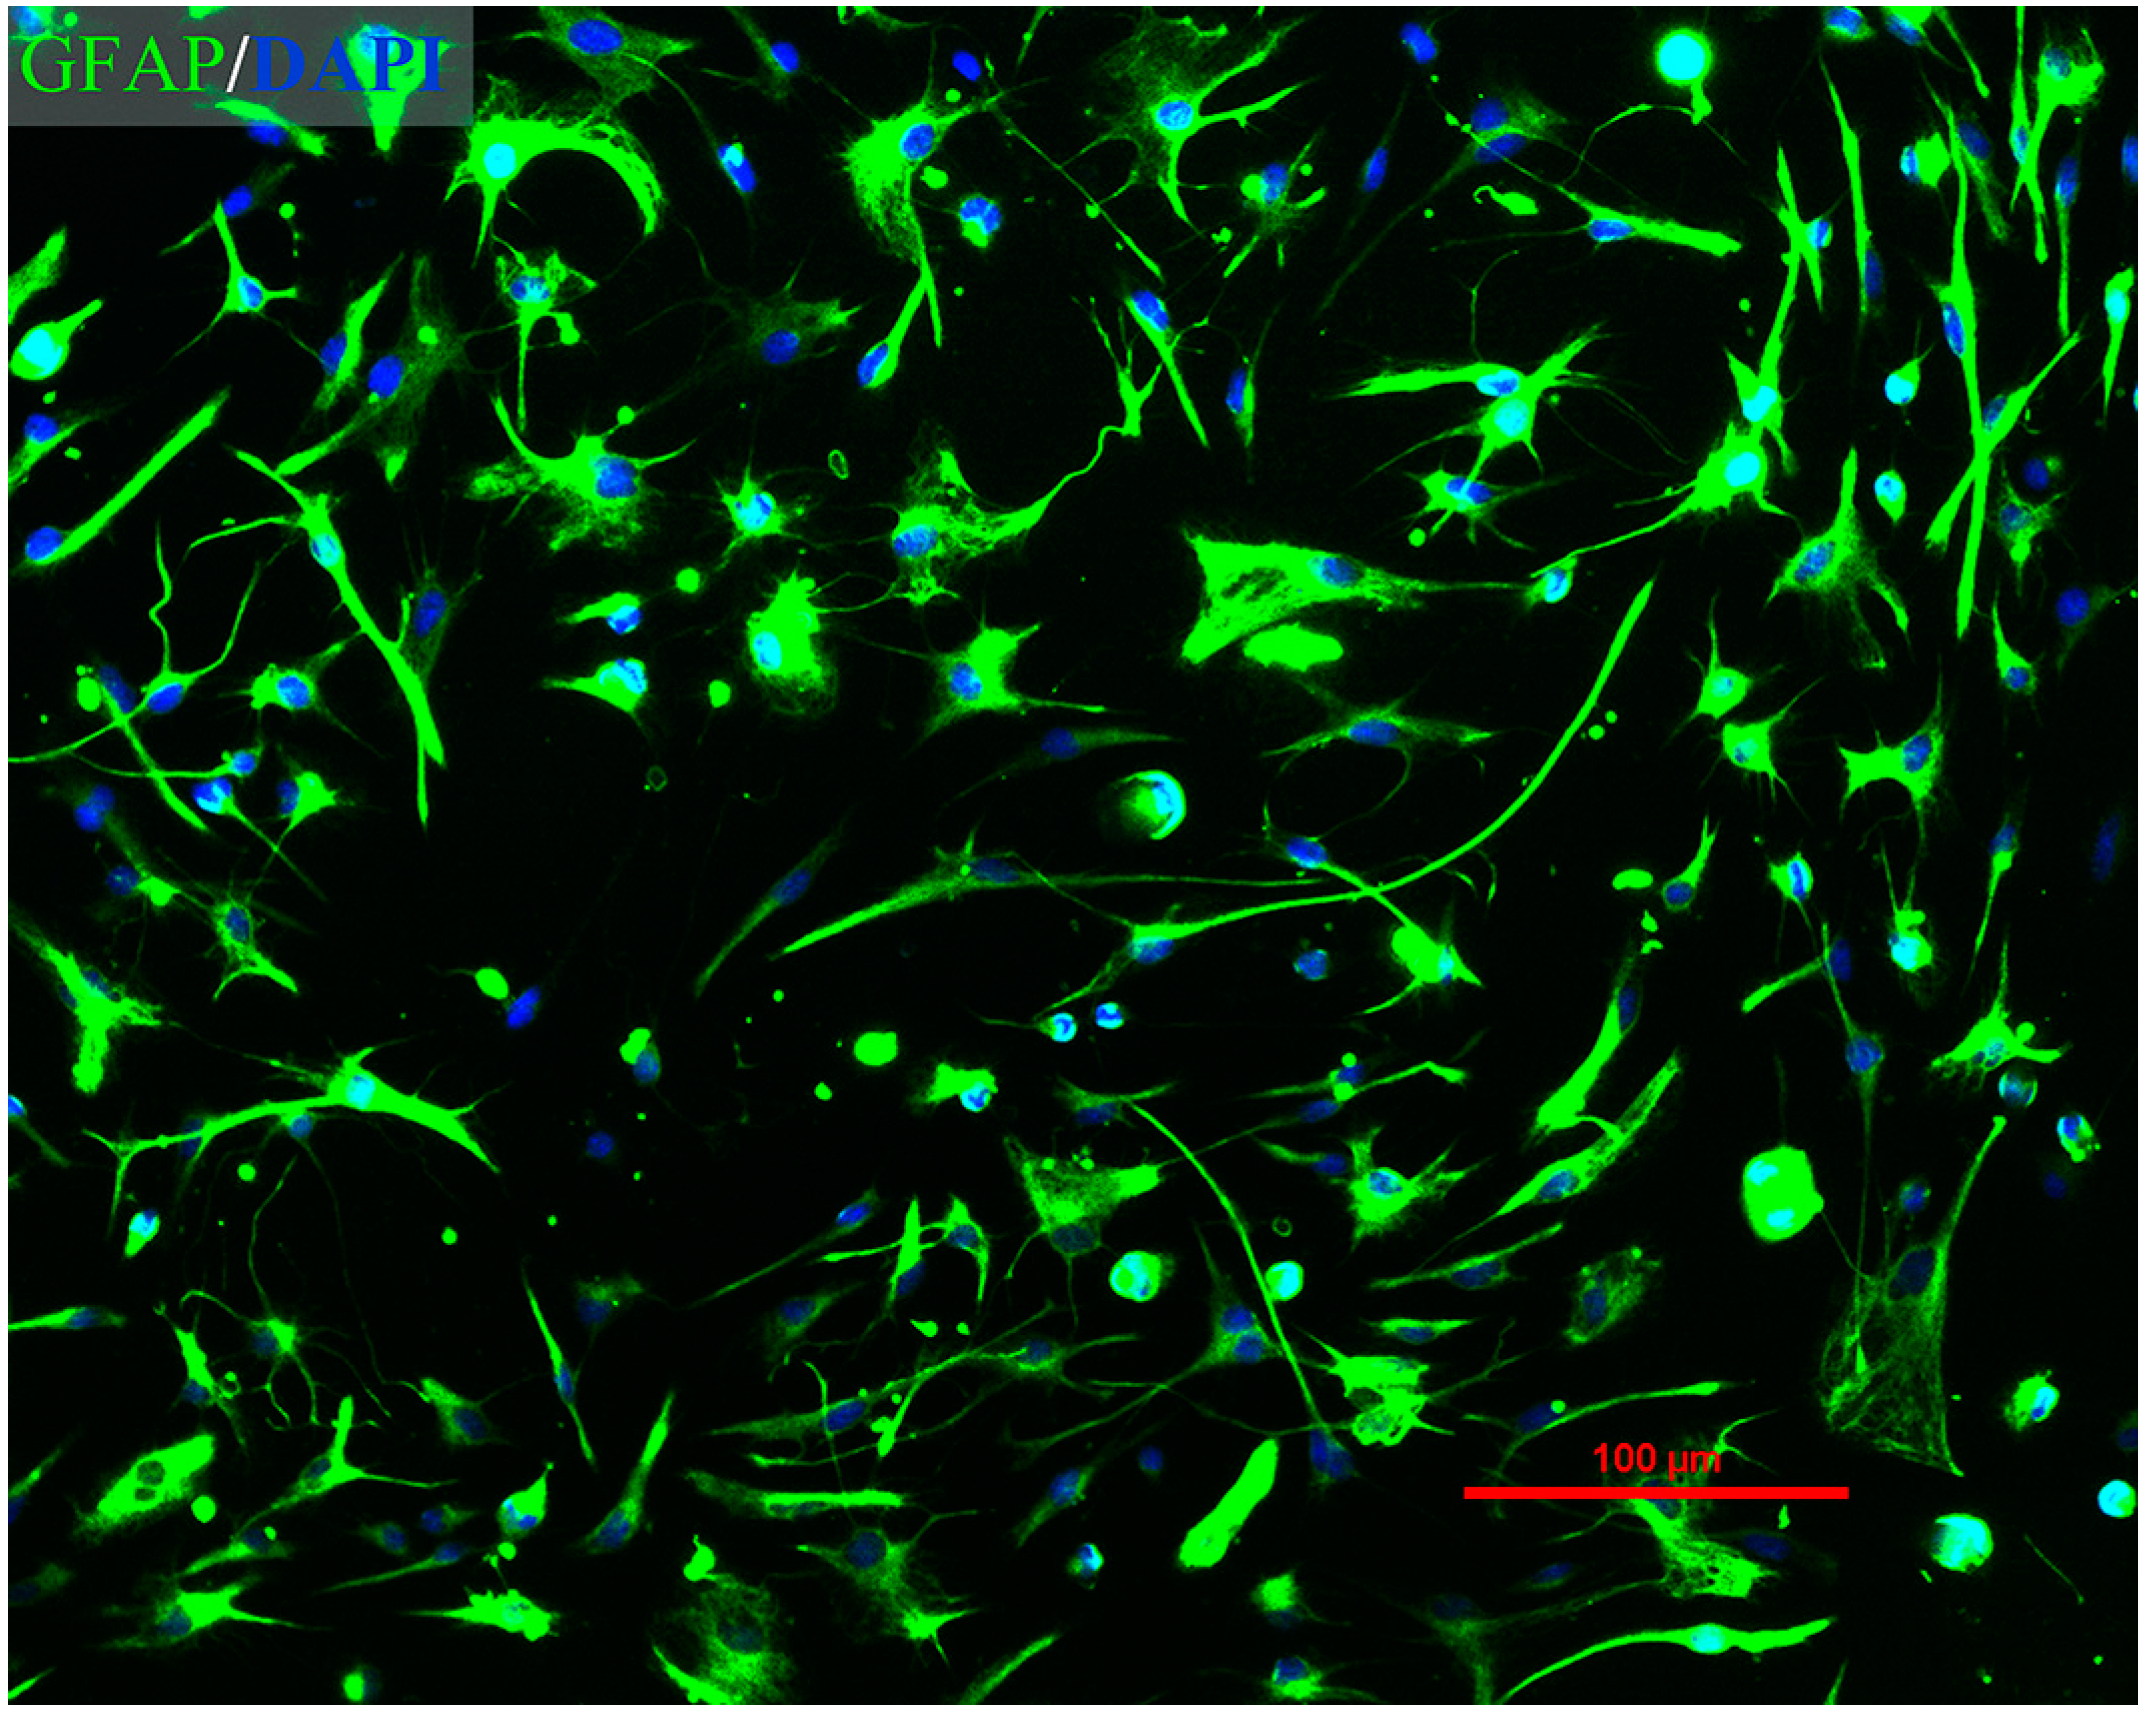
2.1. Immunofluorescence Assay

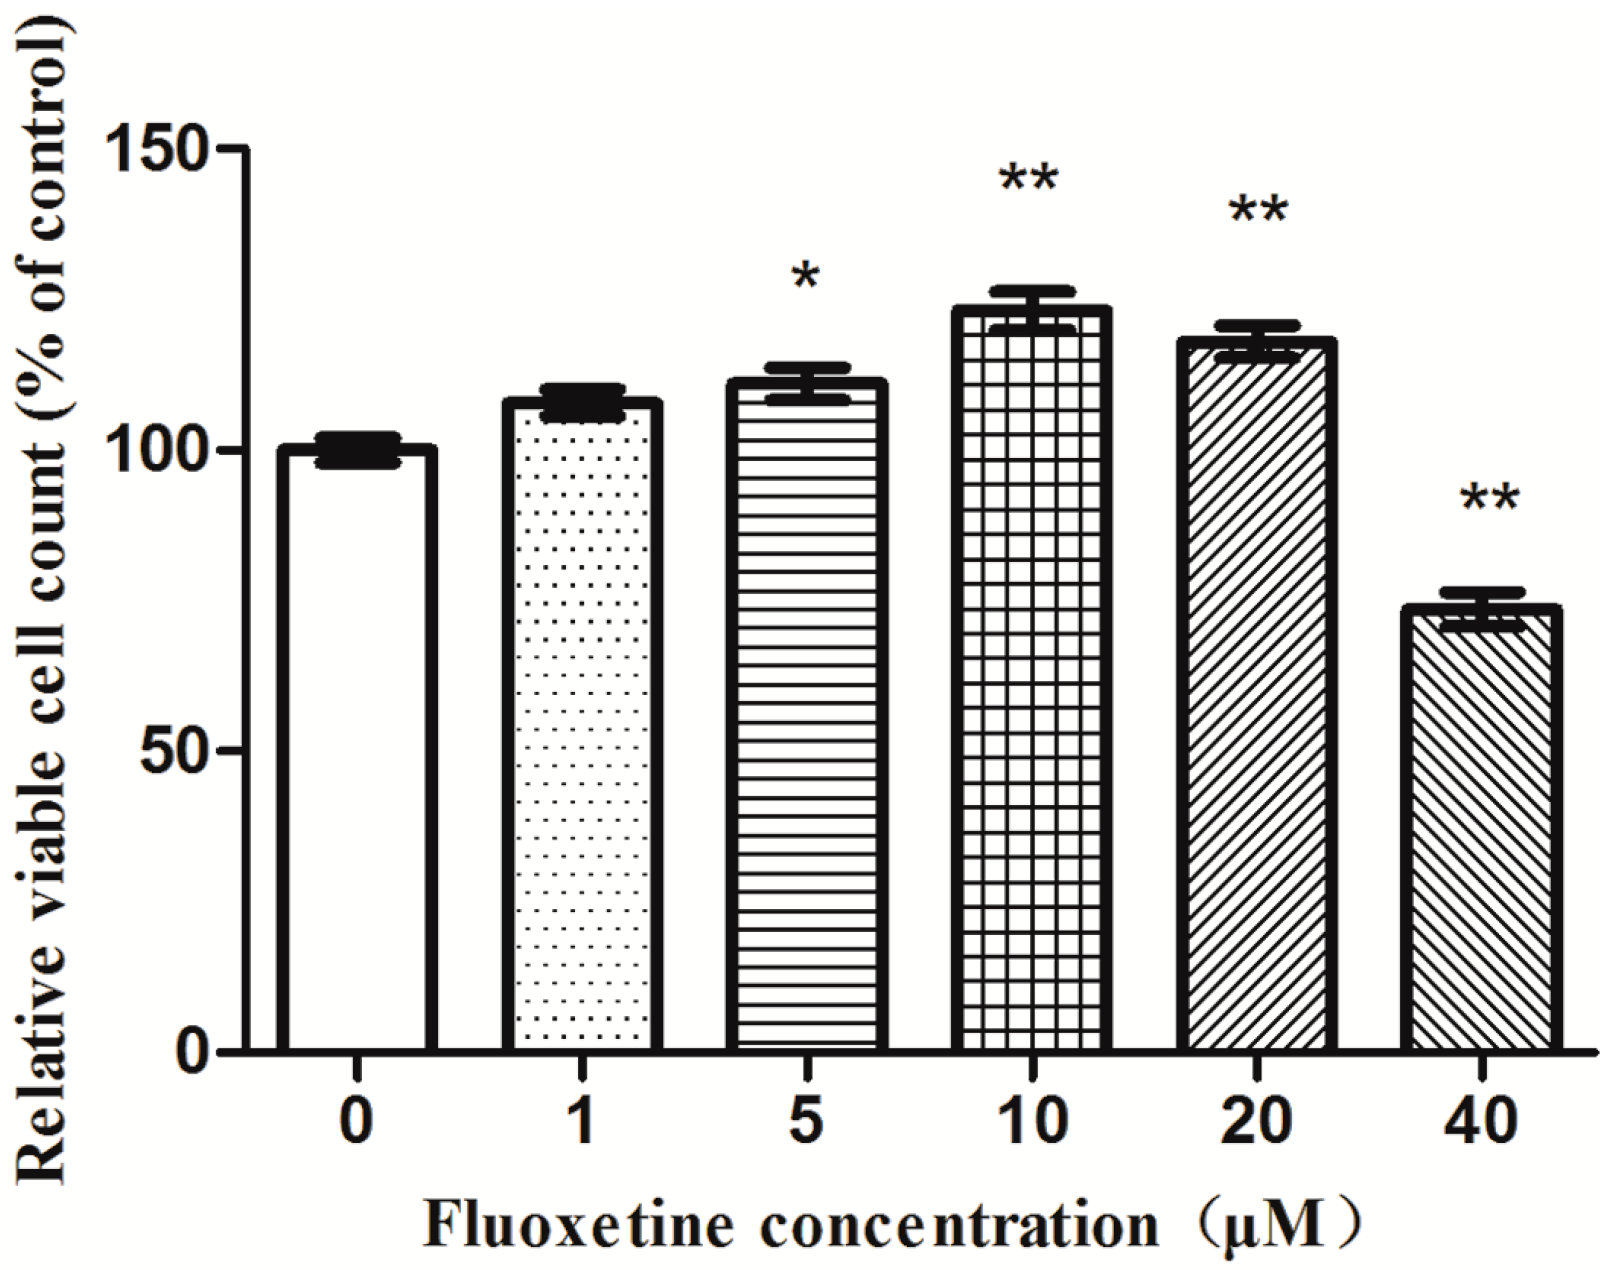
2.2. Proliferation of Astrocytes in Response to the Exposure of Fluoxetine

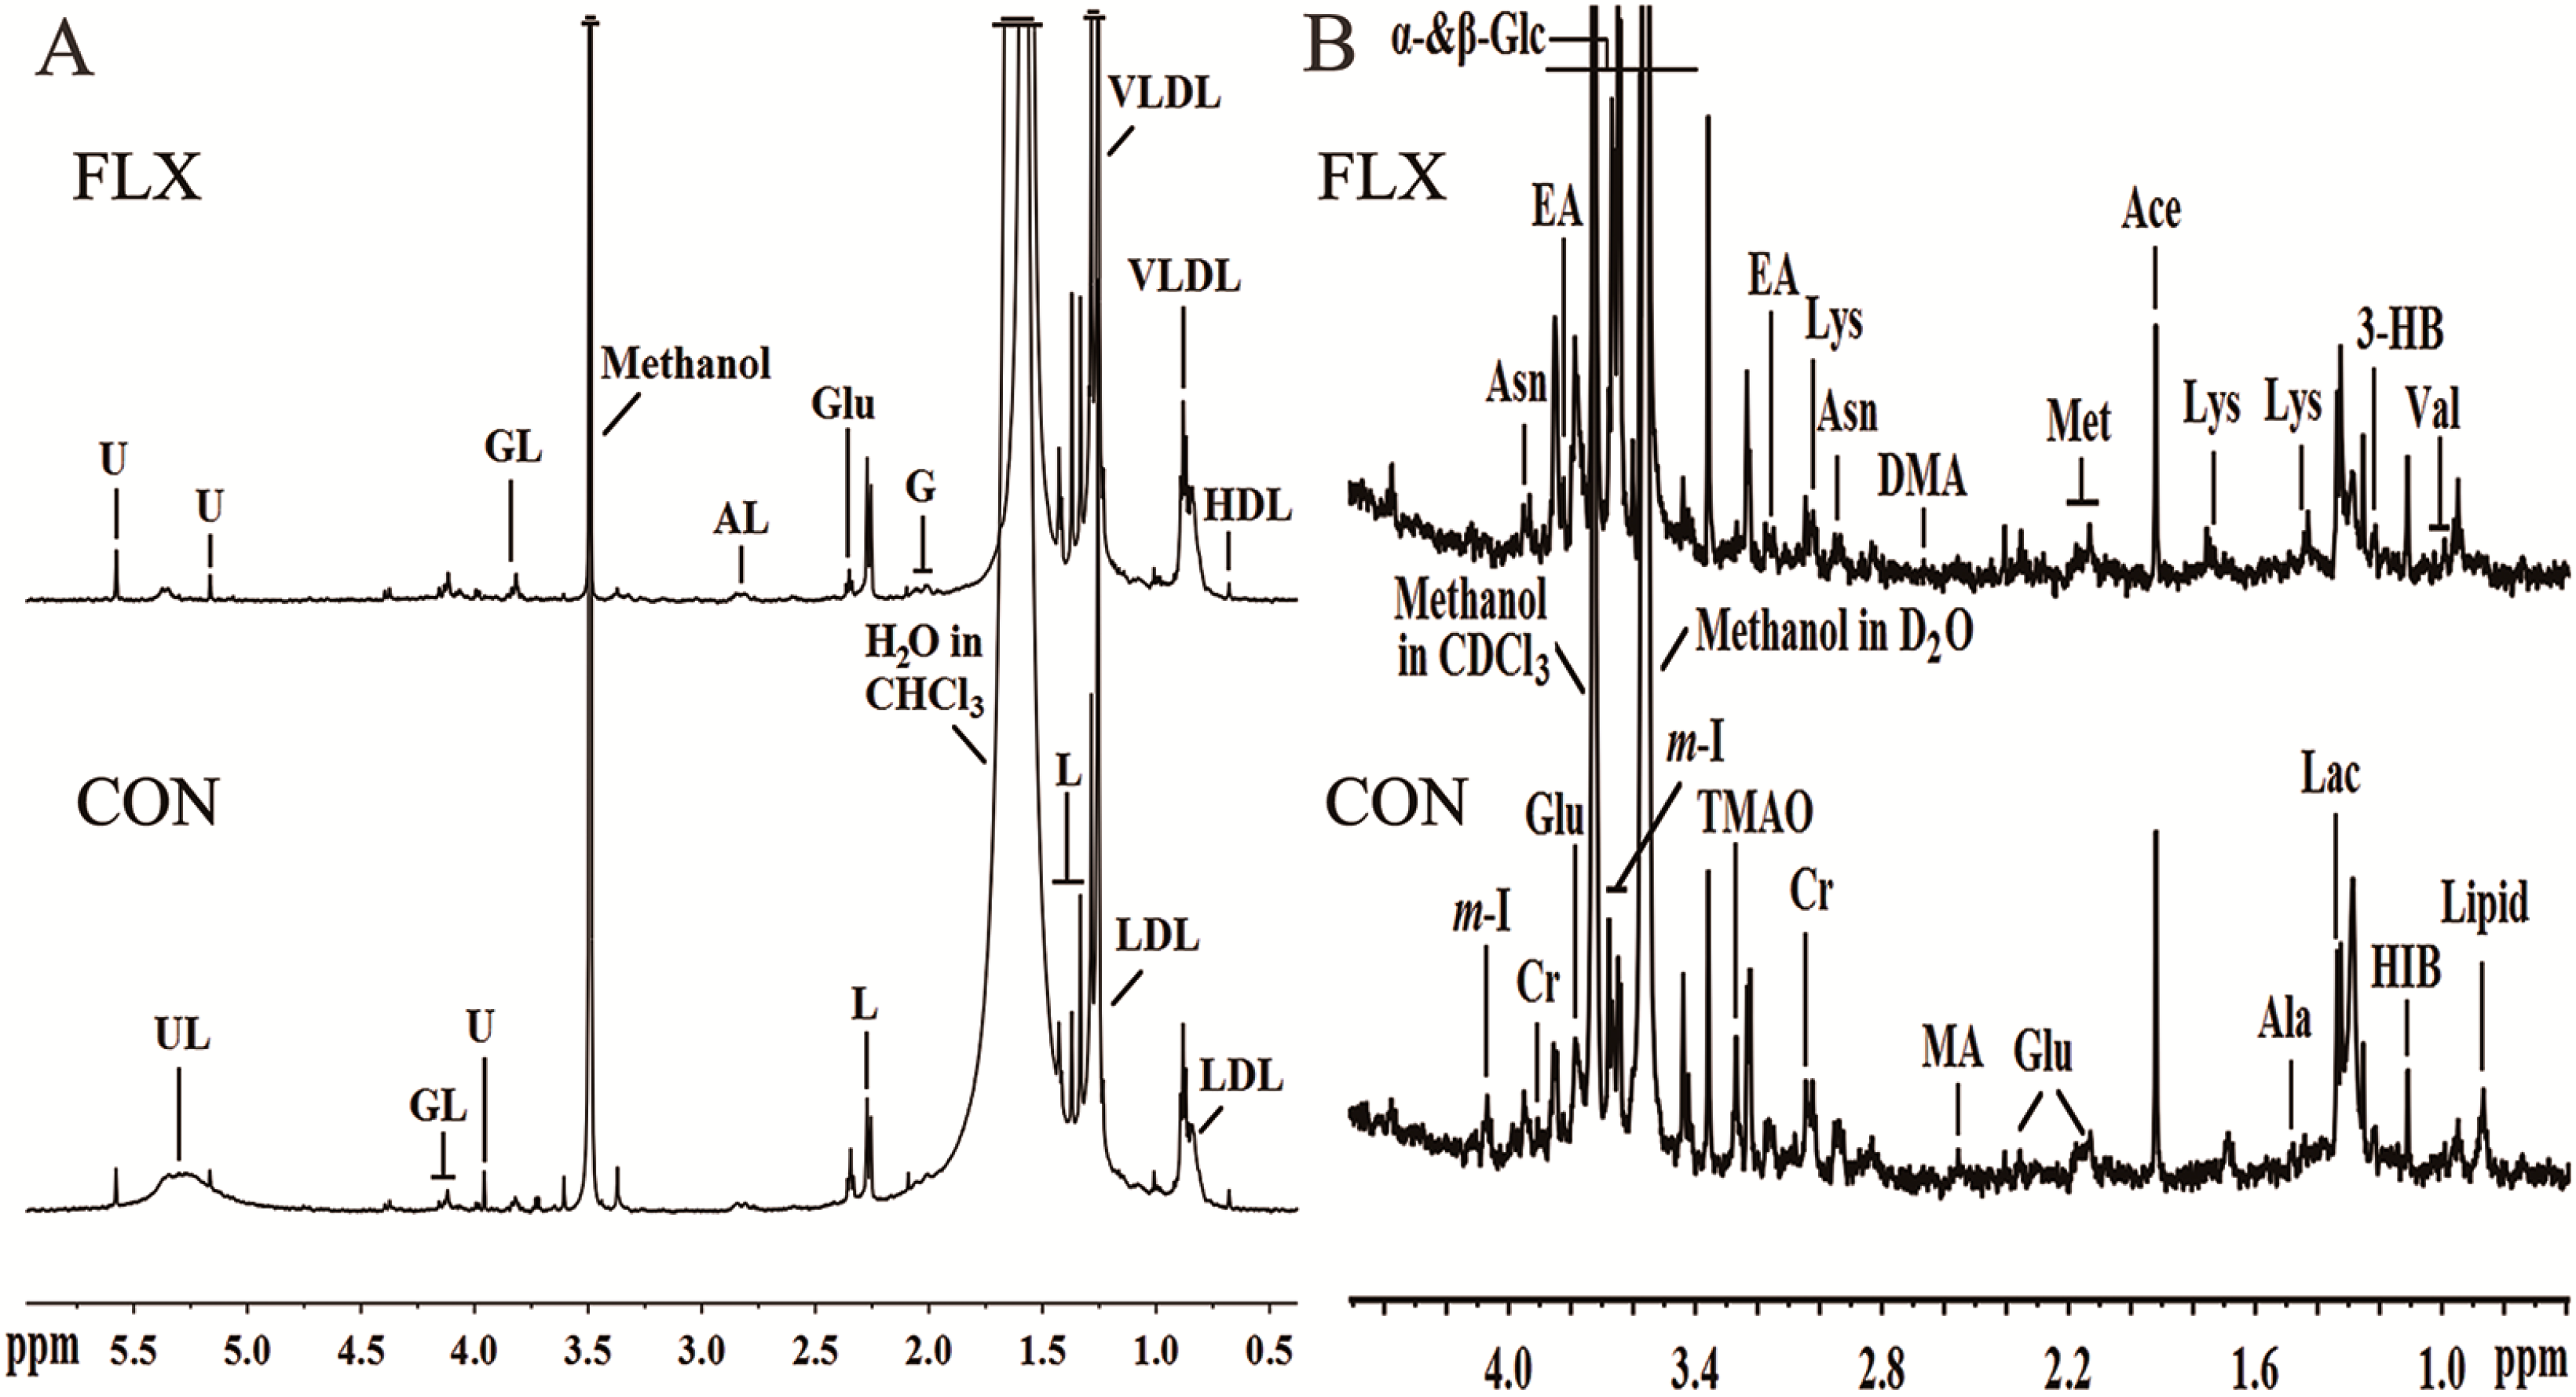
2.3. 1H NMR Spectra

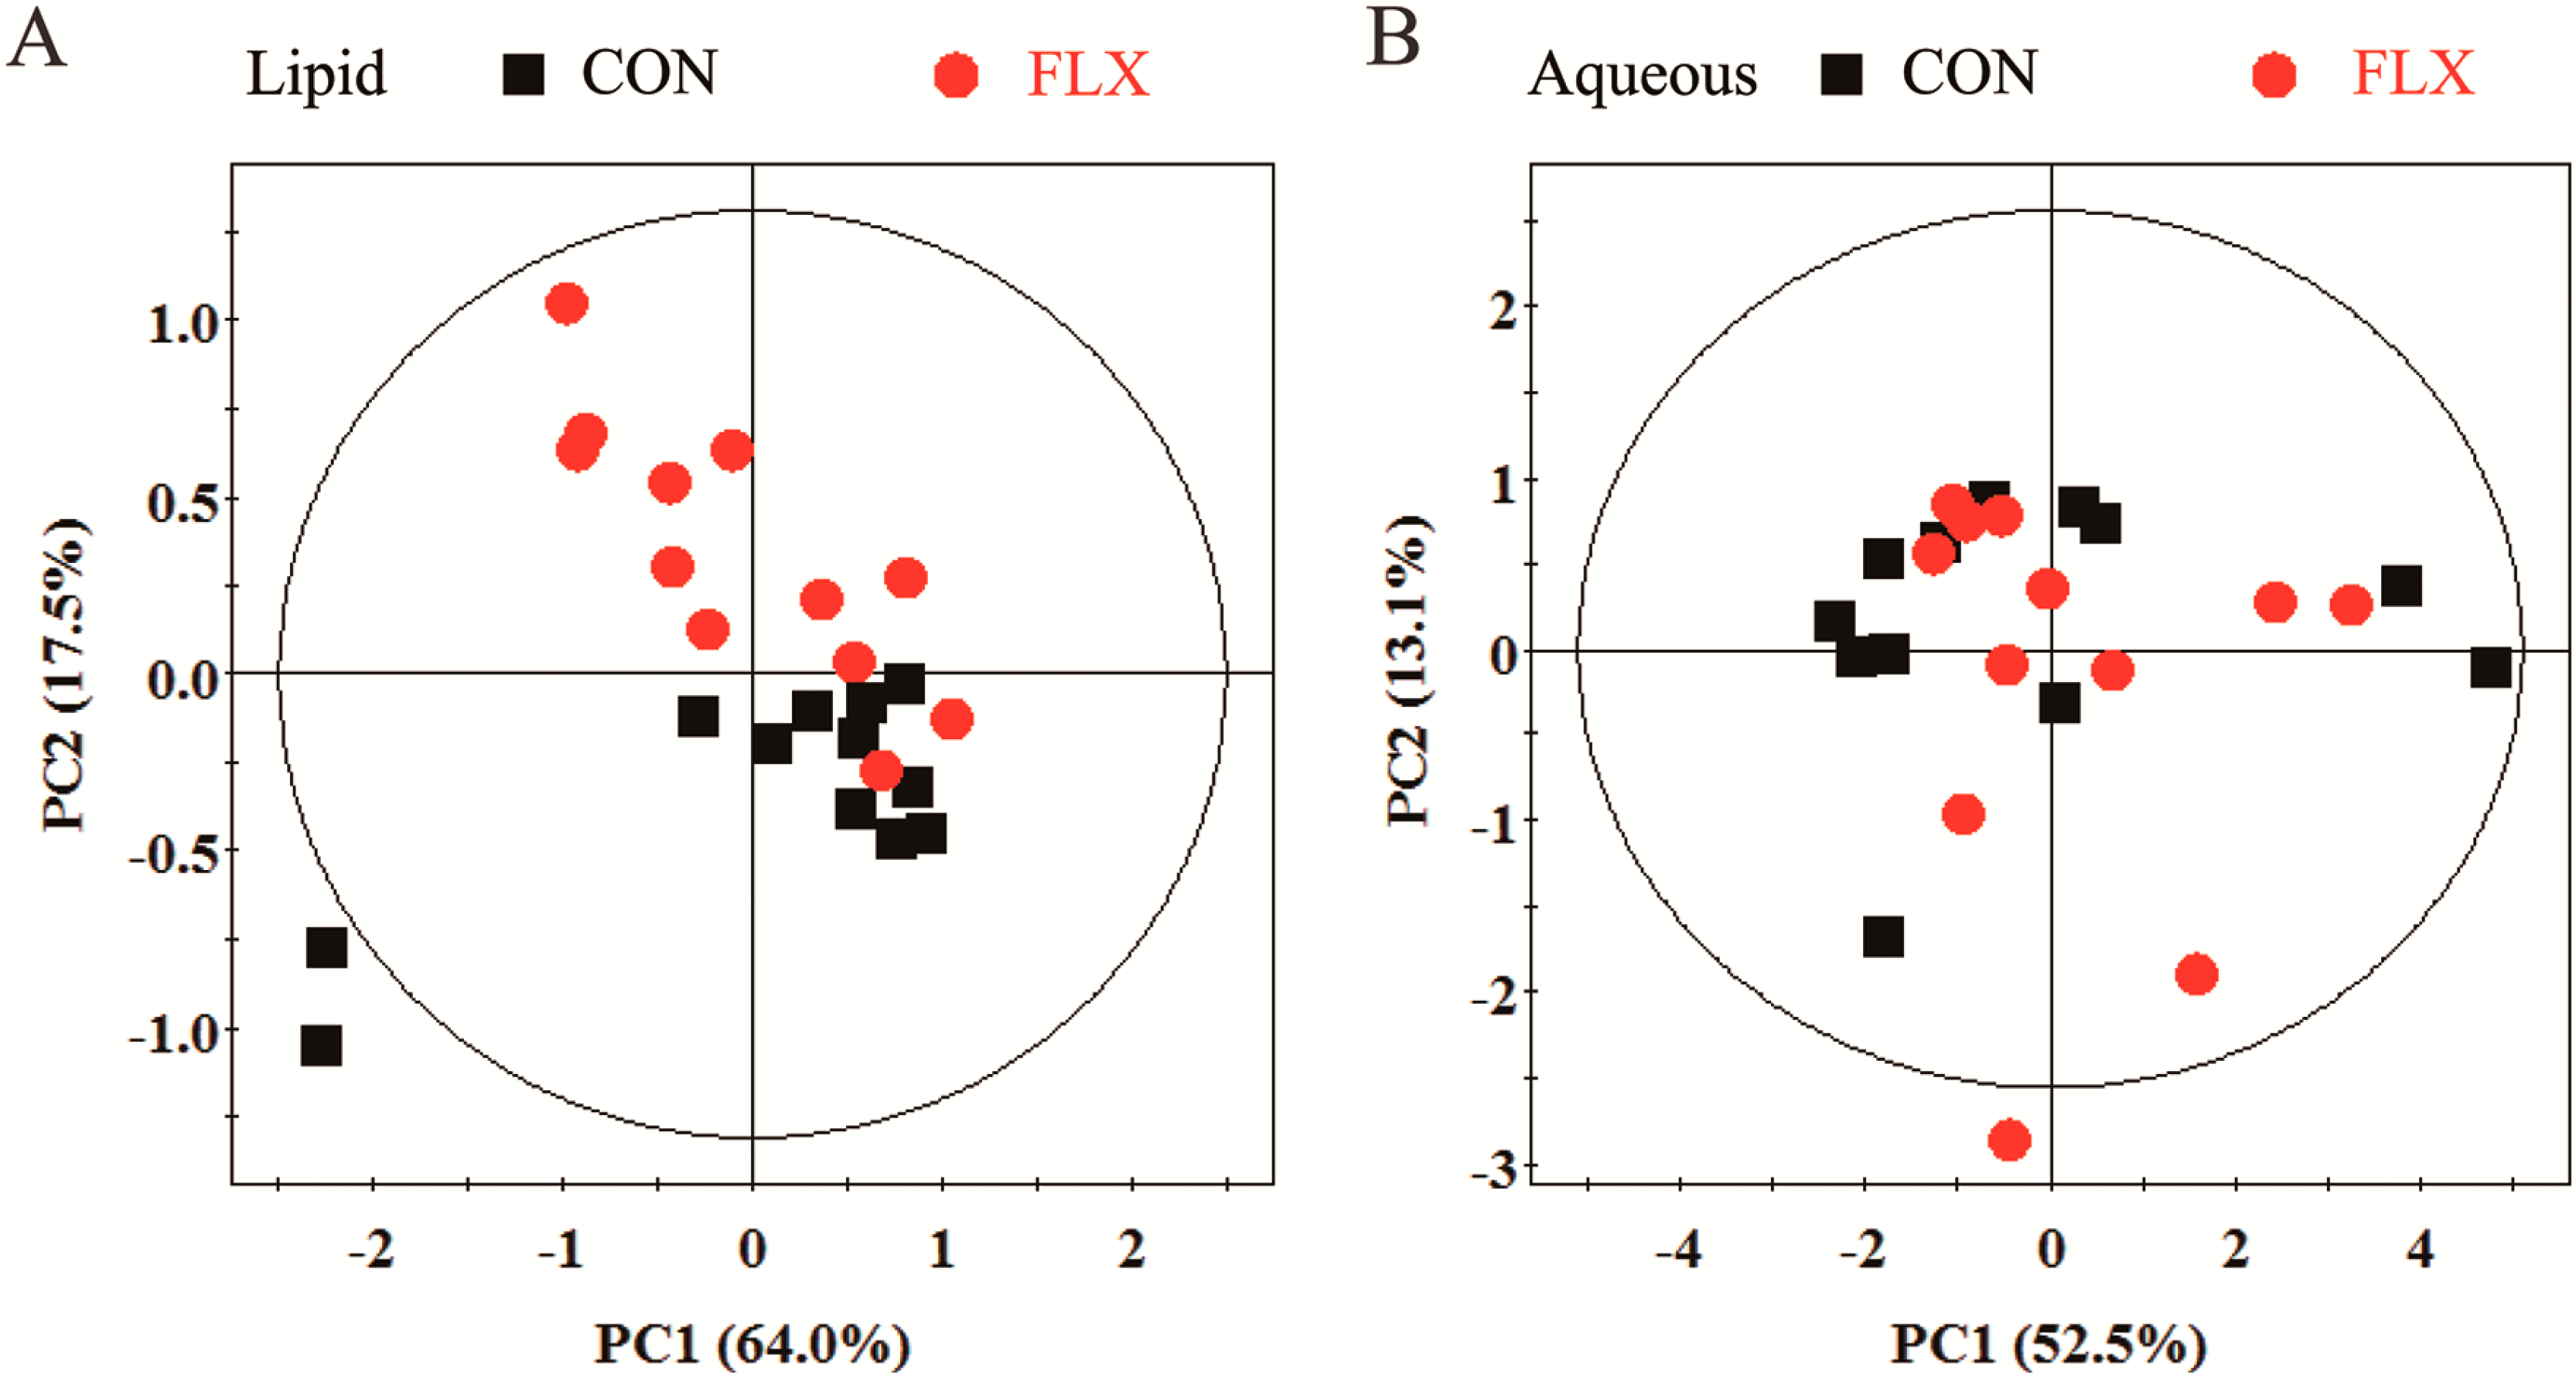
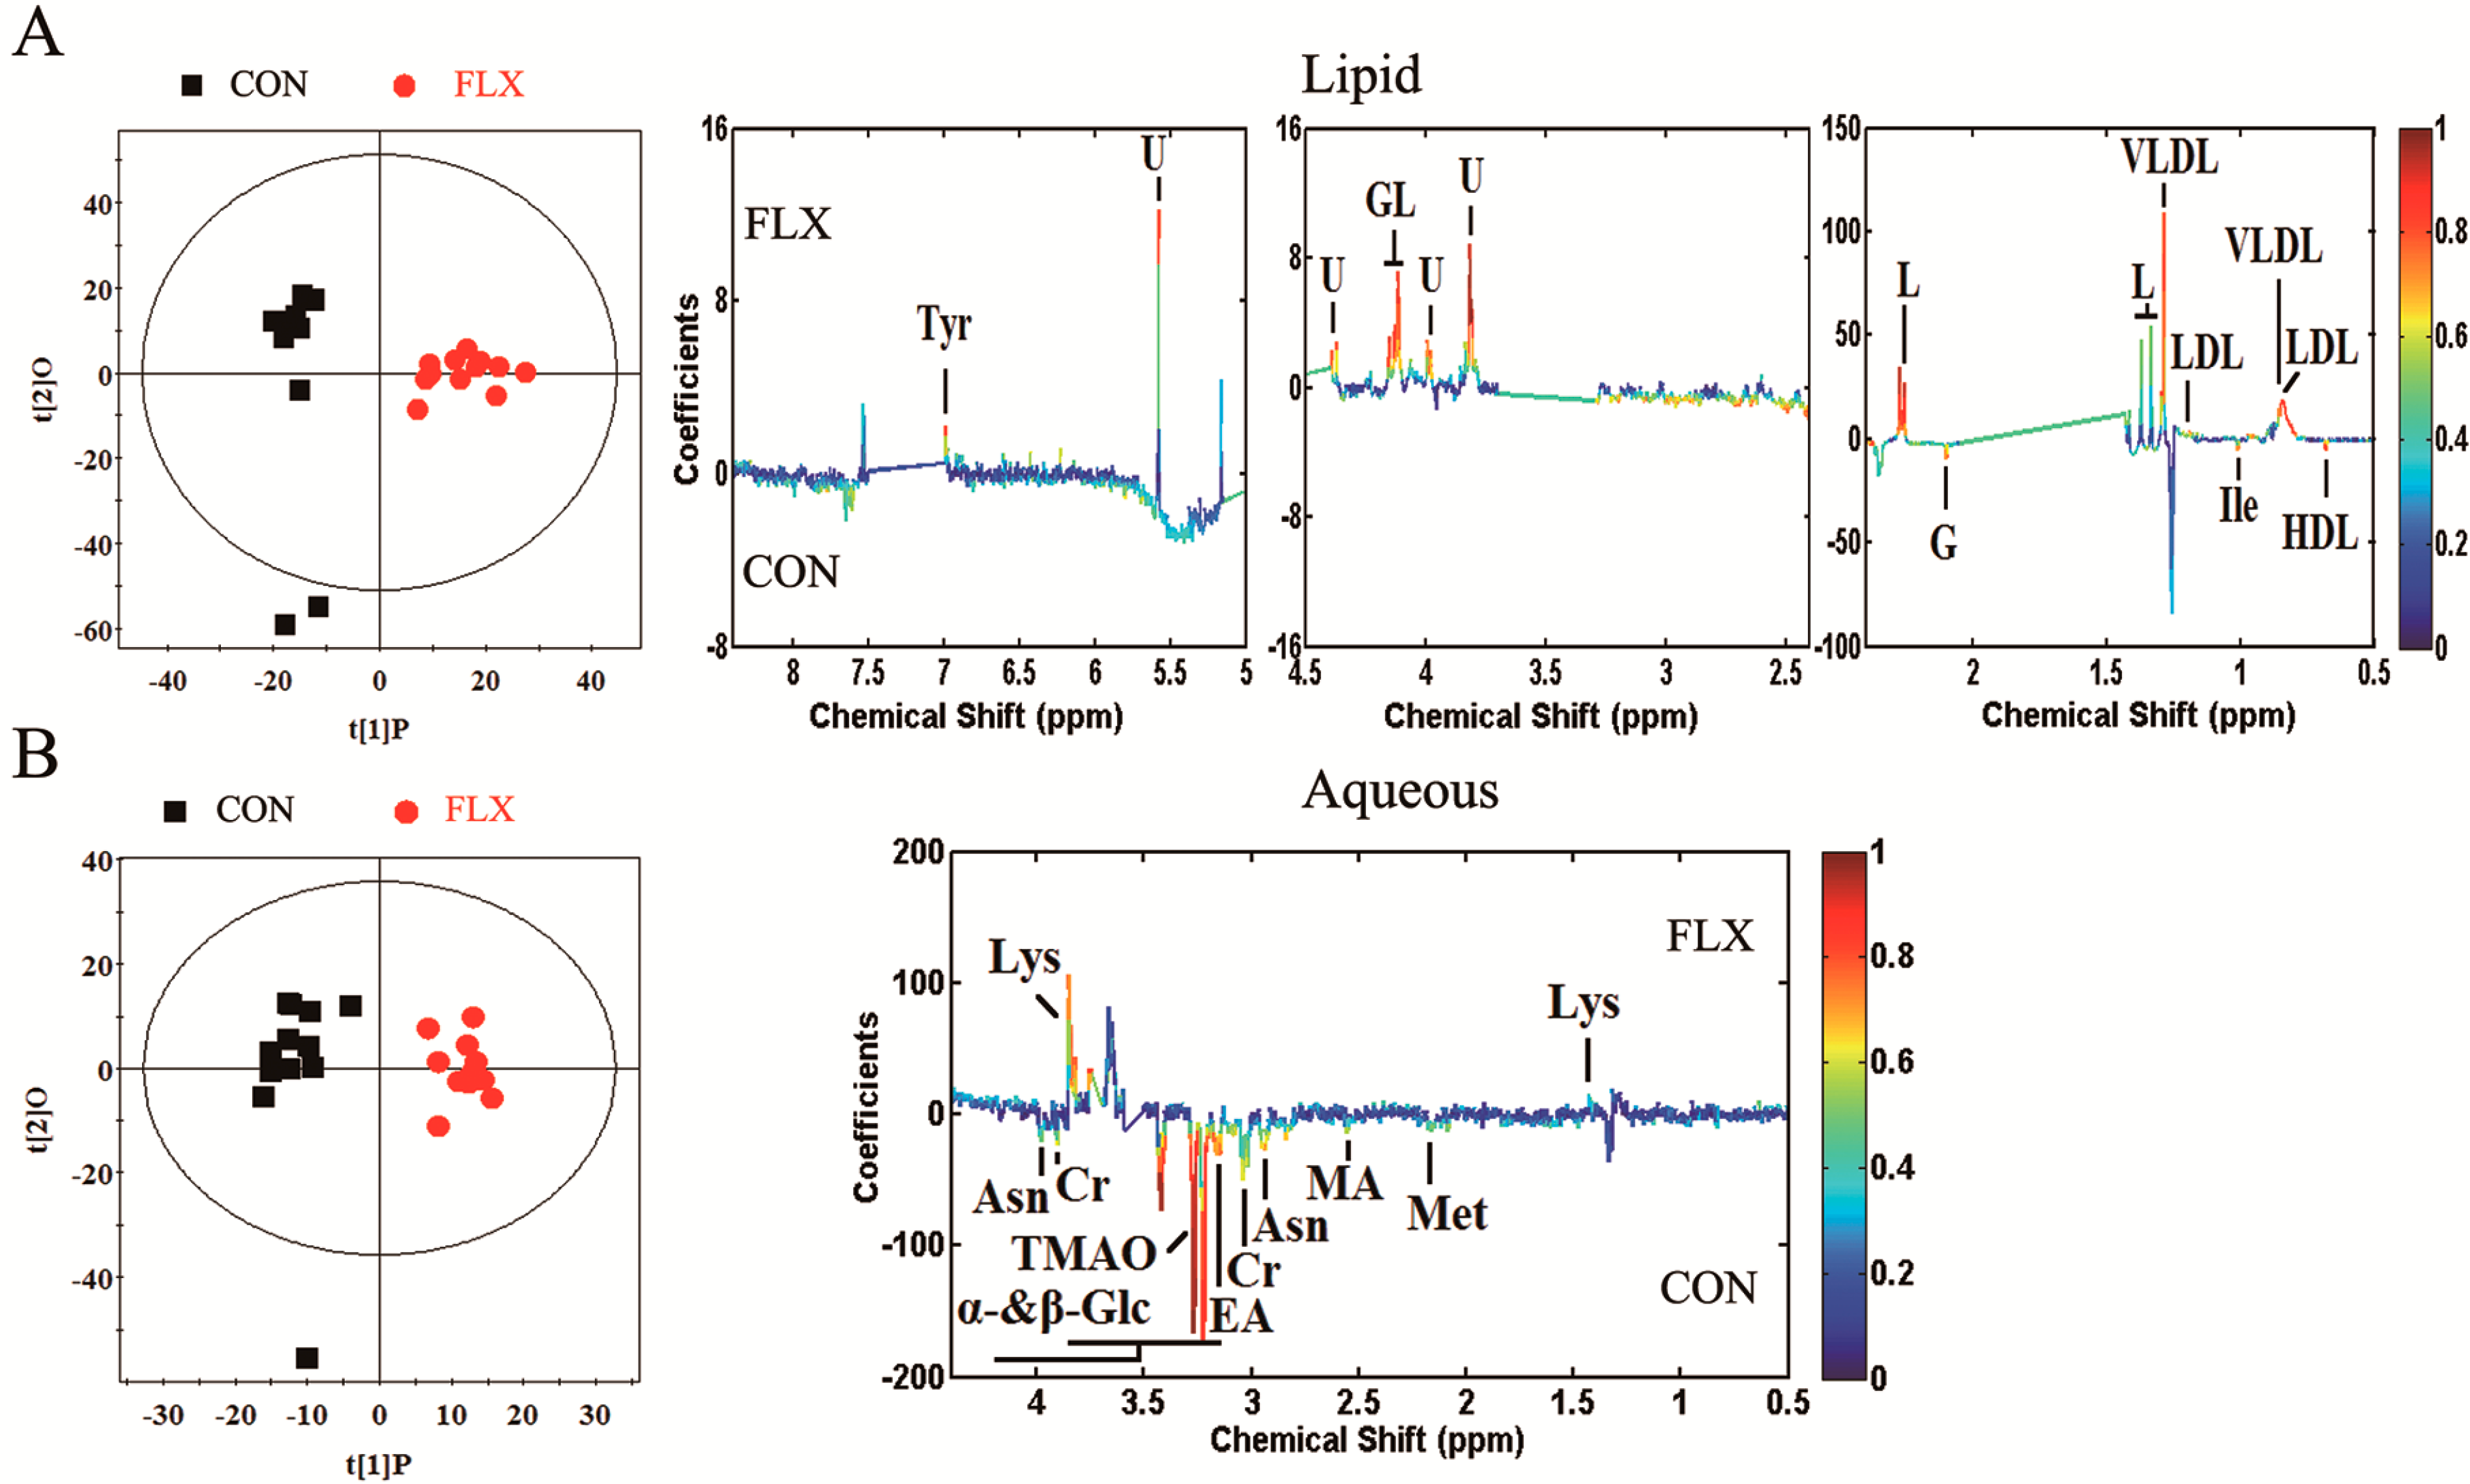
2.4. Multivariate Analysis


| Metabolite | Chemical Shift (ppm, Multiplicity) | Metabolic Pathway | r | Change Relative to Control |
|---|---|---|---|---|
| Lipid Phase | ||||
| Glyceryl of lipid | 4.08(m), 4.13(m), 5.17(s) | Lipid metabolism | 0.760 | ↑ |
| Lipid | 1.33(br), 1.37(br), 2.27(m) | Lipid metabolism | 0.807 | ↑ |
| VLDL | 0.88(t), 1.29(br) | Lipid metabolism | 0.697 | ↑ |
| LDL | 0.84(br), 1.25(br) | Lipid metabolism | 0.755 | ↑ |
| HDL | 0.68(br) | Lipid metabolism | −0.675 | ↓ |
| Glycoprotein | 2.10(s) | Amino acid metabolism | −0.793 | ↓ |
| Isoleucine | 1.01(d) | Amino acid metabolism | −0.654 | ↓ |
| Tyrosine | 6.98(d) | Amino acid metabolism, Neurotransmitter metabolism | 0.735 | ↑ |
| Aqueous Phase | ||||
| α-Glucose | 3.44(t), 3.54(dd), 3.71(t), 3.73(m), 3.85(m) | Lipid metabolism-related molecules | −0.684 | ↓ |
| β-Glucose | 3.23(dd), 3.42(t), 3.46(m), 3.49(t), 3.90(dd) | Lipid metabolism-related molecules | −0.964 | ↓ |
| Creatine | 3.04(s), 3.93(s) | Energy metabolism | −0.605 | ↓ |
| Asparagine | 2.94(m), 3.95(m) | Amino acid metabolism | −0.760 | ↓ |
| Methionine | 2.14(s), 3.18(m) | Amino acid metabolism | −0.582 | ↓ |
| Lysine | 1.44(m), 1.75(m), 3.02(m), 3.76(t) | Amino acid metabolism | 0.823 | ↑ |
| Ethanolamine | 3.16(t), 3.82(m) | Others | −0.776 | ↓ |
| Methylamine | 2.56(s) | Others, methylamine pathway | −0.583 | ↓ |
| TMAO | 3.27(s) | Others, methylamine pathway | −0.943 | ↓ |
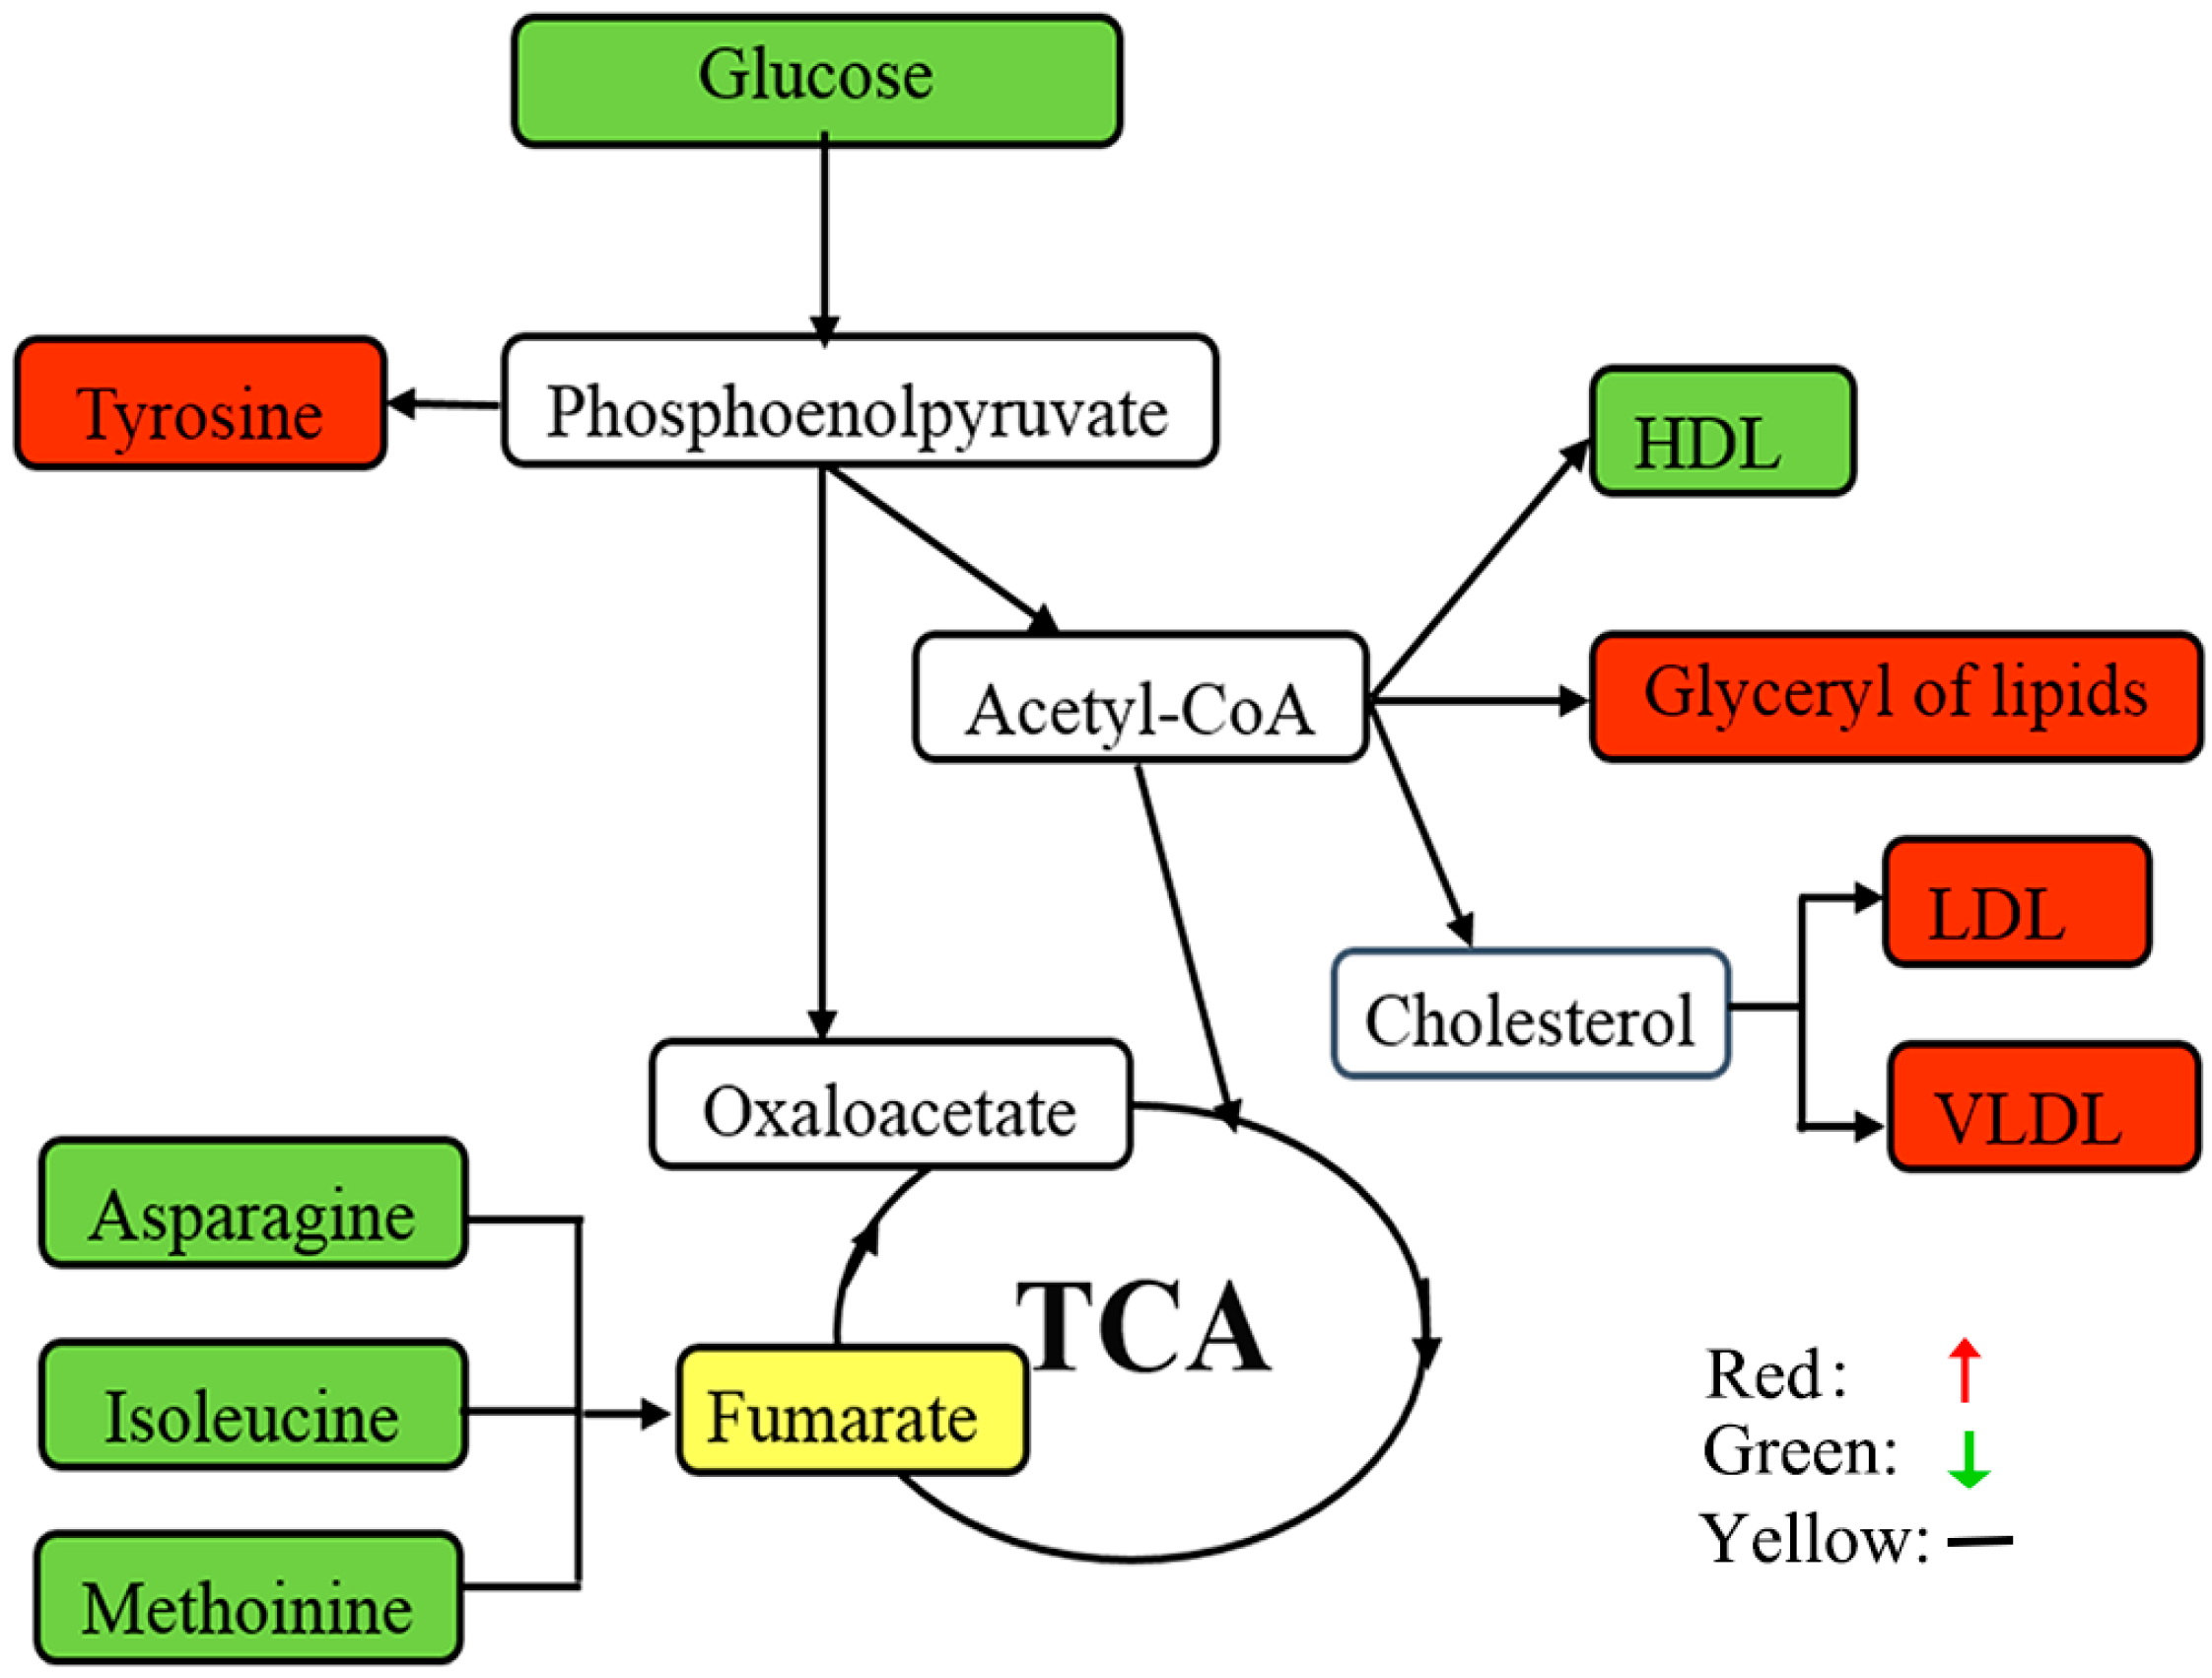
3. Discussion
3.1. Lipids and Lipid Metabolism-Related Molecules
3.2. Amino Acid Metabolism
4. Experimental Section
4.1. Materials
4.2. Primary Culture of Cortical Astrocyte
4.3. Immunofluorescence
4.4. Stimulation and Proliferation Assays
4.5. 1H NMR Sample Preparation
4.6. 1H NMR Spectroscopy
4.7. Multivariate Data Analysis
4.8. Statistical Analysis
5. Conclusions
Acknowledgments
Author Contributions
Conflicts of Interest
References
- Kessler, R.C.; Berglund, P.; Demler, O.; Jin, R.; Koretz, D.; Merikangas, K.R.; Rush, A.J.; Walters, E.E.; Wang, P.S. The epidemiology of major depressive disorder: Results from the National Comorbidity Survey Replication (NCS-R). JAMA 2003, 289, 3095–3105. [Google Scholar] [PubMed]
- Zheng, P.; Gao, H.-C.; Qi, Z.-G.; Jia, J.-M.; Li, F.F.; Chen, J.J.; Wang, Y.; Guo, J.; Melgiri, N.D.; Xie, P. Peripheral metabolic abnormalities of lipids and amino acids implicated in increased risk of suicidal behavior in major depressive disorder. Metabolomics 2012, 9, 688–696. [Google Scholar] [CrossRef]
- Allaman, I.; Fiumelli, H.; Magistretti, P.J.; Martin, J.L. Fluoxetine regulates the expression of neurotrophic/growth factors and glucose metabolism in astrocytes. Psychopharmacology 2011, 216, 75–84. [Google Scholar] [CrossRef] [PubMed]
- Severus, E.; Schaaff, N.; Moller, H.J. State of the art: Treatment of bipolar disorders. CNS Neurosci. Ther. 2012, 18, 214–218. [Google Scholar] [CrossRef] [PubMed]
- Wong, D.T.; Perry, K.W.; Bymaster, F.P. Case history: The discovery of fluoxetine hydrochloride (Prozac). Nat. Rev. Drug Discov. 2005, 4, 764–774. [Google Scholar] [PubMed]
- Hayashi, H.; Campenot, R.B.; Vance, D.E.; Vance, J.E. Glial lipoproteins stimulate axon growth of central nervous system neurons in compartmented cultures. J. Biol. Chem. 2004, 279, 14009–14015. [Google Scholar] [CrossRef] [PubMed]
- Perea, G.; Navarrete, M.; Araque, A. Tripartite synapses: Astrocytes process and control synaptic information. Trends Neurosci. 2009, 32, 421–431. [Google Scholar] [CrossRef] [PubMed]
- Si, X.; Miguel-Hidalgo, J.J.; O’Dwyer, G.; Stockmeier, C.A.; Rajkowska, G. Age-dependent reductions in the level of glial fibrillary acidic protein in the prefrontal cortex in major depression. Neuropsychopharmacology 2004, 29, 2088–2096. [Google Scholar] [CrossRef] [PubMed]
- Czéh, B.; Simon, M.; Schmelting, B.; Hiemke, C.; Fuchs, E. Astroglial plasticity in the hippocampus is affected by chronic psychosocial stress and concomitant fluoxetine treatment. Neuropsychopharmacology 2005, 31, 1616–1626. [Google Scholar] [CrossRef] [PubMed]
- Zheng, P.; Gao, H.C.; Li, Q.; Shao, W.H.; Zhang, M.L.; Cheng, K.; Yang de, Y.; Fan, S.H.; Chen, L.; Fang, L.; et al. Plasma metabonomics as a novel diagnostic approach for major depressive disorder. J. Proteome Res. 2012, 11, 1741–1748. [Google Scholar]
- Shao, W.-H.; Fan, S.-H.; Lei, Y.; Yao, G.-E.; Chen, J.-J.; Zhou, J.; Xu, H.-B.; Liu, H.-P.; Wu, B.; Zheng, P. Metabolomic identification of molecular changes associated with stress resilience in the chronic mild stress rat model of depression. Metabolomics 2013, 9, 433–443. [Google Scholar] [CrossRef]
- Gao, X.; Zheng, X.; Li, Z.; Zhou, Y.; Sun, H.; Zhang, L.; Guo, X.; Du, G.; Qin, X. Metabonomic study on chronic unpredictable mild stress and intervention effects of Xiaoyaosan in rats using gas chromatography coupled with mass spectrometry. J. Ethnopharmacol. 2011, 137, 690–699. [Google Scholar] [CrossRef] [PubMed]
- Smriga, M.; Kameishi, M.; Uneyama, H.; Torii, K. Dietary l-lysine deficiency increases stress-induced anxiety and fecal excretion in rats. J. Nutr. 2002, 132, 3744–3746. [Google Scholar] [PubMed]
- Smriga, M.; Ghosh, S.; Mouneimne, Y.; Pellett, P.L.; Scrimshaw, N.S. Lysine fortification reduces anxiety and lessens stress in family members in economically weak communities in Northwest Syria. Proc. Natl. Acad. Sci. USA 2004, 101, 8285–8288. [Google Scholar] [CrossRef] [PubMed]
- Kaddurah-Daouk, R.; Krishnan, K.R. Metabolomics: A global biochemical approach to the study of central nervous system diseases. Neuropsychopharmacology 2009, 34, 173–186. [Google Scholar] [CrossRef] [PubMed]
- Webhofer, C.; Gormanns, P.; Reckow, S.; Lebar, M.; Maccarrone, G.; Ludwig, T.; Putz, B.; Asara, J.M.; Holsboer, F.; Sillaber, I.; et al. Proteomic and metabolomic profiling reveals time-dependent changes in hippocampal metabolism upon paroxetine treatment and biomarker candidates. J. Psychiatr. Res. 2013, 47, 289–298. [Google Scholar]
- Dai, Y.; Li, Z.; Xue, L.; Dou, C.; Zhou, Y.; Zhang, L.; Qin, X. Metabolomics study on the anti-depression effect of xiaoyaosan on rat model of chronic unpredictable mild stress. J. Ethnopharmacol. 2010, 128, 482–489. [Google Scholar] [CrossRef] [PubMed]
- Webhofer, C.; Gormanns, P.; Tolstikov, V.; Zieglgansberger, W.; Sillaber, I.; Holsboer, F.; Turck, C.W. Metabolite profiling of antidepressant drug action reveals novel drug targets beyond monoamine elevation. Transl. Psychiatry 2011, 1, e58. [Google Scholar] [CrossRef] [PubMed]
- Birungi, G.; Chen, S.M.; Loy, B.P.; Ng, M.L.; Li, S.F. Metabolomics approach for investigation of effects of dengue virus infection using the EA.hy926 cell line. J. Proteome Res. 2010, 9, 6523–6534. [Google Scholar] [CrossRef]
- Maya Vetencourt, J.F.; Sale, A.; Viegi, A.; Baroncelli, L.; de Pasquale, R.; O’Leary, O.F.; Castren, E.; Maffei, L. The antidepressant fluoxetine restores plasticity in the adult visual cortex. Science 2008, 320, 385–388. [Google Scholar]
- Raeder, M.B.; Ferno, J.; Glambek, M.; Stansberg, C.; Steen, V.M. Antidepressant drugs activate SREBP and up-regulate cholesterol and fatty acid biosynthesis in human glial cells. Neurosci. Lett. 2006, 395, 185–190. [Google Scholar] [CrossRef] [PubMed]
- Feng, X.M.; Xiong, J.; Qin, H.; Liu, W.; Chen, R.N.; Shang, W.; Ning, R.; Hu, G.; Yang, J. Fluoxetine induces hepatic lipid accumulation via both promotion of the SREBP1c-related lipogenesis and reduction of lipolysis in primary mouse hepatocytes. CNS Neurosci. Ther. 2012, 18, 974–980. [Google Scholar] [CrossRef]
- Zhou, A.; Ni, J.; Xu, Z.; Wang, Y.; Lu, S.; Sha, W.; Karakousis, P.C.; Yao, Y.F. Application of 1H NMR spectroscopy-based metabolomics to sera of tuberculosis patients. J. Proteome Res. 2013, 12, 4642–4649. [Google Scholar] [CrossRef] [PubMed]
- Jow, G.M.; Yang, T.T.; Chen, C.L. Leptin and cholesterol levels are low in major depressive disorder, but high in schizophrenia. J. Affect. Disord. 2006, 90, 21–27. [Google Scholar] [CrossRef] [PubMed]
- Terao, T.; Iwata, N.; Kanazawa, K.; Takano, T.; Takahashi, N.; Hayashi, T.; Sugawara, Y. Low serum cholesterol levels and depressive state in human dock visitors. Acta Psychiatr. Scand. 2000, 101, 231–234. [Google Scholar] [CrossRef] [PubMed]
- Mauch, D.H.; Nagler, K.; Schumacher, S.; Goritz, C.; Muller, E.C.; Otto, A.; Pfrieger, F.W. CNS synaptogenesis promoted by glia-derived cholesterol. Science 2001, 294, 1354–1357. [Google Scholar] [CrossRef] [PubMed]
- Pfrieger, F.W. Outsourcing in the brain: Do neurons depend on cholesterol delivery by astrocytes? BioEssays News Rev. Mol. Cell. Dev. Biol. 2003, 25, 72–78. [Google Scholar] [CrossRef]
- Saher, G.; Brügger, B.; Lappe-Siefke, C.; Möbius, W.; Tozawa, R.-I.; Wehr, M.C.; Wieland, F.; Ishibashi, S.; Nave, K.-A. High cholesterol level is essential for myelin membrane growth. Nat. Neurosci. 2005, 8, 468–475. [Google Scholar] [PubMed]
- Saher, G.; Quintes, S.; Nave, K.-A. Cholesterol: A novel regulatory role in myelin formation. Neuroscientist 2011, 17, 79–93. [Google Scholar] [CrossRef] [PubMed]
- Pfrieger, F. Role of cholesterol in synapse formation and function. Biochim. Biophys. Acta Biomembr. 2003, 1610, 271–280. [Google Scholar] [CrossRef]
- Mastronardi, C.; Paz-Filho, G.J.; Valdez, E.; Maestre-Mesa, J.; Licinio, J.; Wong, M.L. Long-term body weight outcomes of antidepressant-environment interactions. Mol. Psychiatry 2011, 16, 265–272. [Google Scholar] [CrossRef] [PubMed]
- Mallette, L.; Exton, J.; Park, C. Control of gluconeogenesis from amino acids in the perfused rat liver. J. Biol. Chem. 1969, 244, 5713–5723. [Google Scholar] [PubMed]
- Lei, Y.; Li, D.; Deng, J.; Shao, W.-H.; Fan, S.-H.; Wang, X.; Huang, H.; Chen, S.-G.; Zhang, H.-Z.; Zhang, L. Metabolomic profiling of three brain regions from a postnatal infected Borna disease virus Hu-H1 rat model. Metabolomics 2014, 10, 484–495. [Google Scholar] [CrossRef]
- Smriga, M.; Torii, K. l-Lysine acts like a partial serotonin receptor 4 antagonist and inhibits serotonin-mediated intestinal pathologies and anxiety in rats. Proc. Natl. Acad. Sci. USA 2003, 100, 15370–15375. [Google Scholar] [CrossRef] [PubMed]
- McLean, A.; Rubinsztein, J.S.; Robbins, T.W.; Sahakian, B.J. The effects of tyrosine depletion in normal healthy volunteers: Implications for unipolar depression. Psychopharmacology 2004, 171, 286–297. [Google Scholar] [CrossRef] [PubMed]
- Fan, T.W.; Yuan, P.; Lane, A.N.; Higashi, R.M.; Wang, Y.; Hamidi, A.B.; Zhou, R.; Guitart, X.; Chen, G.; Manji, H.K.; et al. Stable isotope-resolved metabolomic analysis of lithium effects on glial-neuronal metabolism and interactions. Metabolomics 2010, 6, 165–179. [Google Scholar]
- Melo, T.M.; Nehlig, A.; Sonnewald, U. Metabolism is normal in astrocytes in chronically epileptic rats: A 13C NMR study of neuronal-glial interactions in a model of temporal lobe epilepsy. J. Cereb. Blood Flow Metab. 2005, 25, 1254–1264. [Google Scholar] [CrossRef] [PubMed]
- Hadera, M.G.; Faure, J.B.; Berggaard, N.; Tefera, T.W.; Nehlig, A.; Sonnewald, U. The anticonvulsant actions of carisbamate associate with alterations in astrocyte glutamine metabolism in the lithium-pilocarpine epilepsy model. J. Neurochem. 2015, 132, 532–545. [Google Scholar]
- Chen, J.-J.; Liu, Z.; Fan, S.-H.; Yang, D.-Y.; Zheng, P.; Shao, W.-H.; Qi, Z.-G.; Xu, X.-J.; Li, Q.; Mu, J. Combined Application of NMR-and GC-MS-Based metabonomics yields a superior urinary biomarker panel for bipolar disorder. Sci. Rep. 2014. [Google Scholar] [CrossRef]
- Huang, R.; Gao, H.; Zhang, L.; Jia, J.; Liu, X.; Zheng, P.; Ma, L.; Li, W.; Deng, J.; Wang, X.; et al. Borna disease virus infection perturbs energy metabolites and amino acids in cultured human oligodendroglia cells. PLoS ONE 2012, 7, e44665. [Google Scholar]
- Trygg, J.; Holmes, E.; Lundstedt, T. Chemometrics in metabonomics. J. Proteome Res. 2007, 6, 469–479. [Google Scholar] [CrossRef] [PubMed]
© 2015 by the authors; licensee MDPI, Basel, Switzerland. This article is an open access article distributed under the terms and conditions of the Creative Commons Attribution license (http://creativecommons.org/licenses/by/4.0/).
Share and Cite
Bai, S.; Zhou, C.; Cheng, P.; Fu, Y.; Fang, L.; Huang, W.; Yu, J.; Shao, W.; Wang, X.; Liu, M.; et al. 1H NMR-Based Metabolic Profiling Reveals the Effects of Fluoxetine on Lipid and Amino Acid Metabolism in Astrocytes. Int. J. Mol. Sci. 2015, 16, 8490-8504. https://0-doi-org.brum.beds.ac.uk/10.3390/ijms16048490
Bai S, Zhou C, Cheng P, Fu Y, Fang L, Huang W, Yu J, Shao W, Wang X, Liu M, et al. 1H NMR-Based Metabolic Profiling Reveals the Effects of Fluoxetine on Lipid and Amino Acid Metabolism in Astrocytes. International Journal of Molecular Sciences. 2015; 16(4):8490-8504. https://0-doi-org.brum.beds.ac.uk/10.3390/ijms16048490
Chicago/Turabian StyleBai, Shunjie, Chanjuan Zhou, Pengfei Cheng, Yuying Fu, Liang Fang, Wen Huang, Jia Yu, Weihua Shao, Xinfa Wang, Meiling Liu, and et al. 2015. "1H NMR-Based Metabolic Profiling Reveals the Effects of Fluoxetine on Lipid and Amino Acid Metabolism in Astrocytes" International Journal of Molecular Sciences 16, no. 4: 8490-8504. https://0-doi-org.brum.beds.ac.uk/10.3390/ijms16048490