1. Introduction
The increasing prevalence of peripheral artery disease (PAD) is an important cardiovascular disease risk factor [
1,
2,
3]. Stent placement for occlusive vascular disease is recognized as a safe and effective alternative treatment for PAD [
4]. The main concern of stent implantation is the development of in-stent restenosis. Recent studies have shown a 30%–55% restenosis rate after the first year of stent implementation [
5,
6,
7], indicating that a follow-up examination for the patency of implanted stents is important. A number of imaging techniques have been used to evaluate stent patency, including digital subtraction angiography (DSA), multi-detector computed tomography (MDCT), Doppler ultrasound, and magnetic resonance imaging. Doppler ultrasound is a non-invasive technique, which allows measurement of blood flow to confirm the diagnosis of occlusive PAD. However, the use of Doppler ultrasound is restricted when vascular are calcified or stented. Its diagnostic accuracy also depends on both the operator’s experience and the patient’s body habitus. Magnetic resonance angiography, on the other hand, could represent an alternative, non-invasive approach. However, for stents evaluation this procedure might be limited due to signal decrease or signal loss caused by metallic stents. Although DSA was the standard follow-up procedure for PAD, there are some disadvantages of this modality, which include invasiveness and limited assessment to the vessel structures. Therefore, it has gradually been replaced by less invasive techniques, such as MDCT [
8,
9], because MDCT is associated with few procedure-related complications, but with shorter procedural time, and fewer motion artifacts [
8,
9]. Despite these advantages, MDCT has its weaknesses, including a higher rate of contrast medium-induced nephrotoxicity, suffering from blooming artifacts caused by stent struts, and risk of high radiation dose.
The latest MDCT systems, such as dual-source computed tomography (DSCT) and dual-energy computed tomography (DECT), are capable of addressing these weaknesses [
10]. In particular, DECT has the ability to distinguish different materials at high density—for example, separating iodinated contrast from other materials [
11]. In addition, beam-hardening artifacts, which usually result from the polychromatic energy of the X-ray spectrum, can be eliminated by using the monochromatic energy images (MEI) spectrum. Furthermore, shorter rotation time and use of iterative reconstruction can reduce the radiation dose [
12]. Although extensive studies have been conducted on the use of DECT for cardiovascular disease, there is a paucity of literature focusing on the lower extremities, especially for stent patency evaluation [
13,
14,
15,
16].
Most of the previous studies on DECT were performed on dual-source DECT, which uses two X-ray tubes [
8,
16,
17,
18,
19]. However, the fast kilovoltage switching CT scanner, using one X-ray tube and a full field of view (FOV) with special detector gemstone spectral image (GSI) of GE medical systems, represents another advantage of DECT, as it can improve image quality by reducing beam-hardening artifacts associated with stents. Furthermore, it can distinguish between materials such as contrast and soft tissue or other materials by suppressing one material and enhancing the other with better temporal registration [
20]. To the best of our knowledge, there is no report available in the literature on using the fast kilovoltage switching GE scanner for evaluation of periperal arterial stents. Thus, the purpose of this study is to identify an optimal DECT scanning protocol that provides a lower radiation dose and maintains image quality in peripheral arterial stents based on an
in vitro phantom study.
2. Results
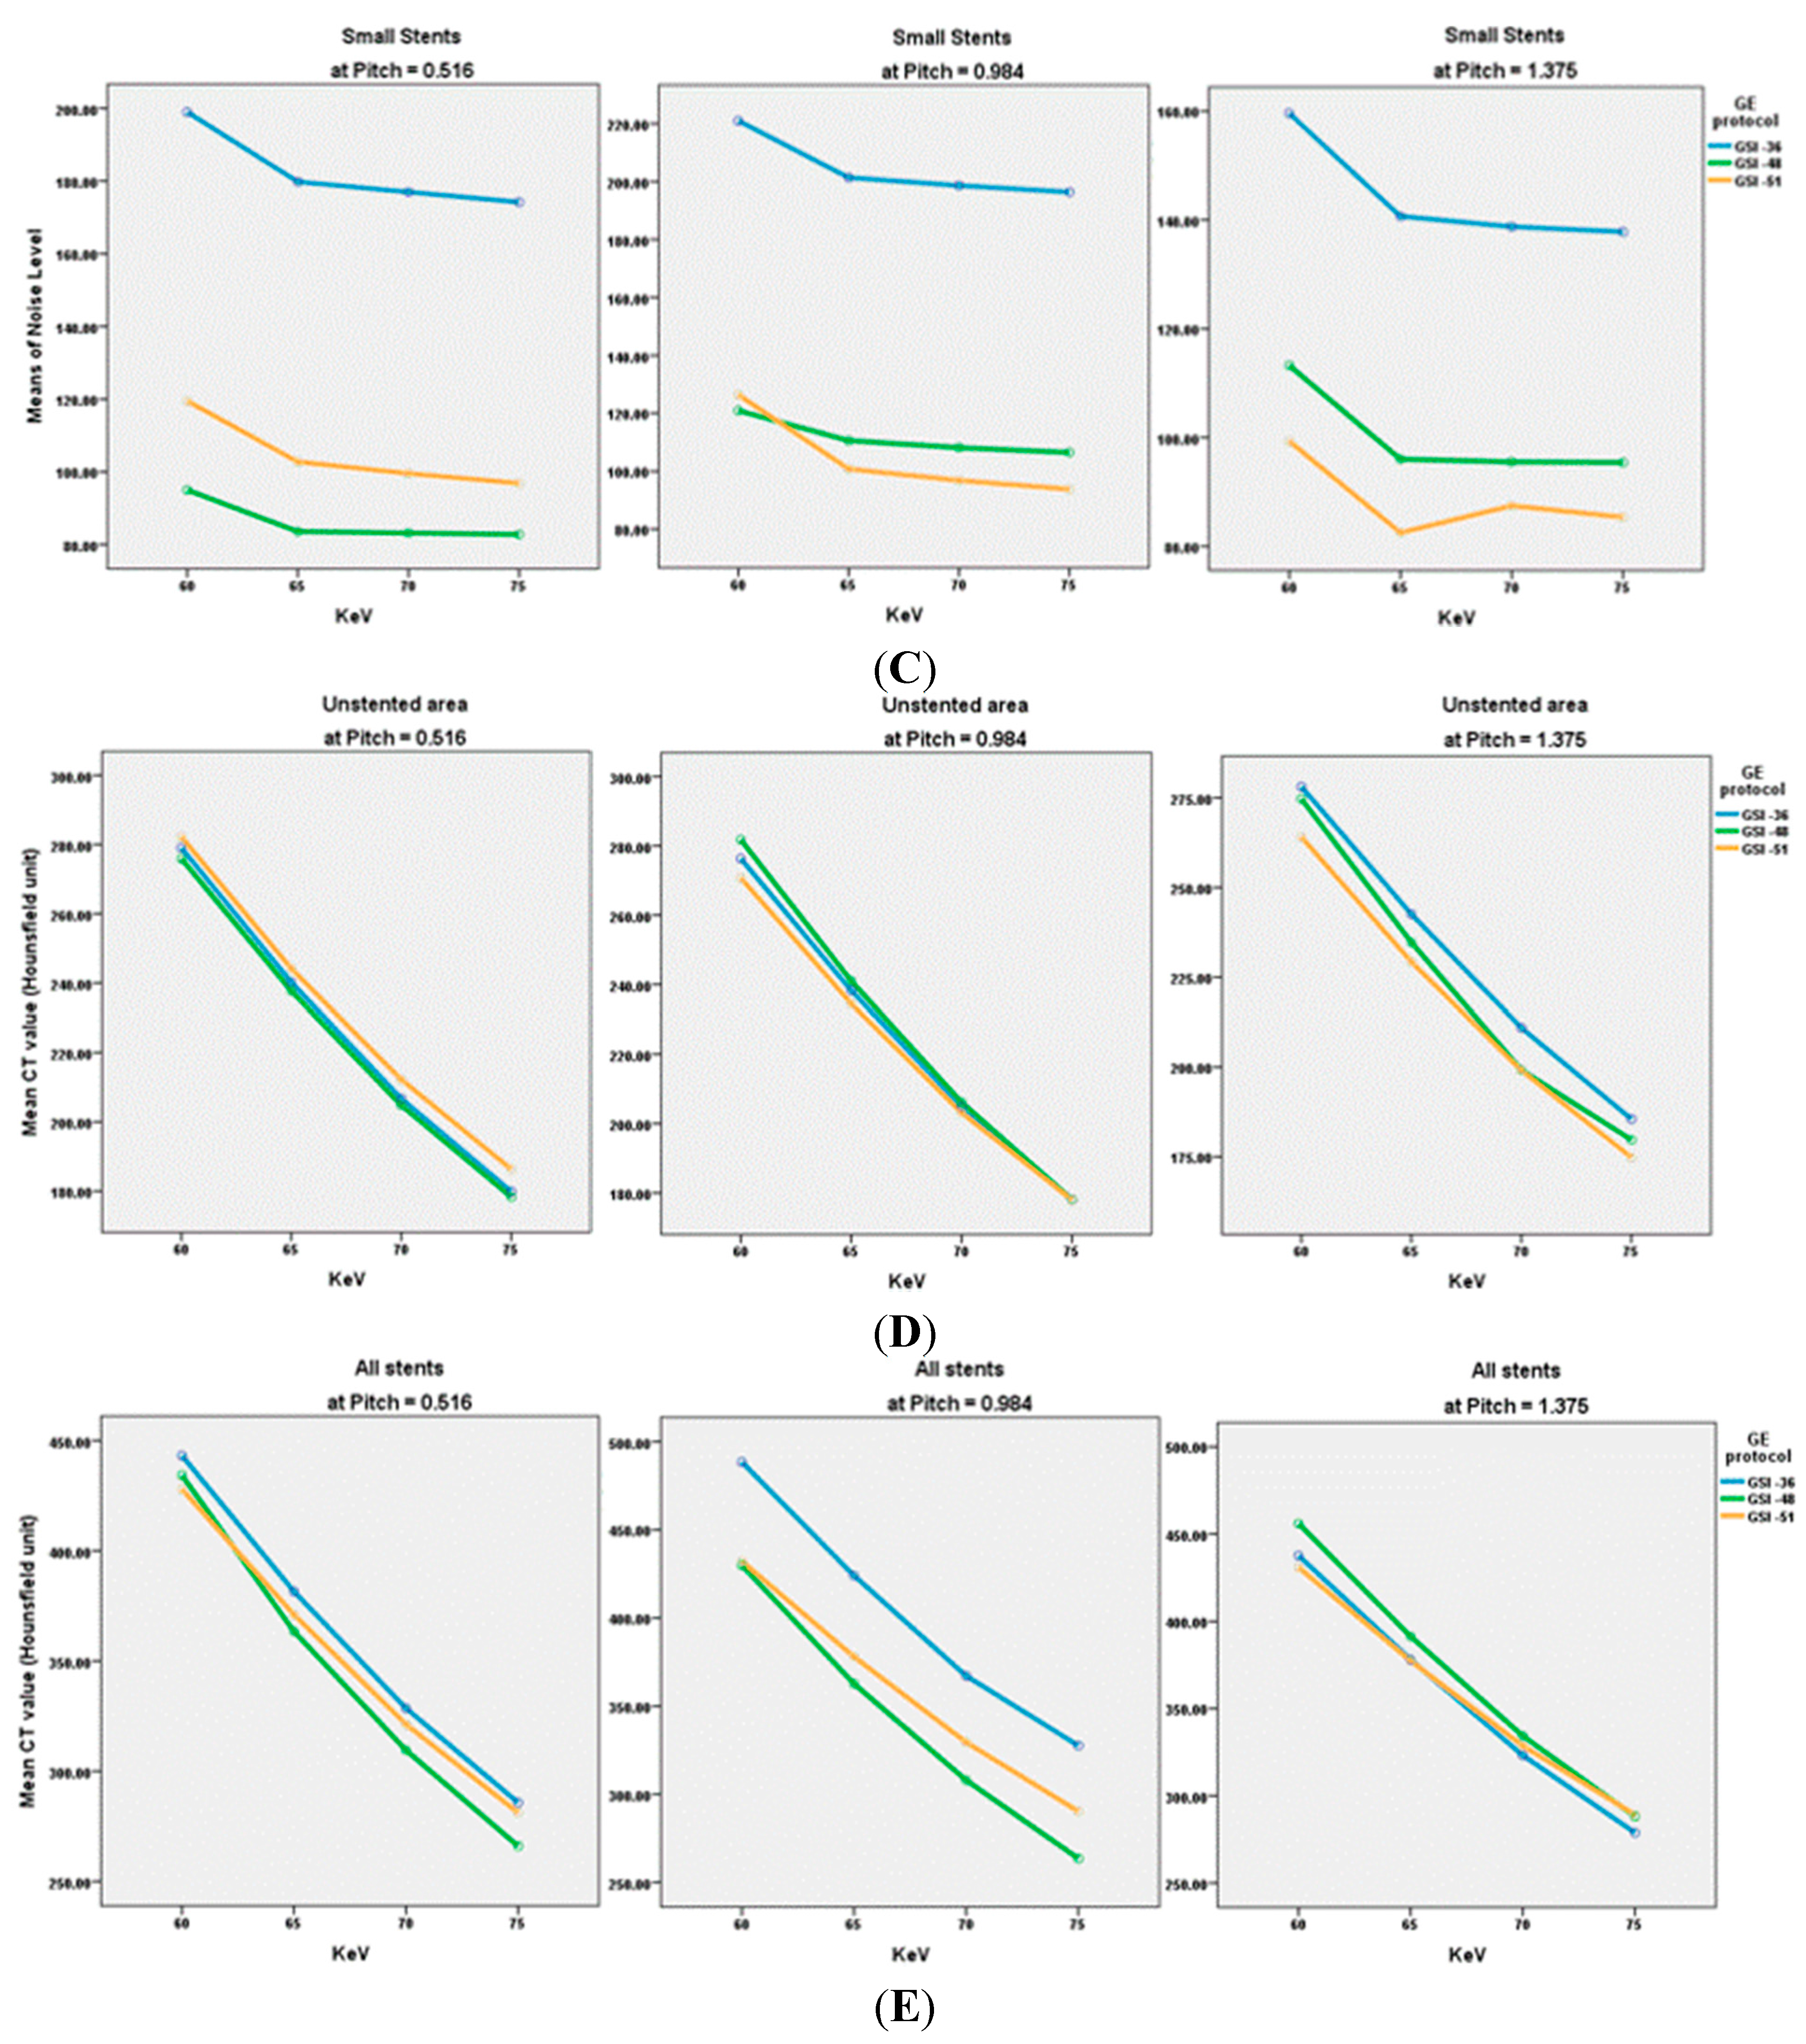
A total of 180 series acquired with virtual MEI imaging at 4-kiloelectron volts (keV) and 5-adaptive statistical iterative reconstruction (ASIR) levels were reconstructed to determine the interaction between peripheral arterial stent image quality factors and scanning protocols. There was a significant reduction of image noise with MEI between 65 and 70 keV in all investigated preset GSI protocols (
p < 0.05). A significant reduction was observed at 65 keV for the unstented area, and for large diameter stents and small diameter stents with both GSI-48 and GSI-51. However, the mean HU was reduced as the keV increased for all protocols, as shown in
Figure 1E. Results indicated that the preset GSI-48 scanning protocol with a pitch value of 0.984, 65 keV, and ASIR ≤ 50% achieved the optimal image quality compared with the other protocols, as shown in
Figure 1A–E.
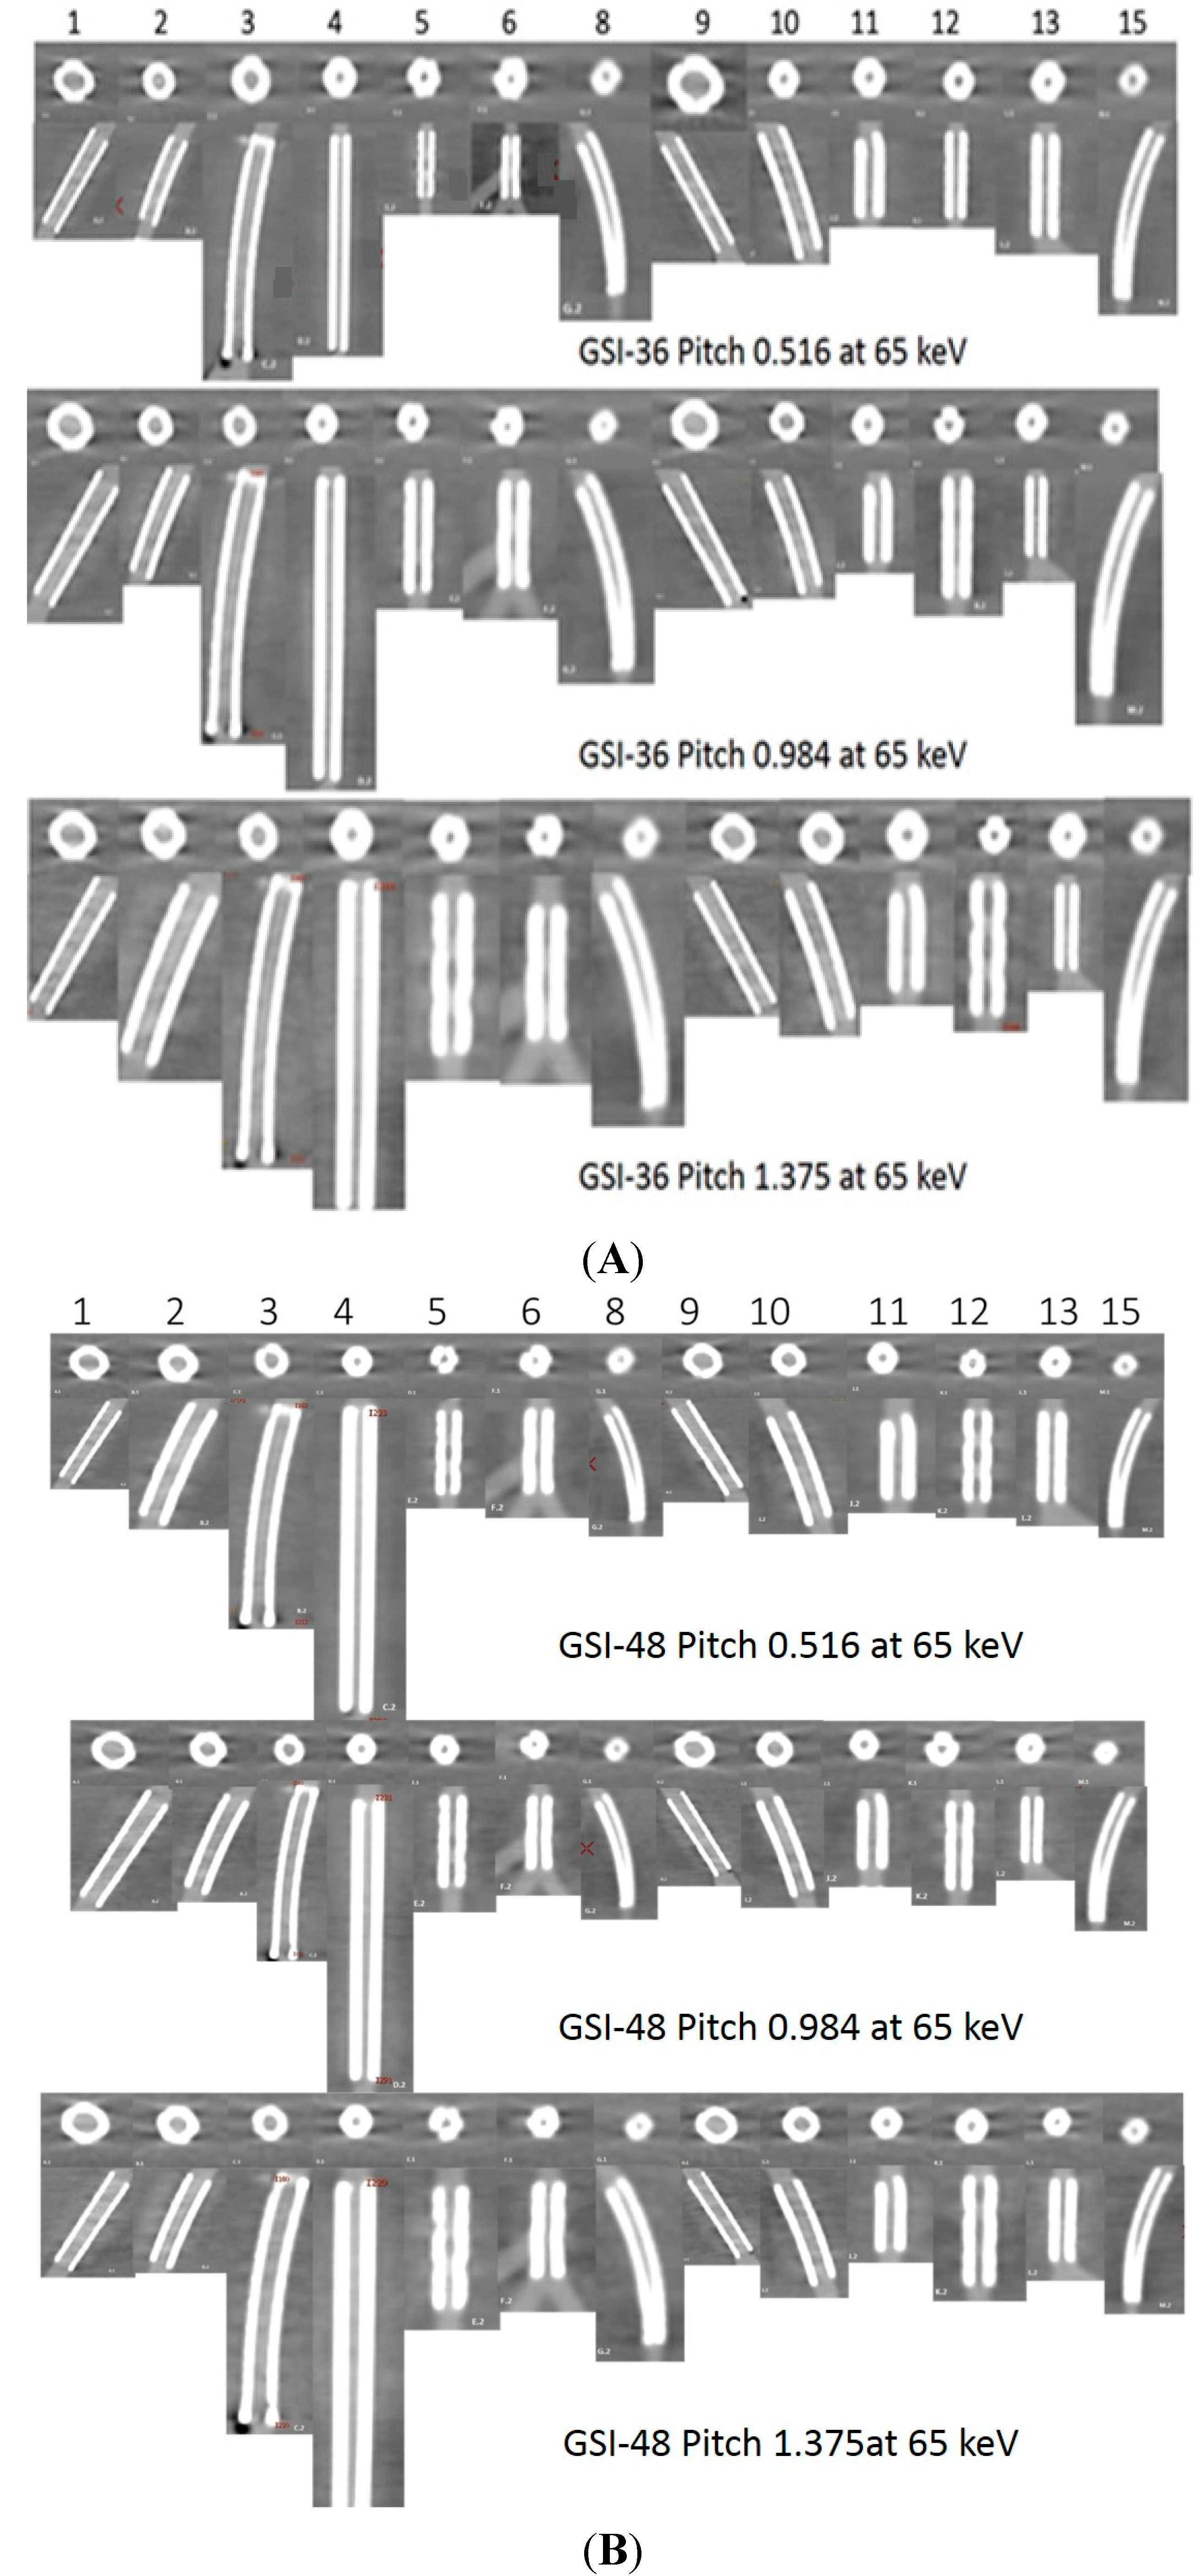
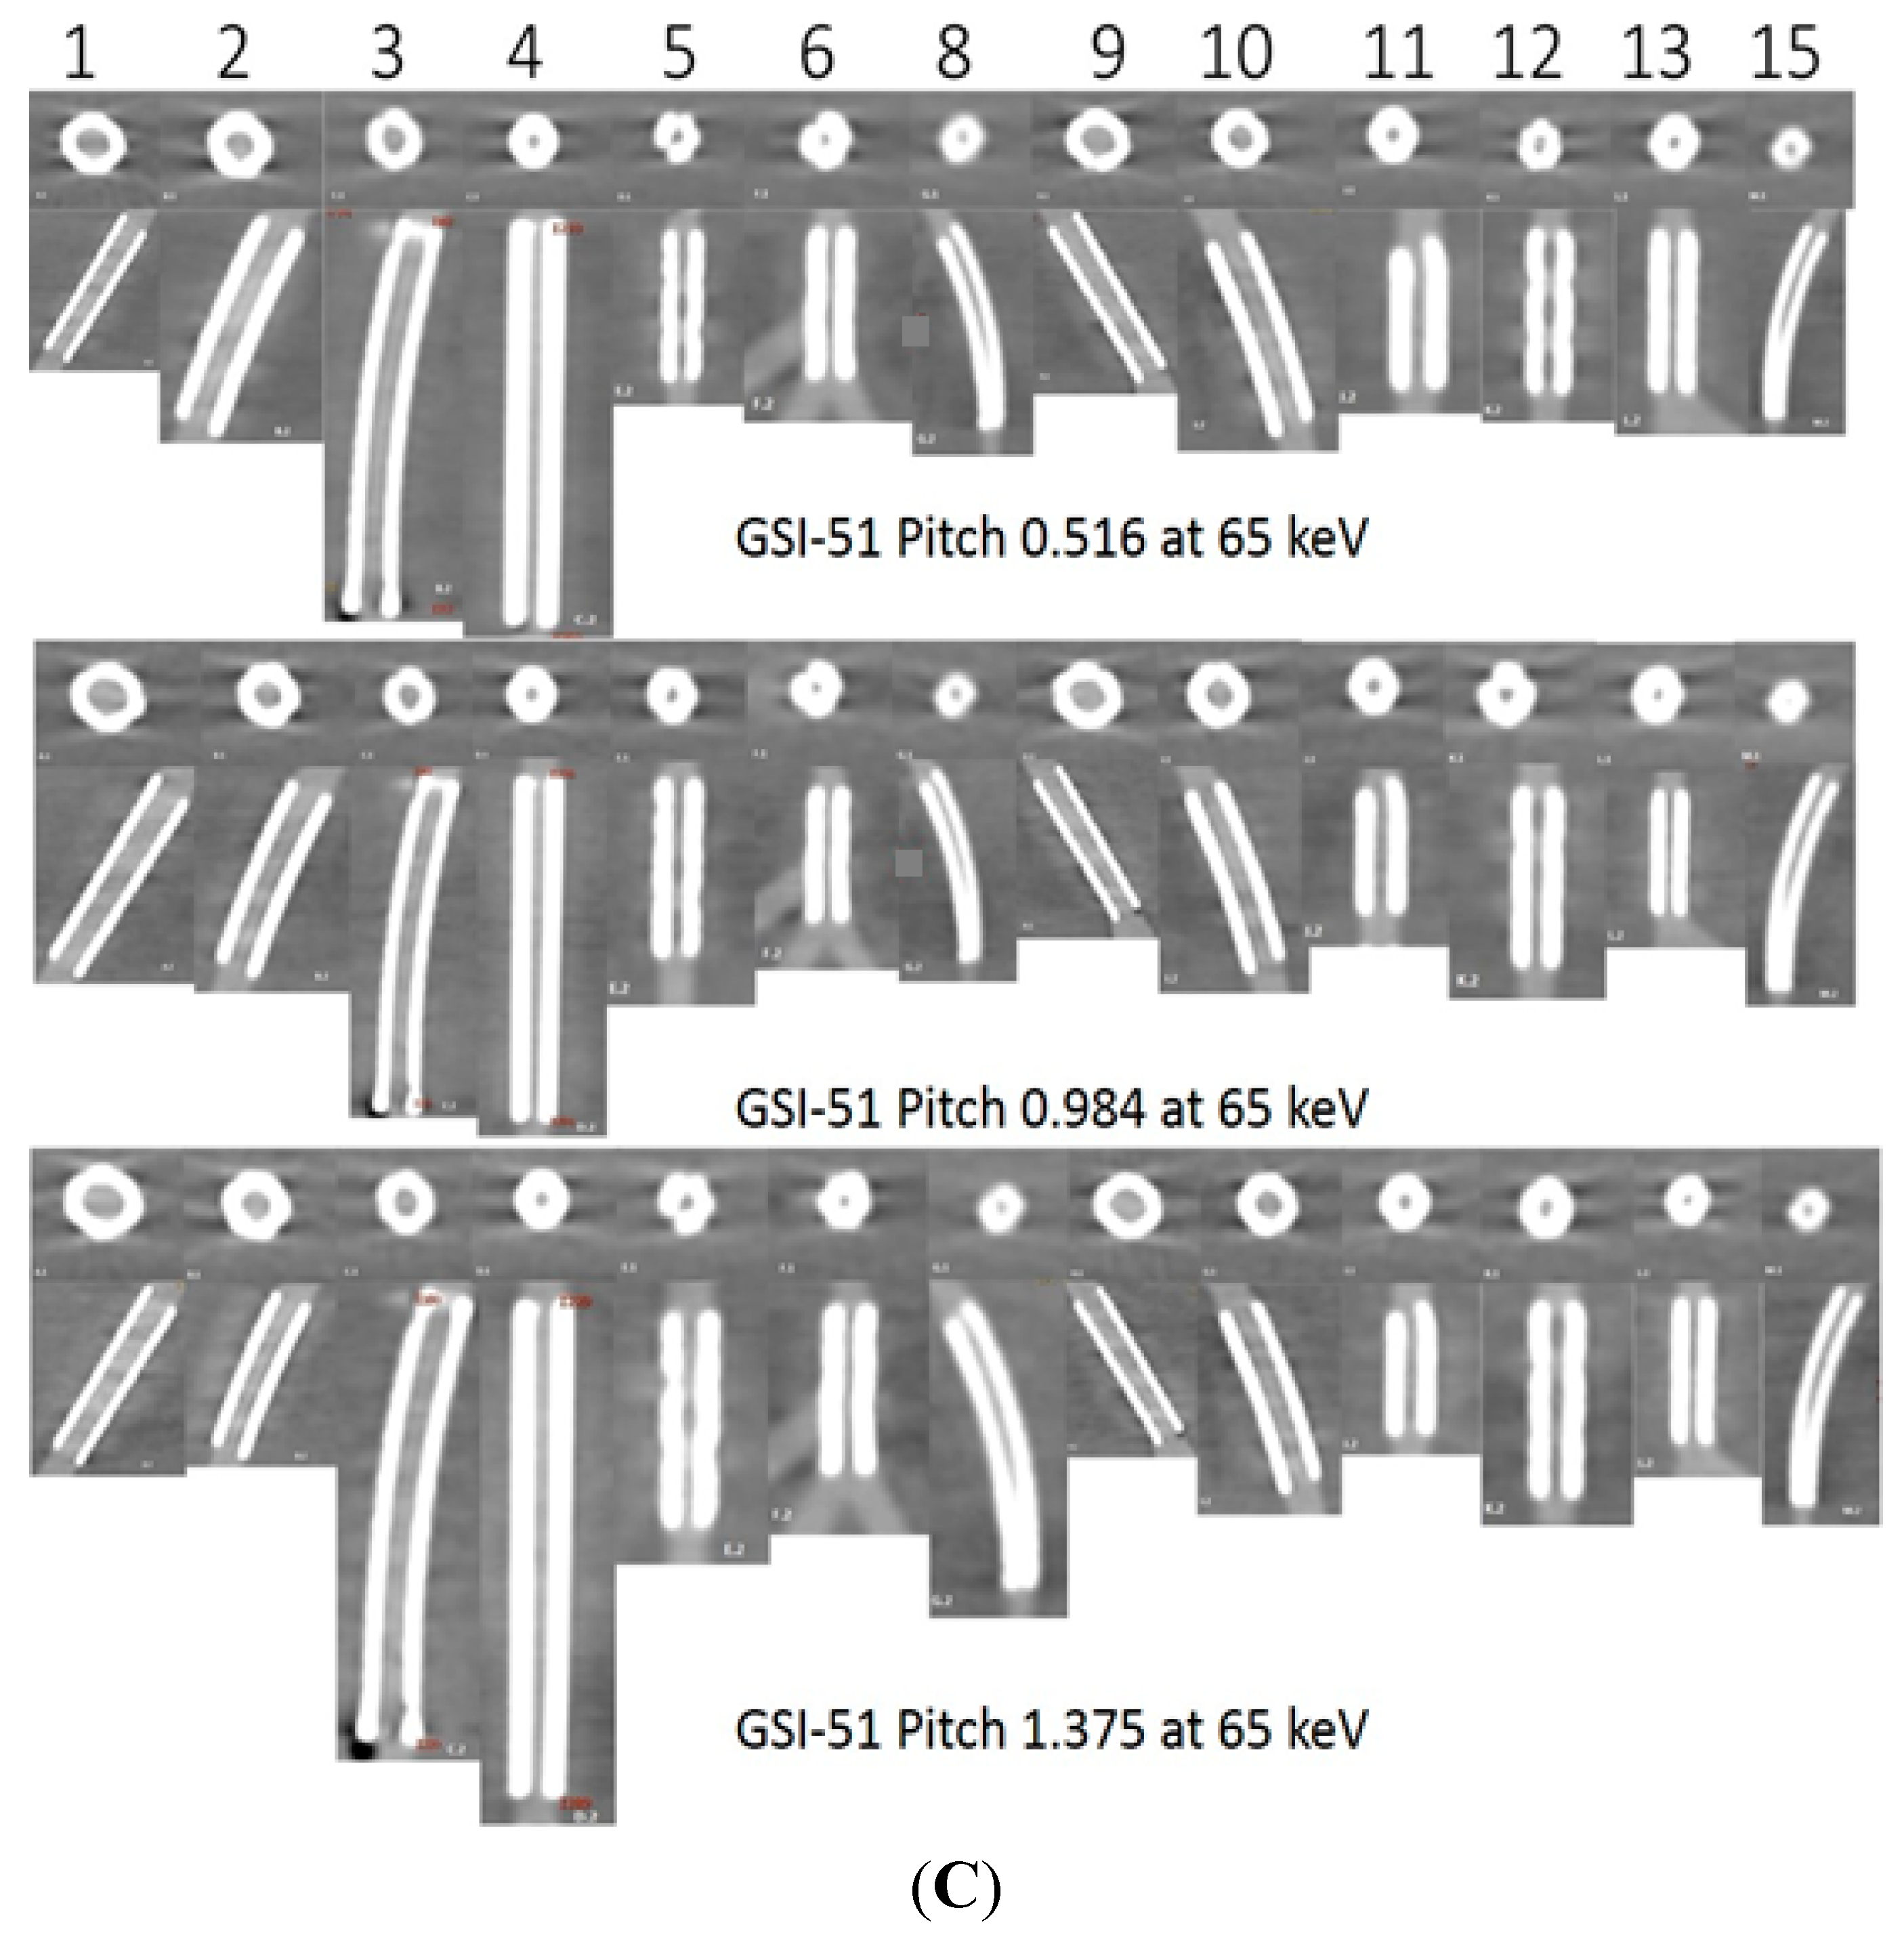
Figure 2 shows an example of a series of images acquired with protocols using 65 keV and 3 GSI settings.
Figure 1.
(A–C) show the comparison of Noise Level at different kiloelectron voltage (keV) with the three preset GSI protocols and three pitch values, while Figure (D,E) represent the mean of CT value in unstented area and all stents with these scanning protocols.
Figure 1.
(A–C) show the comparison of Noise Level at different kiloelectron voltage (keV) with the three preset GSI protocols and three pitch values, while Figure (D,E) represent the mean of CT value in unstented area and all stents with these scanning protocols.
Figure 2.
A total of 13 stents (No. 7 and 14 were not included due to difficulty placing region of interest in the area) with axial and coronal reformatted images were demonstrated with three GSI protocols (A–C: GSI-36, GSI-48, and GSI-51, respectively) and three pitch values at a keV of 65.
Figure 2.
A total of 13 stents (No. 7 and 14 were not included due to difficulty placing region of interest in the area) with axial and coronal reformatted images were demonstrated with three GSI protocols (A–C: GSI-36, GSI-48, and GSI-51, respectively) and three pitch values at a keV of 65.
2.1. Image Quality Assessment
The phantom data were analyzed with a 3-GSI * 3-Pitch * 4-keV factorial ANOVA. Each effect was tested with a mean standard error (MSE) of 71.27. There was highly significant interaction of image noise and SNR with the GSI and pitch (
p = 0.001). Similar findings were observed in the unstented area with highly significant effects. In addition, significant effects were found for these factors—GSI, pitch, and keV (
p = 0.001). In contrast, there was another significant interaction on the unstented area between GSI and ASIR (
p = 0.015) and a very highly significant difference between keV and ASIR (
p < 0.001). Although for noise level, two of the 3-way interactive terms were statistically significant, namely the GSI, pitch, and keV, and the GSI, pitch, and ASIR (
p < 0.001); the main effects and interactions for these are shown in
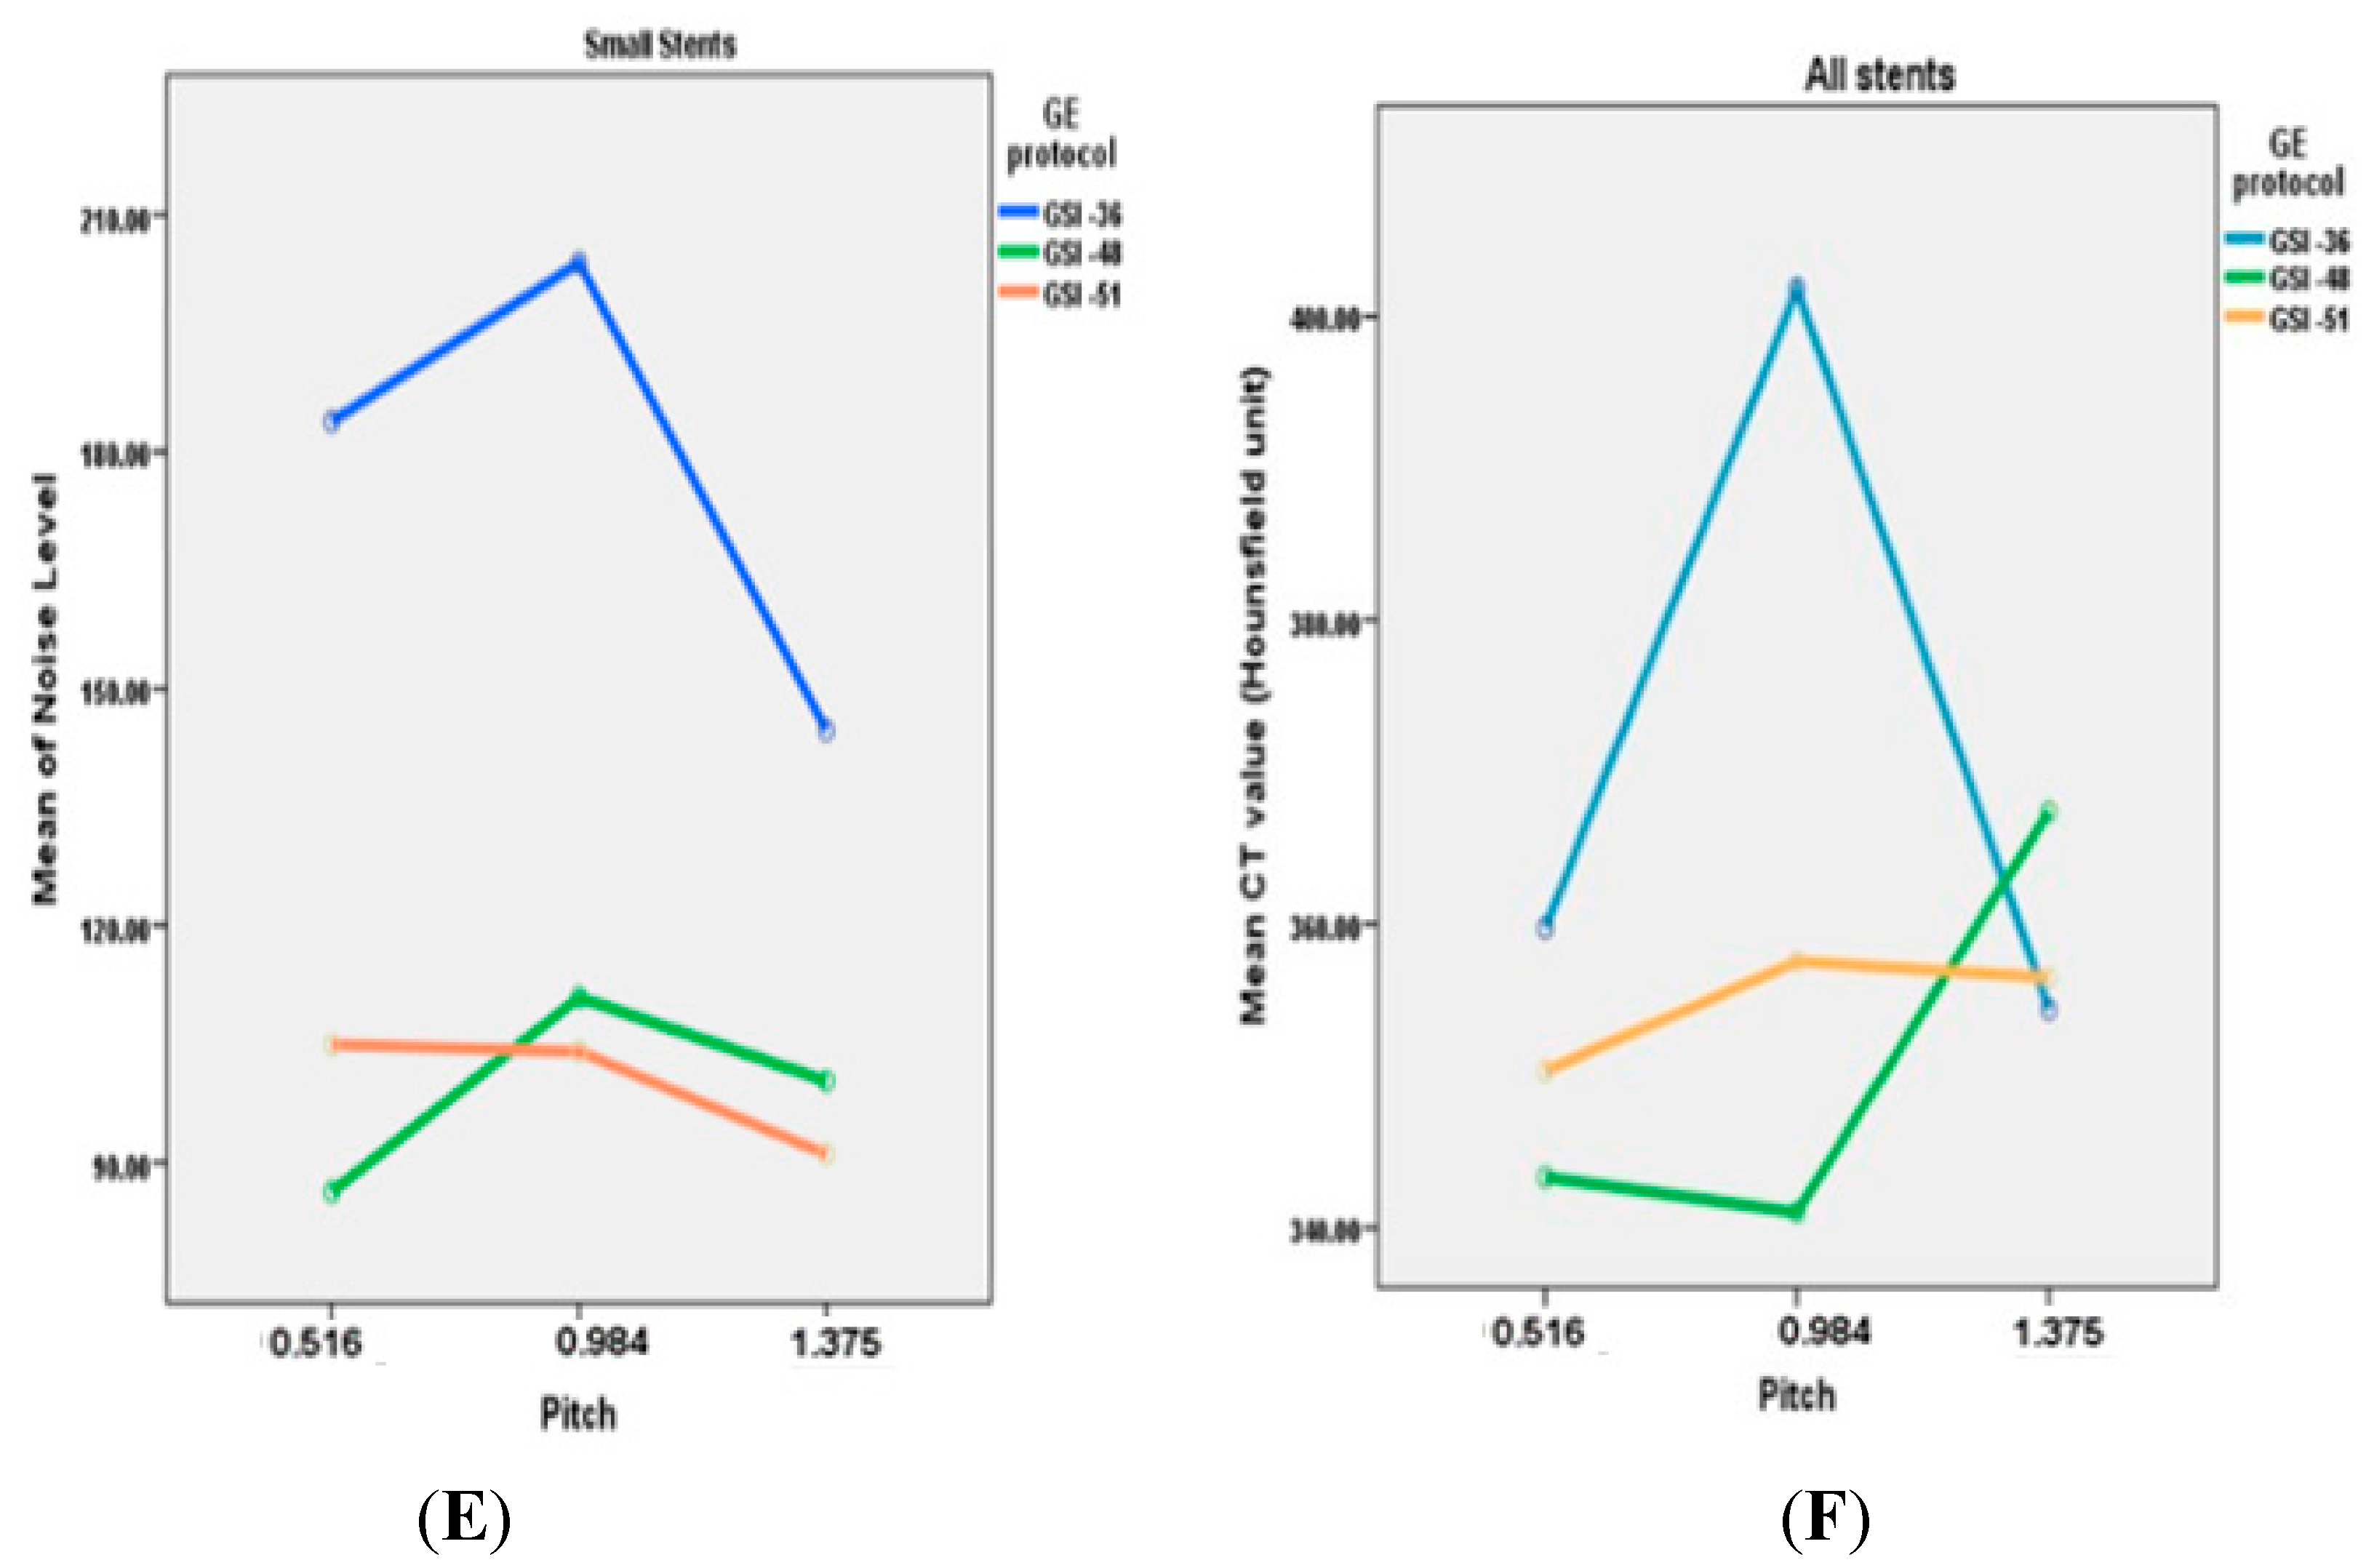
Table 1. The noise level (MSE = 89.04) was higher in GSI-36 than in the other two GSIs, as shown in
Figure 3A–E.
Table 1.
Results of factorial ANOVA.
Table 1.
Results of factorial ANOVA.
| Effects | SNR | SNR2 | NL | NL2 |
|---|
| F | P | F | P | F | P | F | P |
|---|
| GSI | Main effect | 11.806 | 0.001 | 86.658 | 0.000 | 947.509 | 0.000 | 572.661 | 0.000 |
| Pitch | Main effect | 10.992 | 0.002 | 302.411 | 0.000 | 102.664 | 0.000 | 1883.182 | 0.000 |
| KeV | Main effect | 13.424 | 0.000 | 192.161 | 0.000 | 230.042 | 0.000 | 894.644 | 0.000 |
| ASIR | Main effect | NA | NA | 157.416 | 0.000 | NA | NA | 1291.264 | 0.000 |
| GSI * ASIR | Two-factor interaction effect | NA | NA | 3.823 | 0.015 | NA | NA | 27.164 | 0.000 |
| KeV * ASIR | Two-factor interaction effect | NA | NA | 6.133 | 0.001 | NA | NA | 3.652 | 0.010 |
| Pitch * ASIR | Two-factor interaction effect | NA | NA | 1.877 | 0.147 | NA | NA | 68.25 | 0.000 |
| GSI * KeV | Two-factor interaction effect | 0.454 | 0.829 | 16.528 | 0.000 | 0.649 | 0.691 | 120.311 | 0.000 |
| GSI * Pitch | Two-factor interaction effect | 13.708 | 0.000 | 12.793 | 0.000 | 142.367 | 0.000 | 30.586 | 0.000 |
| Pitch * KeV | Two-factor interaction effect | 0.419 | 0.853 | 18.778 | 0.000 | 1.189 | 0.375 | 120.391 | 0.000 |
| GSI * KeV * ASIR | Three-factor interaction effect | NA | NA | 0.457 | 0.920 | NA | NA | 1.727 | 0.123 |
| GSI * Pitch * ASIR | Three-factor interaction effect | NA | NA | 0.634 | 0.742 | NA | NA | 9.842 | 0.000 |
| Pitch * KeV * ASIR | Three-factor interaction effect | NA | NA | 0.558 | 0.853 | NA | NA | 1.326 | 0.268 |
| GSI * Pitch * KeV | Three-factor interaction effect | NA | NA | 21.545 | 0.000 | NA | NA | 118.371 | 0.000 |
Figure 3.
(A–E) A comparison of relationship between noise levels measured with different GSI protocols and pitch values at 65 keV with different diameters of stents; (F) represents the mean of CT values measured in all stents with use of three GSI and pitch protocols.
Figure 3.
(A–E) A comparison of relationship between noise levels measured with different GSI protocols and pitch values at 65 keV with different diameters of stents; (F) represents the mean of CT values measured in all stents with use of three GSI and pitch protocols.
2.2. Effect of keV on Image Quality
There was no significant interaction between keV and GSI or pitch factors in the stented area. However, this does not mean that there was no effect of keV on image quality, but the effect of keV on image noise was not dependent on GSI or pitch. Therefore, the four noise-level means for keV ranged from 83.94 to 64.30 HU and, incidentally, decreasing image noise occurred monotonically with increasing keV. Thus, the effect of keV on image noise was independent of any other design effect. A similar effect was observed with the SNR. Unlike its effect on the unstented area, the effect of keV was found to be highly significant for both image noise and SNR (
p = 0.001).
Figure 4 compares the selected keV in different GSIs for both unstented and stented areas with different ASIR values.
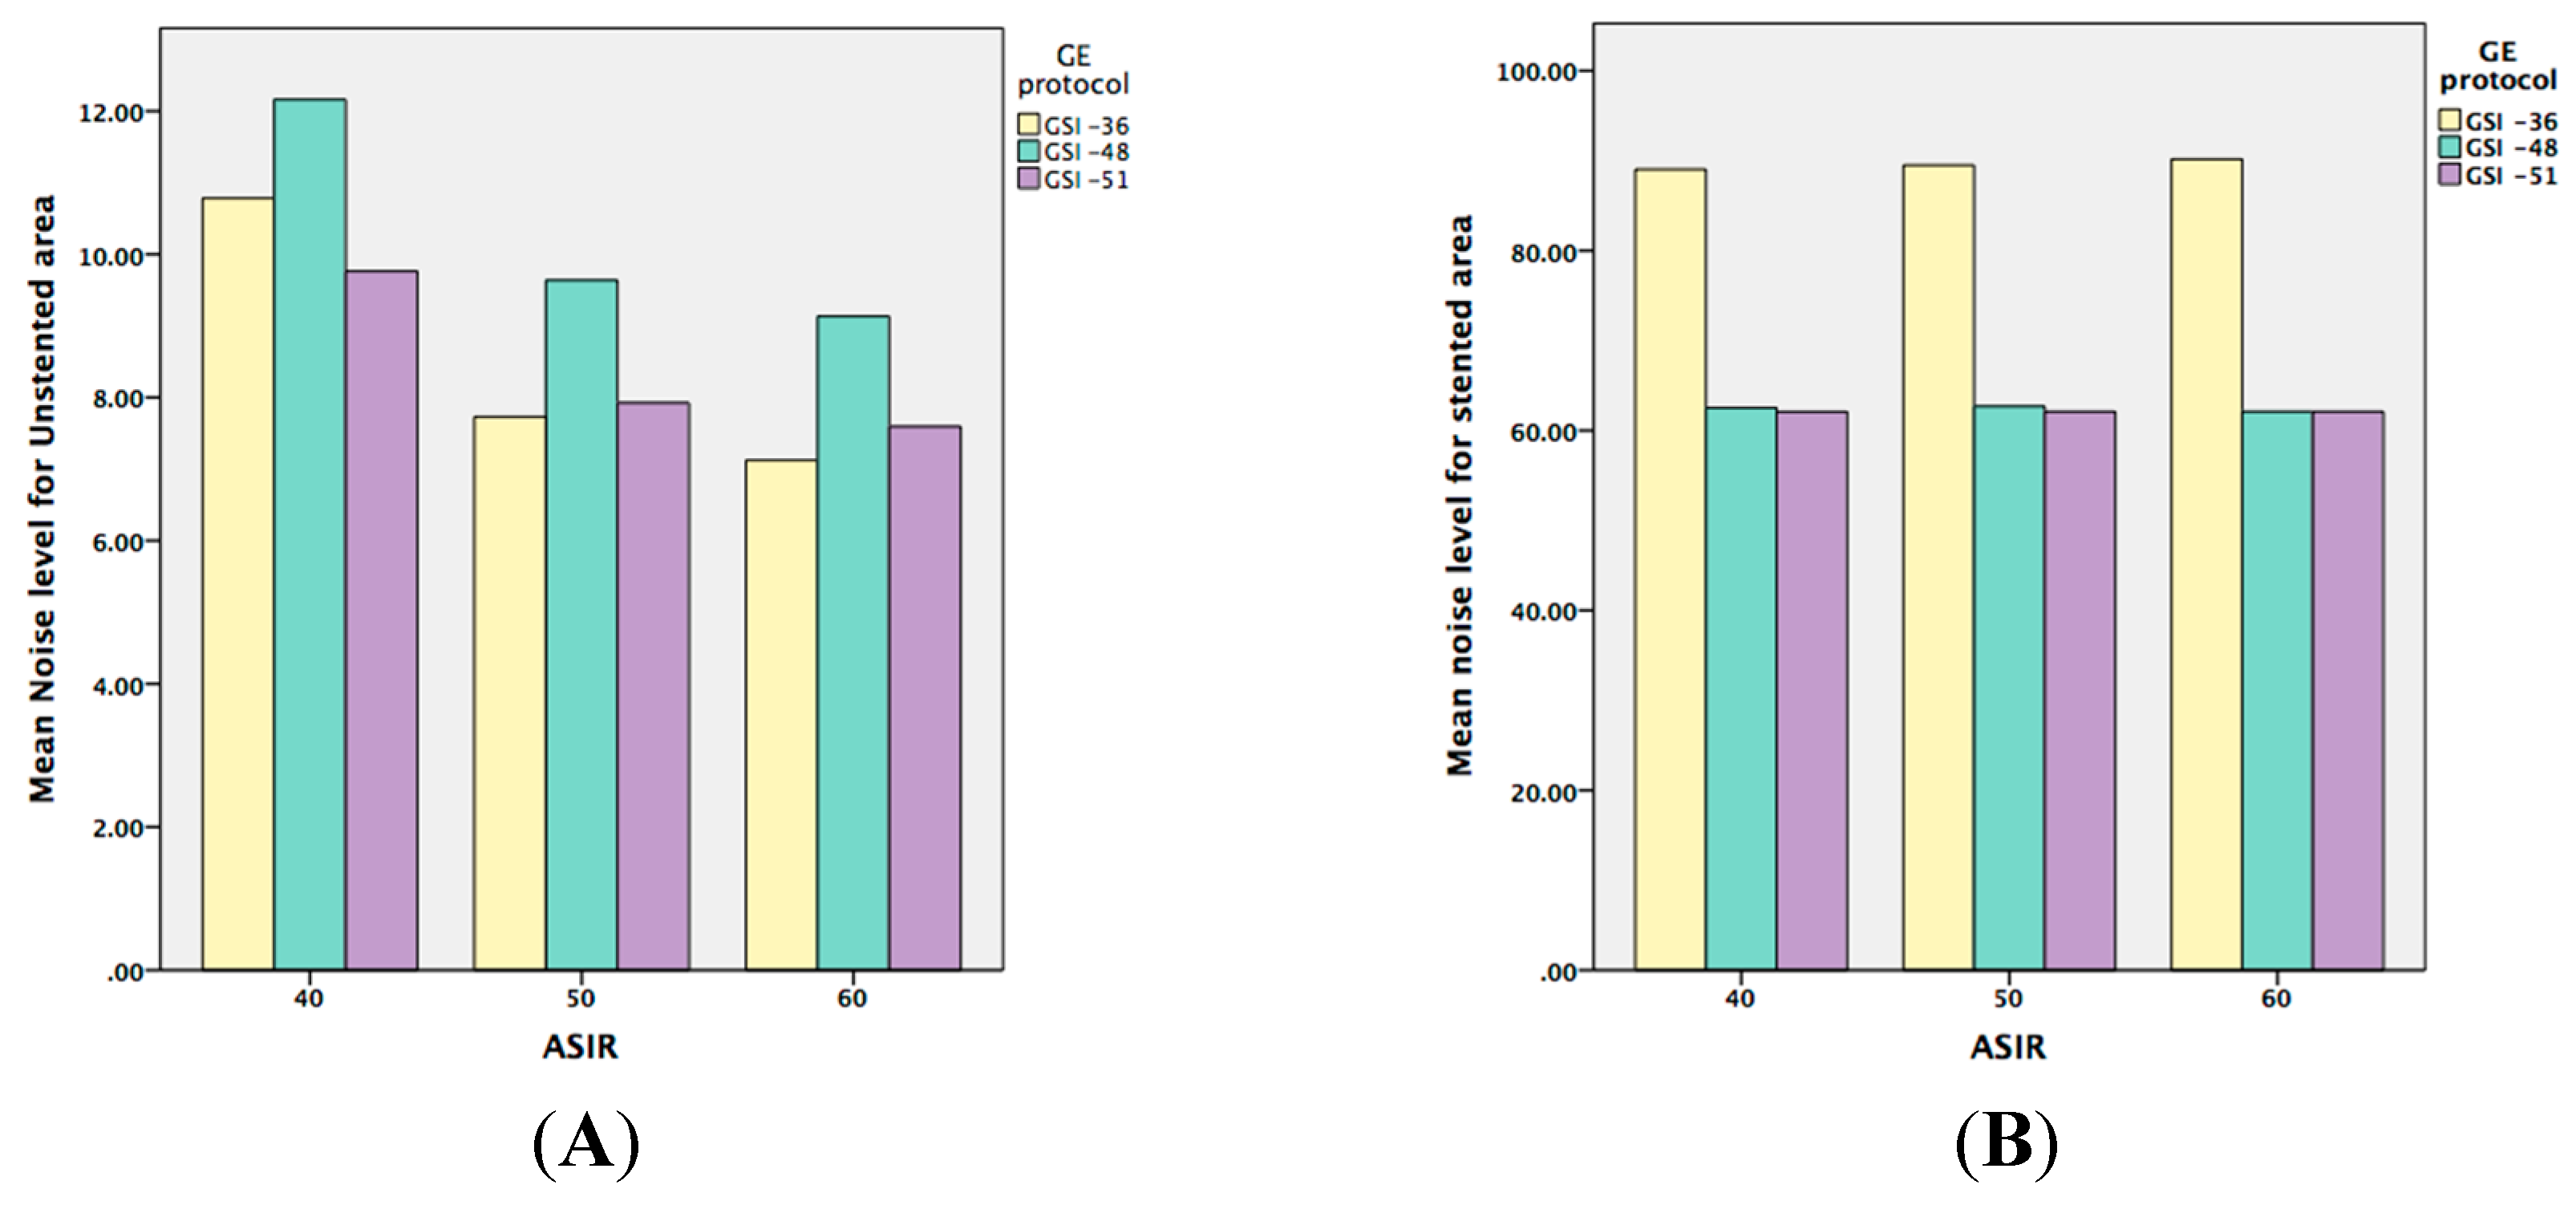
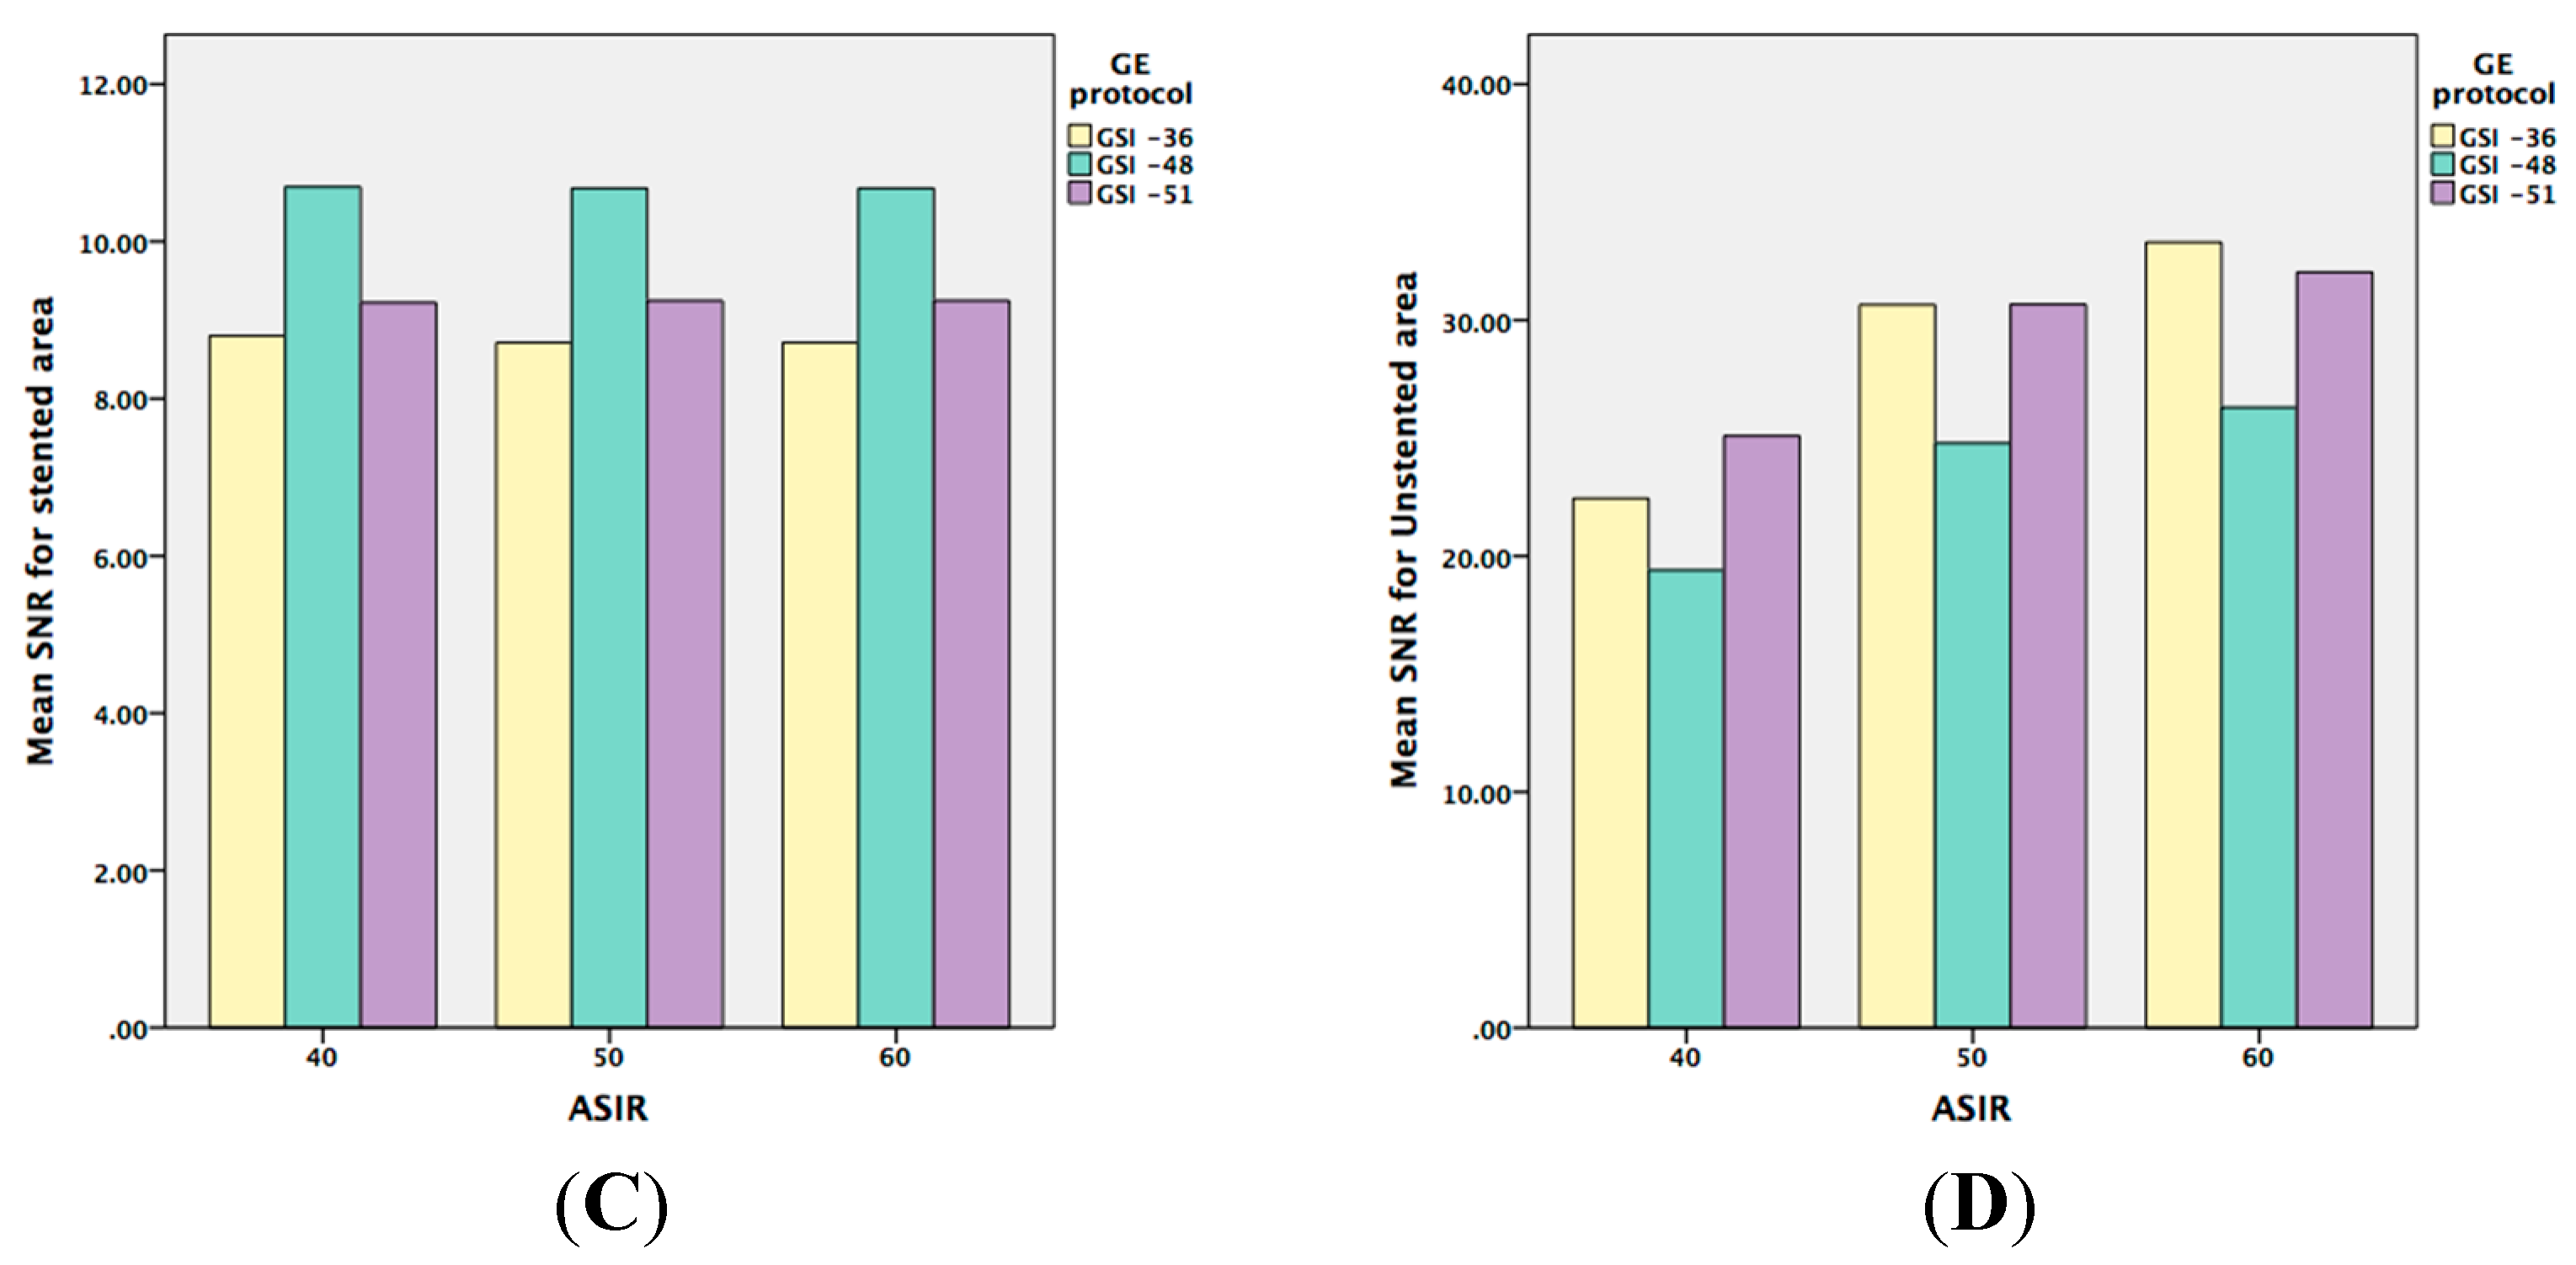
Figure 4.
(A,B) are graphic representations showing the noise level when ASIR is used within the both unstented and stented areas; while (C,D) represent the means of SNR when ASIR is used.
Figure 4.
(A,B) are graphic representations showing the noise level when ASIR is used within the both unstented and stented areas; while (C,D) represent the means of SNR when ASIR is used.
2.3. Effect of GSI and Pitch on Image Quality
The interaction of GSI by pitch is highly statistically significant (
p < 0.001). A significance interaction was observed on the unstented area. Also, the main effects of GSI and pitch on noise level are highly significant (
p < 0.001), as shown in
Table 1.
The marginal noise level means for the 3-GSI categories were 89.03, 62.86, and 61.92, indicating significant differences with the first GSI and with both the second and third GSI of around 27.11 and 0.94 HU, respectively. However, when the three GSI means were investigated for the first pitch category (84.90, 60.60, and 63.95), significant changes were observed. These changes varied both with respect to magnitude and direction, and presented as the significant interaction of GSI by pitch.
2.4. Effect of Type of Stents on Image Quality
The noise level in the unstented area showed a direct relationship between image noise and pitch value, with noise increasing when pitch increased. However, with large stents, lower image noise was found in GSI-36 and GSI-48 protocols, with a pitch value of 0.984. The medium sized stent showed that a lower noise was achieved by a GSI-48 and pitch of 0.984, while result is different from that for the small stents where the best visualization was achieved with use of GSI-51 and pitch of 0.516, as shown in
Figure 3.
A radiation dose reduction of about 50% was achieved in all protocols when the pitch value 0.984 was used. However, a minimal reduction was observed when the pitch value was changed from 0.984 to 1.375.
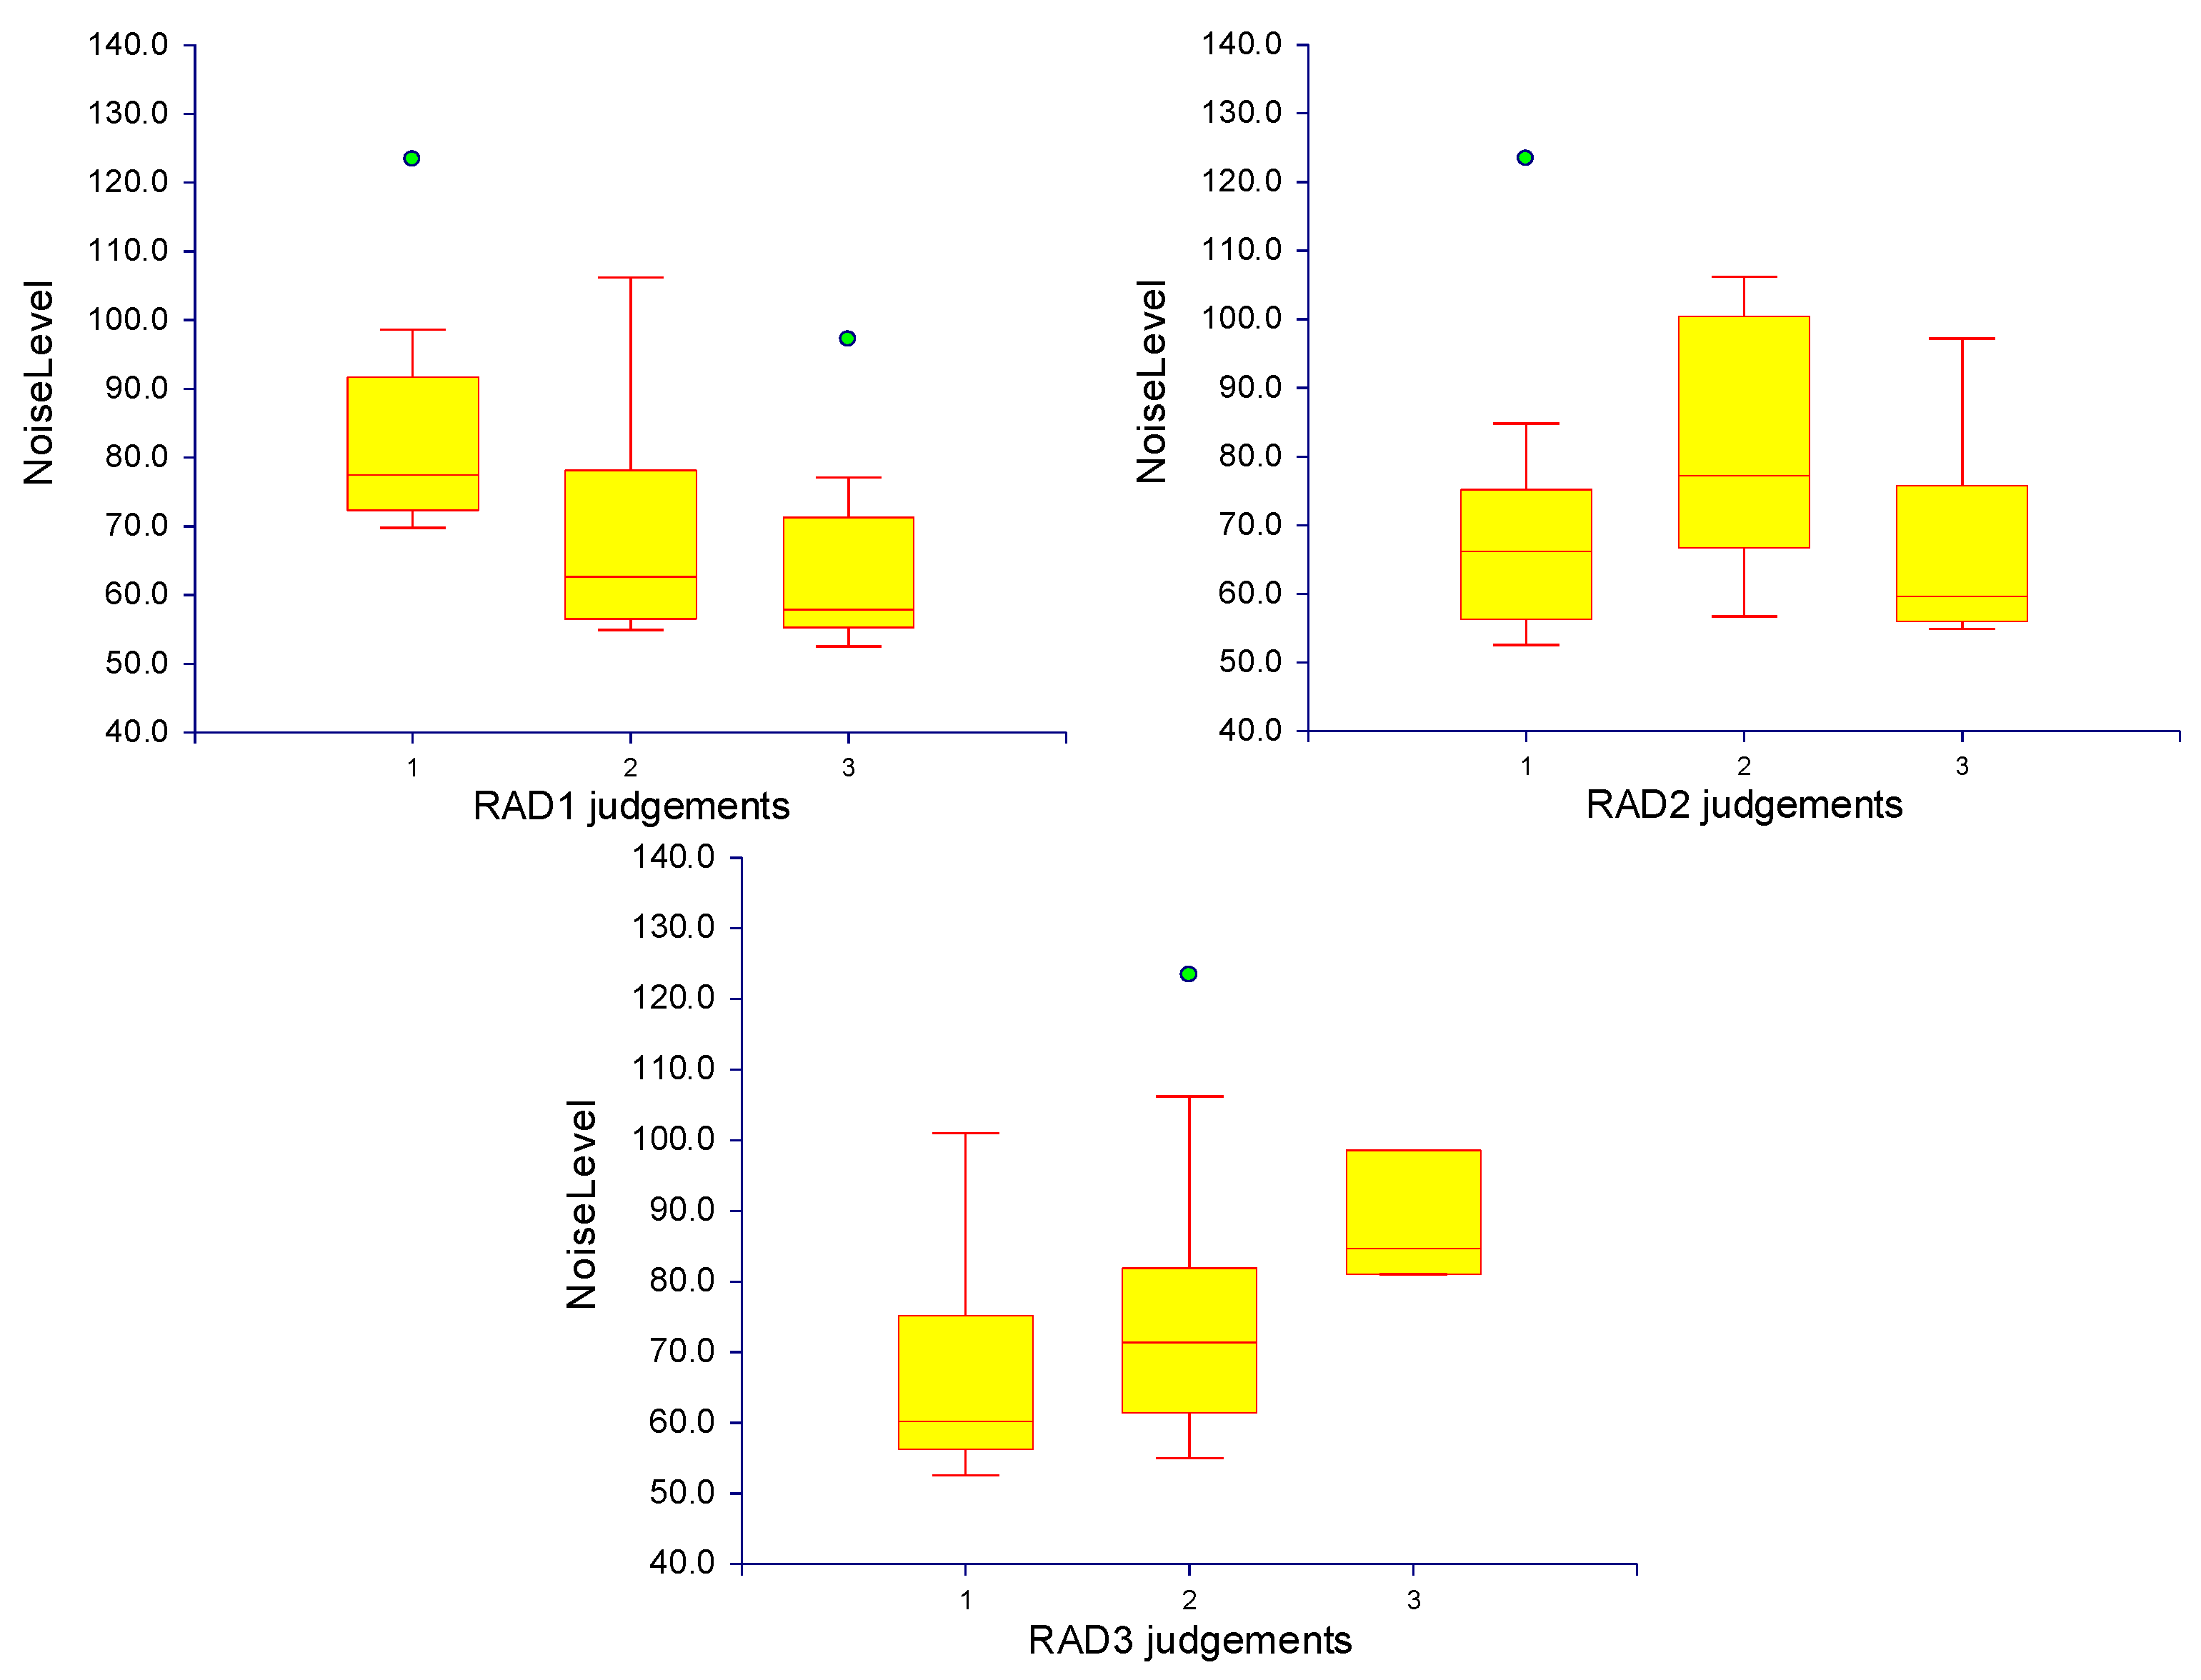
2.5. Subjective Image Quality Assessment
The subjective grading of image quality showed a discrepancy between the readers with a kappa value of 0.24. This might be explained by the limited experience of those readers in clinical research. The box plots of the noise level for the three radiologists are shown in
Figure 5.
Figure 5.
Box plots demonstrate the radiologist’s evaluation of the image quality using a 3-point scale. The red line within the yellow box indicates the median of the values. The red line at the bottom of the box corresponds to the 25th percentile, and the one at the top is the 75th percentile. The range between these two lines (i.e., the length of the box) is the inter Quartile Range (IQR). The lower cross line is 1.5 IQR below the 25th percentile, the upper cross line is 1.5 IQR above the 75th percentile. Individual observations beyond either of these cross line are outliners, shown as green circles.
3. Discussion
This phantom study indicates that the effect of the pitch factor on the keV and radiation dose is an important indicator for determining both radiation dose and image quality, as the lowest pitch is associated with the highest radiation dose and vice versa. The lowest radiation dose with sufficient image noise was obtained with the GSI-48 protocol with a pitch of 0.984 and 65 keV. Overall, the GSI-51 protocol achieved the highest SNR and lowest noise level values with pitch values of 0.516 and 1.375; however, a pitch value of 0.516 was associated with the highest radiation dose, whereas a pitch value of 1.375 was associated with the highest image noise. To our knowledge, no studies have been published comparing different DECT protocols with different pitch values. Results of this study show that the effect of the pitch value on image noise was strongly dependent on rotation time, as the protocol with the shorter rotation time (GSI-36) achieved both the highest SNR and the lowest image noise, and the protocol with the longer rotation time (GSI-51) achieved the highest image noise, even when mAs was higher than that of the other protocols.
It was found that the images acquired with approximately 65–70 keV had less image noise and higher SNR compared to other energies that have a lower noise level and lower SNR. Our results are similar to those reported from a chest study by Cheng
et al [
15] who found that the MEI images at 65–70 keV resulted in less image noise and a better contrast-to-noise ratio. The findings of the current study are consistent with those of Yu
et al [
21], who studied various phantom sizes to evaluate MEI at multiple keV levels to optimize chest image quality. They found that the best image quality was obtained with energies of 66 keV for small phantoms, 68 keV for medium, 70 keV for large, and 72 keV for extra-large phantoms [
21]. Similarly, Matsumoto
et al. [
22] reported that using 70 keV achieved the lowest image noise based on a phantom study. Furthermore, Pehno
et al [
13] compared the subjective and objective image quality of virtual MEI DECT angiography (DECTA) to conventional polyenergetic images (PEI) in aortoillic arteries, demonstrating optimal contrast enhancement and improved image quality using 70 keV MEI compared to single-energy CTA. However, our findings show that the highest image noise was found with 60 keV, which differs from those reported by Sudarski
et al. [
23]. They found that the use of 60 keV for lower extremities led to the best image quality when compared to the quality of PEIs. These findings can be justified because the effect of stents on image noise is clearly evident when comparing small, medium, and large stents with different keV, as shown in
Figure 5. The findings from these studies suggest that using keV between 65 and 70 with a pitch value of 0.984 achieves optimal image quality with a lower radiation dose in peripheral arterial DECT.
When iterative reconstruction is evaluated there is a significant difference between the unstented and stented areas. In the unstented area, the image quality was improved when the ASIR was increased from 40% to 50%. This is similar to previous studies that showed that an ASIR of less than 40% did not improve the image quality when compared with conventional PEIs [
14,
24,
25,
26]. However, the current study shows that images with stents were not affected by any level of ASIR when they were applied with all of the preset GSI protocols. Therefore, based on the unstented area results, we recommend the use of 50% ASIR, with 65 to 70 keV in the peripheral arterial stent protocol, and preset GSI-48 as the optimal protocol to replace the conventional CTA.
The optimal protocol that has been evaluated and identified in this study is currently being tested in a clinical study to validate its clinical value and outcome. Despite these protocols being tested on a GE scanner, results of this study can be applicable to other MDCT manufacturers as long as the dual-energy function is available on these scanners.
Our study has some limitations. First, although the experimental setup was developed to simulate a peripheral vascular tree, the idealized anatomic environment did not have surrounding organs, vessel walls, or tissues. The nature of body vessels varies from those in the phantom, and this could affect visualization of stents to some extent. Another limitation is that this custom-made phantom represented only an average-sized adult, while absorption of low-energy radiation will differ for large- or small-sized patients. Finally, the default manufacturer’s setting of 0.3 as the weighting factor for the low-energy tube was used to create virtual 120 KV reconstructions; however, there have been reports that a weighting factor of 0.5 improves image quality and therefore would be better for vascular imaging [
27]. This suggests that further studies are necessary to confirm our findings.
4. Experimental Section
4.1. Peripheral Artery Phantom Design and Stent Placement
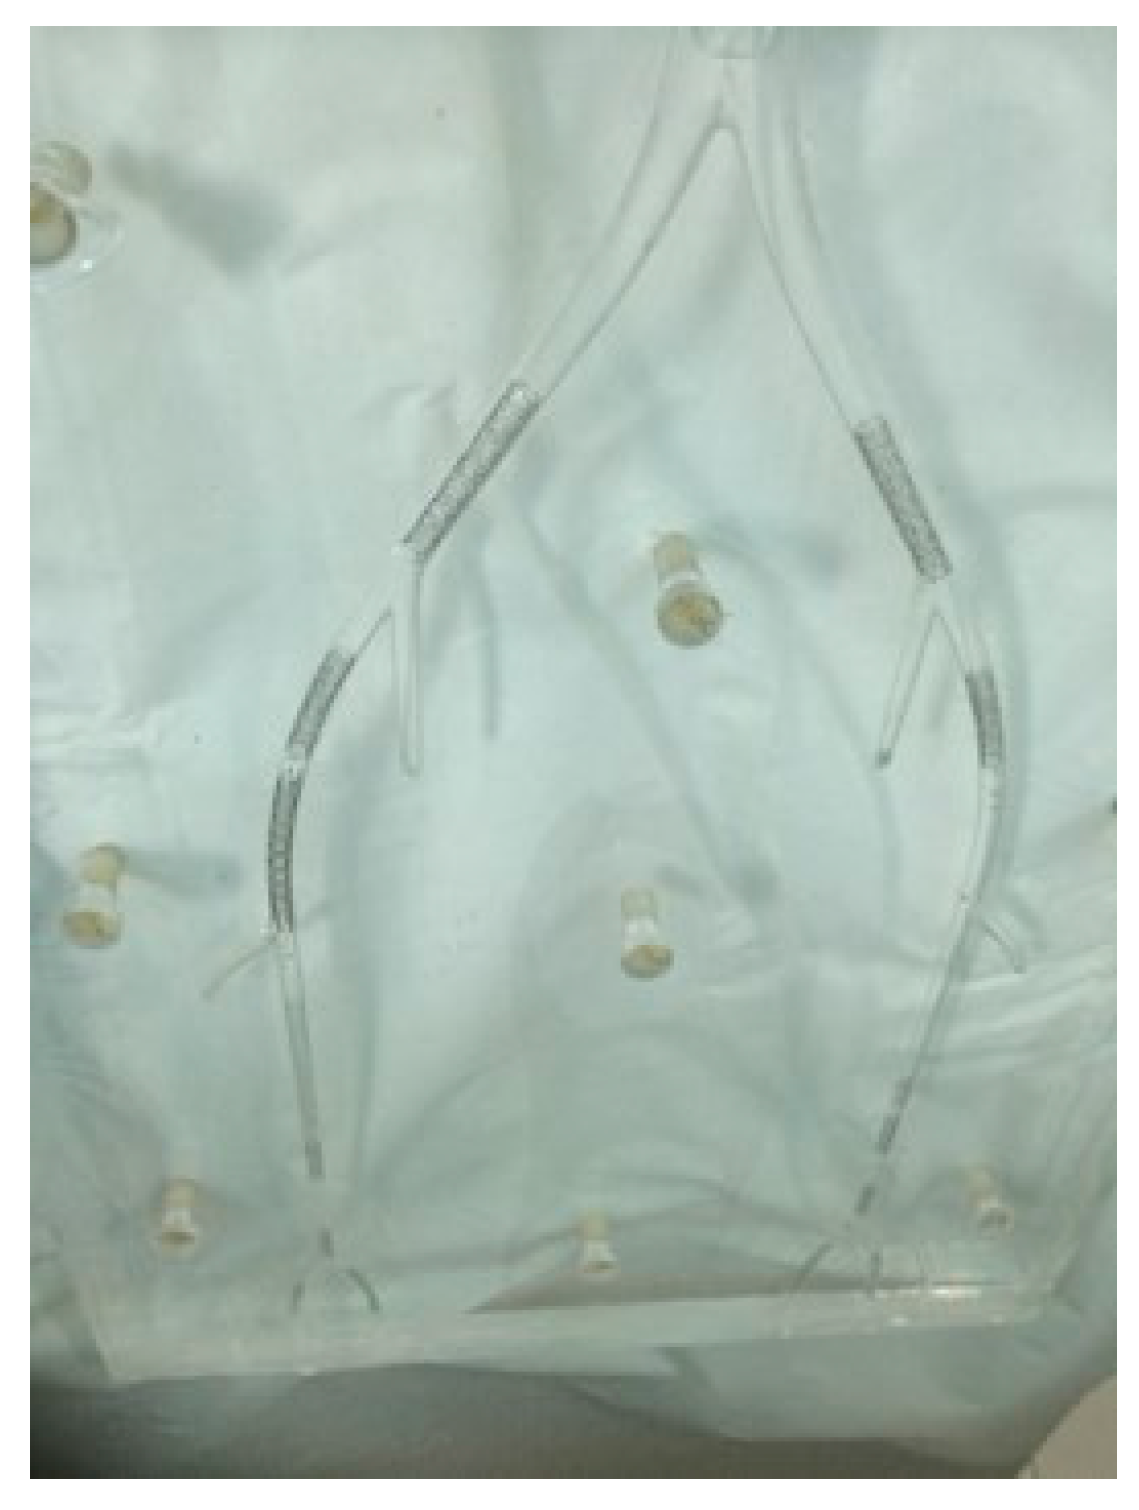
The custom-made peripheral arterial phantom consisting of a main peripheral arterial tree and arterial branches was developed with use of a computer-aided design program to represent realistic anatomic dimensions. The phantom was made of poly methyl methacrylate material with anatomical dimensions similar to the normal anatomy of a peripheral arterial tree, as shown in
Figure 6.
Figure 6.
Photograph of the phantom with stents insertion.
Figure 6.
Photograph of the phantom with stents insertion.
A total of 15 expired stents with different sizes (diameters), materials, and designs were used in the experiments. Details of the stents are shown in
Table 2. Of these fifteen stents, 10 were made of stainless steel (316 L), 3 of a platinum chromium alloy, 1 of Nitinol, and 1 of cobalt-superalloy. Stents were deployed into the simulated peripheral arteries modeled within the phantom. Stents with lumen diameters ranging from 2.75 to 3, 4, 5, 6, 7, and 8 mm, which closely matched their nominal diameter, were inserted into the arteries with two exceptions: the two Taxus Element stents with nominal diameters of 3 mm were inserted into simulated arteries with a diameter of 2.5 mm.
4.2. DECT Scanning Protocols and Image Reconstruction
DECT scans were performed with a fast kilovoltage-switching 64-slice CT scanner (Discovery CT750 HD; GE Healthcare, Milwaukee, WI, USA). Of the GSI-protocols that the manufacturer has developed as default settings, 3 GSI protocols (GSI preset protocols 36, 48, and 51) were selected for this study based on the lowest CTDIvol with acceptable diagnostic image quality to evaluate peripheral arterial stents. These GSI preset protocols have been fixed by the manufacturer to maintain constant tube power when switching the tube voltage back and forth. Therefore, changing the radiation dose in these preset protocols was only possible by adjusting the pitch and/or rotation time. As a result, the three available pitch values, 0.516, 0.984, and 1.375 were tested, with a beam collimation of 40 mm in all of these protocols and fixed rotation times of 0.5, 0.7, and 0.8 second per rotation, respectively, for each protocol. The phantom was then positioned in the gantry in an orientation parallel to the z-axis of the scanner.
The scanning parameters for the selected preset GIS-protocols are summarized in
Table 3. Images were acquired with coverage of 30 cm ranging from aortic bifurcation to arteries below knee. The raw data obtained from each scan were reconstructed in four image sets with five levels of adaptive statistical iterative reconstruction (ASIR), 0%, 30%, 40%, 50%, and 60%, and four keV of 60, 65, 70, and 75, respectively, with slice thicknesses of 1 mm with 50% reconstruction overlap. Tube current modulation was not available in dual energy acquisition in this system for all protocols.
Table 2.
Details of the examined stents.
Table 2.
Details of the examined stents.
| Model | Material | Manufacturer | Diameter (mm) | Length (mm) | Stent Diameter | Stents No. |
|---|
| Express LD | 316 L stainless steel | Boston Scientific | 7–8 | 27–37 | Large | (1, 2, 9 and 10) |
| Absolute .035 | Nitinol | Abbott | 6 | 40 | Medium | 3 |
| Wallstent-Uni Endoprosthesis | Cobalt-superalloy | Boston Scientific | 5 | 40 | Medium | 4 |
| Palmaz Genesis | 316 L Stainless steel | Cordis | 5 | 14 | Medium | (5, 6 and 11) |
| Taxus Element | 316 L Stainless steel | Boston Scientific | 2.75 | 32 | Small | (7, 14) |
| Taxus Libert 2nd Generation | Platinum Chromium | Boston Scientific | 3 | 28 | Small | 8 |
| Promus Element | Platinum Chromium | Boston Scientific | 4 | 16 | Medium | 12 |
| Express Vascular SD | 316 L Stainless steel | Boston Scientific | 4 | 15 | Medium | 13 |
| Monorail Liberté | 316 L Stainless steel | Boston Scientific | 3 | 28 | Small | 15 |
Table 3.
Details of scan parameters by protocols.
Table 3.
Details of scan parameters by protocols.
| Scan Parameters | Protocol 1 | Protocol 2 | Protocol 3 |
|---|
| GSI protocol | GSI-36 | GSI-48 | GSI-51 |
| Scan mode | Dual-energy | Dual-energy | Dual-energy |
| Tube potential | 80/140 kV | 80/140 kV | 80/140 kV |
| Tube current | 260 mAs | 260 mAs | 360 mAs |
| Rotation time (s) | 0.8 | 0.7 | 0.5 |
| Detector collimation (mm) | 64 × 0.625 | 64 × 0.625 | 64 × 0.625 |
| Pitch | 0.516, 0.984 and 1.375 | 0.516, 0.984 and 1.375 | 0.516, 0.984 and 1.375 |
| Table speed (mm/R) | 20.62 | 39.37 | 55 |
| Reconstruction kernel | | Standard | |
| Section thickness (mm) | 1 | 1 | 1 |
| Interval | 0.5 | 0.5 | 0.5 |
| keV | | (60, 65, 70, and 75) | |
| ASIR | | (30, 40, 50, and 60) | |
A simulated intravenous contrast medium (Omnipaque 350, GE Healthcare, Milwaukee, WI, USA) was used to represent the actual contrast-enhanced CT angiography. The contrast medium was diluted with normal saline to reach the attenuation of 250 Hounsfield unit (HU), which is the acceptable CT attenuation in peripheral CT angiography. The contrast medium was injected into the simulated arteries, which were sealed at both ends [
28].
4.3. Quantitative Image Assessment
Quantitative measurements were performed for DECT images at 1 mm slice thickness on a separate independent workstation with the GSI Viewer (ADW 4.6 General Electric Healthcare, Milwaukee, WI, USA). The mean HU was obtained by placing a circular region of interest (ROI) in selected areas of the phantom for the 15 stents (iliac arteries, common femoral arteries, superficial femoral arteries, popliteal arteries, anterior tibial arteries, peroneal arteries, and posterior tibial arteries). Two ROIs were selected; the first one was placed in the common femoral artery to measure the noise on an unstented area of the phantom. The second ROI was placed in the stented lumen area on the axial images to measure the noise for all stents without inclusion of stent struts, as shown in
Figure 7. For two stents—No. 7 and No. 14—it was difficult to place the ROI due to the small size of the stents with a limited lumen area being visualized; therefore, we excluded them from the analysis.
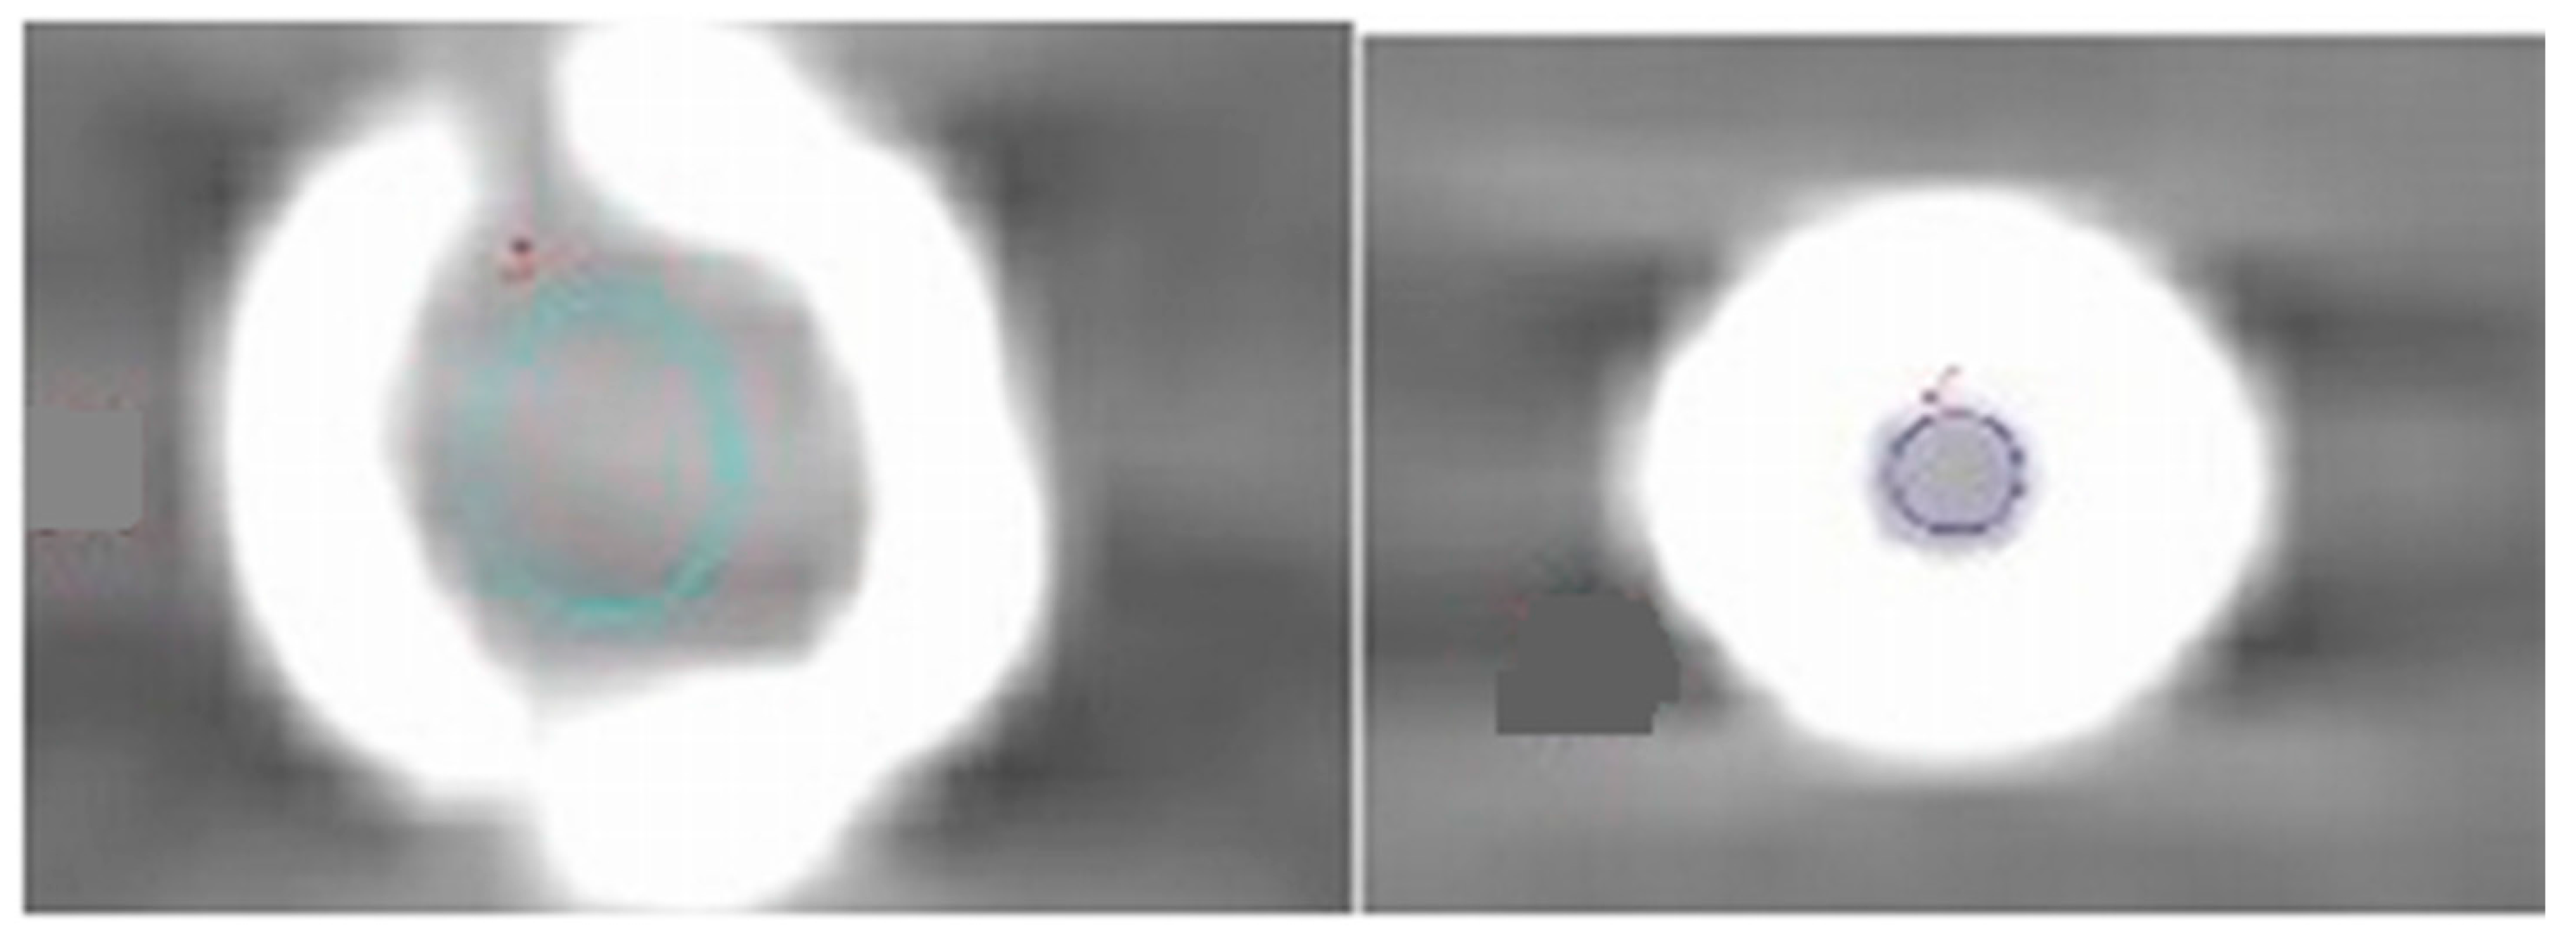
Figure 7.
The region of interest was placed in the inner stent lumen for measurement of image noise. The colored circles indicate measurement inside the stent lumen.
Figure 7.
The region of interest was placed in the inner stent lumen for measurement of image noise. The colored circles indicate measurement inside the stent lumen.
The selected ROI in an unstented area was in the femoral artery and within each stent at the same location for all protocols to measure the mean CT attenuation and also image noise that was defined as the standard deviation (SD). Moreover, the signal-to-noise ratio (SNR) for both the stented and unstented areas was calculated with the following formula:
4.4. Qualitative Assessment of Image Quality
Three radiologists with 5, 15, and 20 years of experience in CT imaging, respectively, performed qualitative evaluation on the GSI viewer with identical window width, window level, and FOV. Different MEI series from the each GSI protocol were evaluated randomly (between 60, 65, 70 and 75 keV within each ASIR), with a total of 180 series reviewed by each reviewer. The readers were blinded to all scanning parameters, except for the different energies, because different values of keV could easily be determined by visual inspection of the images. Intraobserver variability was not estimated because each radiologist assessed the images only once. Visualization of the stent lumen was assessed using a 3-point scale (1 = poor image quality and non-diagnostic; 2 = adequate image quality; and 3 = good image quality).
4.5. CT Dose
A fixed scan length of 29.9 cm was used for all examinations. The volume CT dose index (CTDIvol) and dose-length products (DLP) were recorded for calculation of effective dose, as shown in
Table 4. Effective dose (ED) was calculated for each protocol using a conversion factor of 0.015, which is taken from the normalized value of the effective dose per dose-length product for peripheral arteries [
29].
Table 4.
Summary of CTDIvol values, dose-length products, and effective doses across the protocols.
Table 4.
Summary of CTDIvol values, dose-length products, and effective doses across the protocols.
| GE Protocol | Pitch | CTDIvol (mGy) | DLP (mGy × cm) | Effective Dose (mSv) |
|---|
| GSI-36 | 0.516 | 39.33 | 863.86 | 12.96 |
| GSI-36 | 0.984 | 10.30 | 457.56 | 6.86 |
| GSI-36 | 1.375 | 7.73 | 341.00 | 6.47 |
| GSI-48 | 0.516 | 17.28 | 759.13 | 11.39 |
| GSI-48 | 0.984 | 9.05 | 402.10 | 6.03 |
| GSI-48 | 1.375 | 6.48 | 299.72 | 4.50 |
| GSI-51 | 0.516 | 19.74 | 867.57 | 13.01 |
| GSI-51 | 0.984 | 10.34 | 459.66 | 6.89 |
| GSI-51 | 1.375 | 7.40 | 342.69 | 5.14 |
4.6. Statistical Analysis
All of the data were entered into SPSS Statistics version 22.0 (SPSS Inc., Chicago, IL, USA) for statistical analysis. Two data sets—the noise level and SNR (independent variable) responses obtained when ASIR = 0—were used to produce 36 observations in a 3-factor factorial analysis of variance (univariate ANOVA) model: GSI (3-levels: GSI-36, GSI-48, GSI-51), pitch (3-levels: 0.516, 0.984, 1.375), and keV (4-level: 60, 65, 70, 75).
The second part of the statistical analysis relates to the noise level and SNR in the nonstented area when ASIR ≥ 40; 3-levels: 40, 50, 60 were used to produce 108 observations in a 4-factor factorial model. The highest order interaction in each analysis was employed as an estimate of residual (error) variation; therefore, when there was no significant interaction, the main effect was considered. Statistical significance was assessed by comparing the p values obtained in the F-tests corresponding to the main effect of GSI as well as to the interaction effect of pitch, keV, and ASIR. All tests were performed at the 5% significance level.


 ,
, 


