Article

Column Selection for Biomedical Analysis Supported by Column Classification Based on Four Test Parameters

Department of Pharmaceutical Chemistry, Medical University of Gdańsk, Hallera 107, 80-416 Gdańsk, Poland
*
Author to whom correspondence should be addressed.
Int. J. Mol. Sci. 2016, 17(1), 136; https://0-doi-org.brum.beds.ac.uk/10.3390/ijms17010136
Submission received: 8 October 2015 / Revised: 11 January 2016 / Accepted: 13 January 2016 / Published: 21 January 2016
(This article belongs to the Section Physical Chemistry, Theoretical and Computational Chemistry)

Abstract

:
This article focuses on correlating the column classification obtained from the method created at the Katholieke Universiteit Leuven (KUL), with the chromatographic resolution attained in biomedical separation. In the KUL system, each column is described with four parameters, which enables estimation of the FKUL value characterising similarity of those parameters to the selected reference stationary phase. Thus, a ranking list based on the FKUL value can be calculated for the chosen reference column, then correlated with the results of the column performance test. In this study, the column performance test was based on analysis of moclobemide and its two metabolites in human plasma by liquid chromatography (LC), using 18 columns. The comparative study was performed using traditional correlation of the FKUL values with the retention parameters of the analytes describing the column performance test. In order to deepen the comparative assessment of both data sets, factor analysis (FA) was also used. The obtained results indicated that the stationary phase classes, closely related according to the KUL method, yielded comparable separation for the target substances. Therefore, the column ranking system based on the FKUL-values could be considered supportive in the choice of the appropriate column for biomedical analysis.

Graphical Abstract

1. Introduction

The continuously broadened application of reversed-phase high-performance liquid chromatography (RP-HPLC, RPLC) in many various areas, including drug analysis, has expanded the demand for new generations of RPLC stationary phases packing columns of different geometry which would offer better selectivity, efficiency and chemical stability. In effect, several hundred different RPLC columns are commercially available on the market today. However, chromatographic stationary phases often differ in terms of the ligand type and the characteristics of the silica material used as support, as well as in the technique applied to synthesise the packing material [1,2]. Moreover, the polar and ionic features of the RPLC phases responsible for secondary interaction mechanisms often define the unique attributes of the specific RPLC-phase. In consequence, although many of the RPLC stationary phases are nominally identical, their chromatographic performance can differ considerably, making the proper selection of a suitable stationary phase for a particular chromatographic analysis challenging [3,4]. This is the case when e.g., the required column is not available and the analyst needs to find the best alternative. Furthermore, the classification system can be a useful tool when developing a new method. Many papers reporting methods of characterising stationary phases have been published to date to resolve this problem, including the method proposed by Galushko [5], the chromatographic tests reported by Stella et al. [6,7], the quantitative structure-retention relationships (QSRRs) delivered by the Kaliszan group [8,9,10,11], the hydrophobic-subtraction model (HSM) published by the Snyder-Dolan group [12,13], and the alternative propositions to the LC column selectivity introduced by Tanaka [14], Euerby [15,16,17,18], Visky [19], Veuthey [20,21,22] and others [23,24,25,26,27]. Another method—a simple chromatographic test procedure of characterising and ranking RPLC C18 columns—has been reported by Hoogmartens and his co-workers from the Katholieke Universiteit Leuven (KUL) [28,29]. In the KUL approach, each column is described against four test parameters: the retention factor of amylbenzene (kamb) estimating hydrophobicity, the relative retention factor of benzylamine/phenol at pH 2.7 (rkba/ph pH2.7) indicating possible silanol activity, the relative retention factor of triphenylene/o-terphenyl (rktri/o-ter) describing steric selectivity, and the retention factor of 2,2′-dipyridyl (k2,2′-d) reflecting silanol activity and metal impurities [30]. Stage one in the KUL procedure involves choice of four reference parameters corresponding with a freely selected reference column, or of the specific reference column. Then, the FKUL-values for the tested columns are established according to the formula [31]:
FKUL = (kamb, refkamb, i)2 + (rkba/ph pH2.7, refrkba/ph pH2.7, i)2 + (rktri/o-ter, refrktri/o-ter, i)2 + (k2,2′-d, refk2,2′-d, i)2
Finally, the ranking list of the tested columns based on the FKUL-values is calculated under the rule that the smaller the FKUL-value, the more similar column i is to the reference column. This means that columns with FKUL < 2 offer the highest probability of selecting the appropriate reference alternative. The probability goes down in the case of stationary phases with 2 < FKUL < 6, and the lowest value achieved characterises columns treated as low ranking (FKUL > 6) [31,32].
Of course, any column classification method needs to undergo an important test to verify whether stationary phases with similar parameters will give comparable separations in real pharmaceutical and biomedical applications. In the literature, one can find many reports describing the relationships between column ranking and selectivity in the analysis of different active substances [28,29,30,31,32,33,34,35]. The KUL method was also investigated against other column classification methods [32,36,37,38]. Unfortunately, most papers only concern comparative analyses of the FKUL parameter values determined for stationary phases against the pharmacopoeial test known as System Suitability Test (SST) or Chromatographic Response Function (CRF), conducted to evaluate the separation of such columns in real pharmaceutical applications [28,29,30,31,32,33,34,35,36,37]. However, both parameters are able to define only experimentally determined overall selectivity of selected compounds. In other words, the two parameters provide a general description of the pharmaceutical separation without demonstrating that the stationary phases classified as comparable by the KUL method actually guarantee analogy between the results of the pharmaceutical analysis and those obtained using the reference column. The KUL test procedure has been evaluated for its usefulness in real pharmaceutical applications based on multidimensional evaluation of experimental data [38,39,40,41], however the KUL approach has been applied to real biomedical analysis involving a biological matrix only once [38]. Therefore, there is a need for further studies to verify reliability of the KUL approach in clinical practice. The studies are important for analysts, because the KUL method offers the advantage of being less complicated and easier to perform while giving results comparable to those obtained under other column classification methods. The latter fact implies that from a practical point of view the KUL method can be attractive to analysts developing new methods, and whenever separation “equivalent” to the original column is required in clinical practice.
In the case study, a new biomedical application—separation of moclobemide (M0) and its two metabolites: Ro 12-5637 (M1) and Ro 12-8095 (M2) (Figure S1) in human plasma samples in accordance with the previously reported HPLC method [42] was chosen as a typical clinical application, and performed on 18 columns previously characterised chromatographically. In the reported method, the Nucleosil 100-5 C18 column (Nuc_C18/125/5) was used, and therefore this particular column was chosen as the reference, and the FKUL-values were established for the other columns described by various physicochemical parameters. Next, the KUL characteristics of all columns and the column test performance results reflecting the raw retention parameters of M0 and its two metabolites, including the retention times (tR), and resolutions (Rs) of the peaks of interest which, as opposed to the CRF parameter clearly distinguish each real biomedical separation, were evaluated using factor analysis (FA). This chemometric analysis was performed to evaluate whether the column classes, closely related in accordance with the KUL characteristics of their physicochemical properties, demonstrated a similar separation for M0 and its two metabolites. For a clearer interpretation of the obtained results, FA was carried out on the same number of columns the number used earlier for classification. Then, the FA results were compared to the results of the principal component analysis (PCA) and hierarchical clustering analysis (HCA) previously reported in the literature [28,38,43].

2. Results and Discussion

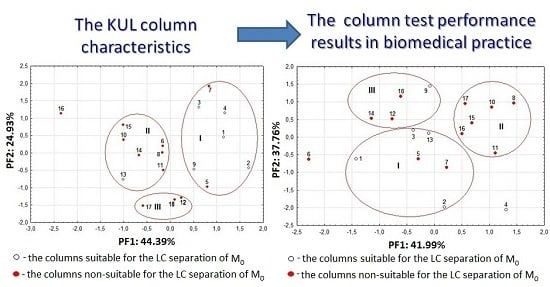
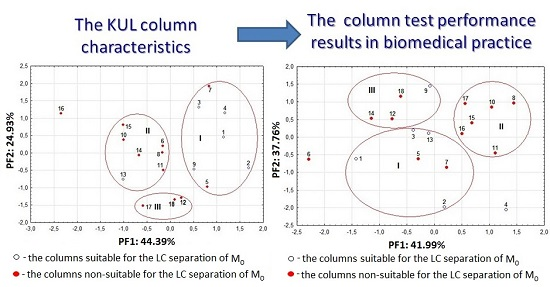
2.1. Column Classification

In the study, 17 brands of stationary phases (and 18 columns), their specifications as described in Table S1, were tested. Each column was described against four chromatographic parameters: k′amb, rk′ba/ph pH2.7, rk′tri/o-ter, and rk′2,2-d, all calculated on the basis of the retention data of the test analytes, obtained by strictly defined LC methods (Table S2). This enabled calculation of the FKUL-values for reference column (Nuc_C18/125/5). The obtained KUL characteristics and the ranking list are summarised in Table 1. The data indicate that the hydrophobicity described by kamb was highest for Sym_C18, while the lowest value was observed for Nuc_C8. Against the criterion of the rktri/o-ter values indicating the steric selectivity, the studied column order was observed to ascend from Inert_C8 to SymShield_C8. When the rkba/ph pH2.7 parameter was taken into account, silanol activity was found to rise beginning with Sym_C8 and ending with Nuc_C8. As concerns the k2,2′-d parameter reflecting possible silanol activity and metal impurities, the highest value was found for Nuc_C18/250/5, whereas the lowest was noted for SymShield_C8. Moreover, when the Nuc_C18/125/5 column was selected as the reference, only Nuc_C18/250/5 was identified as high ranking. The other twelve columns fell in middle ranking positions. The columns from Inert_C8 to SynMax_RP (as indicated in Table 1) resulted in FKUL values greater than 6 indicating their physicochemical properties are significantly different. In fact, those columns shared significantly lower rk′ba/ph pH2.7 values, while the k′amb, rk′tri/o-ter, and rk′2,2-d parameters varied when compared to the reference.
Table 1. The column ranking for the separation of moclobemide, obtained using the FKUL-values compared against the reference Nuc_C18/125/5 column.
Analytical ColumnColumn ParametersFKULThe Position in the Ranking List (Column No.)
kambrktri/o-terrkba/ph pH2.7k2,2′-d
Nuc_C18/125/55.091.570.11621.070.001
Nuc_C18/250/56.091.610.10226.011.702
SynPol_RP2.741.310.08820.282.353
Varian_C183.201.180.09722.623.044
NovPack_C189.421.390.10818.213.975
Nuc_C18/125/106.781.240.10412.364.506
Nuc_C81.081.750.12519.354.737
SynFus_RP6.541.050.05017.614.748
Luna_C18 (2)7.821.130.08717.614.889
Sym_C85.551.080.02914.634.9510
Aqua_C188.181.240.07415.345.0711
Inert_ODS29.671.680.07219.255.9412
NucHD_C188.761.510.05312.535.9613
GemNX_C187.191.120.06113.125.9714
Inert_C84.611.020.04013.406.2215
SymShield_C83.461.780.0317.837.1716
Sym_C1810.571.530.04915.629.0417
SynMax_RP10.041.150.04619.439.1218
Meaning of symbols is explained in the text. The columns non-suitable for the separation of the analytes are indicated in bold.
Next, an FA based on the varimax criterion derived from the auto-scaled KUL results calculated for the 18 brands of columns was performed. This chemometric tool allows for reduction of the number of variables and the detection of the structural relationships between the variables and objects without the loss of an essential information [44]. Thus, an FA enables a more detailed interpretation of the column classification results. Surprisingly, the same stationary phase packing two columns of different lengths lead to different values of k′amb and k′22′-d, which seems anormal. Consequently the two FKUL values for both the same stationary phase and columns 1 and 2 (see Table 1) are different. This could probably due to different column-to-column and batch-to-batch reproducibility of this chromatographic support. For the purposes of the analysis, the numbering of the stationary phases as reported in Table 1 was retained. The two-dimensional FA plots for the variables and objects are illustrated in Figure 1A,B, respectively.
Figure 1. The FA plot of the variables (A) and objects (B) established based on the auto-scaled KUL test parameters calculated for the 18 columns studied.
Ijms 17 00136 g001
Notably, the 44.39% data variability explained by the first principal factor (PF1), was caused primarily by the variability of rk′2,2′-d and rk′ba/ph pH2.7. The two variables were located, close to each other, on the upper right side of the plot (Figure 1A). It confirms that silanol activity (rk′2,2′-d and rk′ba/ph pH2.7) and metal impurities (rk′2,2′-d) are of predominant influence on differentiation of the stationary phases based on KUL classification results. In fact, all stationary phases studied, except for column SymShield_C8, shared high rk′2,2′-d parameters (>12), though their values differed (Table 1). As concerns rk′ba/ph pH2, various low (<0.1) and intermediate (<0.3) parameter values were obtained in calculations. Hence, those stationary phases demonstrate low or intermediate silanol activity.
The k′amb and rk′tri/o-ter parameters were found positioned at the bottom and on the upper left side of the graph, where the variability of k′amb was explained mainly by the PF2. In other words, the FA results showed that steric selectivity of the stationary phases estimated by the rk′tri/o-ter parameter did not differentiate the columns studied to any significant extent. In fact, according to Table 1, relatively low values of these parameters (<1.7) were calculated for 16 tested stationary phases. Only Nuc_C8 and SymShield_C8 proved having higher steric selectivity (rk′tri/o-ter > 1.7). In summary, the first two PFs together account for 69.32% of the total variance of the original data set. The data corroborate the previously reported literature data, where the positions of the variables on the PCA plot were comparable to those observed in the FA plot [28].
The obtained classification data are consistent with the data reported in Ref. [43] where the stationary phases, except for Nuc_C18/250/5, were classified by the QSRR models supported by two chemometric tools, namely the principal component analysis (PCA) and hierarchical clustering analysis (HCA). The PCA results based on the QSRR characteristics, including the 17 columns tested in this investigation, also showed that those seventeen stationary phases were respectively distributed in the same three clusters, except for column 11 which was out of cluster II in the PC analysis. Among them, eight stationary phases (Nuc_C18/125/5; SynPol_RP; NovPack_C18; SynFus_RP; Luna_C18; Sym_C8; Inert_ODS2; SynMax_RP) were found in the same positions on the PCA and FA plots built by the QSRR and the KUL methods, respectively. In other words, both approaches to the selection of a column resulted in a similar classification, even if the statistical methods used were different (FA and PCA). The data further indicated that correspondence between the KUL and QSRR characteristics was higher than that obtained for QSRR and other column classification systems, previously described in the literature [32,36,37,38]. On the other hand, it is interesting whether the probability of suitable stationary phase selection in clinical practice is comparable to the probability of the QSRR models.

2.2. Column Selectivity in Analysis of Moclobemide

As mentioned above, the verification of the theoretical KUL results in biomedical analysis for 18 columns was based on the measurement of M0 and its two metabolites—Ro-1256 (M1) and Ro 12-8095 (M2) in human plasma, performed according to the previously reported LC method [42]. In the assay, the same chromatographic conditions were applied for all examined columns in the analysis of the Quality Control samples (QCs) and of the real samples collected from healthy volunteers after single application of M0. Moreover, separation for all analytes was assessed against the main criterion of peak resolutions Rs ≥ 1.5. The obtained retention data confirmed that the tR values of M0 fell in the range of 1.50–7.95 min, and the last detected compound (I.S.) was recorded in between 3.08 and 16.53 min (Table 2).
Notably, the highest ranked column, Nuc_C18/250/5, and two stationary phases of FKUL < 4 were suitable for the LC separation of M0 and its two metabolites (3/4—75%) (Table 1). As concerns the stationary phases with the FKUL-values falling between 4 and 6, only two columns (No. 9 and 13) yielded proper LC analysis of the compounds of interest (2/9—22.2%), whereas no columns in the lower ranking positions (FKUL > 6) were suitable for the analysis (0/4—0%). This is consistent with the commonly accepted rule that the probability of choosing the proper column decreases with the increasing FKUL-values. Notably, all columns suitable for the LC analysis of the analytes, except for NucHD_C18, were characterised by high values of the rkba/ph pH2.7 and rk′2,2-d parameters. This indicates that higher silanol activity and metal impurities increase the probability of proper LC separation. The observation may be related with the fact that all compounds of interest have atoms of oxygen and nitrogen in their structure, able to create dipole-dipole or dipole-dipole induced interactions with the stationary phase (Figure S1).
Table 2. Summary of data set of tR and Rs for M0, its two metabolites and I.S. in column performance test for eighteen columns studied.
Substances:M0M1M2Phenacetin (I.S.)
No.Analytical Column:tRtRRstRRstRRs
1Nuc_C18/125/52.512.951.615.158.395.531.64
2Nuc_C18/250/53.954.562.567.318.448.753.25
3SynPol_RP3.073.462.747.4014.818.433.31
4Varian_C187.959.351.8210.331.5811.952.02
5NovPack_C183.464.051.717.165.427.830.83
6Nuc_C18/125/101.501.631.133.084.833.080.00
7Nuc_C83.964.811.9711.088.4811.080.00
8SynFus_RP4.034.030.0014.1331.4316.533.98
9Luna_C18 (2)1.612.285.548.1526.919.564.09
10Sym_C83.803.800.0012.9024.4215.034.96
11Aqua_C184.555.150.7813.6111.3015.411.91
12Inert_ODS22.202.200.007.4318.848.763.32
13NucHD_C183.453.952.608.1314.249.483.41
14GemNX_C182.062.060.005.7317.207.004.03
15Inert_C83.903.900.0011.7118.8613.684.24
16SymShield_C83.753.750.0011.1614.1314.233.27
17Sym_C183.333.330.0011.1029.6313.064.05
18SynMax_RP2.212.210.006.8323.688.735.89
Meaning of symbols is explained in the text. The columns non-suitable for the LC separation of the analytes are indicated in bold.
Next, an FA derived from the auto-scaled column test performance results was performed for the 18 columns studied. The FA plots for the variables and objects are shown in Figure 2A,B, respectively.
It should be emphasised that the variance of the tR M2 and tR I.S., and tR M0 variables was mainly due to the PF1. The tR M2 and tR I.S. variables were located, close to each other, in the right part of the middle section of the graph, while tR M0 and the tR M1 parameter were found on the bottom side of the plot. The variability of Rs M2, Rs I.S., both positioned on the upper side of the graph, and that of the tR M1 was explained mainly by the PF2. Thus, the first two PFs explained 79.75% of the data variability (Figure 2A). When the FA plot was compared to the loading of the PC plot reported in Reference [43] as Figure 4A, it could be noticed that the location of the variables was similar even though the variability of the tR M1 parameter was mainly explained by PF2, whereas in the PCA it was related to PC1.
Figure 2B shows the FA plot for the objects where almost all columns were positioned in three clusters. Only two columns (No. 4 and 6) were found to be outliers on opposite sides of cluster I. It should also be noted that the locations of the columns studied on the FA plot were generally well correlated with the FKUL-values established by the KUL procedure (Table 1). Hence, columns No. 1–3, 5, 7, and 13 were positioned in cluster I. For these, the intermediate values of tR M0 and the higher Rs of the M1 parameters were calculated. Ultimately, four columns (No. 1–3 and 13) were identified as suitable for an appropriate LC analysis of the target compounds. The columns located in cluster II were characterised by insufficient Rs of the M1, despite long-time analysis (Table 2). Consequently, none of the columns can be used for analysis of M0 and its metabolites. The columns in cluster III (Figure 2B) offered a shorter and intermediate tR of the target compounds, while their Rs parameters for M0, M2 and I.S. were intermediate or higher (Table 2). Nevertheless, the Rs of M1 < 1.5 were calculated for column No. 12, 14, and 18. Concluding, only column No. 9 of the phases in group III was suitable for separation of the analytes in human plasma (Figure 2B). Moreover, as mentioned above, two brand columns were found to be outliers. Column No. 4, described by the highest values of tR M0 and tR M1 and a high Rs M1 parameter, ensured appropriate separation of the target compounds (Table 2). In contrast, the lowest tR of the analytes was calculated for column No. 6. Unfortunately, because of insufficient separation of M1 and the I.S., this stationary phase proved unsuitable for the analysis of M0 and its metabolites in human plasma.
Figure 2. The FA plot for the variables (A) and objects (B) established for the auto-scaled retention parameters (tR and Rs) of the compounds of interest during the column performance test based on the LC analysis of M0 and its two metabolites.
Ijms 17 00136 g002
Notably, most columns were located in the same positions on both the FA plot based on four column parameters (Figure 1B), and on the FA plot derived from the column test performance data (Figure 2B). Therefore, almost all columns from cluster I (5/6) were also found in cluster I, as presented in Figure 1B, while the column No. 8, 10, 11, and 15 were positioned in cluster II. On the other hand, some columns, namely 4, 6, 9, 13, 14, 16 and 17, were found in different positions than on Figure 1B. Among them, columns 4, 6, 9 and 13 were also incorrectly classified by the QSRR models [43], where 24 stationary phases were tested, including the 17 stationary phases tested in this investigation. The differences can, to an extent, be explained by the fact that the column temperature used in the KUL and QSRR procedures was higher than in the column performance test, which might have affected the chromatographic behaviour of the analytes [45,46].
Nevertheless, it is worth emphasising that five column classes, closely linked by the KUL method and falling in cluster I (Figure 1B), ensured suitable separation of M0 and its metabolites in human plasma. Therefore, the KUL procedure proved capable of increasing the probability of appropriate selection of the column from the initial value of 33.3% (6/18—Table 1) to 71.42% (5/7—cluster I, Figure 1B). Moreover, verification of the test results confirmed that the application of the KUL method yielded comparable results to those of the QSRR approach. In a previous study [43], the probability of choosing the suitable column increased from the initial value of 37.5% to 62.5% when using the QSRR models, or to 66.6% in accordance with the PCA and HCA. Hence, the present study confirms the usefulness of the KUL method in the clinical practice involving analysis of more complicated biological matrices. Moreover, the probability of selecting the appropriate column is slightly higher when the traditional way of comparing the FKUL values, rather than an FA assay, is employed. On the other hand, graphical visualisation of the experimental data sets under the FA enables more accurate interpretation of the KUL classification and the column test performance results. The results can be of interest to the analysts in both their cognitive and practical aspects, because the KUL procedure is less complicated and easier to perform than other column classification systems.

3. Experimental Section

3.1. Column Examination

In this study, the eighteen investigated RPLC columns were delivered by the manufacturers or distributors. Their characteristics are given in Table S1.

3.2. Chemicals

The test substances used in the KUL method, namely uracil, o-terphenyl, triphenylene, benzylamine, amylbenzene (n-pentylbenzene), and 2,2′-dipyridyl, were purchased from Sigma-Aldrich (St. Louis, MO, USA), whereas phenol was delivered by POCH (Gliwice, Poland). For preparation of the mobile phases, the HPLC grade of methanol was obtained from Merck (Darmstadt, Germany), while potassium dihydrogen phosphate and 85% ortho-phosphoric acid, both reagents of the analytical-reagent grade, were delivered by Sigma-Aldrich (St. Louis, MO, USA). All reagents were used as received without further purification. Water was pre-treated in a Milli-Q Water Purification System (Millipore Corporation, Bedford, MA, USA).
Moclobemide (M0) used in the column performance test was purchased from Biovena Pharma (Warsaw, Poland), whereas its two metabolites: Ro 12-5637 (M1) and Ro 12-8095 (M2) were supplied by Hoffmann-La Roche Ltd. (Basel, Switzerland). Phenacetin, applied as the internal standard (I.S.), was donated by Sigma-Aldrich (St. Louis, MO, USA). Acetonitrile and dichloromethane, both solvents of HPLC grade, were obtained from Merck (Darmstadt, Germany), while sodium hydroxide was delivered by POCH (Gliwice, Poland). The control plasma samples were obtained from healthy volunteers.

3.3. Equipment and LC Conditions

All LC determinations were carried out on an ACME 9000 system (Younglin Instrument Corporation, Anyang, the Republic of Korea), containing of a pump (SP 930D), thermostat (CTS30), auto-sampler equipped with a 20 μL loop, and a 730D UV/VIS detector. The AutoChro-3000 Chromatography Data System was applied for data acquisition.
In order to classify the columns using the KUL procedure, three isocratic chromatographic methods were applied to the selected analytes, as shown in Table S2. In each method, the column temperature of 40 °C and the flow rate of 1 mL/min were used while the UV detector was set at 254 nm.
The LC analysis of M0 and its two metabolites in human plasma was carried out using a mixture of acetonitrile and water adjusted to pH 2.7 with 85% ortho-phosphoric acid (25:75, v/v) as the mobile phase, at the flow rate of 1 mL/min. The analytes were determined with the UV detector set at 239 nm, and the LC system was maintained at the room temperature.

3.4. Column Classification

To classify the columns, three chromatographic methods were used in a defined order (A-B-C) (Table S2). The relative retention factor benzylamine/phenol at pH 2.7 (rkba/ph pH2.7) in method A, the retention factor of 2.2′-dipyridyl (k2,2′-d) in method B, the retention factor of amylbenzene (kamb), and the relative retention factor triphenylene/o-terphenyl (rktri/o-ter) in method C were established according in Equations presented in Table S2 using the dead time calculated in method C employing uracil. All determinations were done three times resulting in the RSD values below 1%. Based on the obtained results, the KUL characteristics of all examined columns containing the four chromatographic parameters were calculated. Next, upon choosing the Nuc_18/125/5 stationary phase as the reference, the FKUL-values for the other columns were established according to Equation (1). For this purpose, the software available on-line at http://pharm.kuleuvan.be/pharmchem/Pages/ccs.html was used, and all examined columns were numbered according to their position on the ranking list. In addition, factor analysis (FA) was performed using the Statistica 12.0 package (StatSoft, Tulsa, OK, USA) based on the auto-scaled values of four column parameters, established for all columns.

3.5. Column Test Performance

The practical test of the KUL method for biomedical analysis was performed on 18 RPLC columns during the separation of moclobemide (M0) and its two metabolites: Ro 12-5637 (M1) and Ro 12-8095 (M2) in human plasma samples prepared according to the sample preparation procedure prescribed in Reference [42]. Both the QCs and real human plasma samples from healthy volunteers collected after administration of a 150 mg dose of M0 were treated in the same manner. In brief, phenacetin at the concentration of 800 ng/mL was added to 1 mL of the human plasma sample to serve as the internal standard (I.S.). Moreover, while preparing the QCs containing the target compounds at low, middle, and high concentration levels appropriate volumes of the working standard solutions of the analytes at a concentration of 10 μg/mL were added to 1 mL of the human plasma sample to achieve 100, 800, and 1500 ng/mL for M0; 60, 100, and 150 ng/mL for M1; and 50, 500, and 1000 ng/mL for M2, respectively. Next, the sample was mixed with 4 mL of dichloromethane and 200 μL of 1 M NaOH, mechanically shaken for 10 min and centrifuged for 15 min (1000 g). Then, dichloromethane was transferred to a clean test tube and the solvent evaporated to dryness in a water bath at 45 °C under an air stream. Finally, the residue was reconstituted in 200 μL of acetonitrile-water mixture (3:2, v/v), centrifuged at 8000× g for 5 min, and 20 μL of the aliquot was injected into the LC system.
The study began with the LC analysis of M0 and its two metabolites, performed on the Nuc_C18/125/5 column. Then, the other examined stationary phases were applied to analyse the target compounds in the same chromatographic conditions as those reported in Section 3.3, and the retention parameters, namely tR and Rs of the peaks of interest for M0, M1, M2 and the I.S., were evaluated for all columns studied. Finally, an FA based on the auto-scaled column test performance results established for the 18 columns studied was performed.

4. Conclusions

In the study, LC columns were classified based on the KUL method and their selectivity toward moclobemide and its two metabolites in human plasma, using 18 RPLC columns. For the evaluation of similarities and differences between the column classification system and the column test performance, the traditional approach of comparing the calculated FKUL-values was adopted alongside a factor analysis (FA) using the varimax algorithm as an interesting alternative to the principal component analysis (PCA) and hierarchical clustering analysis (HCA). In general, both the traditional and the multivariate approach based on the FA enabled more appropriate column selection. Moreover, the FKUL-values obtained under the KUL method and the localisations of the columns studied on the FA plots, were significantly correlated. The FA results also indicated that the column classes, closely related according to the KUL method, offered comparable separation of the analytes. The fact confirms that the KUL classification method yields results which allow for the selection of columns that will be similar to or dissimilar from the reference column at a relatively high certainty level. Thus, the column ranking system based on four column parameters could be considered supportive in the choosing of the appropriate column for the specific biomedical application.

Supplementary Materials

Supplementary materials can be found at https://0-www-mdpi-com.brum.beds.ac.uk/1422-0067/17/1/136/s1.

Acknowledgments

This project was supported by the Ministry of Science and Higher Education of the Republic of Poland, from the quality—promoting subsidy, under the Leading National Research Centre (KNOW) programme for the years 2012–2017.

Author Contributions

Alina Plenis conceived, designed and performed the experiments, participated in the statistical work, and wrote the paper; Tomasz Bączek conceived and designed the experiments, and participated in the statistical work; Natalia Rekowska participated in the experiment works.

Conflicts of Interest

The authors declare no conflict of interest.

References

  1. Euerby, M.R.; Petterson, P. A classification of commercially available RPLC columns—A tool for rational selection. LC-GC Eur. 2000, 13, 665–677. [Google Scholar]
  2. Jandera, P.; Novotná, K. Characterization of high-pressure liquid chromatography columns using chromatographic methods. Anal. Lett. 2006, 39, 2095–2152. [Google Scholar] [CrossRef]
  3. Forlay-Frick, P.; Fekete, J.; Héberger, K. Classification and replacement test of HPLC systems using principal component analysis. Anal. Chim. Acta 2005, 536, 71–81. [Google Scholar] [CrossRef]
  4. Lesellier, E.; West, C. Description and comparison of chromatographic tests and chemometric methods for packed column classification. J. Chromatogr. A 2007, 1158, 329–360. [Google Scholar] [CrossRef] [PubMed]
  5. Galushko, S.V.; Kamenchuk, A.A.; Pit, G.L. Calculation of retention in reversed-phase liquid chromatography: IV. ChromDream software for the selection of initial conditions and for simulating chromatographic behaviour. J. Chromatogr. A 1994, 660, 47–59. [Google Scholar] [CrossRef]
  6. Stella, C.; Rudaz, S.; Veuthey, J.-L.; Tchapla, A. Silica and other materials as supports in liquid chromatography. Chromatographic tests and their importance for evaluating these supports. Part I. Chromatographia 2001, 53 (Suppl. 1), S113–S131. [Google Scholar] [CrossRef]
  7. Stella, C.; Rudaz, S.; Veuthey, J.-L.; Tchapla, A. Silica and other materials as supports in liquid chromatography. Chromatographic tests and their importance for evaluating these supports. Part II. Chromatographia 2001, 53 (Suppl. 1), S132–S140. [Google Scholar] [CrossRef]
  8. Kaliszan, R.; van Straten, M.A.; Markuszewski, M.; Cramers, C.A.; Claessens, H.A. Molecular mechanism of retention in reversed-phase high-performance liquid chromatography and classification of modern stationary phases by using quantitative structure–retention relationships. J. Chromatogr. A 1999, 855, 455–486. [Google Scholar] [CrossRef]
  9. Bączek, T.; Kaliszan, R.; Novotńa, K.; Jandera, P. Comparative characteristics of HPLC columns based on quantitative structure-retention relationships (QSRR) and hydrophobic-subtraction model. J. Chromatogr. A 2005, 1075, 109–115. [Google Scholar] [CrossRef] [PubMed]
  10. Kaliszan, R. QSRR: Quatitative Structure-(Chromatographic) Retention Relationships. Chem. Rev. 2007, 107, 3212–3246. [Google Scholar] [CrossRef] [PubMed]
  11. Plenis, A.; Konieczna, L.; Miękus, N.; Bączek, T. Development of the HPLC method for simultaneous determination of lidocaine hydrochloride and tribenoside along with their impurities supported by the QSRR approach. Chromatography 2013, 76, 255–265. [Google Scholar] [CrossRef] [PubMed]
  12. Snyder, L.R.; Dolan, J.W.; Carr, P.W. The hydrophobic-subtraction model of reversed-phase column selectivity. J. Chromatogr. A 2004, 1060, 77–116. [Google Scholar] [CrossRef]
  13. Snyder, L.R.; Dolan, J.W.; Carr, P.W. A new look at the selectivity of RPC columns. Anal. Chem. 2007, 79, 3254–3262. [Google Scholar] [CrossRef] [PubMed]
  14. Kimata, K.; Iwaguchi, K.; Onishi, S.; Jinno, K.; Eksteen, R.; Hosoya, K.; Arki, M.; Tanaka, N. Chromatographic Characterization of Silica C18 Packing Materials. Correlation between a Preparation Method and Retention Behavior of Stationary Phase. J. Chromatogr. Sci. 1989, 27, 721–728. [Google Scholar] [CrossRef]
  15. Euerby, M.R.; Petersson, P. Chromatographic classification and comparison of commercially available reversed-phase liquid chromatographic columns containing polar embedded groups/amino endcappings using principal component analysis. J. Chromatogr. A 2005, 1088, 1–15. [Google Scholar] [CrossRef] [PubMed]
  16. Markopoulou, C.; Tweedlie, T.; Watson, D.; Skellern, G.G.; Reda, H.; Petersson, P.; Bradstock, H.; Euerby, M.R. A Study of the Relative Importance of Lipophilic, π-π and Dipole-Dipole Interactions on Cyanopropyl, Phenyl and Alkyl LC Phases Bonded onto the Same Base Silica. Chromatographia 2009, 70, 705–715. [Google Scholar] [CrossRef]
  17. Euerby, M.R.; James, M.; Petersson, P. Practical implications of the “Tanaka” stationary phase characterization methodology using ultra high performance liquid chromatographic conditions. J. Chromatogr. A 2012, 1228, 165–174. [Google Scholar] [CrossRef] [PubMed]
  18. Cruz, E.; Euerby, M.R.; Johnson, C.M.; Hackett, C.A. Chromatographic classification of commercially available reversed-phase HPLC columns. Chromatographia 1997, 44, 151–161. [Google Scholar] [CrossRef]
  19. Visky, D.; Heyden, Y.V.; Iványi, T.; Baten, P.; de Beer, J.; Kovács, Z.; Noszál, B.; Roets, E.; Massart, D.L.; Hoogmartens, J. Characterisation of reversed-phase liquid chromatographic columns by chromatographic tests. Evaluation of 36 test parameters: Repeatability, reproducibility and correlation. J. Chromatogr. A 2002, 977, 39–58. [Google Scholar] [CrossRef]
  20. Stella, C.; Rudaz, S.; Gauvrit, J.-Y.; Lanteri, P.; Huteau, A.; Tchapla, A.; Veuthey, J.L. Characterization and comparison of the chromatographic performance of different types of reversed-phase stationary phases. J. Pharm. Biomed. Anal. 2007, 43, 89–98. [Google Scholar] [CrossRef] [PubMed]
  21. Stella, C.; Seuret, P.; Rudaz, S.; Tchapla, A.; Gauvrit, J.Y.; Lanteri, P.; Veuthey, J.L. Simplification of a chromatographic test methodology for evaluation of base deactivated supports. Chromatographia 2002, 56, 665–671. [Google Scholar] [CrossRef]
  22. Fekete, S.; Veuthey, J.L.; Guillarme, D. Comparison of the most recent chromatographic approaches applied for fast and high resolution separations: Theory and practice. J. Chromatogr. A 2015, 1408, 1–14. [Google Scholar] [CrossRef] [PubMed]
  23. Engelhardt, H.; Jungheim, M. Comparison and characterization of reversed phases. Chromatographia 1990, 29, 59–68. [Google Scholar] [CrossRef]
  24. Claessens, H.A.; van Straten, M.A.; Cramers, C.A.; Jezierska, M.; Buszewski, B. Comparative study of test methods for reversed-phase columns for high-performance liquid chromatography. J. Chromatogr. A 1998, 826, 135–156. [Google Scholar] [CrossRef]
  25. Van Gyseghem, E.; Jimidar, M.; Sneyers, R.; de Smet, M.; Verhoeven, E.; Vander Heyden, Y. Stationary phases in the screening of drug/impurity profiles and in their separation method development: Identification of columns with different and similar selectivities. J. Pharm. Biomed. Anal. 2006, 41, 751–760. [Google Scholar] [CrossRef] [PubMed]
  26. Bonose-Crosnier de Bellaistre, M.; Nowik, W.; Tchapla, A.; Heron, S. Separation of 9,10-anthraquinone derivatives: Evaluation of C18 stationary phases. J. Chromatogr. A 2011, 1218, 778–786. [Google Scholar] [CrossRef] [PubMed]
  27. Héberger, K. Sum of ranking differences compares methods or models fairly. Trends Anal. Chem. 2010, 29, 101–109. [Google Scholar] [CrossRef]
  28. Dehouck, P.; Visky, D.; Vander Heyden, Y.; Adams, E.; Kovács, Z.; Noszál, B.; Massart, D.L.; Hoogmartens, J. Characterization of reversed-phase liquid-chromatographic columns by chromatographic tests. Comparing column classification based on chromatographic parameters and column performance for the separation of acetylsalicylic acid and related compounds. J. Chromatogr. A 2004, 1025, 189–200. [Google Scholar] [CrossRef] [PubMed]
  29. Dehouck, P.; Visky, D.; van den Bergh, G.; Haghedooren, E.; Adams, E.; Kerner, A.; Vander Heyden, Y.; Massart, D.L.; Kovács, Z.; Noszál, B.; et al. Facilitated column selection in reversed-phase liquid chromatography for pharmaceutical separations. LC-GC Eur. 2004, 17, 592–601. [Google Scholar]
  30. Haghedooren, E.; Kerner, A.; Noszál, B.; Hoogmartens, J.; Adams, E. Application of an improved column characterization system to evaluate the within and between batch variability. J. Pharm. Biomed. Anal. 2007, 44, 634–639. [Google Scholar] [CrossRef] [PubMed]
  31. Visky, D.; Haghedooren, E.; Dehouck, P.; Kovács, Z.; Kóczián, K.; Noszál, B.; Hoogmartens, J.; Adams, E. Facilitated column selection in pharmaceutical analyses using a simple column classification system. J. Chromatogr. A 2006, 1101, 103–114. [Google Scholar] [CrossRef] [PubMed]
  32. Haghedooren, E.; Németh, T.; Dragovic, S.; Noszál, B.; Hoogmartens, J.; Adams, E. Comparison of two column characterization systems based on pharmaceutical applications. J. Chromatogr. A 2008, 1189, 59–71. [Google Scholar] [CrossRef] [PubMed]
  33. Haghedooren, E.; Diana, J.; Noszál, B.; Hoogmartens, J.; Adams, E. Classification of reversed phase columns based on their selectivity towards vancomycin compounds. Talanta 2007, 71, 31–37. [Google Scholar] [CrossRef] [PubMed]
  34. Kóczián, K.; Haghedooren, E.; Dragovic, S.; Noszál, B.; Hoogmartens, J.; Adams, E. Column selection for pharmaceutical analyses based on a column classification using four test parameters. J. Pharm. Biomed. Anal. 2007, 44, 894–905. [Google Scholar] [CrossRef] [PubMed]
  35. Szulfer, J.; Plenis, A.; Bączek, T. Comparison of core-shell and totally porous ultra high performance liquid chromatographic stationary phases based on their selectivity towards alfuzosin compounds. J. Chromatogr. A 2014, 1346, 69–77. [Google Scholar] [CrossRef] [PubMed]
  36. Németh, T.; Haghedooren, E.; Noszál, B.; Hoogmartens, J.; Adams, E. Three methods to characterize reversed phase liquid chromatographic columns applied to pharmaceutical separations. J. Chemometr. 2008, 22, 178–185. [Google Scholar] [CrossRef]
  37. Dragovic, S.; Haghedooren, E.; Nemeth, T.; Palabiyik, I.M.; Hoogmartens, J.; Adams, E. Evaluation of two approaches to characterise liquid chromatographic columns using pharmaceutical separations. J. Chromatogr. A 2009, 1216, 3210–3216. [Google Scholar] [CrossRef] [PubMed]
  38. Plenis, A.; Balakowska, E.; Bączek, T. The comparison of two column classification systems during the chromatographic analysis of steroids. J. Sep. Sci. 2011, 34, 3310–3321. [Google Scholar] [CrossRef] [PubMed]
  39. Szulfer, J.; Plenis, A.; Bączek, T. Evaluation of a column classification method using the separation of alfuzosin from its related substances. J. Chromatogr. A 2012, 1229, 198–207. [Google Scholar] [CrossRef] [PubMed]
  40. Szulfer, J.; Plenis, A.; Bączek, T. Application of a column classification method in a selectivity study involving caffeine and its related impurities. Talanta 2012, 99, 492–501. [Google Scholar] [CrossRef] [PubMed]
  41. Szulfer, J.; Plenis, A.; Bączek, T. Chemometric evaluation of the column classification system during the pharmaceutical analysis of lamotrigine and its related substances. Anal. Bioanal. Chem. 2013, 405, 6529–6541. [Google Scholar] [CrossRef] [PubMed]
  42. Plenis, A.; Chmielewska, A.; Konieczna, L.; Lamparczyk, H. A validated high-performance liquid chromatographic method for the determination of moclobemide and its two metabolites in human plasma and application to pharmacokinetic studies. Biomed. Chromatogr. 2007, 21, 958–966. [Google Scholar] [CrossRef] [PubMed]
  43. Plenis, A.; Olędzka, I.; Bączek, T. Classification of LC columns based on the QSRR method and selectivity toward moclobemide and its metabolites. J. Pharm. Biomed. Anal. 2013, 78–79, 161–169. [Google Scholar] [CrossRef] [PubMed]
  44. Forina, M.; Armanino, C.; Lanteri, S.; Leardi, R. Methods of varimax rotation in factor analysis with applications in clinical and food chemistry. J. Chemometr. 1989, 3, 115–125. [Google Scholar] [CrossRef]
  45. Hao, Z.; Xiao, B.; Weng, N. Impact of column temperature and mobile phase components on selectivity of hydrophilic interaction chromatography (HILIC). J. Sep. Sci. 2008, 31, 1449–1464. [Google Scholar] [CrossRef] [PubMed]
  46. Ianni, F.; Pataj, Z.; Gross, H.; Sardella, R.; Natalini, B.; Lindner, W.; Lämmerhofer, M. Direct enantioseparation of underivatized aliphatic 3-hydroxyalkanoic acids with a quinine-based zwitterionic chiral stationary phase. J. Chromatogr. A 2014, 1363, 101–108. [Google Scholar] [CrossRef] [PubMed]

