
Gene Expression (mRNA) Markers for Differentiating between Malignant and Benign Follicular Thyroid Tumours

 ,
,
Abstract
: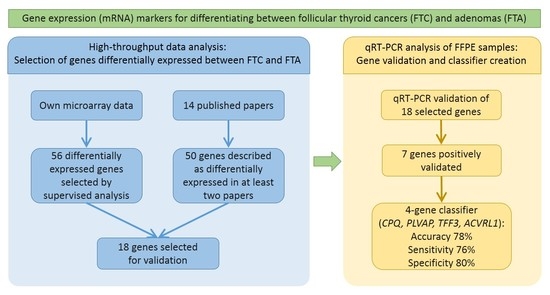
1. Introduction
2. Results
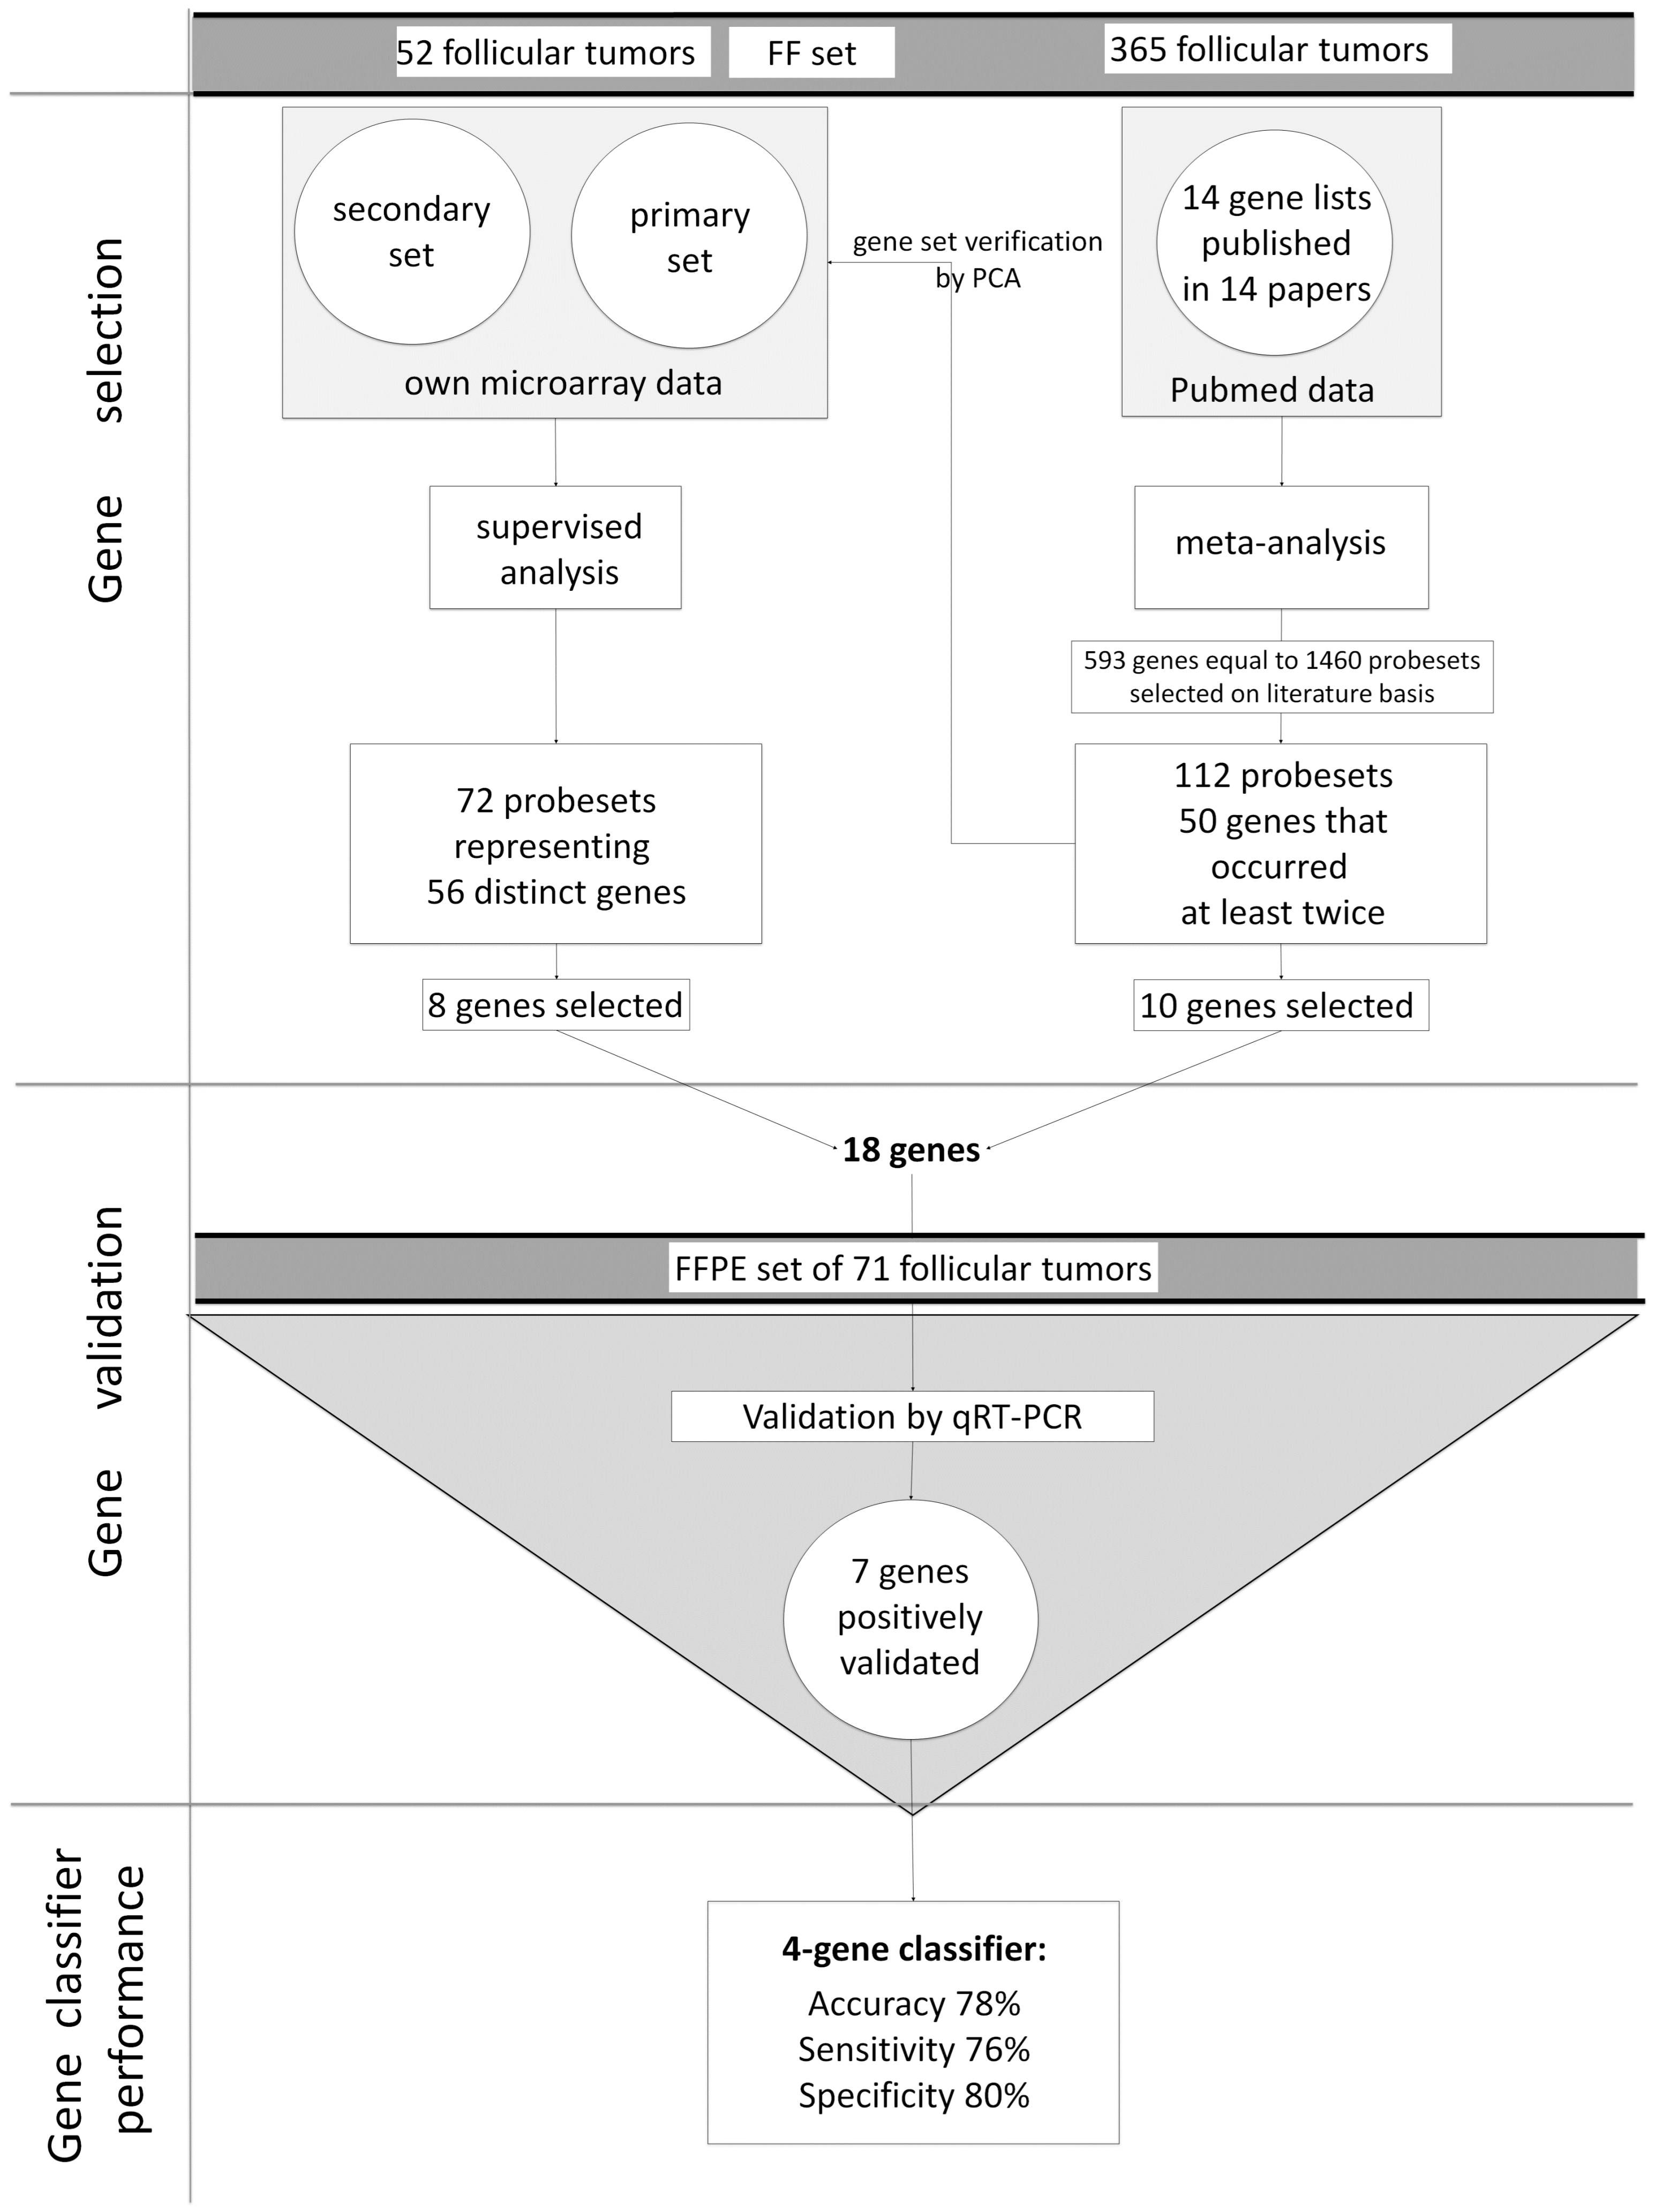
2.1. Supervised Analysis of Gene Expression Microarrays
2.2. Meta-Analysis
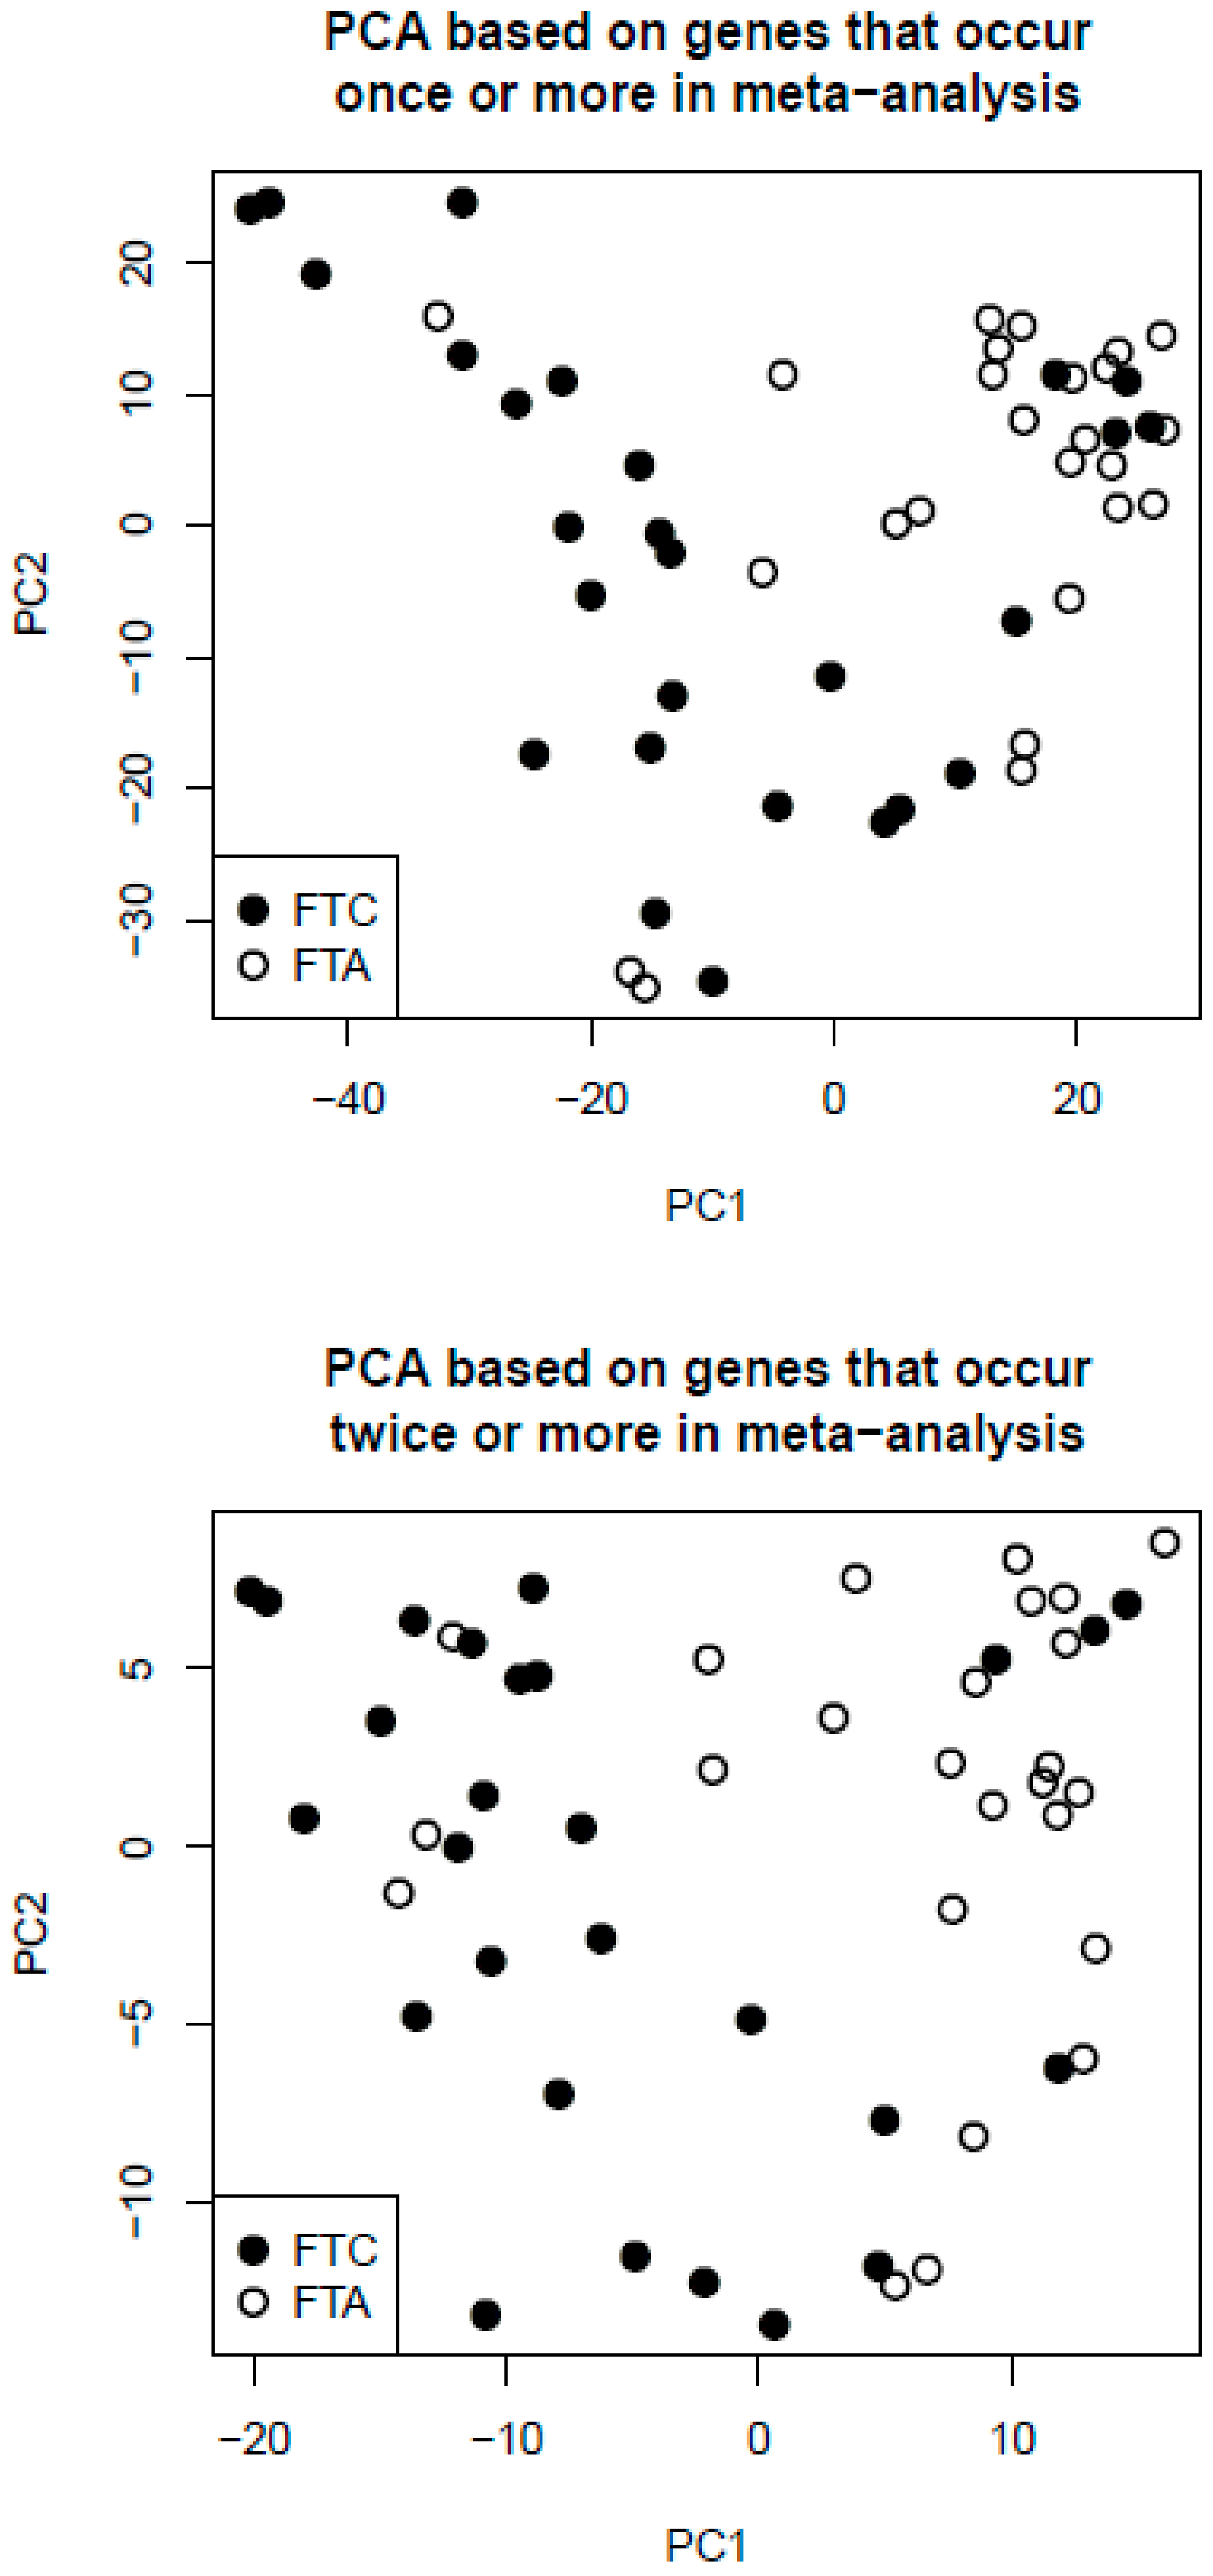
2.3. Principal Component Analysis
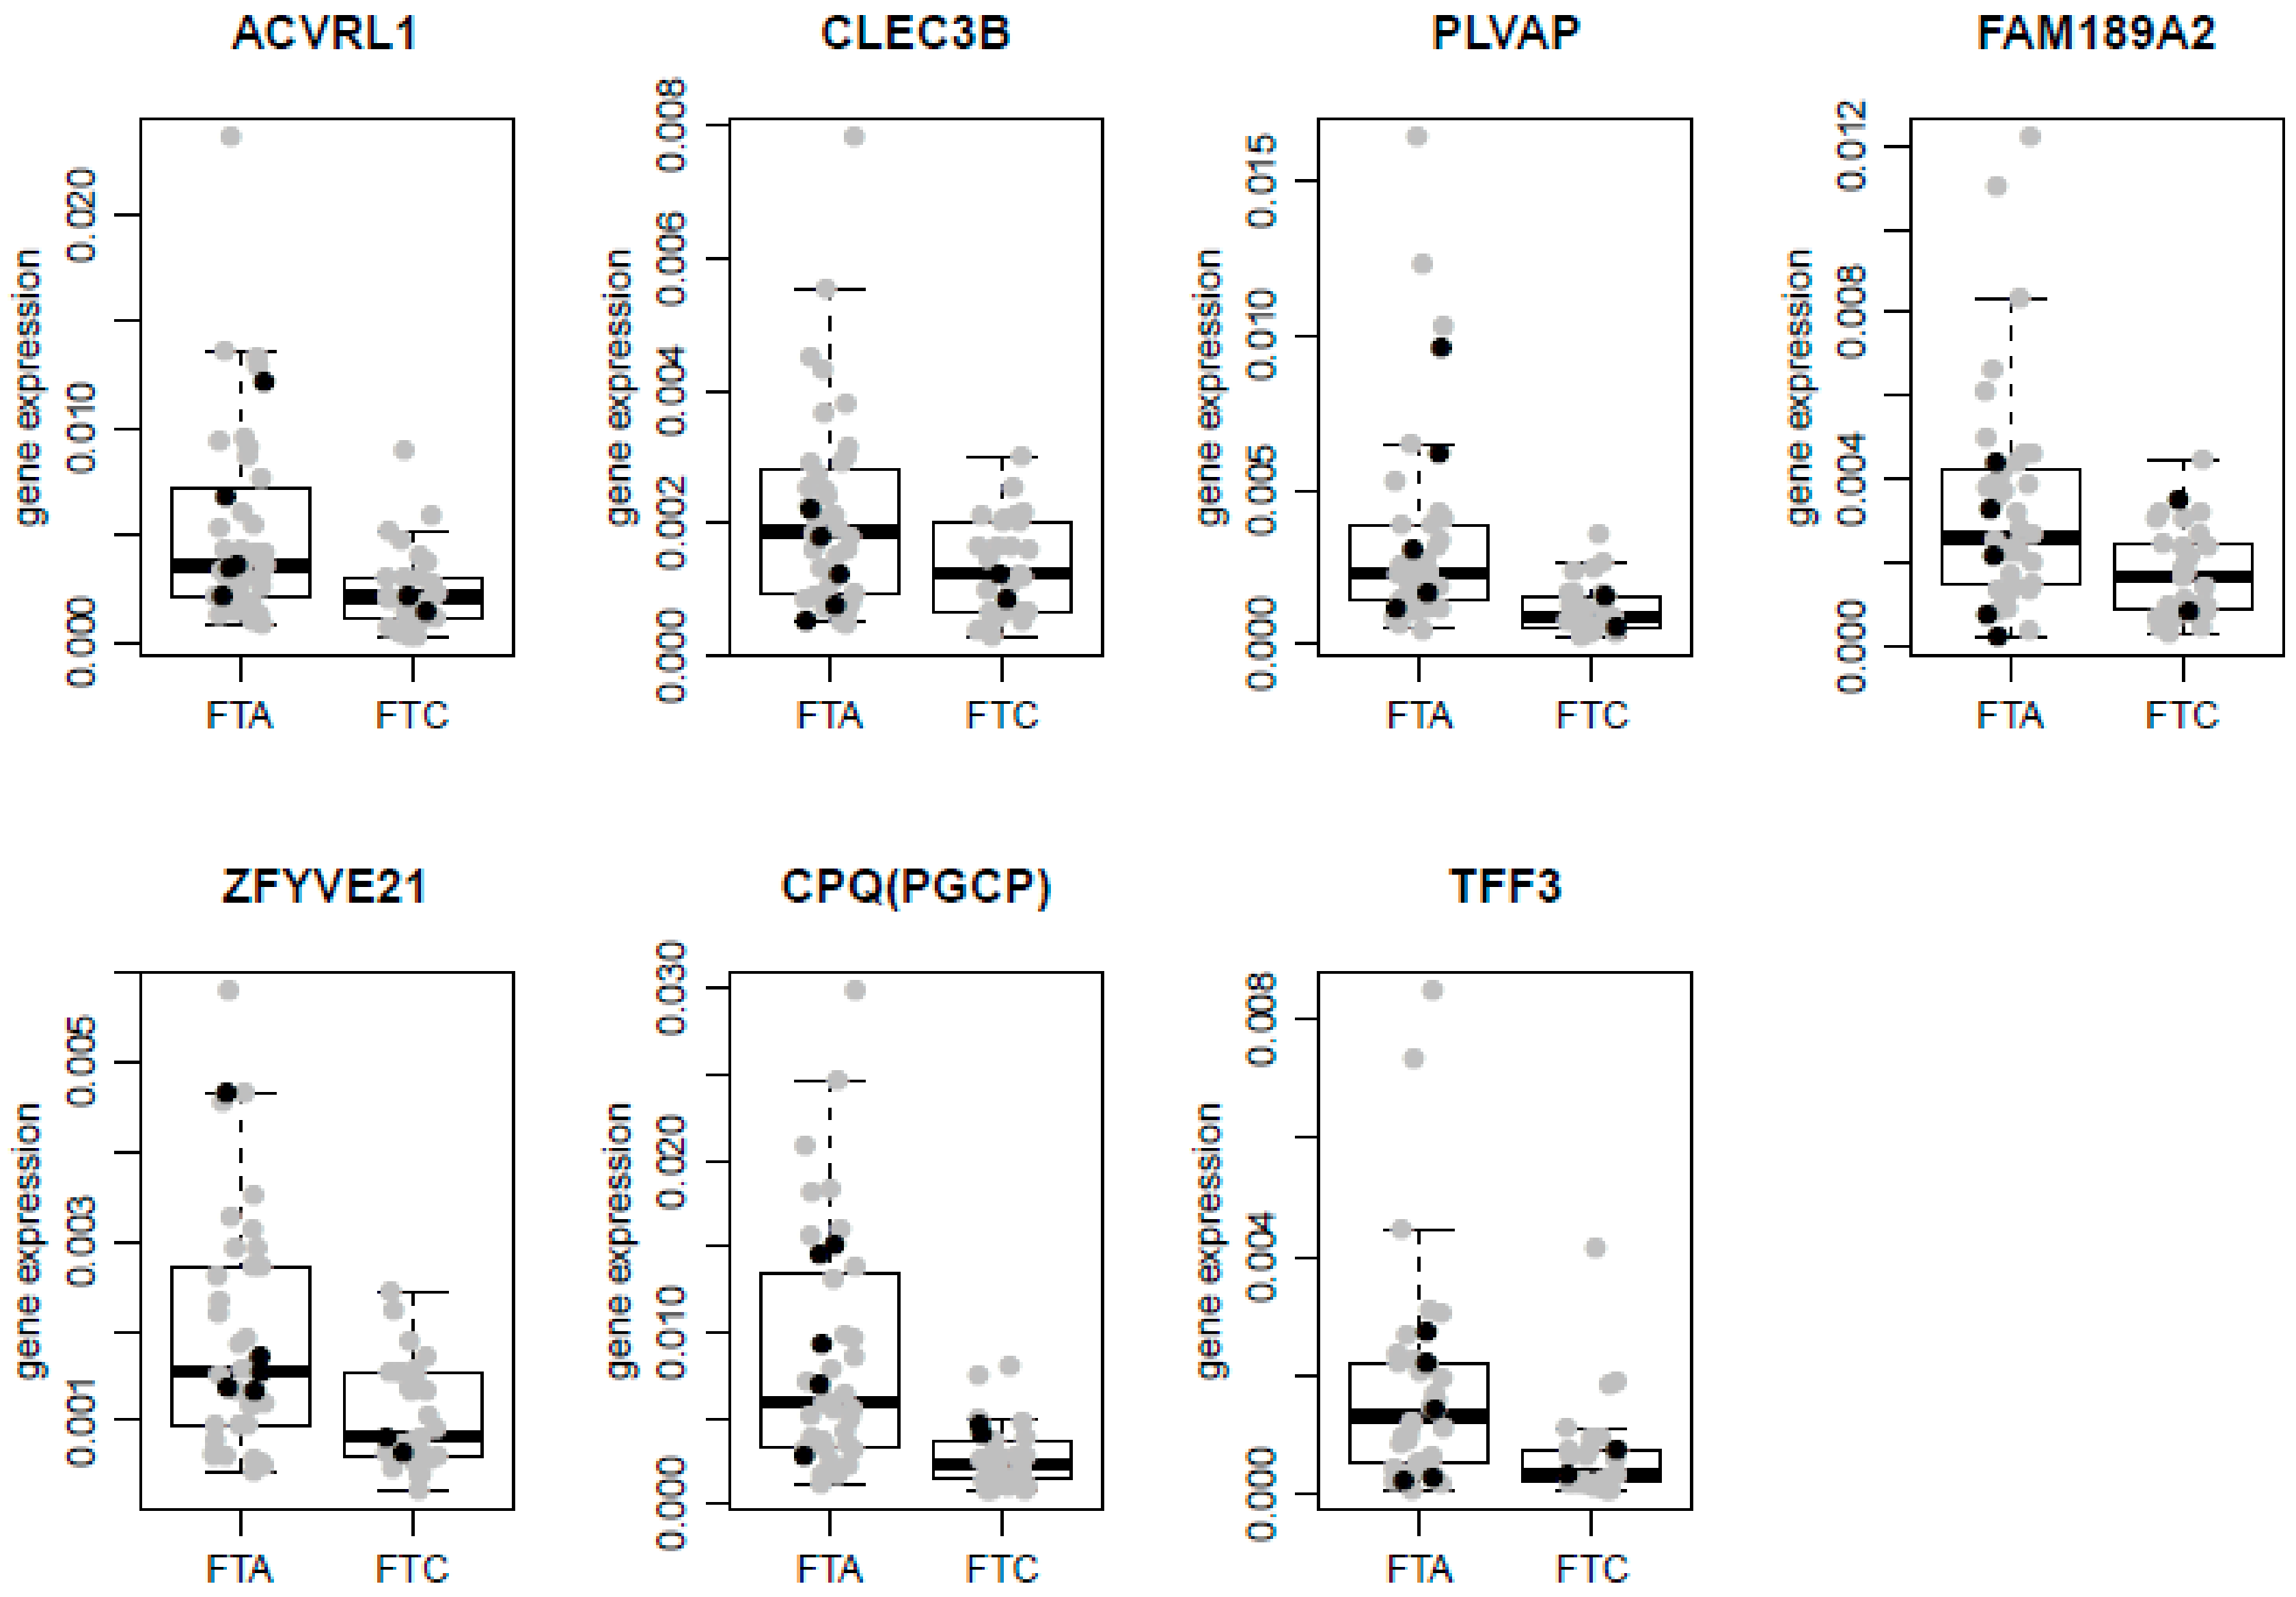
2.4. qRT-PCR Validation
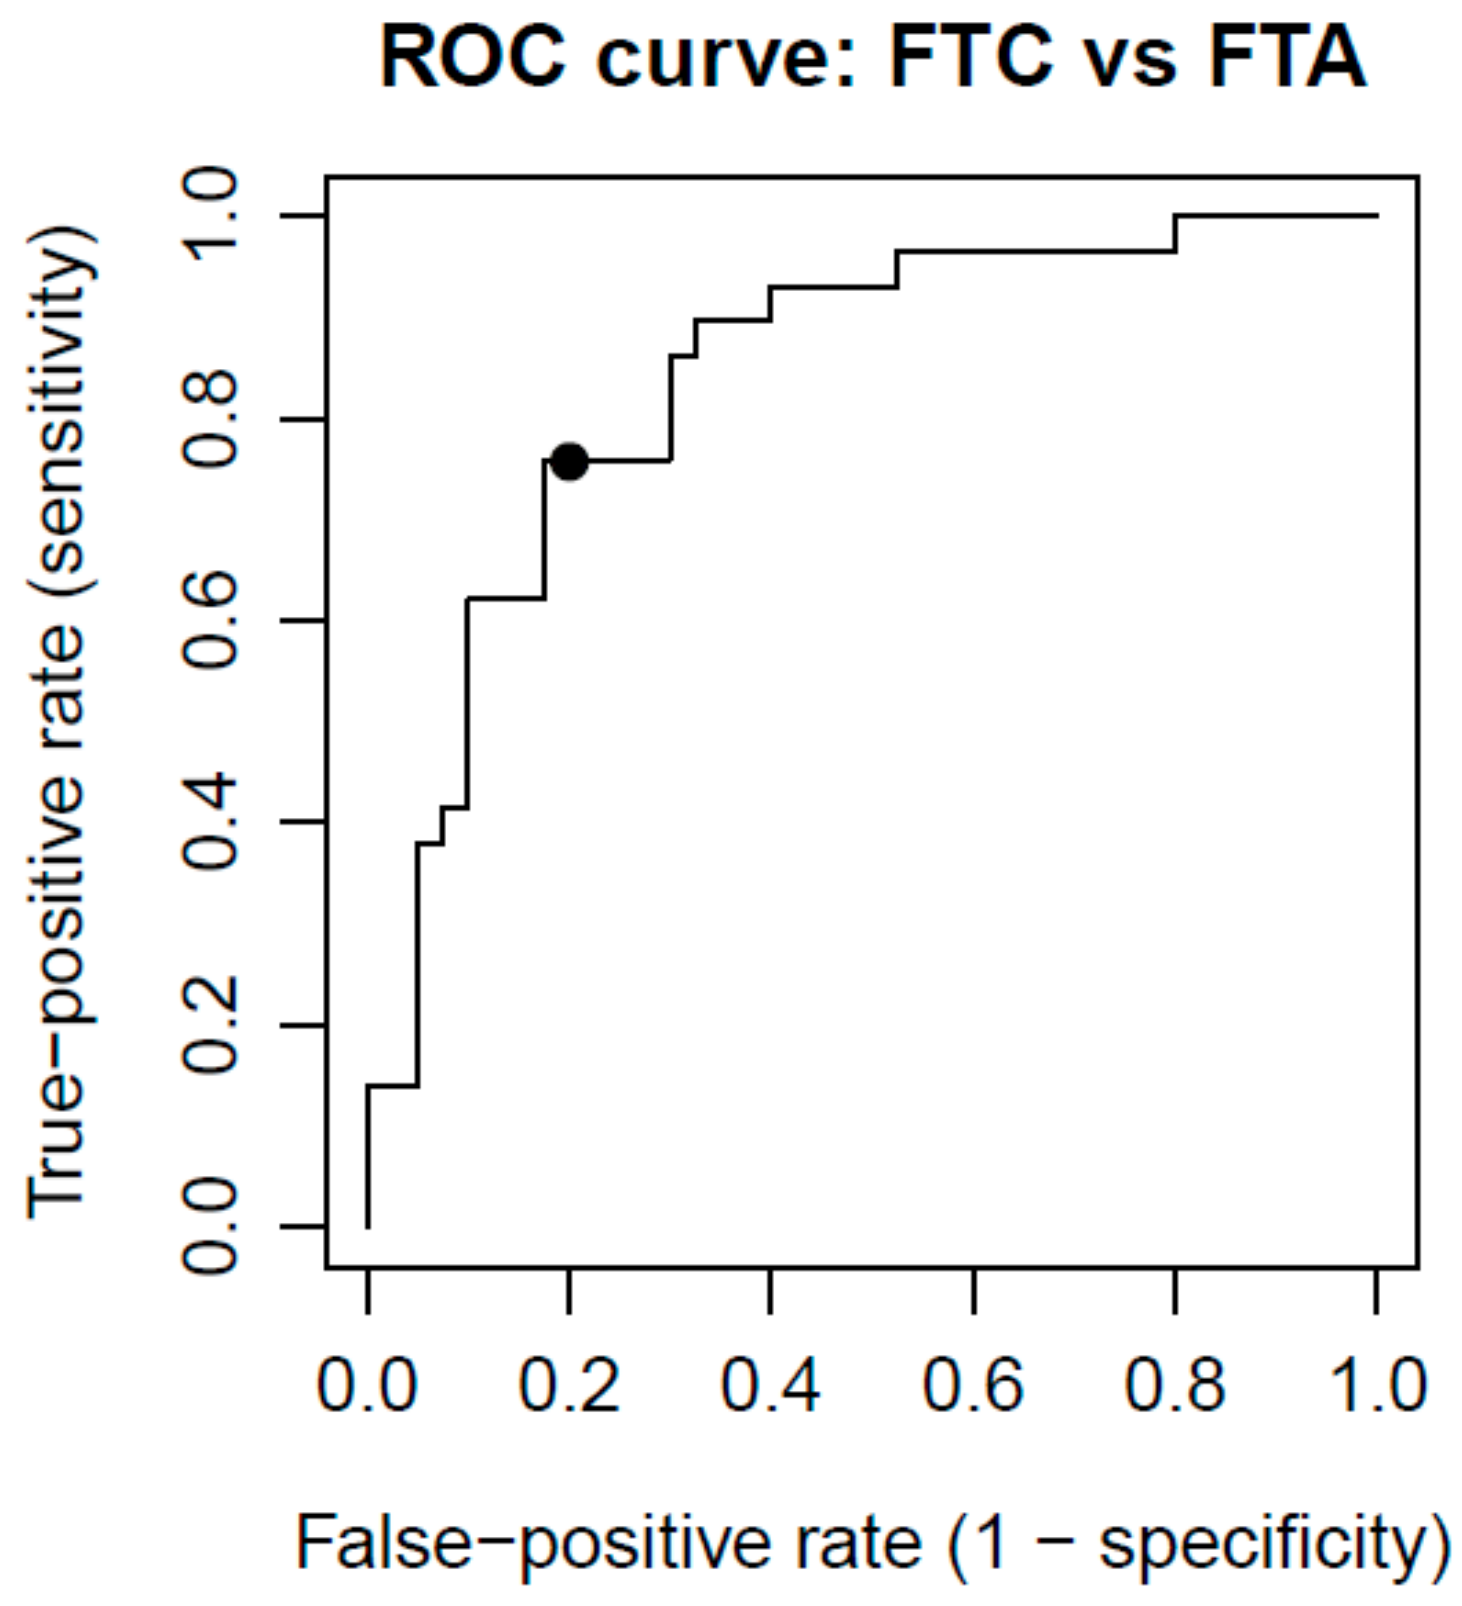
2.5. Classifier Performance
2.6. RAS Mutation Status
3. Discussion
4. Materials and Methods
4.1. Material
4.1.1. Clinical Materials for Gene Expression Microarray Analysis Using Our Own Thyroid Samples
4.1.2. Clinical Materials for Validation Studies
4.1.3. RAS Mutation Screening
4.2. Gene Expression Microarray-Based Analysis of Our Own Follicular Tumours
4.2.1. Gene Expression Microarray Experiment
4.2.2. Gene Expression Microarray Data Preprocessing
4.2.3. Supervised Analysis of Our Own Gene Expression Microarray Data
4.3. Meta-Analysis of All Published Papers
Principal Component Analysis of Microarrays Based on the Meta-Analysis Identified Genes
4.4. qRT-PCR Validation
4.4.1. qRT-PCR Experiment
4.4.2. Classifier Performance
5. Conclusions
Supplementary Materials
Acknowledgments
Author Contributions
Conflicts of Interest
Abbreviations
| ANOVA | Analysis of variance |
| ATAC-PCR | Adapter-tagged competitive polymerase chain reaction |
| AUC | Area under the ROC curve |
| DLDA | Diagonal linear discrimination analysis |
| FDR | False discovery rate |
| FF | Fresh-frozen |
| FFPE | Formaldehyde-fixed paraffin embedded |
| FNAB | Fine needle aspiration biopsy |
| FTA | Follicular thyroid adenoma |
| FTC | Follicular thyroid cancer |
| HDSS | High-throughput differential screening by serial analysis of gene expression |
| IQR | Interquartile range |
| LOOCV | Leave-one-out cross validation |
| OTC | Oncocytic thyroid carcinoma |
| PCA | Principal component analysis |
| Q1 | First quartile |
| Q3 | Third quartile |
| qRT-PCR | Quantitative real-time polymerase chain reaction |
| RIN | RNA integrity number |
| ROC | Receiver operating characteristc |
| SAGE | Serial analysis of gene expression |
| WHO | World Health Organization |
References
- DeLellis, R.; Lloyd, R.; Heitz, P.; Eng, C. WHO Pathology and Genetics. Tumours of Endocrine Organs; IARC Press: Lyon, France, 2004. [Google Scholar]
- LiVolsi, V.A.; Baloch, Z.W. Follicular-patterned tumors of the thyroid: The battle of benign vs. malignant vs. so-called uncertain. Endocr. Pathol. 2011, 22, 184–189. [Google Scholar] [CrossRef] [PubMed]
- Yamashina, M. Follicular neoplasms of the thyroid. Total circumferential evaluation of the fibrous capsule. Am. J. Surg. Pathol. 1992, 16, 392–400. [Google Scholar] [CrossRef] [PubMed]
- Takano, T.; Hasegawa, Y.; Matsuzuka, F.; Miyauchi, A.; Yoshida, H.; Higashiyama, T.; Kuma, K.; Amino, N. Gene expression profiles in thyroid carcinomas. Br. J. Cancer 2000, 83, 1495–1502. [Google Scholar] [CrossRef] [PubMed]
- Barden, C.B.; Shister, K.W.; Zhu, B.; Guiter, G.; Greenblatt, D.Y.; Zeiger, M.A.; Fahey, T.J., III. Classification of follicular thyroid tumors by molecular signature: Results of gene profiling. Clin. Cancer Res. 2003, 9, 1792–1800. [Google Scholar] [PubMed]
- Takano, T.; Miyauchi, A.; Yoshida, H.; Kuma, K.; Amino, N. High-throughput differential screening of mRNAs by serial analysis of gene expression: Decreased expression of trefoil factor 3 mRNA in thyroid follicular carcinomas. Br. J. Cancer 2004, 90, 1600–1605. [Google Scholar] [CrossRef] [PubMed]
- Cerutti, J.M.; Delcelo, R.; Amadei, M.J.; Nakabashi, C.; Maciel, R.M.; Peterson, B.; Shoemaker, J.; Riggins, G.J. A preoperative diagnostic test that distinguishes benign from malignant thyroid carcinoma based on gene expression. J. Clin. Investig. 2004, 113, 1234–1242. [Google Scholar] [CrossRef] [PubMed]
- Chevillard, S.; Ugolin, N.; Vielh, P.; Ory, K.; Levalois, C.; Elliott, D.; Clayman, G.L.; El-Naggar, A.K. Gene expression profiling of differentiated thyroid neoplasms: Diagnostic and clinical implications. Clin. Cancer Res. 2004, 10, 6586–6597. [Google Scholar] [CrossRef] [PubMed]
- Weber, F.; Shen, L.; Aldred, M.A.; Morrison, C.D.; Frilling, A.; Saji, M.; Schuppert, F.; Broelsch, C.E.; Ringel, M.D.; Eng, C. Genetic classification of benign and malignant thyroid follicular neoplasia based on a three-gene combination. J. Clin. Endocrinol. Metab. 2005, 90, 2512–2521. [Google Scholar] [CrossRef] [PubMed]
- Taniguchi, K.; Takano, T.; Miyauchi, A.; Koizumi, K.; Ito, Y.; Takamura, Y.; Ishitobi, M.; Miyoshi, Y.; Taguchi, T.; Tamaki, Y.; et al. Differentiation of follicular thyroid adenoma from carcinoma by means of gene expression profiling with adapter-tagged competitive polymerase chain reaction. Oncology 2005, 69, 428–435. [Google Scholar] [CrossRef] [PubMed]
- Lubitz, C.C.; Gallagher, L.A.; Finley, D.J.; Zhu, B.; Fahey, T.J., III. Molecular analysis of minimally invasive follicular carcinomas by gene profiling. Surgery 2005, 138, 1042–1048. [Google Scholar] [CrossRef] [PubMed]
- Fryknas, M.; Wickenberg-Bolin, U.; Goransson, H.; Gustafsson, M.G.; Foukakis, T.; Lee, J.J.; Landegren, U.; Hoog, A.; Larsson, C.; Grimelius, L.; et al. Molecular markers for discrimination of benign and malignant follicular thyroid tumors. Tumour Biol. 2006, 27, 211–220. [Google Scholar] [PubMed]
- Stolf, B.S.; Santos, M.M.; Simao, D.F.; Diaz, J.P.; Cristo, E.B.; Hirata, R., Jr.; Curado, M.P.; Neves, E.J.; Kowalski, L.P.; Carvalho, A.F. Class distinction between follicular adenomas and follicular carcinomas of the thyroid gland on the basis of their signature expression. Cancer 2006, 106, 1891–1900. [Google Scholar] [CrossRef] [PubMed]
- Zhao, J.; Leonard, C.; Gemsenjager, E.; Heitz, P.U.; Moch, H.; Odermatt, B. Differentiation of human follicular thyroid adenomas from carcinomas by gene expression profiling. Oncol. Rep. 2008, 19, 329–337. [Google Scholar] [CrossRef]
- Hinsch, N.; Frank, M.; Doring, C.; Vorlander, C.; Hansmann, M.L. QPRT: A potential marker for follicular thyroid carcinoma including minimal invasive variant; a gene expression, RNA and immunohistochemical study. BMC Cancer 2009, 9, 93. [Google Scholar] [CrossRef] [PubMed]
- Borup, R.; Rossing, M.; Henao, R.; Yamamoto, Y.; Krogdahl, A.; Godballe, C.; Winther, O.; Kiss, K.; Christensen, L.; Hogdall, E.; et al. Molecular signatures of thyroid follicular neoplasia. Endocr. Relat. Cancer 2010, 17, 691–708. [Google Scholar] [CrossRef] [PubMed]
- Williams, M.D.; Zhang, L.; Elliott, D.D.; Perrier, N.D.; Lozano, G.; Clayman, G.L.; El-Naggar, A.K. Differential gene expression profiling of aggressive and nonaggressive follicular carcinomas. Hum. Pathol. 2011, 42, 1213–1220. [Google Scholar] [CrossRef] [PubMed]
- Wojtas, B.; Pfeifer, A.; Jarzab, M.; Czarniecka, A.; Krajewska, J.; Swierniak, M.; Stokowy, T.; Rusinek, D.; Kowal, M.; Zebracka-Gala, J.; et al. Unsupervised analysis of follicular thyroid tumours transcriptome by oligonucleotide microarray gene expression profiling. Endokrynol. Pol. 2013, 64, 328–334. [Google Scholar] [CrossRef]
- Swierniak, M.; Pfeifer, A.; Stokowy, T.; Rusinek, D.; Chekan, M.; Lange, D.; Krajewska, J.; Oczko-Wojciechowska, M.; Czarniecka, A.; Jarzab, M.; et al. Somatic mutation profiling of follicular thyroid cancer by next generation sequencing. Mol. Cell. Endocrinol. 2016, 433, 130–137. [Google Scholar] [CrossRef] [PubMed]
- Cheung, L.; Messina, M.; Gill, A.; Clarkson, A.; Learoyd, D.; Delbridge, L.; Wentworth, J.; Philips, J.; Clifton-Bligh, R.; Robinson, B.G. Detection of the PAX8-PPARγ fusion oncogene in both follicular thyroid carcinomas and adenomas. J. Clin. Endocrinol. Metab. 2003, 88, 354–357. [Google Scholar] [CrossRef] [PubMed]
- Sahin, M.; Allard, B.L.; Yates, M.; Powell, J.G.; Wang, X.L.; Hay, I.D.; Zhao, Y.; Goellner, J.R.; Sebo, T.J.; Grebe, S.K.; et al. PPARγ staining as a surrogate for PAX8/PPARγ fusion oncogene expression in follicular neoplasms: Clinicopathological correlation and histopathological diagnostic value. J. Clin. Endocrinol. Metab. 2005, 90, 463–468. [Google Scholar] [CrossRef] [PubMed]
- Kloos, R.T.; Reynolds, J.D.; Walsh, P.S.; Wilde, J.I.; Tom, E.Y.; Pagan, M.; Barbacioru, C.; Chudova, D.I.; Wong, M.; Friedman, L.; et al. Does addition of BRAF V600E mutation testing modify sensitivity or specificity of the Afirma Gene Expression Classifier in cytologically indeterminate thyroid nodules? J. Clin. Endocrinol. Metab. 2013, 98, 761–768. [Google Scholar] [CrossRef] [PubMed]
- Baris, O.; Savagner, F.; Nasser, V.; Loriod, B.; Granjeaud, S.; Guyetant, S.; Franc, B.; Rodien, P.; Rohmer, V.; Bertucci, F.; et al. Transcriptional profiling reveals coordinated up-regulation of oxidative metabolism genes in thyroid oncocytic tumors. J. Clin. Endocrinol. Metab. 2004, 89, 994–1005. [Google Scholar] [CrossRef] [PubMed]
- Ganly, I.; Ricarte Filho, J.; Eng, S.; Ghossein, R.; Morris, L.G.; Liang, Y.; Socci, N.; Kannan, K.; Mo, Q.; Fagin, J.A.; et al. Genomic dissection of Hurthle cell carcinoma reveals a unique class of thyroid malignancy. J. Clin. Endocrinol. Metab. 2013, 98, 962–972. [Google Scholar] [CrossRef] [PubMed]
- Chudova, D.; Wilde, J.I.; Wang, E.T.; Wang, H.; Rabbee, N.; Egidio, C.M.; Reynolds, J.; Tom, E.; Pagan, M.; Rigl, C.T.; et al. Molecular classification of thyroid nodules using high-dimensionality genomic data. J. Clin. Endocrinol. Metab. 2010, 95, 5296–5304. [Google Scholar] [CrossRef] [PubMed]
- Keutgen, X.M.; Filicori, F.; Crowley, M.J.; Wang, Y.; Scognamiglio, T.; Hoda, R.; Buitrago, D.; Cooper, D.; Zeiger, M.A.; Zarnegar, R.; et al. A panel of four miRNAs accurately differentiates malignant from benign indeterminate thyroid lesions on fine needle aspiration. Clin. Cancer Res. 2012, 18, 2032–2038. [Google Scholar] [CrossRef] [PubMed]
- Pfeifer, A.; Wojtas, B.; Oczko-Wojciechowska, M.; Kukulska, A.; Czarniecka, A.; Eszlinger, M.; Musholt, T.; Stokowy, T.; Swierniak, M.; Stobiecka, E.; et al. Molecular differential diagnosis of follicular thyroid carcinoma and adenoma based on gene expression profiling by using formalin-fixed paraffin-embedded tissues. BMC Med. Genom. 2013, 6, 38. [Google Scholar] [CrossRef] [PubMed]
- Evans, H.L.; Vassilopoulou-Sellin, R. Follicular and Hurthle cell carcinomas of the thyroid: A comparative study. Am. J. Surg. Pathol. 1998, 22, 1512–1520. [Google Scholar] [CrossRef] [PubMed]
- Parameswaran, R.; Brooks, S.; Sadler, G.P. Molecular pathogenesis of follicular cell derived thyroid cancers. Int. J. Surg. 2010, 8, 186–193. [Google Scholar] [CrossRef] [PubMed]
- Alexander, E.K.; Kennedy, G.C.; Baloch, Z.W.; Cibas, E.S.; Chudova, D.; Diggans, J.; Friedman, L.; Kloos, R.T.; LiVolsi, V.A.; Mandel, S.J.; et al. Preoperative diagnosis of benign thyroid nodules with indeterminate cytology. N. Engl. J. Med. 2012, 367, 705–715. [Google Scholar] [CrossRef] [PubMed]
- Chien, C.Y.; Chuang, H.C.; Chen, C.H.; Fang, F.M.; Chen, W.C.; Huang, C.C.; Huang, H.Y. The expression of activin receptor-like kinase 1 among patients with head and neck cancer. Otolaryngol. Head Neck Surg. 2013, 148, 965–973. [Google Scholar] [CrossRef] [PubMed]
- Arvanitis, D.L.; Kamper, E.F.; Kopeikina, L.; Stavridou, A.; Sgantzos, M.N.; Kallioras, V.; Athanasiou, E.; Kanavaros, P. Tetranectin expression in gastric adenocarcinomas. Histol. Histopathol. 2002, 17, 471–475. [Google Scholar] [PubMed]
- Hoshino, D.; Nagano, M.; Saitoh, A.; Koshikawa, N.; Suzuki, T.; Seiki, M. The phosphoinositide-binding protein ZF21 regulates ECM degradation by invadopodia. PLoS ONE 2013, 8, e50825. [Google Scholar] [CrossRef] [PubMed]
- Franc, B.; de la Salmonière, P.; Lange, F.; Hoang, C.; Louvel, A.; de Roquancourt, A.; Vilde, F.; Hejblum, G.; Chevret, S.; Chastang, C. Interobserver and intraobserver reproducibility in the histopathology of follicular thyroid carcinoma. Hum. Pathol. 2003, 34, 1092–1100. [Google Scholar] [CrossRef]
- Da, S.L.; James, D.; Simpson, P.T.; Walker, D.; Vargas, A.C.; Jayanthan, J.; Lakhani, S.R.; McNicol, A.M. Tumor heterogeneity in a follicular carcinoma of thyroid: A study by comparative genomic hybridization. Endocr. Pathol. 2011, 22, 103–107. [Google Scholar]
- Jarzab, B.; Wiench, M.; Fujarewicz, K.; Simek, K.; Jarzab, M.; Oczko-Wojciechowska, M.; Wloch, J.; Czarniecka, A.; Chmielik, E.; Lange, D.; et al. Gene expression profile of papillary thyroid cancer: Sources of variability and diagnostic implications. Cancer Res. 2005, 65, 1587–1597. [Google Scholar] [CrossRef] [PubMed]
- Aldred, M.A.; Huang, Y.; Liyanarachchi, S.; Pellegata, N.S.; Gimm, O.; Jhiang, S.; Davuluri, R.V.; de la Chapelle, A.; Eng, C. Papillary and follicular thyroid carcinomas show distinctly different microarray expression profiles and can be distinguished by a minimum of five genes. J. Clin. Oncol. 2004, 22, 3531–3539. [Google Scholar] [CrossRef] [PubMed]
- Rodrigues, H.G.; de Pontes, A.A.; Adan, L.F. Use of molecular markers in samples obtained from preoperative aspiration of thyroid. Endocr. J. 2012, 59, 417–424. [Google Scholar] [CrossRef] [PubMed]
- Asare, A.L.; Gao, Z.; Carey, V.J.; Wang, R.; Seyfert-Margolis, V. Power enhancement via multivariate outlier testing with gene expression arrays. Bioinformatics 2009, 25, 48–53. [Google Scholar] [CrossRef] [PubMed]
- Wu, Z.J.; Irizarry, R.A.; Gentleman, R.; Martinez-Murillo, F.; Spencer, F. A model-based background adjustment for oligonucleotide expression arrays. J. Am. Stat. Assoc. 2004, 99, 909–917. [Google Scholar] [CrossRef]
- Edgar, R.; Domrachev, M.; Lash, A.E. Gene expression omnibus: NCBI gene expression and hybridization array data repository. Nucleic Acids Res. 2002, 30, 207–210. [Google Scholar] [CrossRef] [PubMed]
- Benjamini, Y.; Hochberg, Y. Controlling the false discovery rate: A practical and powerful approach to multiple testing. J. R. Stat. Soc. Ser. B 1995, 57, 289–300. [Google Scholar]
- Pfaffl, M.W. A new mathematical model for relative quantification in real-time RT-PCR. Nucleic Acids Res. 2001, 29, e45. [Google Scholar] [CrossRef] [PubMed]
- Vandesompele, J.; de Preter, K.; Pattyn, F.; Poppe, B.; van Roy, N.; de Paepe, A.; Speleman, F. Accurate normalization of real-time quantitative RT-PCR data by geometric averaging of multiple internal control genes. Genome Biol. 2002, 3, 1–11. [Google Scholar] [CrossRef]
- Slawski, M.; Daumer, M.; Boulesteix, A.L. CMA: A comprehensive bioconductor package for supervised classification with high dimensional data. BMC Bioinform. 2008, 9, 439. [Google Scholar] [CrossRef] [PubMed]
- Varma, S.; Simon, R. Bias in error estimation when using cross-validation for model selection. BMC Bioinform. 2006, 7. [Google Scholar] [CrossRef] [PubMed]


| No. | Gene Symbol | Gene Name | Affy ID | Primary Dataset | Primary Dataset—Evaluation of Non-Oncocytic Samples Only | |||
|---|---|---|---|---|---|---|---|---|
| FDR Corrected p-Value | Mean Expression in FTC | Mean Expression in FTA | Fold-Change | FDR Corrected p-Value | ||||
| 1 | ACVRL1 | activin A receptor type II-like 1 | 226950_at | 0.07 | 5.52 | 7.02 | 0.35 | 0.12 |
| 2 | CLEC3B | C-type lectin domain family 3, member B | 205200_at | 0.08 | 7.54 | 9.52 | 0.25 | 0.13 |
| 3 | GABARAPL2 | GABA(A) receptor-associated protein-like 2 | 209046_s_at | 0.08 | 11.05 | 11.84 | 0.58 | 0.15 |
| 4 | ZFYVE21 | zinc finger, FYVE domain containing 21 | 219929_s_at | 0.07 | 7.39 | 8.67 | 0.41 | 0.04 |
| 5 | LIMK2 | LIM domain kinase 2 | 217475_s_at | 0.07 | 4.32 | 5.84 | 0.35 | 0.12 |
| 6 | ZMYND11 | zinc finger, MYND domain containing 11 | 1554159_a_at | 0.10 | 6.60 | 8.05 | 0.37 | 0.15 |
| 7 | DIP2B | DIP2 disco-interacting protein 2 homolog B (Drosophila) | 224872_at | 0.11 | 8.23 | 7.40 | 1.78 | 0.16 |
| 8 | MAFB | v-maf musculoaponeurotic fibrosarcoma oncogene homolog B (avian) | 222670_s_at | 0.08 | 8.23 | 9.78 | 0.34 | 0.13 |
| No. | Entrez Gene ID | Symbol | Name | Number of Papers | References | Gene Regulation |
|---|---|---|---|---|---|---|
| 1 | 762 | CA4 | carbonic anhydrase IV | 3 | [5,9,16] | down |
| 2 | 1959 | EGR2 | early growth response 2 | 3 | [5,14,16] | down |
| 3 | 9413 | FAM189A2 | family with sequence similarity 189, member A2 | 3 | [5,9,12] | down |
| 4 | 7881 | KCNAB1 | potassium voltage-gated channel, shaker-related subfamily, beta member 1 | 3 | [6,9,16] Confirmed by us [27] | down |
| 5 | 10404 | CPQ | carboxypeptidase Q | 3 | [9,11,14] | down |
| 6 | 5172 | SLC26A4 | solute carrier family 26 (anion exchanger), member 4 | 3 | [6,14,16] | down |
| 7 | 7033 | TFF3 | trefoil factor 3 (intestinal) | 3 | [5,6,10] | down |
| 8 | 185 | AGTR1 | angiotensin II receptor, type 1 | 2 | [13,16] | down |
| 9 | 822 | CAPG | capping protein (actin filament), gelsolin-like | 2 | [14,17] | down |
| 10 | 1306 | COL15A1 | collagen, type XV, alpha 1 | 2 | [5,13] | down |
| 11 | 1363 | CPE | carboxypeptidase E | 2 | [9,17] | down |
| 12 | 3491 | CYR61 | cysteine-rich, angiogenic inducer, 61 | 2 | [8,16] | down |
| 13 | 1733 | DIO1 | deiodinase, iodothyronine, type I | 2 | [6,12] | down |
| 14 | 11072 | DUSP14 | dual specificity phosphatase 14 | 2 | [5,16] | down |
| 15 | 129080 | EMID1 | EMI domain containing 1 | 2 | [5,7] | down |
| 16 | 953 | ENTPD1 | ectonucleoside triphosphate diphosphohydrolase 1 | 2 | [9,14] | down |
| 17 | 8857 | FCGBP | Fc fragment of IgG binding protein | 2 | [5,17] | down |
| 18 | 2354 | FOSB | FBJ murine osteosarcoma viral oncogene homolog B | 2 | [16,17] | down |
| 19 | 2697 | GJA1 | gap junction protein, alpha 1, 43 kDa | 2 | [5,11] | down |
| 20 | 55830 | GLT8D1 | glycosyltransferase 8 domain containing 1 | 2 | [5,11] | down |
| 21 | 221395 | GPR116 | G protein-coupled receptor 116 | 2 | [5,9] | down |
| 22 | 3043 | HBB | hemoglobin, beta | 2 | [12,15] | down |
| 23 | 3309 | HSPA5 | heat shock 70 kDa protein 5 (glucose-regulated protein, 78 kDa) | 2 | [9,17] | down |
| 24 | 3400 | ID4 | inhibitor of DNA binding 4, dominant negative helix-loop-helix protein | 2 | [5,8] | down |
| 25 | 3590 | IL11RA | interleukin 11 receptor, alpha | 2 | [5,11] | down |
| 26 | 9452 | ITM2A | integral membrane protein 2A | 2 | [9,16] | down |
| 27 | 3708 | ITPR1 | inositol 1,4,5-trisphosphate receptor, type 1 | 2 | [5,11] | down |
| 28 | 3725 | JUN | jun proto-oncogene | 2 | [5,16] | down |
| 29 | 3912 | LAMB1 | laminin, beta 1 | 2 | [5,11] | down |
| 30 | 744 | MPPED2 | metallophosphoesterase domain containing 2 | 2 | [16,17] | down |
| 31 | 22795 | NID2 | nidogen 2 (osteonidogen) | 2 | [5,7] | down |
| 32 | 3164 | NR4A1 | nuclear receptor subfamily 4, group A, member 1 | 2 | [12,16] | down |
| 33 | 22925 | PLA2R1 | phospholipase A2 receptor 1, 180 kDa | 2 | [12,16] | down |
| 34 | 83483 | PLVAP | plasmalemma vesicle associated protein | 2 | [9,13] | down |
| 35 | 5583 | PRKCH | protein kinase C, eta | 2 | [9,14] | down |
| 36 | 23180 | RFTN1 | raftlin, lipid raft linker 1 | 2 | [5,9] | down |
| 37 | 8490 | RGS5 | regulator of G-protein signaling 5 | 2 | [9,13] | down |
| 38 | 6414 | SEPP1 | selenoprotein P, plasma, 1 | 2 | [5,14] | down |
| 39 | 7038 | TG | Thyroglobulin | 2 | [10,17] | down |
| 40 | 4982 | TNFRSF11B | tumor necrosis factor receptor superfamily, member 11b | 2 | [5,11] | down |
| 41 | 7173 | TPO | thyroid peroxidase | 2 | [10,17] | down |
| 42 | 440 | ASNS | asparagine synthetase (glutamine-hydrolyzing) | 2 | [5,9] | up |
| 43 | 771 | CA12 | carbonic anhydrase XII | 2 | [5,12] | up |
| 44 | 1164 | CKS2 | CDC28 protein kinase regulatory subunit 2 | 2 | [16,17] | up |
| 45 | 1649 | DDIT3 | DNA-damage-inducible transcript 3 | 2 | [5,7] | up |
| 46 | 2358 | FPR2 | formyl peptide receptor 2 | 2 | [5,11] | up |
| 47 | 9518 | GDF15 | growth differentiation factor 15 | 2 | [9,17] | up |
| 48 | 2896 | GRN | Granulin | 2 | [4,8] | up |
| 49 | 3486 | IGFBP3 | insulin-like growth factor binding protein 3 | 2 | [5,10] | up |
| 50 | 23089 | PEG10 | paternally expressed 10 | 2 | [5,11] | up |
| No. | Gene | Gene Selection | t-Test—FDR Corrected p-Value | Fold Change (FTC/FTA) | Two-Way ANOVA—FDR Corrected p-Value |
|---|---|---|---|---|---|
| 1 | ACVRL1 | Microarrays | 0.0017 | 0.58 | 0.0036 |
| 2 | ZFYVE21 | Microarrays | 0.0024 | 0.69 | 0.0036 |
| 3 | CLEC3B | Microarrays | 0.027 | 0.75 | 0.045 |
| 4 | ZMYND11 | Microarrays | 0.068 | 0.81 | 0.17 |
| 5 | LIMK2 | Microarrays | 0.093 | 0.79 | 0.17 |
| 6 | DIP2B | Microarrays | 0.23 | 0.86 | 0.04 |
| 7 | MAFB | Microarrays | 0.44 | 0.89 | 0.56 |
| 8 | GABARAPL2 | Microarrays | Amplification not possible in FFPE samples | ||
| 9 | CPQ | Meta-analysis | 0.000001 | 0.49 | 0.0004 |
| 10 | PLVAP | Meta-analysis | 0.00001 | 0.51 | 0.0001 |
| 11 | TFF3 | Meta-analysis | 0.0004 | 0.48 | 0.0036 |
| 12 | FAM189A2 | Meta-analysis | 0.0094 | 0.68 | 0.016 |
| 13 | GDF15 | Meta-analysis | 0.058 | 1.49 | 0.99 |
| 14 | CKS2 | Meta-analysis | 0.69 | 1.07 | 0.94 |
| 15 | ASNS | Meta-analysis | 0.90 | 1.02 | 0.17 |
| 16 | EGR2 | Meta-analysis | 0.90 | 0.97 | 0.89 |
| 17 | DDIT3 | Meta-analysis | Amplification not possible in FFPE samples | ||
| 18 | SLC26A4 | Meta-analysis | Amplification not possible in FFPE samples | ||
| Set | Histotype | Samples | % of Men | Median Age (Years) | Frequency of Oncocytic Tumours | Concordance of Pathologic Diagnosis by 2 Experts |
|---|---|---|---|---|---|---|
| Primary set | FTC | 13 | 38.5% | 66 | 46.2% | 100% |
| FTA | 13 | 0% | 42 | 15.4% | 100% | |
| Secondary set | FTC | 14 | 21.4% | 69 | 7.1% | 28.6% |
| FTA | 12 | 25% | 49.5 | 0% | 75% | |
| Total | - | 52 | 21.2% | 60.5 | 17.3% | 75% |
| Histopathological Diagnosis | Number of Samples | % of Men | Median Age (Years) | Frequency of Oncocytic Tumours |
|---|---|---|---|---|
| FTC | 31 | 32.3% | 59 | 61.3% |
| FTA | 40 | 12.5% | 45 | 15% |
| Total | 71 | 21.1% | 52 | 35.2% |
© 2017 by the authors. Licensee MDPI, Basel, Switzerland. This article is an open access article distributed under the terms and conditions of the Creative Commons Attribution (CC BY) license (http://creativecommons.org/licenses/by/4.0/).
Share and Cite
Wojtas, B.; Pfeifer, A.; Oczko-Wojciechowska, M.; Krajewska, J.; Czarniecka, A.; Kukulska, A.; Eszlinger, M.; Musholt, T.; Stokowy, T.; Swierniak, M.; et al. Gene Expression (mRNA) Markers for Differentiating between Malignant and Benign Follicular Thyroid Tumours. Int. J. Mol. Sci. 2017, 18, 1184. https://0-doi-org.brum.beds.ac.uk/10.3390/ijms18061184
Wojtas B, Pfeifer A, Oczko-Wojciechowska M, Krajewska J, Czarniecka A, Kukulska A, Eszlinger M, Musholt T, Stokowy T, Swierniak M, et al. Gene Expression (mRNA) Markers for Differentiating between Malignant and Benign Follicular Thyroid Tumours. International Journal of Molecular Sciences. 2017; 18(6):1184. https://0-doi-org.brum.beds.ac.uk/10.3390/ijms18061184
Chicago/Turabian StyleWojtas, Bartosz, Aleksandra Pfeifer, Malgorzata Oczko-Wojciechowska, Jolanta Krajewska, Agnieszka Czarniecka, Aleksandra Kukulska, Markus Eszlinger, Thomas Musholt, Tomasz Stokowy, Michal Swierniak, and et al. 2017. "Gene Expression (mRNA) Markers for Differentiating between Malignant and Benign Follicular Thyroid Tumours" International Journal of Molecular Sciences 18, no. 6: 1184. https://0-doi-org.brum.beds.ac.uk/10.3390/ijms18061184