Co-Expression Network and Pathway Analyses Reveal Important Modules of miRNAs Regulating Milk Yield and Component Traits


Abstract
:
1. Introduction
2. Results
2.1. Milk Component Yield Trend during a Lactation Curve
2.2. Important miRNA Modules for Milk and Component Yields
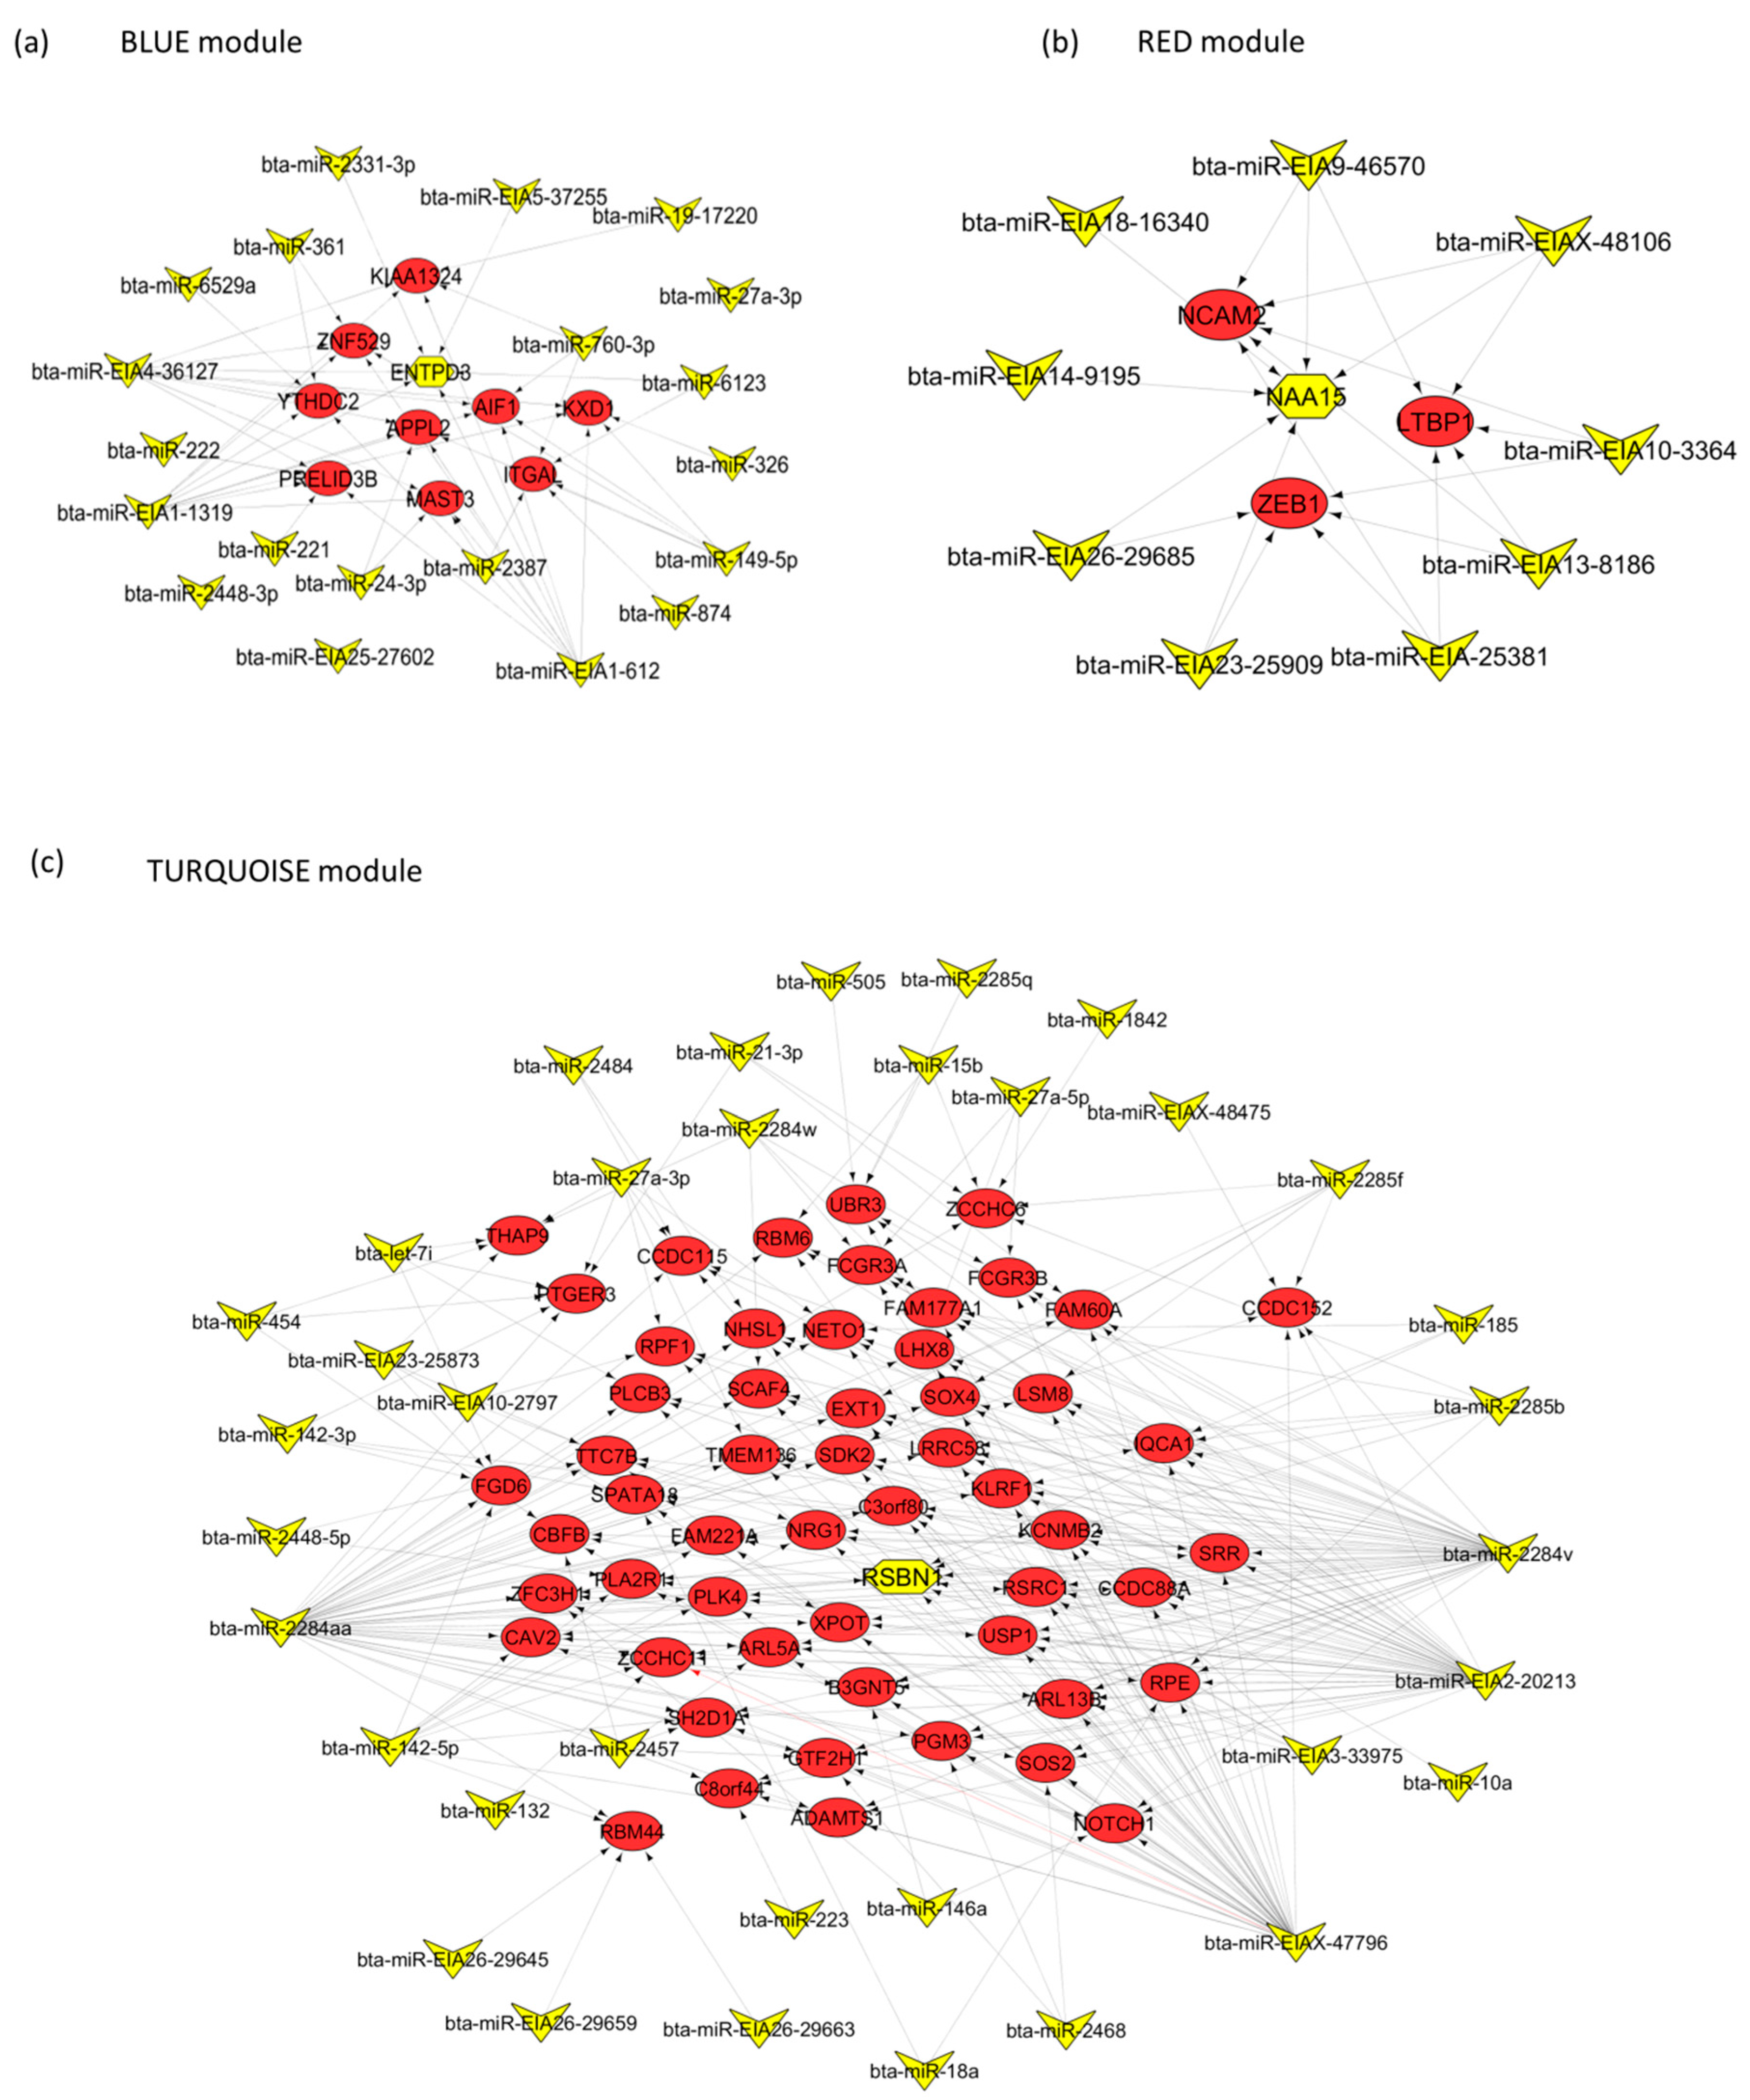
2.3. Target Genes of miRNA Members in BLUE, GREEN, TURQUOISE and RED Modules
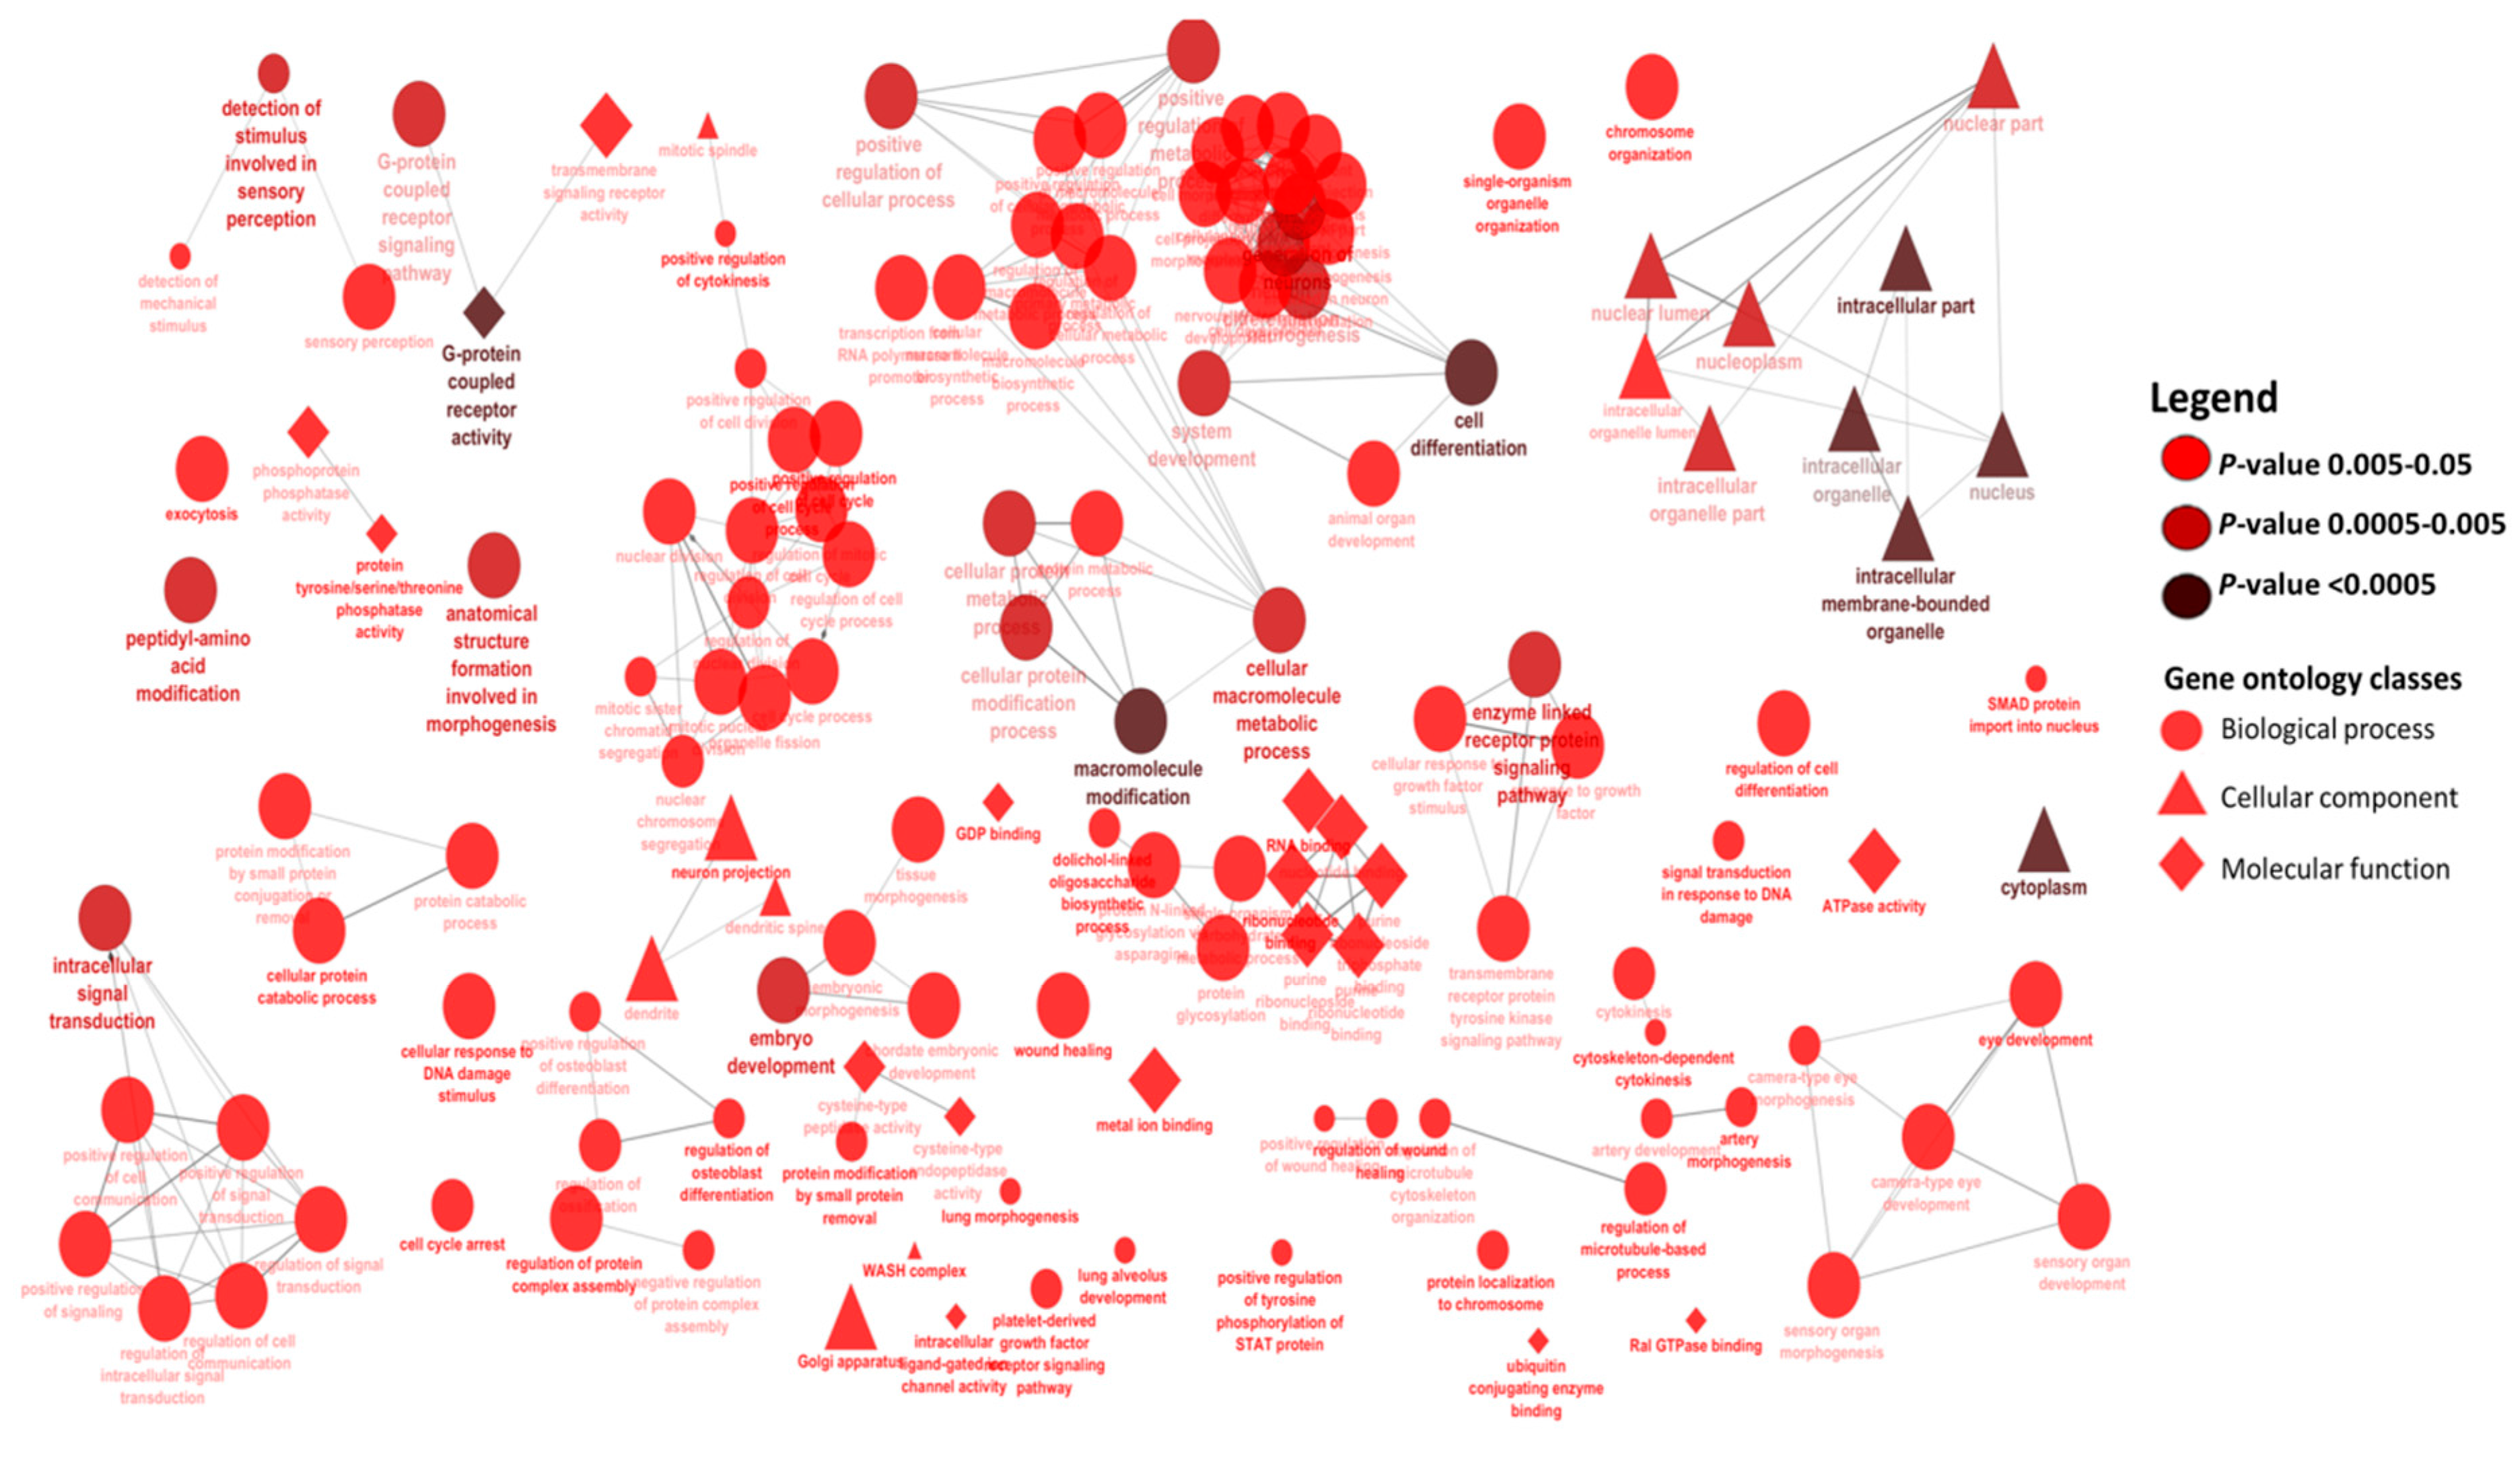
2.4. Enriched Gene Ontologies for Target Genes of miRNA Members of the BLUE, GREEN, TURQUOISE and RED Modules
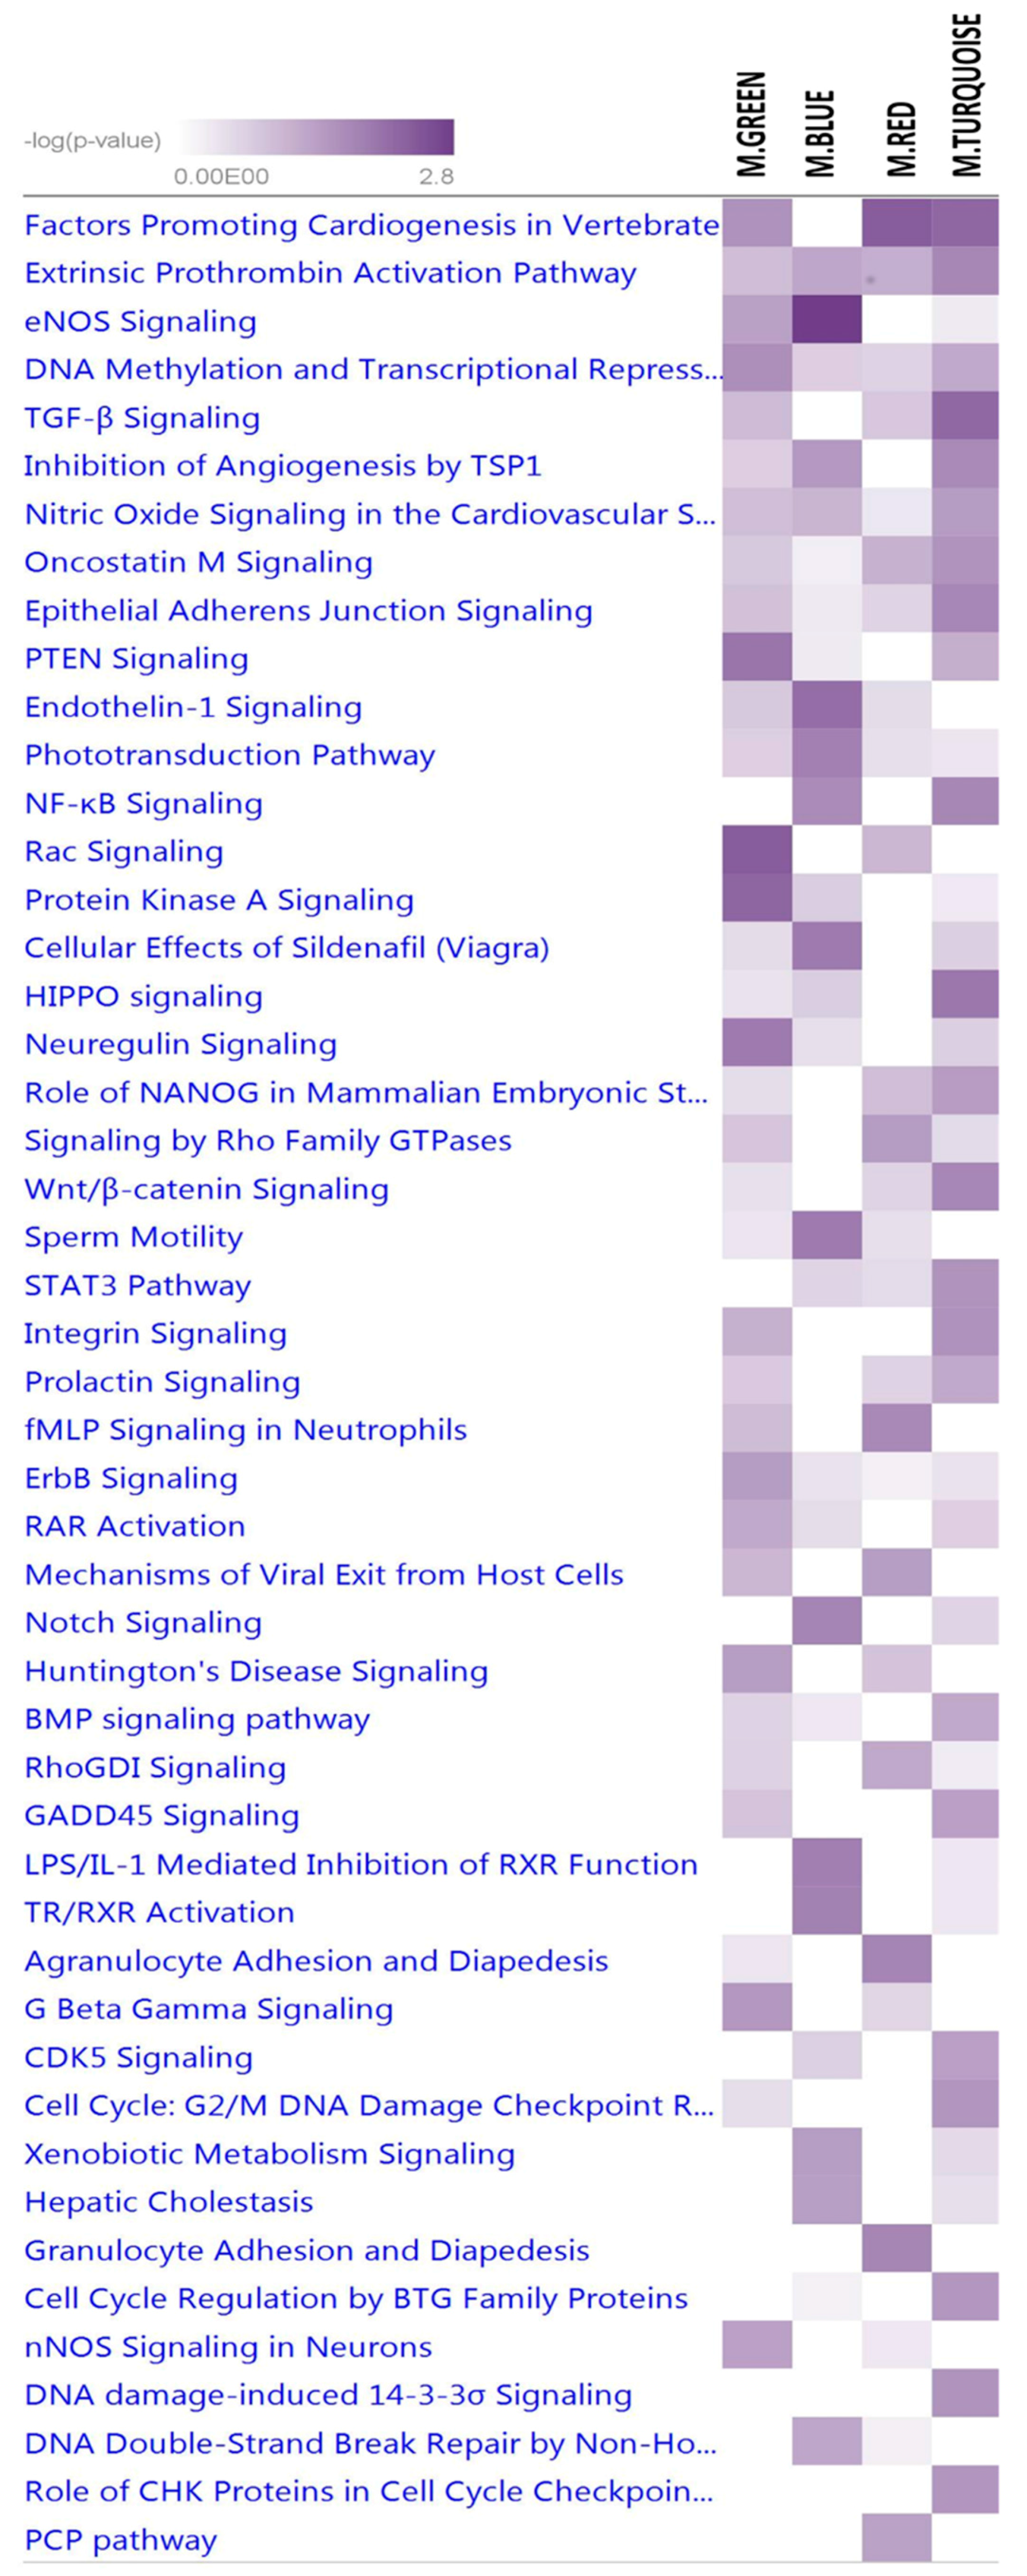
2.5. Signaling Pathways and Transcription Factors Enriched for miRNA Members of the BLUE, GREEN, TURQUOISE and RED Modules
3. Discussion
3.1. Milk Yield and Components during Lactation
3.2. miRNAs, Hub Target Genes, Gene Ontologies, Pathways and Transcription Factors Involved in Milk Yield
3.3. miRNAs, Hub Genes, Gene Ontologies, Pathways, and Transcription Factors Regulating Milk Components
4. Materials and Methods
4.1. Animal Management and Milk Sampling
4.2. Milk Component Analysis
4.3. Statistical Analysis
4.4. Total RNA Isolation, miRNA Sequencing, and Bioinformatics Management of Data
4.5. Gene Co-Expression Network Analysis
4.6. Function Enrichment of Target Genes of miRNAs in Significant Modules
5. Conclusions
Supplementary Materials
Acknowledgments
Author Contributions
Disclaimer
Conflicts of Interest
References
- Arner, P.; Kulyté, A. MicroRNA regulatory networks in human adipose tissue and obesity. Nat. Rev. Endocrinol. 2015, 11, 276–288. [Google Scholar] [CrossRef] [PubMed]
- Bandyopadhyay, S.; Bhattacharyya, M. Analyzing miRNA co-expression networks to explore TF-miRNA regulation. BMC Bioinform. 2009, 10, 163. [Google Scholar] [CrossRef] [PubMed]
- Xu, J.; Shao, T.; Ding, N.; Li, Y.; Li, X. miRNA–miRNA crosstalk: From genomics to phenomics. Brief. Bioinform. 2016, bbw073. [Google Scholar] [CrossRef] [PubMed]
- Na, Y.-J.; Kim, J.H. Understanding cooperativity of microRNAs via microRNA association networks. BMC Genom. 2013, 14, S17. [Google Scholar] [CrossRef] [PubMed]
- Xu, J.; Li, C.-X.; Li, Y.-S.; Lv, J.-Y.; Ma, Y.; Shao, T.-T.; Xu, L.-D.; Wang, Y.-Y.; Du, L.; Zhang, Y.-P. MiRNA–miRNA synergistic network: Construction via co-regulating functional modules and disease miRNA topological features. Nucleic Acids Res. 2011, 39, 825–836. [Google Scholar] [CrossRef] [PubMed]
- Stäehler, C.F.; Keller, A.; Leidinger, P.; Backes, C.; Chandran, A.; Wischhusen, J.; Meder, B.; Meese, E. Whole miRNome-wide differential co-expression of microRNAs. Genom. Proteom. Bioinform. 2012, 10, 285–294. [Google Scholar] [CrossRef] [PubMed]
- Xiao, Y.; Xu, C.; Guan, J.; Ping, Y.; Fan, H.; Li, Y.; Zhao, H.; Li, X. Discovering dysfunction of multiple microRNAs cooperation in disease by a conserved microRNA co-expression network. PLoS ONE 2012, 7, e32201. [Google Scholar] [CrossRef] [PubMed]
- Yang, Y.; Han, L.; Yuan, Y.; Li, J.; Hei, N.; Liang, H. Gene co-expression network analysis reveals common system-level properties of prognostic genes across cancer types. Nat. Commun. 2014, 5, 3231. [Google Scholar] [CrossRef] [PubMed]
- Li, Z.; Liu, H.; Jin, X.; Lo, L.; Liu, J. Expression profiles of microRNAs from lactating and non-lactating bovine mammary glands and identification of miRNA related to lactation. BMC Genom. 2012, 13, 731. [Google Scholar] [CrossRef] [PubMed]
- Le Guillou, S.; Sdassi, N.; Laubier, J.; Passet, B.; Vilotte, M.; Castille, J.; Laloë, D.; Polyte, J.; Bouet, S.; Jaffrézic, F. Overexpression of miR-30b in the developing mouse mammary gland causes a lactation defect and delays involution. PLoS ONE 2012, 7, e45727. [Google Scholar] [CrossRef] [PubMed]
- Li, D.; Xie, X.; Wang, J.; Bian, Y.; Li, Q.; Gao, X.; Wang, C. MiR-486 regulates lactation and targets the PTEN gene in cow mammary glands. PLoS ONE 2015, 10, e0118284. [Google Scholar] [CrossRef] [PubMed]
- Ji, Z.; Dong, F.; Wang, G.; Hou, L.; Liu, Z.; Chao, T.; Wang, J. miR-135a Targets and regulates prolactin receptor gene in goat mammary epithelial cells. DNA Cell. Biol. 2015, 34, 534–540. [Google Scholar] [CrossRef] [PubMed]
- Wang, J.; Bian, Y.; Wang, Z.; Li, D.; Wang, C.; Li, Q.; Gao, X. MicroRNA-152 regulates DNA methyltransferase 1 and is involved in the development and lactation of mammary glands in dairy cows. PLoS ONE 2014, 9, e101358. [Google Scholar] [CrossRef] [PubMed]
- Feuermann, Y.; Kang, K.; Shamay, A.; Robinson, G.W.; Hennighausen, L. miR-21 is under control of STAT5 but is dispensable for mammary development and lactation. PLoS ONE 2014, 9, e85123. [Google Scholar] [CrossRef] [PubMed]
- Li, H.-M.; Wang, C.-M.; Li, Q.-Z.; Gao, X.-J. MiR-15a decreases bovine mammary epithelial cell viability and lactation and regulates growth hormone receptor expression. Molecules 2012, 17, 12037–12048. [Google Scholar] [CrossRef] [PubMed]
- Tanaka, T.; Haneda, S.; Imakawa, K.; Sakai, S.; Nagaoka, K. A microRNA, miR-101a, controls mammary gland development by regulating cyclooxygenase-2 expression. Differentiation 2009, 77, 181–187. [Google Scholar] [CrossRef] [PubMed]
- Bian, Y.; Lei, Y.; Wang, C.; Wang, J.; Wang, L.; Liu, L.; Liu, L.; Gao, X.; Li, Q. Epigenetic regulation of miR-29s affects the lactation activity of dairy cow mammary epithelial cells. J. Cell. Physiol. 2015, 230, 2152–2163. [Google Scholar] [CrossRef] [PubMed]
- Li, R.; Beaudoin, F.; Ammah, A.A.; Bissonnette, N.; Benchaar, C.; Zhao, X.; Lei, C.; Ibeagha-Awemu, E.M. Deep sequencing shows microRNA involvement in bovine mammary gland adaptation to diets supplemented with linseed oil or safflower oil. BMC Genom. 2015, 16, 884. [Google Scholar] [CrossRef] [PubMed]
- Do, D.N.; Li, R.; Dudemaine, P.-L.; Ibeagha-Awemu, E.M. MicroRNA roles in signalling during lactation: An insight from differential expression, time course and pathway analyses of deep sequence data. Sci. Rep. 2017, 7, 44605. [Google Scholar] [CrossRef] [PubMed]
- Strucken, E.M.; Laurenson, Y.C.; Brockmann, G.A. Go with the flow—Biology and genetics of the lactation cycle. Front. Genet. 2015, 6, 118. [Google Scholar] [CrossRef] [PubMed]
- Miglior, F.; Sewalem, A.; Jamrozik, J.; Bohmanova, J.; Lefebvre, D.; Moore, R. Genetic analysis of milk urea nitrogen and lactose and their relationships with other production traits in Canadian Holstein cattle. J. Dairy Sci. 2007, 90, 2468–2479. [Google Scholar] [CrossRef] [PubMed]
- Wood, P.D.P. Algebraic model of the lactation curve in cattle. Nature 1967, 216, 164–165. [Google Scholar] [CrossRef]
- Ng-Kwai-Hang, K.; Hayes, J.; Moxley, J.; Monardes, H. Variability of test-day milk production and composition and relation of somatic cell counts with yield and compositional changes of bovine milk. J. Dairy Sci. 1984, 67, 361–366. [Google Scholar] [CrossRef]
- Schutz, M.; Hansen, L.; Steuernagel, G.; Kuck, A. Variation of milk, fat, protein, and somatic cells for dairy cattle. J. Dairy Sci. 1990, 73, 484–493. [Google Scholar] [CrossRef]
- Gonzalo, C.; Carriedo, J.A.; Baro, J.A.; San Primitivo, F. Factors influencing variation of test day milk yield, somatic cell count, fat, and protein in dairy sheep. J. Dairy Sci. 1994, 77, 1537–1542. [Google Scholar] [CrossRef]
- Quist, M.; LeBlanc, S.; Hand, K.; Lazenby, D.; Miglior, F.; Kelton, D. Milking-to-milking variability for milk yield, fat and protein percentage, and somatic cell count. J. Dairy Sci. 2008, 91, 3412–3423. [Google Scholar] [CrossRef] [PubMed]
- Galio, L.; Droineau, S.; Yeboah, P.; Boudiaf, H.; Bouet, S.; Truchet, S.; Devinoy, E. MicroRNA in the ovine mammary gland during early pregnancy: Spatial and temporal expression of miR-21, miR-205, and miR-200. Physiol. Genom. 2013, 45, 151–161. [Google Scholar] [CrossRef] [PubMed]
- Nagaoka, K.; Zhang, H.; Watanabe, G.; Taya, K. Epithelial cell differentiation regulated by MicroRNA-200a in mammary glands. PLoS ONE 2013, 8, e65127. [Google Scholar] [CrossRef] [PubMed]
- Jin, W.; Ibeagha-Awemu, E.M.; Liang, G.; Beaudoin, F.; Zhao, X. Transcriptome microRNA profiling of bovine mammary epithelial cells challenged with Escherichia coli or Staphylococcus aureus bacteria reveals pathogen directed microRNA expression profiles. BMC Genom. 2014, 15, 181. [Google Scholar] [CrossRef] [PubMed]
- Melnik, B.C.; Schmitz, G. Milk’s role as an epigenetic regulator in health and disease. Diseases 2017, 5, 12. [Google Scholar] [CrossRef]
- Muroya, S.; Hagi, T.; Kimura, A.; Aso, H.; Matsuzaki, M.; Nomura, M. Lactogenic hormones alter cellular and extracellular microRNA expression in bovine mammary epithelial cell culture. J. Anim. Sci. Biotechnol. 2016, 7, 8. [Google Scholar] [CrossRef] [PubMed]
- Wang, M.; Moisá, S.; Khan, M.; Wang, J.; Bu, D.; Loor, J. MicroRNA expression patterns in the bovine mammary gland are affected by stage of lactation. J. Dairy Sci. 2012, 95, 6529–6535. [Google Scholar] [CrossRef] [PubMed]
- Chen, X.; Gao, C.; Li, H.; Huang, L.; Sun, Q.; Dong, Y.; Tian, C.; Gao, S.; Dong, H.; Guan, D. Identification and characterization of microRNAs in raw milk during different periods of lactation, commercial fluid, and powdered milk products. Cell. Res. 2010, 20, 1128–1137. [Google Scholar] [CrossRef] [PubMed]
- Li, R.; Dudemaine, P.L.; Zhao, X.; Lei, C.; Ibeagha-Awemu, E.M. Comparative analysis of the miRNome of bovine milk fat, whey and cells. PLoS ONE 2016, 11, e0154129. [Google Scholar] [CrossRef] [PubMed]
- Mateescu, B.; Batista, L.; Cardon, M.; Gruosso, T.; de Feraudy, Y.; Mariani, O.; Nicolas, A.; Meyniel, J.-P.; Cottu, P.; Sastre-Garau, X.; Mechta-Grigoriou, F. MiR-141 and miR-200a act on ovarian tumorigenesis by controlling oxidative stress response. Nat. Med. 2011, 17, 1627–1635. [Google Scholar] [CrossRef] [PubMed]
- Guo, S.-L.; Peng, Z.; Yang, X.; Fan, K.-J.; Ye, H.; Li, Z.-H.; Wang, Y.; Xu, X.-L.; Li, J.; Wang, Y.-L. MiR-148a promoted cell proliferation by targeting p27 in gastric cancer cells. Int. J. Biol. Sci. 2011, 7, 567–574. [Google Scholar] [CrossRef] [PubMed]
- Aydoğdu, E.; Katchy, A.; Tsouko, E.; Lin, C.-Y.; Haldosén, L.-A.; Helguero, L.; Williams, C. MicroRNA-regulated gene networks during mammary cell differentiation are associated with breast cancer. Carcinogenesis 2012, 33, 1502–1511. [Google Scholar] [CrossRef] [PubMed]
- Inostroza, A.; Mermelstein, F.H.; Ha, I.; Lane, W.S.; Reinberg, D. Dr1, a TATA-binding protein-associated phosphoprotein and inhibitor of class II gene transcription. Cell 1992, 70, 477–489. [Google Scholar] [CrossRef]
- Higgs, H.N.; Han, M.H.; Johnson, G.E.; Glomset, J.A. Cloning of a phosphatidic acid-preferring phospholipase A1 from bovine testis. J. Biol. Chem. 1998, 273, 5468–5477. [Google Scholar] [CrossRef] [PubMed]
- Richmond, G.S.; Smith, T.K. Phospholipases A1. Int. J. Mol. Sci. 2011, 12, 588–612. [Google Scholar] [CrossRef] [PubMed] [Green Version]
- Patton, J.; Kenny, D.; McNamara, S.; Mee, J.; O’mara, F.; Diskin, M.; Murphy, J. Relationships among milk production, energy balance, plasma analytes, and reproduction in Holstein-Friesian cows. J. Dairy Sci. 2007, 90, 649–658. [Google Scholar] [CrossRef]
- Hansen, L. Consequences of selection for milk yield from a geneticist’s viewpoint. J. Dairy Sci. 2000, 83, 1145–1150. [Google Scholar] [CrossRef]
- Buckley, F.; O’sullivan, K.; Mee, J.; Evans, R.; Dillon, P. Relationships among milk yield, body condition, cow weight, and reproduction in spring-calved Holstein-Friesians. J. Dairy Sci. 2003, 86, 2308–2319. [Google Scholar] [CrossRef]
- Wang, Z.; Hou, X.; Qu, B.; Wang, J.; Gao, X.; Li, Q. Pten regulates development and lactation in the mammary glands of dairy cows. PLoS ONE 2014, 9, e102118. [Google Scholar] [CrossRef] [PubMed]
- Hennighausen, L.; Robinson, G.W.; Wagner, K.-U.; Liu, X. Prolactin signaling in mammary gland development. J. Biol. Chem. 1997, 272, 7567–7569. [Google Scholar] [CrossRef] [PubMed]
- Robinson, S.D.; Roberts, A.B.; Daniel, C.W. TGF β suppresses casein synthesis in mouse mammary explants and may play a role in controlling milk levels during pregnancy. J. Cell. Biol. 1993, 120, 245–251. [Google Scholar] [CrossRef] [PubMed]
- Saito, S.; Yoshida, M.; Ichijo, M.; Ishizaka, S.; TSUJH, T. Transforming growth factor-β (TGF-β) in human milk. Clin. Exp. Immunol. 1993, 94, 220–224. [Google Scholar] [CrossRef] [PubMed]
- Hobert, O. Common logic of transcription factor and microRNA action. Trends Biochem. Sci. 2004, 29, 462–468. [Google Scholar] [CrossRef] [PubMed]
- Shalgi, R.; Lieber, D.; Oren, M.; Pilpel, Y. Global and local architecture of the mammalian microRNA–transcription factor regulatory network. PLoS Comput. Biol. 2007, 3, e131. [Google Scholar] [CrossRef] [PubMed]
- Hobert, O. Gene regulation by transcription factors and microRNAs. Science 2008, 319, 1785–1786. [Google Scholar] [CrossRef] [PubMed]
- Barbera, J.M.; Clements, M.; Thomas, P.; Rodriguez, T.; Meloy, D.; Kioussis, D.; Beddington, R. The homeobox gene Hex is required in definitive endodermal tissues for normal forebrain, liver and thyroid formation. Development 2000, 127, 2433–2445. [Google Scholar]
- Puppin, C.; Puglisi, F.; Pellizzari, L.; Manfioletti, G.; Pestrin, M.; Pandolfi, M.; Piga, A.; Di Loreto, C.; Damante, G. HEX expression and localization in normal mammary gland and breast carcinoma. BMC Cancer 2006, 6, 192. [Google Scholar] [CrossRef] [PubMed]
- Fu, M.; Wang, C.; Li, Z.; Sakamaki, T.; Pestell, R.G. Minireview: Cyclin D1: Normal and abnormal functions. Endocrinology 2004, 145, 5439–5447. [Google Scholar] [CrossRef] [PubMed]
- Morey, L.; Aloia, L.; Cozzuto, L.; Benitah, S.A.; Di Croce, L. RYBP and Cbx7 define specific biological functions of polycomb complexes in mouse embryonic stem cells. Cell. Rep. 2013, 3, 60–69. [Google Scholar] [CrossRef] [PubMed]
- Livingstone, L.R.; White, A.; Sprouse, J.; Livanos, E.; Jacks, T.; Tlsty, T.D. Altered cell cycle arrest and gene amplification potential accompany loss of wild-type p53. Cell 1992, 70, 923–935. [Google Scholar] [CrossRef]
- Humphreys, K.J.; McKinnon, R.A.; Michael, M.Z. MiR-18a inhibits CDC42 and plays a tumour suppressor role in colorectal cancer cells. PLoS ONE 2014, 9, e112288. [Google Scholar] [CrossRef] [PubMed]
- Mogilyansky, E.; Rigoutsos, I. The miR-17/92 cluster: A comprehensive update on its genomics, genetics, functions and increasingly important and numerous roles in health and disease. Cell. Death Differ. 2013, 20, 1603–1614. [Google Scholar] [CrossRef] [PubMed]
- Wu, W.; Takanashi, M.; Borjigin, N.; Ohno, S.; Fujita, K.; Hoshino, S.; Osaka, Y.; Tsuchida, A.; Kuroda, M. MicroRNA-18a modulates STAT3 activity through negative regulation of PIAS3 during gastric adenocarcinogenesis. Br. J. Cancer 2013, 108, 653–661. [Google Scholar] [CrossRef] [PubMed]
- Cai, Y.; Chen, H.; Jin, L.; You, Y.; Shen, J. STAT3-dependent transactivation of miRNA genes following Toxoplasma gondii infection in macrophage. Parasit. Vectors 2013, 6, 356. [Google Scholar] [CrossRef] [PubMed]
- Brock, M.; Trenkmann, M.; Gay, R.E.; Michel, B.A.; Gay, S.; Fischler, M.; Ulrich, S.; Speich, R.; Huber, L.C. Interleukin-6 modulates the expression of the bone morphogenic protein receptor type II through a novel STAT3-microRNA cluster 17/92 pathway. Circ. Res. 2009, 104, 1184–1191. [Google Scholar] [CrossRef] [PubMed]
- Rao, X.; Di Leva, G.; Li, M.; Fang, F.; Devlin, C.; Hartman-Frey, C.; Burow, M.E.; Ivan, M.; Croce, C.M.; Nephew, K.P. MicroRNA-221/222 confers breast cancer fulvestrant resistance by regulating multiple signaling pathways. Oncogene 2011, 30, 1082–1097. [Google Scholar] [CrossRef] [PubMed]
- Hwang, M.S.; Yu, N.; Stinson, S.Y.; Yue, P.; Newman, R.J.; Allan, B.B.; Dornan, D. MiR-221/222 targets adiponectin receptor 1 to promote the epithelial-to-mesenchymal transition in breast cancer. PLoS ONE 2013, 8, e66502. [Google Scholar] [CrossRef] [PubMed]
- Ye, X.; Bai, W.; Zhu, H.; Zhang, X.; Chen, Y.; Wang, L.; Yang, A.; Zhao, J.; Jia, L. MiR-221 promotes trastuzumab-resistance and metastasis in HER2-positive breast cancers by targeting PTEN. BMB Rep. 2014, 47, 268–273. [Google Scholar] [CrossRef] [PubMed]
- Dupont, J.; Renou, J.P.; Shani, M.; Hennighausen, L.; LeRoith, D. PTEN overexpression suppresses proliferation and differentiation and enhances apoptosis of the mouse mammary epithelium. J. Clin. Investig. 2002, 110, 815–825. [Google Scholar] [CrossRef] [PubMed]
- Chen, C.-C.; Stairs, D.B.; Boxer, R.B.; Belka, G.K.; Horseman, N.D.; Alvarez, J.V.; Chodosh, L.A. Autocrine prolactin induced by the Pten–Akt pathway is required for lactation initiation and provides a direct link between the Akt and STAT5 pathways. Genes Dev. 2012, 26, 2154–2168. [Google Scholar] [CrossRef] [PubMed]
- Carbon, S.; Ireland, A.; Mungall, C.J.; Shu, S.; Marshall, B.; Lewis, S.; Group, W.P.W. AmiGO: Online access to ontology and annotation data. Bioinformatics 2009, 25, 288–289. [Google Scholar] [CrossRef] [PubMed]
- Wickramasinghe, S.; Rincon, G.; Islas-Trejo, A.; Medrano, J.F. Transcriptional profiling of bovine milk using RNA sequencing. BMC Genom. 2012, 13, 45. [Google Scholar] [CrossRef] [PubMed]
- Willets, J.M.; Brighton, P.J.; Mistry, R.; Morris, G.E.; Konje, J.C.; Challiss, R.J. Regulation of oxytocin receptor responsiveness by G protein-coupled receptor kinase 6 in human myometrial smooth muscle. Mol. Endocrinol. 2009, 23, 1272–1280. [Google Scholar] [CrossRef] [PubMed]
- Neville, M.C.; McFadden, T.B.; Forsyth, I. Hormonal regulation of mammary differentiation and milk secretion. J. Mammary Gland Biol. Neoplasia 2002, 7, 49–66. [Google Scholar] [CrossRef] [PubMed]
- Lefcourt, A.M.; Akers, R.M. Is oxytocin really necessary for efficient milk removal in dairy cows? J. Dairy Sci. 1983, 66, 2251–2259. [Google Scholar] [CrossRef]
- Armstrong, D.; Hansel, W. Alteration of the bovine estrous cycle with oxytocin. J. Dairy Sci. 1959, 42, 533–542. [Google Scholar] [CrossRef]
- Politi, K.; Feirt, N.; Kitajewski, J. Notch in mammary gland development and breast cancer. Semin. Cancer Biol. 2004, 14, 341–347. [Google Scholar] [CrossRef] [PubMed]
- Yalcin-Ozuysal, Ö.; Fiche, M.; Guitierrez, M.; Wagner, K.-U.; Raffoul, W.; Brisken, C. Antagonistic roles of Notch and p63 in controlling mammary epithelial cell fates. Cell. Death Differ. 2010, 17, 1600–1612. [Google Scholar] [CrossRef] [PubMed]
- Tiwari, N.; Tiwari, V.K.; Waldmeier, L.; Balwierz, P.J.; Arnold, P.; Pachkov, M.; Meyer-Schaller, N.; Schübeler, D.; van Nimwegen, E.; Christofori, G. Sox4 Is a master regulator of epithelial-mesenchymal transition by controlling EZH2 expression and epigenetic reprogramming. Cancer Cell. 2013, 23, 768–783. [Google Scholar] [CrossRef] [PubMed] [Green Version]
- Lapébie, P.; Borchiellini, C.; Houliston, E. Dissecting the PCP pathway: One or more pathways? Bioessays 2011, 33, 759–768. [Google Scholar] [CrossRef] [PubMed]
- Wansleeben, C.; Meijlink, F. The planar cell polarity pathway in vertebrate development. Dev. Dynam. 2011, 240, 616–626. [Google Scholar] [CrossRef] [PubMed]
- Cortijo, C.; Gouzi, M.; Tissir, F.; Grapin-Botton, A. Planar cell polarity controls pancreatic β cell differentiation and glucose homeostasis. Cell. Rep. 2012, 2, 1593–1606. [Google Scholar] [CrossRef] [PubMed]
- Walck-Shannon, E.; Hardin, J. Cell intercalation from top to bottom. Nat. Rev. Mol. Cell. Biol. 2014, 15, 34–48. [Google Scholar] [CrossRef] [PubMed]
- Oh, I.-H.; Reddy, E.P. The myb gene family in cell growth, differentiation and apoptosis. Oncogene 1999, 18, 3017–3033. [Google Scholar] [CrossRef] [PubMed]
- Lai, E.C.; Wiel, C.; Rubin, G.M. Complementary miRNA pairs suggest a regulatory role for miRNA: miRNA duplexes. RNA 2004, 10, 171–175. [Google Scholar] [CrossRef] [PubMed]
- He, L.; Hannon, G.J. MicroRNAs: Small RNAs with a big role in gene regulation. Nat. Rev. Genet. 2004, 5, 522–531. [Google Scholar] [CrossRef] [PubMed]
- Carraro, G.; Shrestha, A.; Rostkovius, J.; Contreras, A.; Chao, C.-M.; El Agha, E.; MacKenzie, B.; Dilai, S.; Guidolin, D.; Taketo, M.M. MiR-142–3p balances proliferation and differentiation of mesenchymal cells during lung development. Development 2014, 141, 1272–1281. [Google Scholar] [CrossRef] [PubMed]
- Sun, W.; Shen, W.; Yang, S.; Hu, F.; Li, H.; Zhu, T.-H. MiR-223 and miR-142 attenuate hematopoietic cell proliferation, and miR-223 positively regulates miR-142 through LMO2 isoforms and CEBP-β. Cell. Res. 2010, 20, 1158–1169. [Google Scholar] [CrossRef] [PubMed]
- Chapman, R.S.; Lourenco, P.; Tonner, E.; Flint, D.; Selbert, S.; Takeda, K.; Akira, S.; Clarke, A.R.; Watson, C.J. The role of STAT3 in apoptosis and mammary gland involution. Biol. Mammary Gland 2002, 129–138. [Google Scholar] [CrossRef]
- Philp, J.A.; Burdon, T.G.; Watson, C.J. Differential activation of STATs 3 and 5 during mammary gland development. FEBS Lett. 1996, 396, 77–80. [Google Scholar] [CrossRef] [Green Version]
- Anderson, S.T.; Barclay, J.L.; Fanning, K.J.; Kusters, D.H.; Waters, M.J.; Curlewis, J.D. Mechanisms underlying the diminished sensitivity to prolactin negative feedback during lactation: Reduced STAT5 signaling and up-regulation of cytokine-inducible SH2 domain-containing protein (CIS) expression in tuberoinfundibular dopaminergic neurons. Endocrinology 2006, 147, 1195–1202. [Google Scholar] [CrossRef] [PubMed]
- Reichenstein, M.; Rauner, G.; Barash, I. Conditional repression of STAT5 expression during lactation reveals its exclusive roles in mammary gland morphology, milk-protein gene expression, and neonate growth. Mol. Reprod. Dev. 2011, 78, 585–596. [Google Scholar] [CrossRef] [PubMed]
- Gallego, M.I.; Binart, N.; Robinson, G.W.; Okagaki, R.; Coschigano, K.T.; Perry, J.; Kopchick, J.J.; Oka, T.; Kelly, P.A.; Hennighausen, L. Prolactin, growth hormone, and epidermal growth factor activate STAT5 in different compartments of mammary tissue and exert different and overlapping developmental effects. Dev. Biol. 2001, 229, 163–175. [Google Scholar] [CrossRef] [PubMed]
- Barash, I. STAT5 in the mammary gland: Controlling normal development and cancer. J. Cell. Phys. 2006, 209, 305–313. [Google Scholar] [CrossRef] [PubMed]
- Friedlander, M.R.; Chen, W.; Adamidi, C.; Maaskola, J.; Einspanier, R.; Knespel, S.; Rajewsky, N. Discovering microRNAs from deep sequencing data using miRDeep. Nat. Biotechnol. 2008, 26, 407–415. [Google Scholar] [CrossRef] [PubMed]
- Love, M.I.; Huber, W.; Anders, S. Moderated estimation of fold change and dispersion for RNA-seq data with DESeq2. Genome Biol. 2014, 15, 550. [Google Scholar] [CrossRef] [PubMed]
- Langfelder, P.; Horvath, S. WGCNA: An R package for weighted correlation network analysis. BMC Bioinform. 2008, 9, 559. [Google Scholar] [CrossRef] [PubMed]
- Langfelder, P.; Zhang, B.; Horvath, S. Defining clusters from a hierarchical cluster tree: The Dynamic Tree Cut package for R. Bioinformatics 2008, 24, 719–720. [Google Scholar] [CrossRef] [PubMed]
- Fuller, T.F.; Ghazalpour, A.; Aten, J.E.; Drake, T.A.; Lusis, A.J.; Horvath, S. Weighted gene coexpression network analysis strategies applied to mouse weight. Mamm. Genome 2007, 18, 463–472. [Google Scholar] [CrossRef] [PubMed]
- Bindea, G.; Mlecnik, B.; Hackl, H.; Charoentong, P.; Tosolini, M.; Kirilovsky, A.; Fridman, W.-H.; Pagès, F.; Trajanoski, Z.; Galon, J. ClueGO: A Cytoscape plug-in to decipher functionally grouped gene ontology and pathway annotation networks. Bioinformatics 2009, 25, 1091–1093. [Google Scholar] [CrossRef] [PubMed]


| Lactation Day | Milk Yield (kg) | Fat% | Protein% | Milk Urea Nitrogent (mg/dL) | Lactose% | Log of Somatic Cell Count |
|---|---|---|---|---|---|---|
| Day 30 | 41.18 a ± 1.99 | 5.50 b ± 2.26 | 2.98 a ± 0.29 | 11.91 a ± 1.55 | 4.36 a ± 0.17 | 4.92 a ± 0.46 |
| Day 70 | 42.50 a ± 1.86 | 5.63 b ± 1.61 | 2.77 a ± 0.28 | 12.46 a ± 3.60 | 4.05 a ± 0.70 | 5.23 a ± 0.82 |
| Day 130 | 42.04 a ± 2.16 | 3.96 a ± 1.89 | 2.99 a ± 0.29 | 12.62 a ± 1.57 | 4.14 a ± 0.54 | 5.26 a ± 0.82 |
| Day 170 | 38.38 a ± 1.86 | 5.05 b ± 1.36 | 3.11 a ± 0.14 | 16.22 b ± 5.41 | 4.30 a ± 0.16 | 5.22 a ± 1.02 |
| Day 230 | 31.99 b ± 2.16 | 4.63 b ± 0.72 | 3.45 b ± 0.54 | 13.03 a ± 2.12 | 3.16 b ± 1.21 | 5.89 b ± 0.78 |
| Day 290 | 25.69 b ± 1.86 | 4.46 a ± 1.08 | 3.57 b ± 0.40 | 12.85 a ± 4.85 | 3.33 b ± 0.93 | 5.88 b ± 0.91 |
| Over all p-value, day effect | <0.001 | 0.132 | <0.001 | 0.023 | 0.001 | 0.001 |
| miRNA | Module Membership (Eigenvalue) | p-Value of Module Membership | 1 rMilk | p-Value rMilk | Total Target Genes | 2 Unique Targets | 3 Shared Targets |
|---|---|---|---|---|---|---|---|
| bta-miR-EIA12-6501 | 0.82 | 2.64 × 10⁻⁸ | 0.32 | 7.60 × 10⁻³ | 159 | 83 | 76 |
| bta-miR-EIA13-7336 | 0.84 | 4.14 × 10⁻²⁰ | 0.41 | 4.22 × 10⁻⁴ | 151 | 77 | 74 |
| bta-miR-141 | 0.80 | 8.53 × 10⁻¹⁷ | 0.47 | 3.74 × 10⁻⁵ | 209 | 101 | 108 |
| bta-miR-EIA14-10137 | 0.82 | 3.06 × 10⁻¹⁸ | 0.35 | 3.12 × 10⁻³ | 241 | 117 | 124 |
| bta-miR-148a | 0.84 | 2.34 × 10⁻¹⁹ | 0.54 | 1.36 × 10⁻⁶ | 162 | 147 | 15 |
| bta-miR-186 | 0.82 | 5.08 × 10⁻¹⁸ | 0.58 | 1.67 × 10⁻⁷ | 383 | 362 | 21 |
| bta-miR-200a | 0.81 | 1.43 × 10⁻¹⁷ | 0.52 | 4.53 × 10⁻⁶ | 240 | 123 | 117 |
| bta-miR-2285c | 0.84 | 6.30 × 10⁻²⁰ | 0.35 | 3.23 × 10⁻³ | 124 | 54 | 70 |
| bta-miR-2285e | 0.82 | 1.76 × 10⁻¹⁸ | 0.31 | 1.01 × 10⁻² | 124 | 55 | 69 |
| bta-miR-EIA3-34194 | 0.82 | 6.02 × 10⁻¹⁸ | 0.32 | 6.87 × 10⁻³ | 209 | 96 | 113 |
| bta-miR-6522 | 0.80 | 5.36 × 10⁻¹⁷ | 0.47 | 4.11 × 10⁻⁵ | 18 | 17 | 1 |
| miRNA | Module Membership (Eigenvalue) | p-Value of Module Membership | 1 rLactose | p-Value rLactose | Total Target Genes | 2 Unique Targets | 3 Shared Targets |
|---|---|---|---|---|---|---|---|
| bta-miR-EIA1-1319 | 0.80 | 4.73 × 10⁻¹⁷ | −0.42 | 2.98 × 10⁻⁴ | 214 | 68 | 146 |
| bta-miR-EIA11-5700 | 0.88 | 7.65 × 10⁻²⁴ | −0.43 | 1.78 × 10⁻⁴ | 214 | 62 | 152 |
| bta-miR-1249 | 0.82 | 3.14 × 10⁻¹⁸ | −0.50 | 1.15 × 10⁻⁵ | 90 | 75 | 15 |
| bta-miR-149-5p | 0.94 | 1.06 × 10⁻³⁴ | −0.54 | 1.64 × 10⁻⁶ | 33 | 24 | 9 |
| bta-miR-EIA1-612 | 0.80 | 4.73 × 10⁻¹⁷ | −0.42 | 2.98 × 10⁻⁴ | 209 | 167 | 42 |
| bta-miR-18a | 0.84 | 8.66 × 10⁻²⁰ | −0.65 | 1.20 × 10⁻⁹ | 91 | 75 | 16 |
| bta-miR-EIA19-17220 | 0.84 | 1.44 × 10⁻¹⁹ | −0.58 | 1.22 × 10⁻⁷ | 205 | 172 | 33 |
| bta-miR-221 | 0.84 | 4.68 × 10⁻²⁰ | −0.57 | 3.33 × 10⁻⁷ | 111 | 57 | 54 |
| bta-miR-222 | 0.90 | 4.11 × 10⁻²⁶ | −0.57 | 2.02 × 10⁻⁷ | 109 | 53 | 56 |
| bta-miR-2323 | 0.88 | 1.02 × 10⁻²³ | −0.53 | 2.14 × 10⁻⁶ | 110 | 93 | 17 |
| bta-miR-2331-3p | 0.84 | 1.66 × 10⁻¹⁹ | −0.45 | 7.94 × 10⁻⁵ | 182 | 153 | 29 |
| bta-miR-2346 | 0.82 | 3.32 × 10⁻¹⁸ | −0.55 | 7.62 × 10⁻⁷ | 130 | 111 | 19 |
| bta-miR-2350 | 0.81 | 2.98 × 10⁻¹⁷ | −0.38 | 9.99 × 10⁻⁴ | 119 | 101 | 18 |
| bta-miR-2387 | 0.90 | 1.06 × 10⁻²⁵ | −0.43 | 1.89 × 10⁻⁴ | 205 | 174 | 31 |
| bta-miR-2403 | 0.82 | 2.63 × 10⁻¹⁸ | −0.51 | 5.67 × 10⁻⁶ | 32 | 28 | 4 |
| bta-miR-EIA24-27575 | 0.82 | 3.31 × 10⁻¹⁸ | −0.48 | 2.81 × 10⁻⁵ | 186 | 159 | 27 |
| bta-miR-24-3p | 0.84 | 5.77 × 10⁻²⁰ | −0.65 | 1.50 × 10⁻⁹ | 27 | 19 | 8 |
| bta-miR-2448-3p | 0.87 | 3.46 × 10⁻²² | −0.41 | 3.65 × 10⁻⁴ | 99 | 83 | 16 |
| bta-miR-EIA25-27602 | 0.87 | 3.53 × 10⁻²² | −0.53 | 2.11 × 10⁻⁶ | 221 | 184 | 37 |
| bta-miR-27a-3p | 0.89 | 1.29 × 10⁻²⁴ | −0.63 | 6.10 × 10⁻⁹ | 248 | 202 | 46 |
| bta-miR-326 | 0.89 | 5.73 × 10⁻²⁵ | −0.40 | 5.94 × 10⁻⁴ | 282 | 242 | 40 |
| bta-miR-330 | 0.96 | 1.20 × 10−39 | −0.53 | 2.37 × 10⁻⁶ | 242 | 210 | 32 |
| bta-miR-3432a | 0.87 | 9.03 × 10⁻²³ | −0.40 | 6.74 × 10⁻⁴ | 22 | 20 | 2 |
| bta-miR-361 | 0.87 | 2.88 × 10⁻²² | −0.57 | 3.17 × 10⁻⁷ | 115 | 94 | 21 |
| bta-miR-378 | 0.81 | 1.86 × 10⁻¹⁷ | −0.45 | 7.84 × 10⁻⁵ | 132 | 116 | 16 |
| bta-miR-EIA4-36127 | 0.84 | 7.01 × 10⁻²⁰ | −0.45 | 8.53 × 10⁻⁵ | 214 | 59 | 155 |
| bta-miR-505 | 0.80 | 8.51 × 10⁻¹⁷ | −0.59 | 1.01 × 10⁻⁷ | 179 | 151 | 28 |
| bta-miR-EIA5-37255 | 0.83 | 1.30 × 10⁻¹⁸ | −0.38 | 1.16 × 10⁻³ | 91 | 80 | 11 |
| bta-miR-EIA5-37953 | 0.86 | 1.26 × 10⁻²¹ | −0.43 | 2.21 × 10⁻⁴ | 94 | 76 | 18 |
| bta-miR-6123 | 0.86 | 2.44 × 10⁻²¹ | −0.57 | 3.33 × 10⁻⁷ | 135 | 121 | 14 |
| bta-miR-6529a | 0.82 | 2.29 × 10⁻¹⁸ | −0.26 | 3.27 × 10⁻² | 114 | 91 | 23 |
| bta-miR-EIA7-42699 | 0.85 | 3.48 × 10⁻²⁰ | −0.57 | 2.54 × 10⁻⁷ | 28 | 26 | 2 |
| bta-miR-760-3p | 0.82 | 2.77 × 10⁻¹⁸ | −0.29 | 1.64 × 10⁻² | 223 | 184 | 39 |
| bta-miR-874 | 0.88 | 2.42 × 10⁻²³ | −0.54 | 1.36 × 10⁻⁶ | 154 | 131 | 23 |
| miRNA | Module Membership (Eigenvalue) | p-Value of Module Membership | 1 rLactose | p-Value rLactose | rCells 2 | p-Value rCells | Total Target Genes | Unique Targets 3 | Shared Targets 4 |
|---|---|---|---|---|---|---|---|---|---|
| bta-miR-EIA10-2785 | 0.80 | 5.24 × 10⁻¹⁷ | −0.37 | 1.50 × 10⁻³ | 0.31 | 8.16 × 10⁻³ | 152 | 142 | 10 |
| bta-miR-EIA10-3364 | 0.94 | 3.05 × 10⁻³³ | −0.51 | 8.25 × 10⁻⁶ | 0.52 | 4.85 × 10⁻⁶ | 101 | 30 | 71 |
| bta-miR-EIA13-8186 | 0.94 | 6.64 × 10⁻³³ | −0.51 | 5.17 × 10⁻⁶ | 0.52 | 3.37 × 10⁻⁶ | 101 | 27 | 74 |
| bta-miR-EIA13-8622 | 0.91 | 2.29 × 10⁻²⁷ | −0.47 | 4.93 × 10⁻⁵ | 0.47 | 3.40 × 10⁻⁵ | 135 | 129 | 6 |
| bta-miR-EIA14-9195 | 0.87 | 4.89 × 10⁻²³ | −0.49 | 1.87 × 10⁻⁵ | 0.51 | 7.49 × 10⁻⁶ | 55 | 27 | 28 |
| bta-miR-EIA17-14144 | 0.94 | 1.98 × 10⁻³³ | −0.52 | 4.36 × 10⁻⁶ | 0.54 | 1.34 × 10⁻⁶ | 104 | 96 | 8 |
| bta-miR-EIA18-16340 | 0.87 | 4.89 × 10⁻²³ | −0.49 | 1.87 × 10⁻⁵ | 0.51 | 7.49 × 10⁻⁶ | 55 | 26 | 29 |
| bta-miR-2285v | 0.81 | 3.28 × 10⁻¹⁷ | −0.53 | 1.91 × 10⁻⁶ | 0.52 | 3.08 × 10⁻⁶ | 20 | 18 | 2 |
| bta-miR-EIA23-25381 | 0.94 | 1.40 × 10⁻³² | −0.51 | 6.35 × 10⁻⁶ | 0.52 | 5.05 × 10⁻⁶ | 101 | 39 | 62 |
| bta-miR-EIA23-25909 | 0.87 | 7.42 × 10⁻²³ | −0.53 | 2.48 × 10⁻⁶ | 0.54 | 1.17 × 10⁻⁶ | 152 | 67 | 85 |
| bta-miR-EIA24-26839 | 0.80 | 4.55 × 10⁻¹⁷ | −0.41 | 4.24 × 10⁻⁴ | 0.48 | 2.13 × 10⁻⁵ | 11 | 10 | 1 |
| bta-miR-EIA26-29685 | 0.87 | 1.15 × 10⁻²² | −0.50 | 1.08 × 10⁻⁵ | 0.51 | 6.09 × 10⁻⁶ | 150 | 83 | 67 |
| bta-miR-EIA8-44984 | 0.88 | 7.12 × 10⁻²⁴ | −0.47 | 3.76 × 10⁻⁵ | 0.50 | 1.21 × 10⁻⁵ | 167 | 162 | 5 |
| bta-miR-EIA9-46570 | 0.94 | 3.15 × 10⁻³³ | −0.51 | 5.28 × 10⁻⁶ | 0.53 | 2.30 × 10⁻⁶ | 125 | 54 | 71 |
| bta-miR-EIAX-48106 | 0.90 | 1.86 × 10⁻²⁶ | −0.49 | 1.81 × 10⁻⁵ | 0.50 | 8.50 × 10⁻⁶ | 125 | 69 | 56 |
| miRNA | Module Membership (Eigenvalue) | p-Value of Module Membership | 1 rLactose | p-Value rLactose | 2 rCells | p-Value rCells | Total Target Genes | 3 Unique Targets | 4 Shared Target Genes |
|---|---|---|---|---|---|---|---|---|---|
| bta-let-7i | 0.88 | 3.15 × 10⁻²⁴ | −0.43 | 1.69 × 10⁻⁴ | 0.41 | 3.72 × 10⁻⁴ | 114 | 90 | 24 |
| bta-miR-EIA10-2797 | 0.83 | 9.62 × 10⁻¹⁹ | −0.39 | 9.88 × 10⁻⁴ | 0.39 | 9.26 × 10⁻⁴ | 108 | 81 | 27 |
| bta-miR-10a | 0.91 | 2.52 × 10⁻²⁷ | −0.49 | 1.67 × 10⁻⁵ | 0.54 | 1.12 × 10⁻⁶ | 87 | 67 | 20 |
| bta-miR-1249 | 0.81 | 4.51 × 10⁻¹⁷ | −0.50 | 1.15 × 10⁻⁵ | 0.54 | 1.69 × 10⁻⁶ | 33 | 27 | 6 |
| bta-miR-132 | 0.83 | 8.64 × 10⁻¹⁹ | −0.52 | 3.96 × 10⁻⁶ | 0.52 | 3.12 × 10⁻⁶ | 162 | 127 | 35 |
| bta-miR-142-3p | 0.93 | 3.20 × 10⁻³² | −0.57 | 2.32 × 10⁻⁷ | 0.58 | 1.54 × 10⁻⁶ | 210 | 162 | 48 |
| bta-miR-142-5p | 0.96 | 1.04 × 10−37 | −0.57 | 2.07 × 10⁻⁷ | 0.57 | 3.14 × 10⁻⁷ | 235 | 174 | 61 |
| bta-miR-146a | 0.93 | 2.11 × 10⁻³⁰ | −0.58 | 1.48 × 10⁻⁷ | 0.59 | 8.19 × 10⁻⁸ | 144 | 121 | 23 |
| bta-miR-147 | 0.88 | 3.94 × 10⁻²⁴ | −0.51 | 7.14 × 10⁻⁶ | 0.53 | 2.89 × 10⁻⁶ | 23 | 19 | 4 |
| bta-miR-15b | 0.88 | 1.85 × 10⁻²³ | −0.65 | 1.17 × 10⁻⁹ | 0.53 | 2.23 × 10⁻⁶ | 215 | 165 | 50 |
| bta-miR-1842 | 0.83 | 1.60 × 10⁻¹⁸ | −0.64 | 2.65 × 10⁻⁹ | 0.60 | 5.55 × 10⁻⁸ | 227 | 200 | 27 |
| bta-miR-185 | 0.80 | 9.73 × 10⁻¹⁷ | −0.37 | 1.72 × 10⁻³ | 0.44 | 1.38 × 10⁻⁴ | 260 | 219 | 41 |
| bta-miR-18a | 0.83 | 4.36 × 10⁻¹⁹ | −0.65 | 1.20 × 10⁻⁹ | 0.58 | 1.57 × 10⁻⁷ | 91 | 67 | 24 |
| bta-miR-21-3p | 0.84 | 2.23 × 10⁻¹⁹ | −0.38 | 1.15 × 10⁻³ | 0.42 | 3.09 × 10⁻⁴ | 331 | 95 | 236 |
| bta-miR-EIA2-20213 | 0.85 | 1.70 × 10⁻²⁰ | −0.41 | 4.11 × 10⁻⁴ | 0.44 | 1.16 × 10⁻⁴ | 230 | 196 | 34 |
| bta-miR-223 | 0.84 | 1.86 × 10⁻¹⁹ | −0.49 | 1.51 × 10⁻⁵ | 0.53 | 2.64 × 10⁻⁶ | 122 | 97 | 25 |
| bta-miR-2284aa | 0.87 | 5.10 × 10⁻²³ | −0.38 | 1.38 × 10⁻³ | 0.31 | 9.21 × 10⁻³ | 475 | 314 | 161 |
| bta-miR-2284v | 0.87 | 1.50 × 10⁻²² | −0.38 | 1.37 × 10⁻³ | 0.38 | 1.07 × 10⁻³ | 334 | 84 | 250 |
| bta-miR-2284w | 0.93 | 8.26 × 10⁻³² | −0.54 | 1.52 × 10⁻⁶ | 0.50 | 8.57 × 10⁻⁶ | 164 | 128 | 36 |
| bta-miR-2285b | 0.92 | 1.13 × 10⁻²⁸ | −0.43 | 2.31 × 10⁻⁴ | 0.41 | 3.80 × 10⁻⁴ | 261 | 205 | 56 |
| bta-miR-2285f | 0.92 | 2.26 × 10⁻²⁹ | −0.50 | 1.07 × 10⁻⁵ | 0.45 | 9.46 × 10⁻⁵ | 150 | 108 | 42 |
| bta-miR-2285k | 0.88 | 5.05 × 10⁻²⁴ | −0.49 | 1.69 × 10⁻⁵ | 0.46 | 7.50 × 10⁻⁵ | 24 | 21 | 3 |
| bta-miR-2285q | 0.88 | 7.27 × 10⁻²⁴ | −0.45 | 1.10 × 10⁻⁴ | 0.35 | 3.01 × 10⁻³ | 77 | 61 | 16 |
| bta-miR-EIA23-25837 | 0.82 | 1.70 × 10⁻¹⁸ | −0.48 | 3.20 × 10⁻⁵ | 0.46 | 6.50 × 10⁻⁵ | 91 | 71 | 20 |
| bta-miR-EIA23-25873 | 0.83 | 8.46 × 10⁻¹⁹ | −0.46 | 5.46 × 10⁻⁵ | 0.51 | 6.42 × 10⁻⁶ | 176 | 135 | 41 |
| bta-miR-2448-5p | 0.86 | 4.27 × 10⁻²¹ | −0.53 | 2.39 × 10⁻⁶ | 0.47 | 3.40 × 10⁻⁵ | 17 | 12 | 5 |
| bta-miR-2457 | 0.83 | 2.78 × 10⁻¹⁹ | −0.61 | 1.55 × 10⁻⁸ | 0.53 | 2.07 × 10⁻⁶ | 127 | 98 | 29 |
| bta-miR-2468 | 0.81 | 1.91 × 10⁻¹⁷ | −0.38 | 1.34 × 10⁻³ | 0.40 | 6.71 × 10⁻⁴ | 149 | 108 | 41 |
| bta-miR-2484 | 0.85 | 2.87 × 10⁻²⁰ | −0.46 | 6.14 × 10⁻⁵ | 0.50 | 1.24 × 10⁻⁵ | 86 | 66 | 20 |
| bta-miR-EIA26-29645 | 0.80 | 7.64 × 10⁻¹⁷ | −0.42 | 3.01 × 10⁻⁴ | 0.46 | 5.79 × 10⁻⁵ | 20 | 11 | 9 |
| bta-miR-EIA26-29659 | 0.80 | 7.64 × 10⁻¹⁷ | −0.42 | 3.01 × 10⁻⁴ | 0.46 | 5.79 × 10⁻⁵ | 20 | 8 | 12 |
| bta-miR-EIA26-29663 | 0.80 | 7.64 × 10⁻¹⁷ | −0.42 | 3.01 × 10⁻⁴ | 0.46 | 5.79 × 10⁻⁵ | 20 | 1 | 19 |
| bta-miR-27a-3p | 0.81 | 1.31 × 10⁻¹⁷ | −0.63 | 6.10 × 10⁻⁹ | 0.56 | 4.82 × 10⁻⁷ | 248 | 203 | 45 |
| bta-miR-27a-5p | 0.91 | 1.35 × 10⁻²⁷ | −0.50 | 1.04 × 10⁻⁵ | 0.50 | 1.07 × 10⁻⁵ | 97 | 84 | 13 |
| bta-miR-EIA3-33975 | 0.85 | 2.44 × 10⁻²⁰ | −0.55 | 6.90 × 10⁻⁷ | 0.50 | 8.53 × 10⁻⁶ | 251 | 199 | 52 |
| bta-miR-454 | 0.84 | 5.80 × 10⁻²⁰ | −0.54 | 1.20 × 10⁻⁶ | 0.51 | 5.95 × 10⁻⁶ | 125 | 98 | 27 |
| bta-miR-505 | 0.81 | 1.22 × 10⁻¹⁷ | −0.59 | 1.01 × 10⁻⁷ | 0.49 | 1.38 × 10⁻⁵ | 94 | 79 | 15 |
| bta-miR-EIAX-47796 | 0.87 | 6.77 × 10⁻²³ | −0.37 | 1.72 × 10⁻³ | 0.39 | 9.71 × 10⁻⁴ | 334 | 112 | 222 |
| bta-miR-EIAX-48475 | 0.91 | 5.57 × 10⁻²⁸ | −0.58 | 1.31 × 10⁻⁷ | 0.52 | 4.14 × 10⁻⁶ | 147 | 128 | 19 |
| Module | Transcription Factor | p-Value | Module | Transcription Factor | p-Value |
|---|---|---|---|---|---|
| M.BLUE | HOXA7 | 1.61 × 10⁻³ | M.GREEN | TP53 | 1.91 × 10⁻² |
| M.BLUE | TP53 | 1.62 × 10⁻³ | M.GREEN | SMAD2 | 2.03 × 10⁻² |
| M.BLUE | CREBBP | 2.14 × 10⁻³ | M.GREEN | VAV2 | 2.09 × 10⁻² |
| M.BLUE | PAX7 | 2.20 × 10⁻³ | M.GREEN | TAL1 | 3.01 × 10⁻² |
| M.BLUE | HHEX | 7.20 × 10⁻³ | M.GREEN | SMAD3 | 3.47 × 10⁻² |
| M.BLUE | SMARCA2 | 7.69 × 10⁻³ | M.RED | MYB | 8.41 × 10⁻⁴ |
| M.BLUE | NFIL3 | 8.19 × 10⁻³ | M.RED | LMO2 | 1.96 × 10⁻² |
| M.BLUE | EOMES | 8.44 × 10⁻³ | M.RED | HOXC6 | 2.01 × 10⁻² |
| M.BLUE | EGR2 | 9.00 × 10⁻³ | M.RED | SMAD1 | 2.32 × 10⁻² |
| M.BLUE | YAP1 | 1.12 × 10⁻² | M.RED | JUNB | 2.72 × 10⁻² |
| M.BLUE | MED13 | 1.20 × 10⁻² | M.RED | ARNT | 3.11 × 10⁻² |
| M.BLUE | FOXP3 | 1.21 × 10⁻² | M.RED | ZNF384 | 3.51 × 10⁻² |
| M.BLUE | CTNNB1 | 1.60 × 10⁻² | M.RED | NACC1 | 3.15 × 10⁻² |
| M.BLUE | DDIT3 | 1.86 × 10⁻² | M.RED | PML | 4.39 × 10⁻² |
| M.BLUE | BCL3 | 2.33 × 10⁻² | M.TURQUOISE | SMAD7 | 3.49 × 10⁻⁶ |
| M.BLUE | MAML1 | 2.39 × 10⁻² | M.TURQUOISE | YY1 | 1.50 × 10⁻⁴ |
| M.BLUE | KAT2B | 2.40 × 10⁻² | M.TURQUOISE | E2F7 | 1.63 × 10⁻⁴ |
| M.BLUE | KLF2 | 2.43 × 10⁻² | M.TURQUOISE | TP53 | 2.20 × 10⁻⁴ |
| M.BLUE | ARNT | 12.45 × 10⁻² | M.TURQUOISE | CCND1 | 2.42 × 10⁻⁴ |
| M.BLUE | NFATC3 | 2.65 × 10⁻² | M.TURQUOISE | NFYB | 3.98 × 10⁻⁴ |
| M.BLUE | SREBF2 | 2.65 × 10⁻² | M.TURQUOISE | MED1 | 1.28 × 10⁻³ |
| M.BLUE | NOTCH3 | 2.91 × 10⁻² | M.TURQUOISE | EHF | 1.29 × 10⁻³ |
| M.BLUE | NOTCH4 | 2.97 × 10⁻² | M.TURQUOISE | STAT3 | 1.55 × 10⁻³ |
| M.BLUE | SP4 | 2.97 × 10⁻² | M.TURQUOISE | BMI1 | 2.40 × 10⁻³ |
| M.BLUE | STAT3 | 3.38 × 10⁻² | M.TURQUOISE | YAP1 | 4.40 × 10⁻³ |
| M.BLUE | TBX21 | 3.76 × 10⁻² | M.TURQUOISE | SMAD3 | 8.92 × 10⁻³ |
| M.BLUE | CTBP2 | 4.61 × 10⁻² | M.TURQUOISE | MYB | 9.24 × 10⁻³ |
| M.BLUE | MAFF | 4.61 × 10⁻² | M.TURQUOISE | STAT5A | 1.19 × 10⁻² |
| M.BLUE | ATXN1 | 4.61 × 10⁻² | M.TURQUOISE | LHX2 | 1.33 × 10⁻² |
| M.BLUE | MAFK | 4.61 × 10⁻² | M.TURQUOISE | SMAD4 | 1.43 × 10⁻² |
| M.BLUE | PAX6 | 4.63 × 10⁻² | M.TURQUOISE | FOXO4 | 1.47 × 10⁻² |
| M.BLUE | BHLHE22 | 4.84 × 10⁻² | M.TURQUOISE | E2F8 | 1.65 × 10⁻² |
| M.BLUE | MTF2 | 4.84 × 10⁻² | M.TURQUOISE | CDKN2B | 1.65 × 10⁻⁵ |
| M.BLUE | NR2C1 | 4.84 × 10⁻² | M.TURQUOISE | HHEX | 1.65 × 10⁻² |
| M.BLUE | XBP1 | 4.89 × 10⁻² | M.TURQUOISE | RNF2 | 1.67 × 10⁻² |
| M.GREEN | EHMT2 | 6.15 × 10⁻³ | M.TURQUOISE | BACH1 | 1.78 × 10⁻² |
| M.GREEN | ZNF350 | 6.33 × 10⁻³ | M.TURQUOISE | SP3 | 2.66 × 10⁻² |
| M.GREEN | SMAD7 | 8.42 × 10⁻³ | M.TURQUOISE | TOB1 | 3.35 × 10⁻² |
| M.GREEN | MITF | 1.30 × 10⁻² | M.TURQUOISE | SMAD2 | 3.82 × 10⁻² |
| M.GREEN | HHEX | 1.38 × 10⁻² | M.TURQUOISE | SIN3A | 4.30 × 10⁻² |
| M.GREEN | SP1 | 1.60 × 10⁻² | M.TURQUOISE | HDAC1 | 4.30 × 10⁻² |
| M.GREEN | RYBP | 1.80 × 10⁻² | M.TURQUOISE | HLX | 4.33 × 10⁻² |
| M.GREEN | CCND1 | 1.90 × 10⁻² | M.TURQUOISE | KLF4 | 4.85 × 10⁻² |
© 2017 by Her Majesty the Queen in Right of Canada, as represented by the Minister of Agriculture and Agri-Food Canada. Licensee MDPI, Basel, Switzerland. This article is an open access article distributed under the terms and conditions of the Creative Commons Attribution (CC BY) license (http://creativecommons.org/licenses/by/4.0/).
Share and Cite
Do, D.N.; Dudemaine, P.-L.; Li, R.; Ibeagha-Awemu, E.M. Co-Expression Network and Pathway Analyses Reveal Important Modules of miRNAs Regulating Milk Yield and Component Traits. Int. J. Mol. Sci. 2017, 18, 1560. https://0-doi-org.brum.beds.ac.uk/10.3390/ijms18071560
Do DN, Dudemaine P-L, Li R, Ibeagha-Awemu EM. Co-Expression Network and Pathway Analyses Reveal Important Modules of miRNAs Regulating Milk Yield and Component Traits. International Journal of Molecular Sciences. 2017; 18(7):1560. https://0-doi-org.brum.beds.ac.uk/10.3390/ijms18071560
Chicago/Turabian StyleDo, Duy N., Pier-Luc Dudemaine, Ran Li, and Eveline M. Ibeagha-Awemu. 2017. "Co-Expression Network and Pathway Analyses Reveal Important Modules of miRNAs Regulating Milk Yield and Component Traits" International Journal of Molecular Sciences 18, no. 7: 1560. https://0-doi-org.brum.beds.ac.uk/10.3390/ijms18071560