In Vitro Glucuronidation of Wushanicaritin by Liver Microsomes, Intestine Microsomes and Expressed Human UDP-Glucuronosyltransferase Enzymes

 , , ,
, , ,
Abstract
:
1. Introduction
2. Results
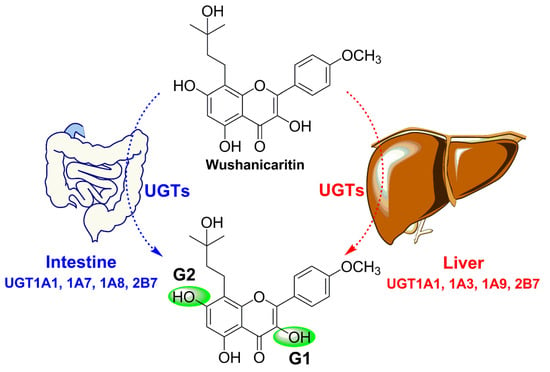
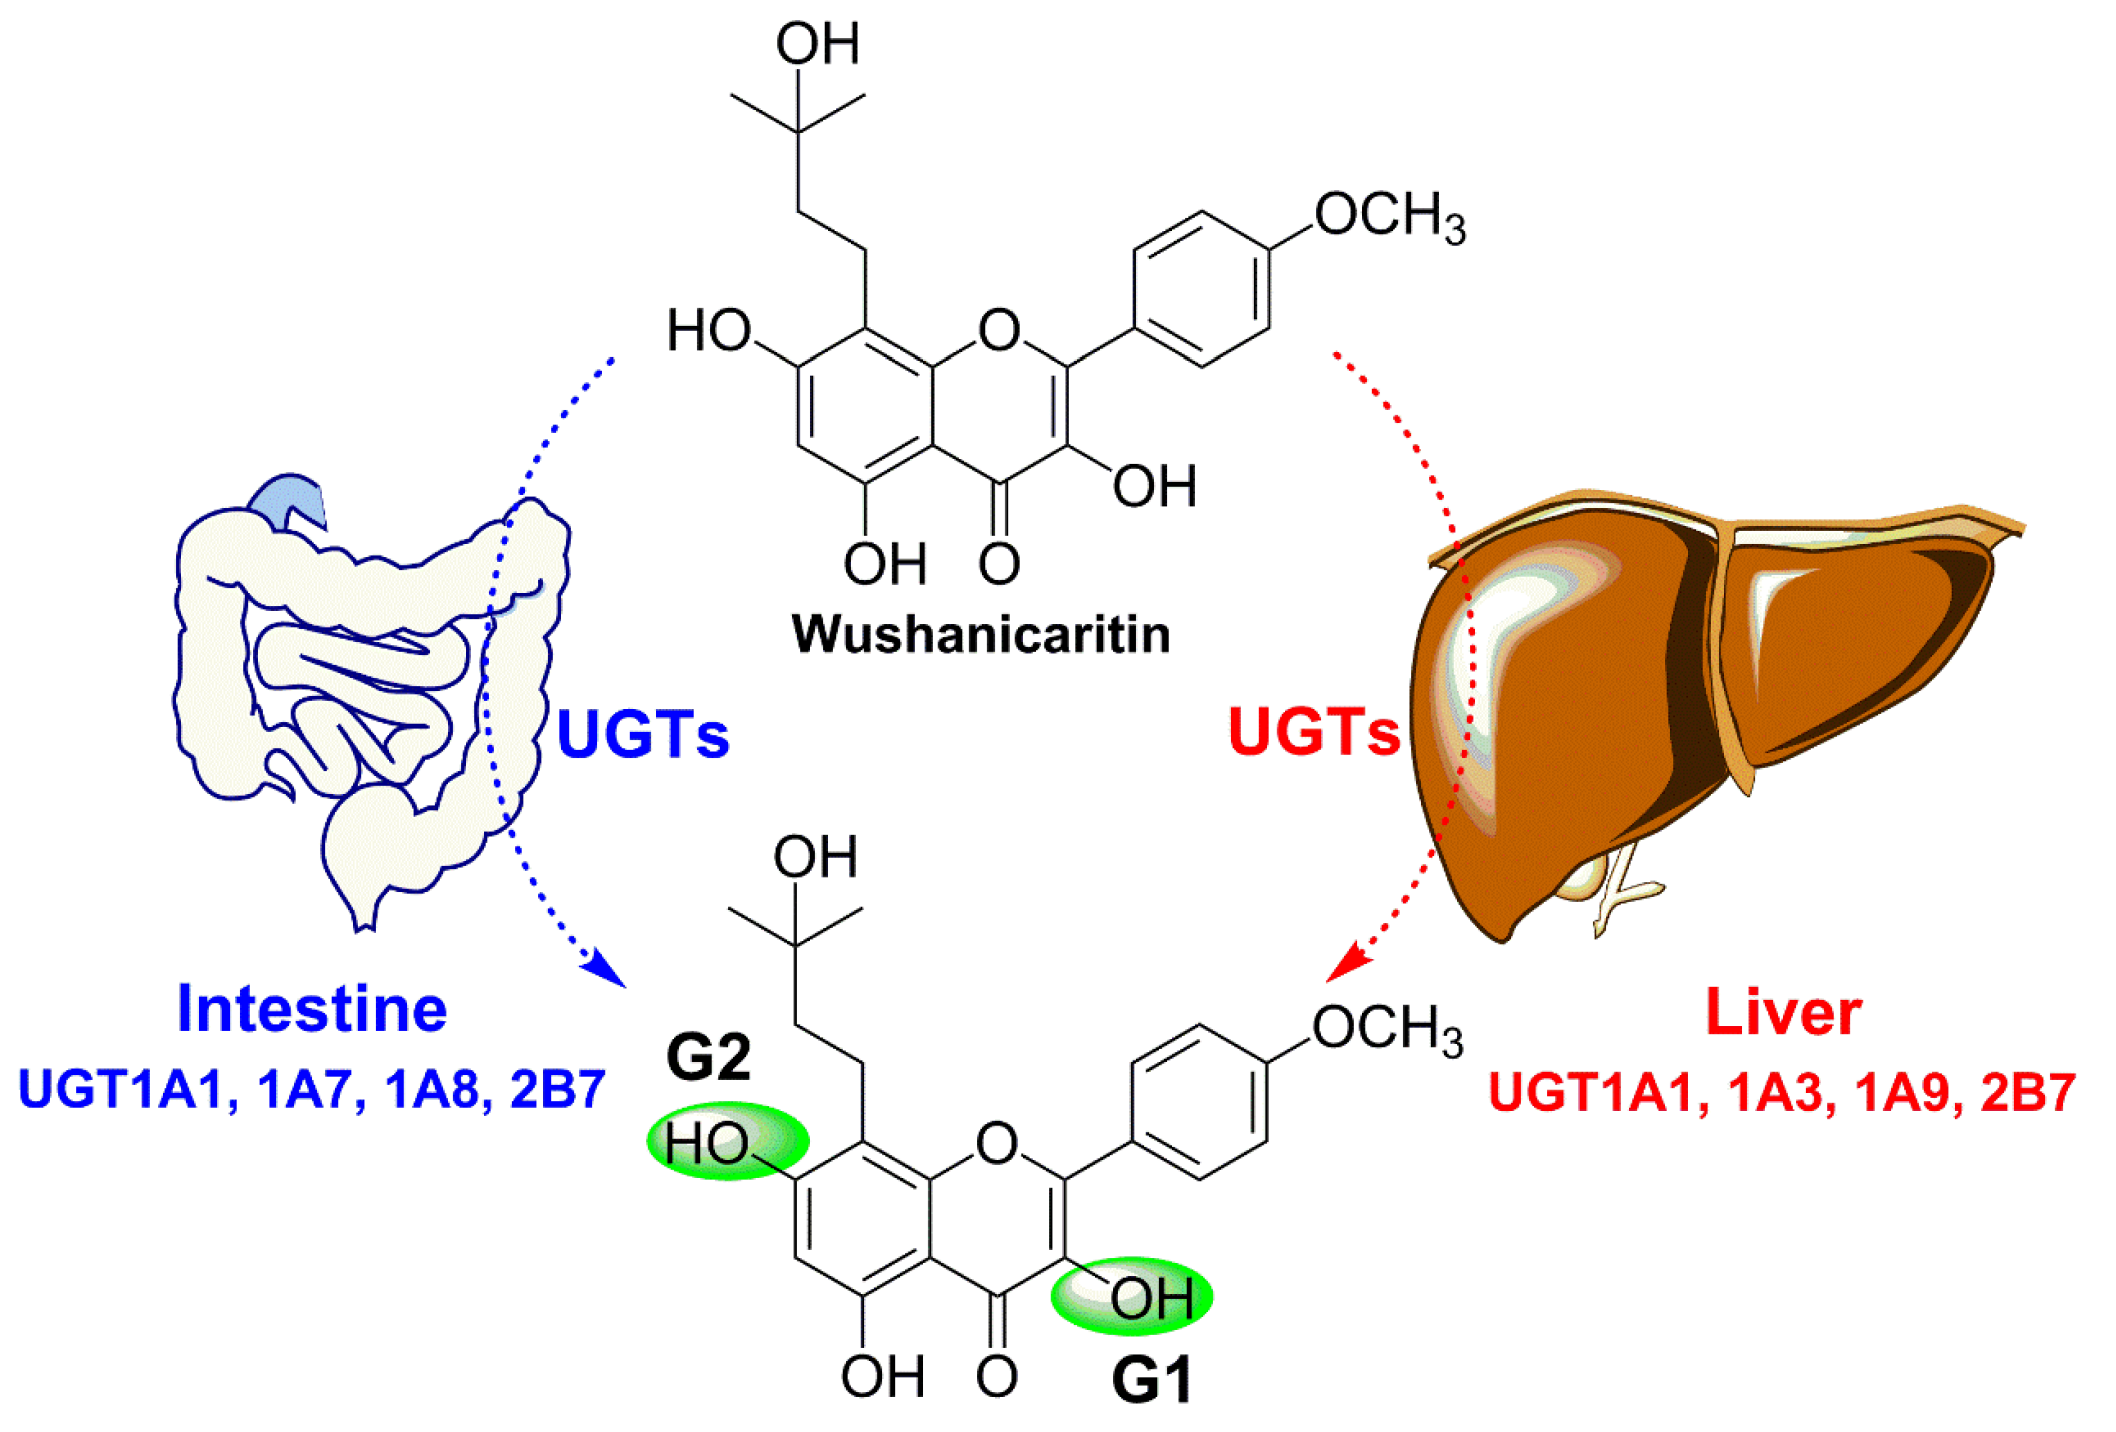
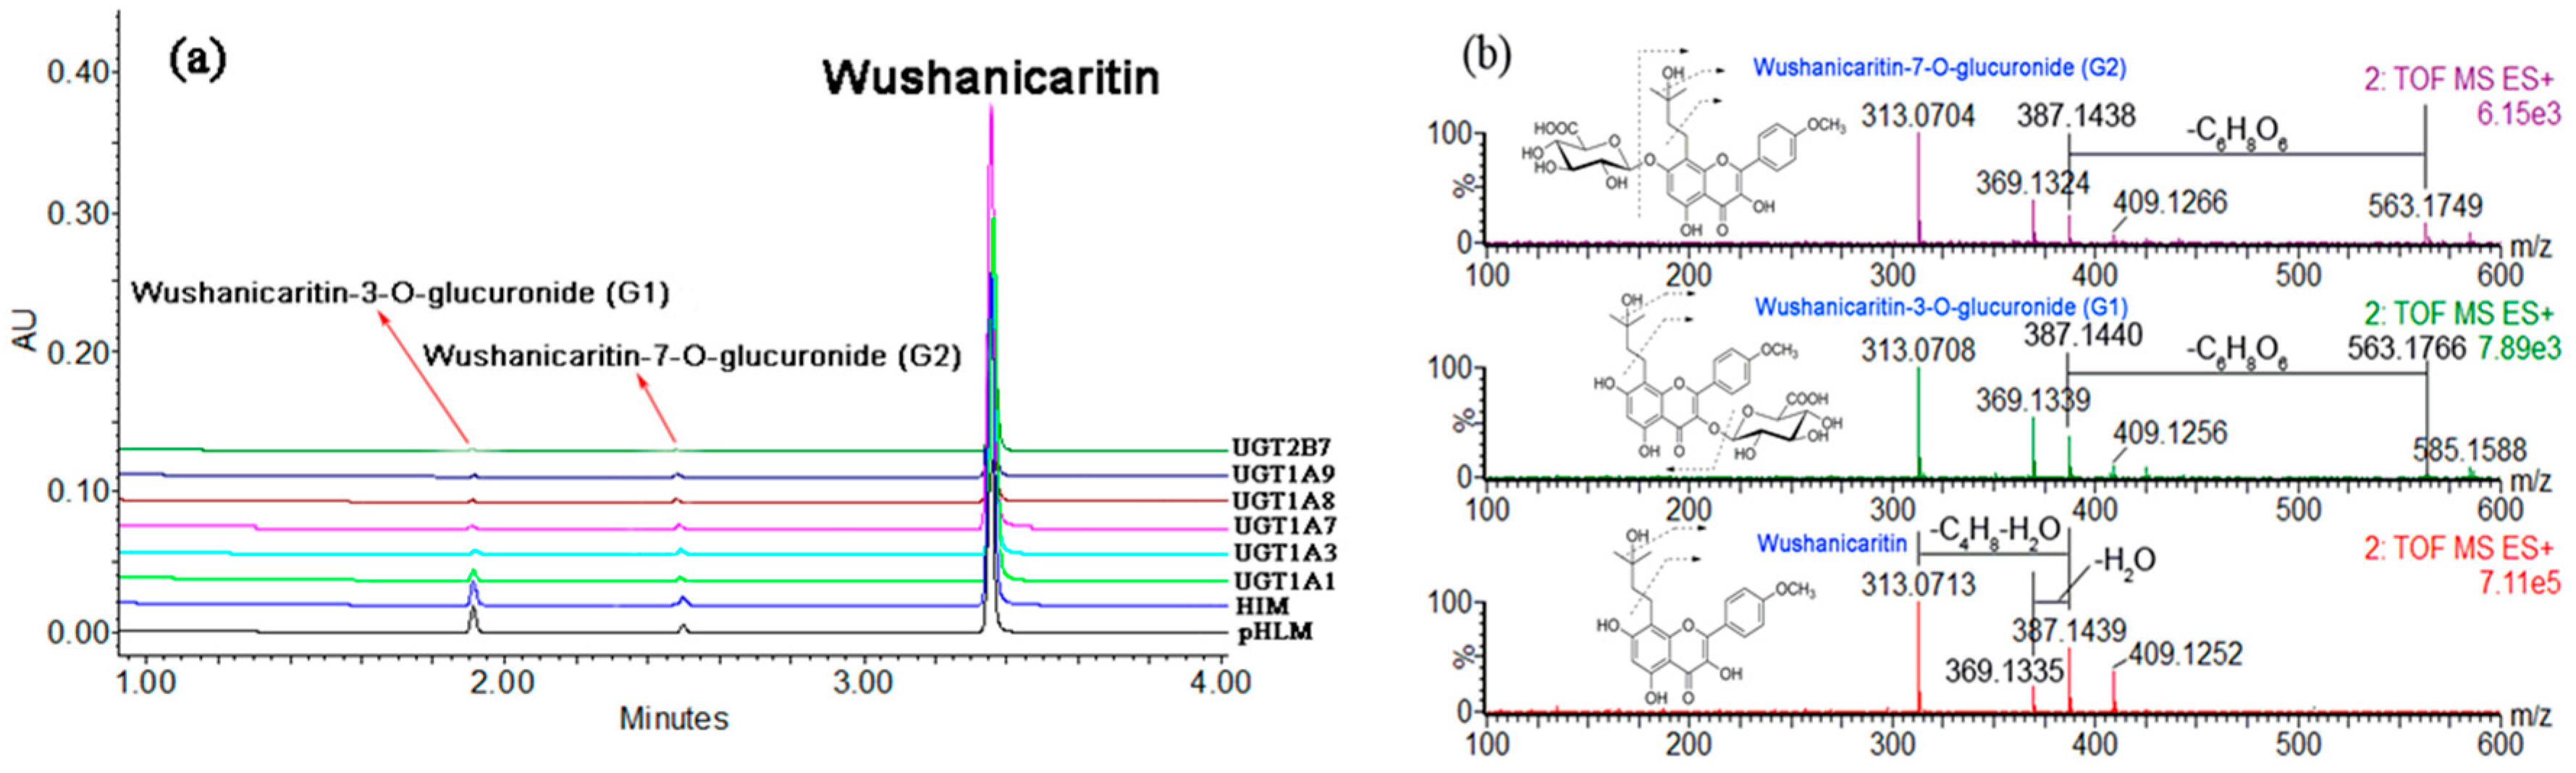
2.1. Structural Identification of Wushanicaritin Metabolites
2.2. Glucuronidation of Wushanicaritin in Human Liver Microsomes (HLM) and Human Intestine Microsomes (HIM)
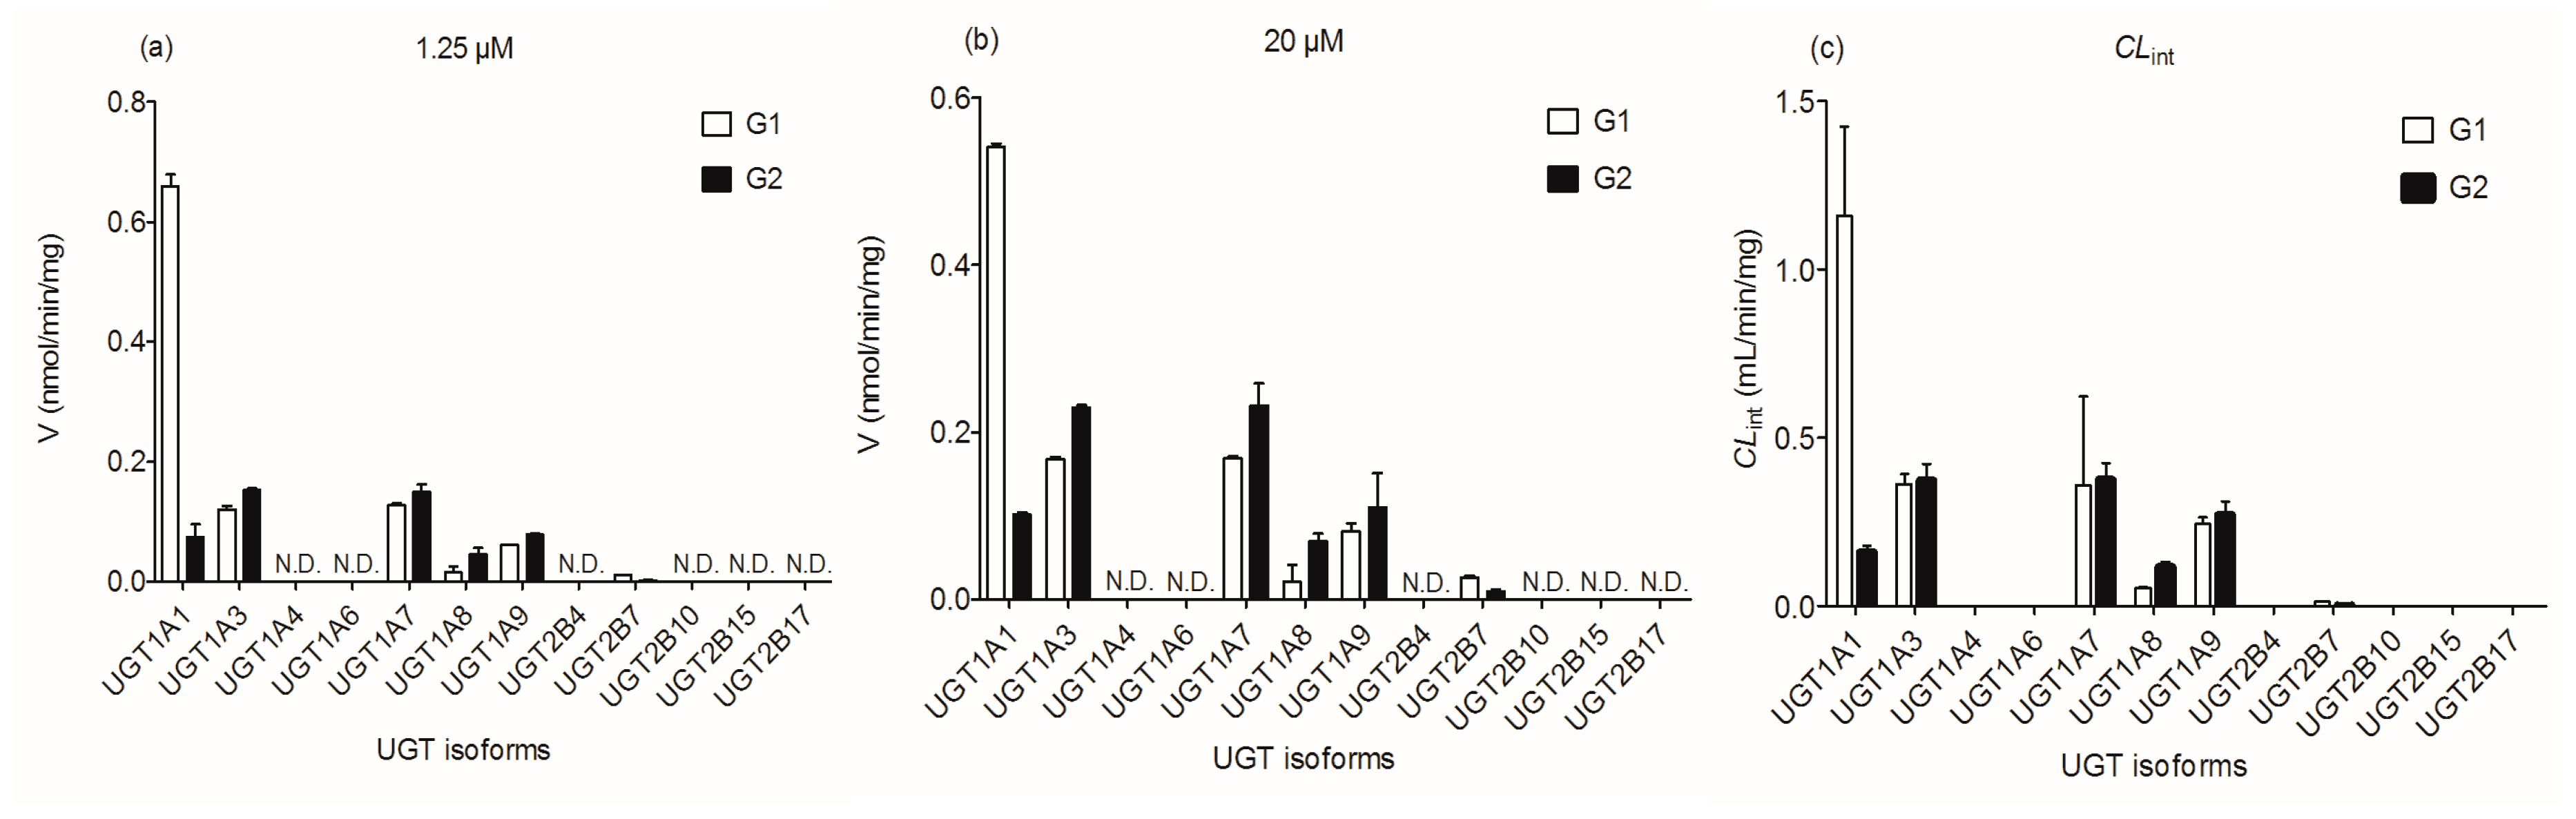
2.3. Reaction Phenotyping with Expressed UDP-Glucuronosyltransferase (UGT) Enzymes
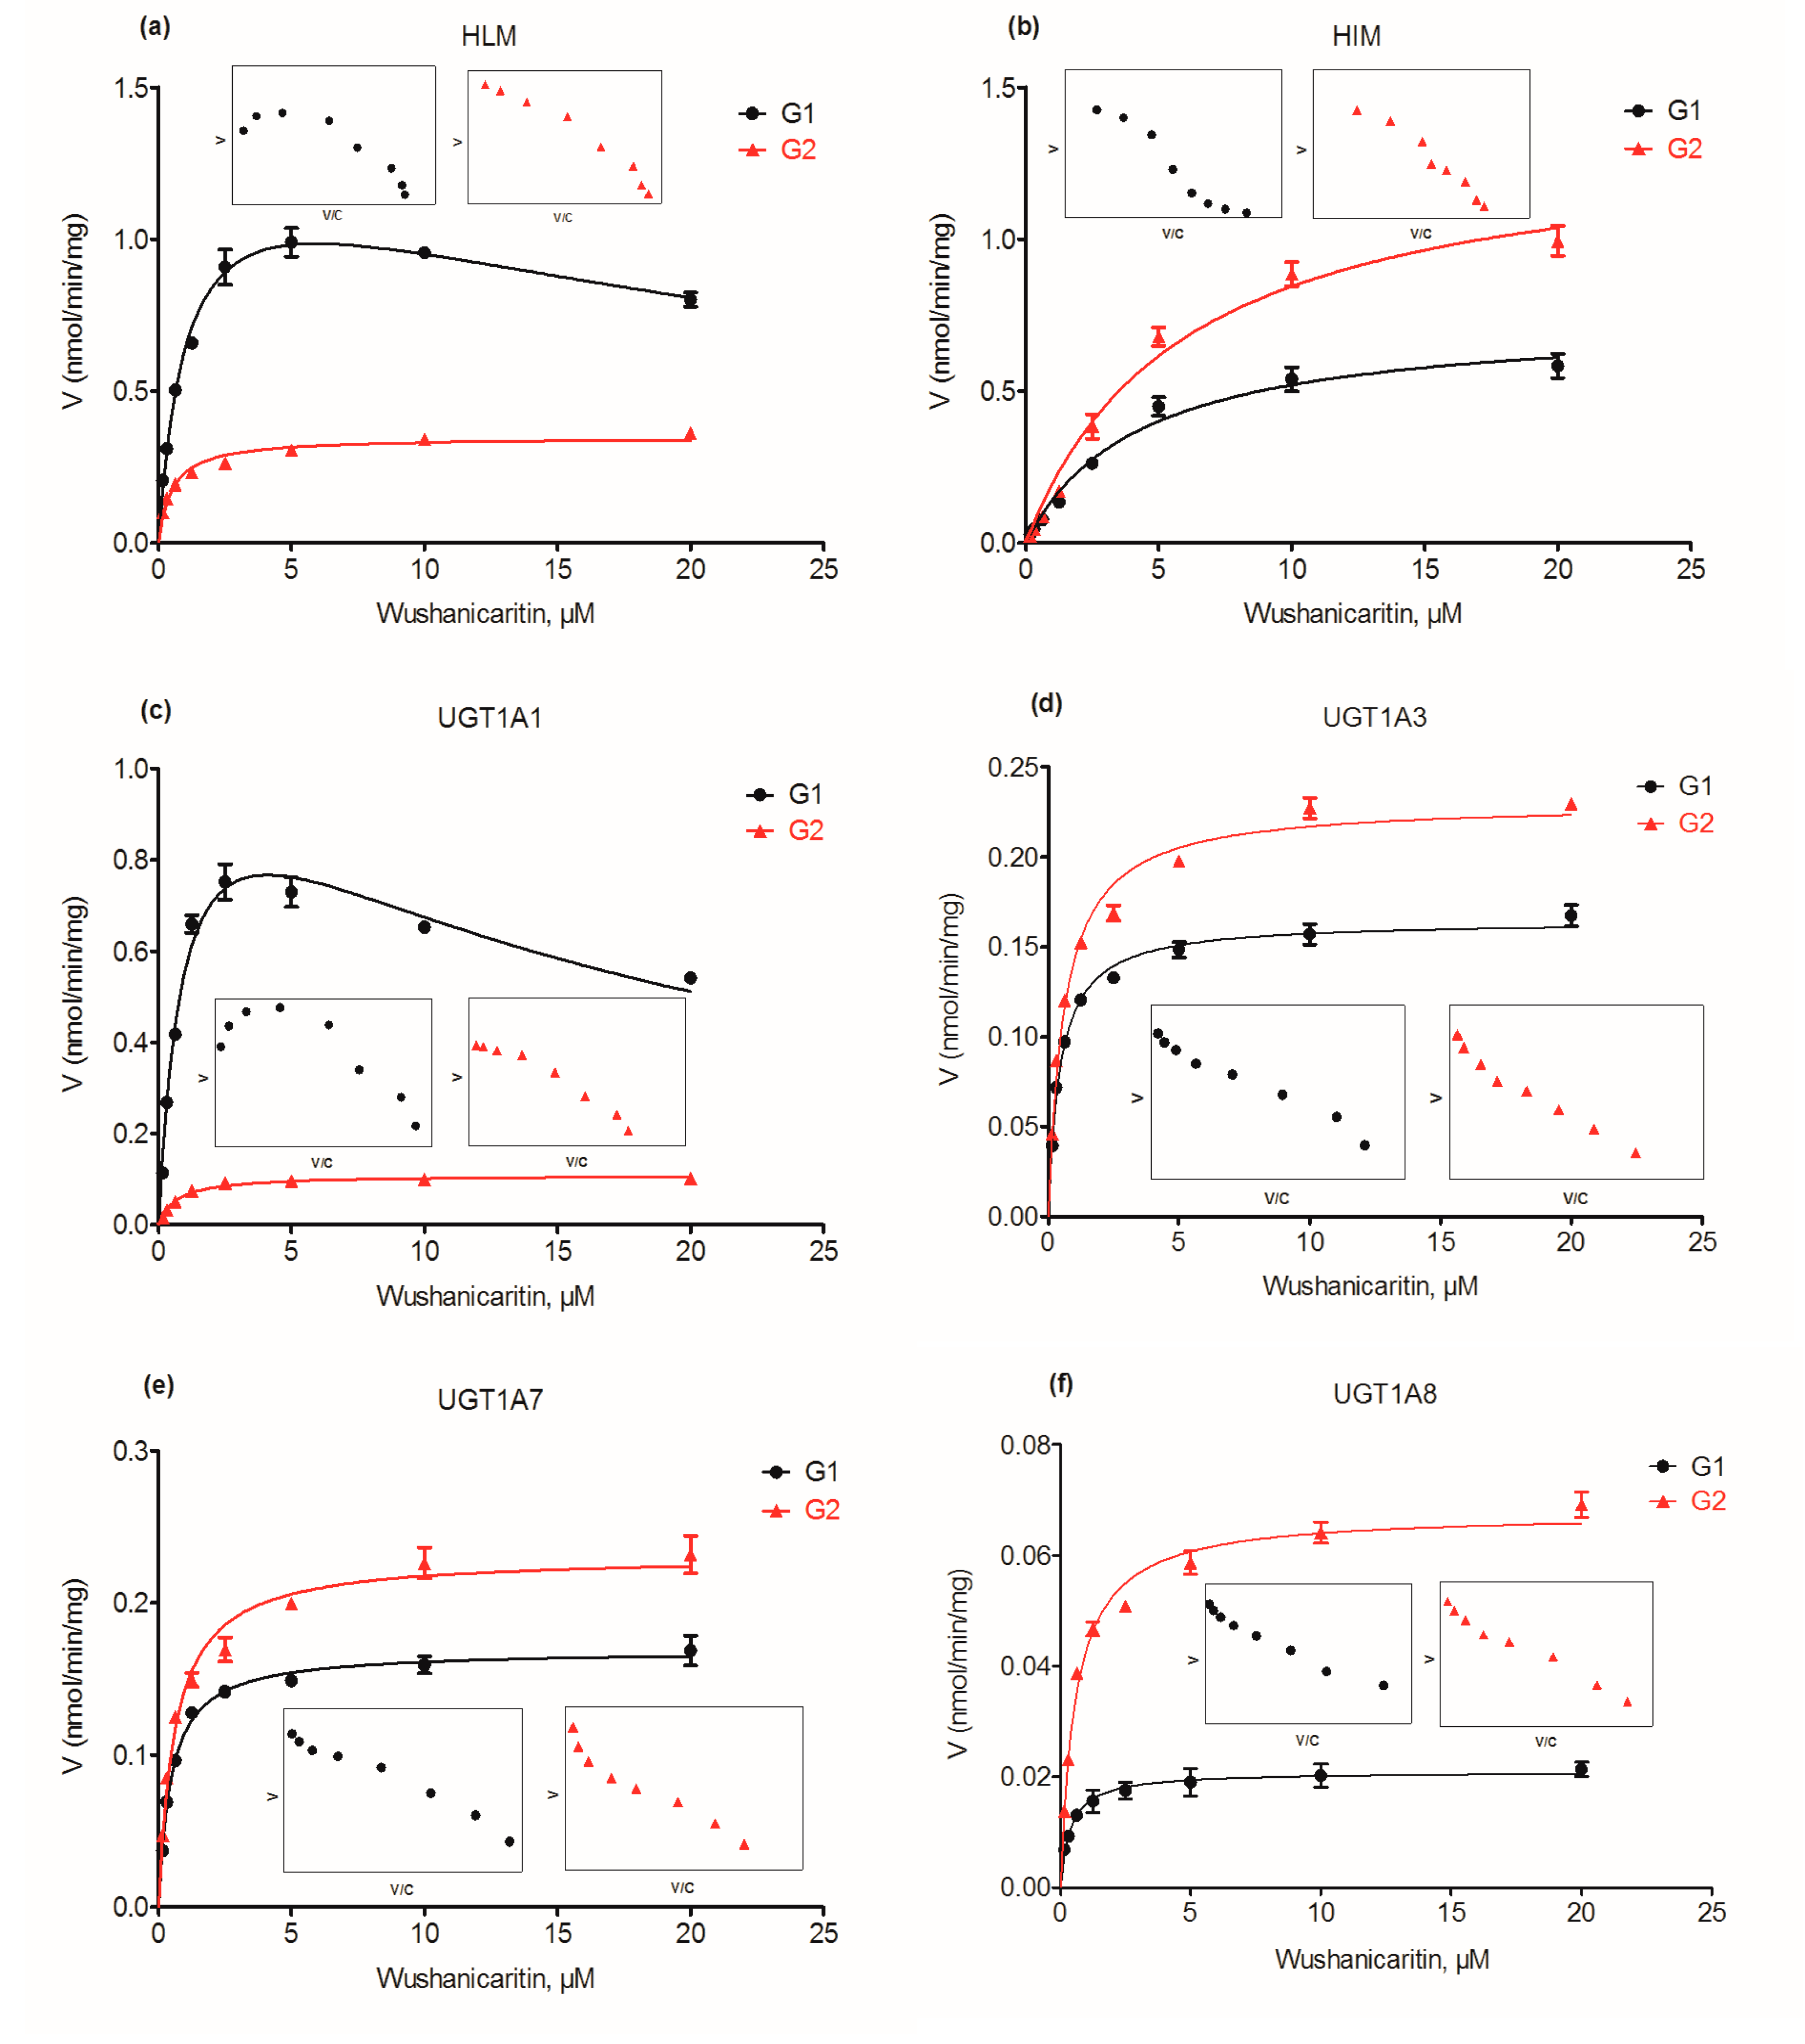
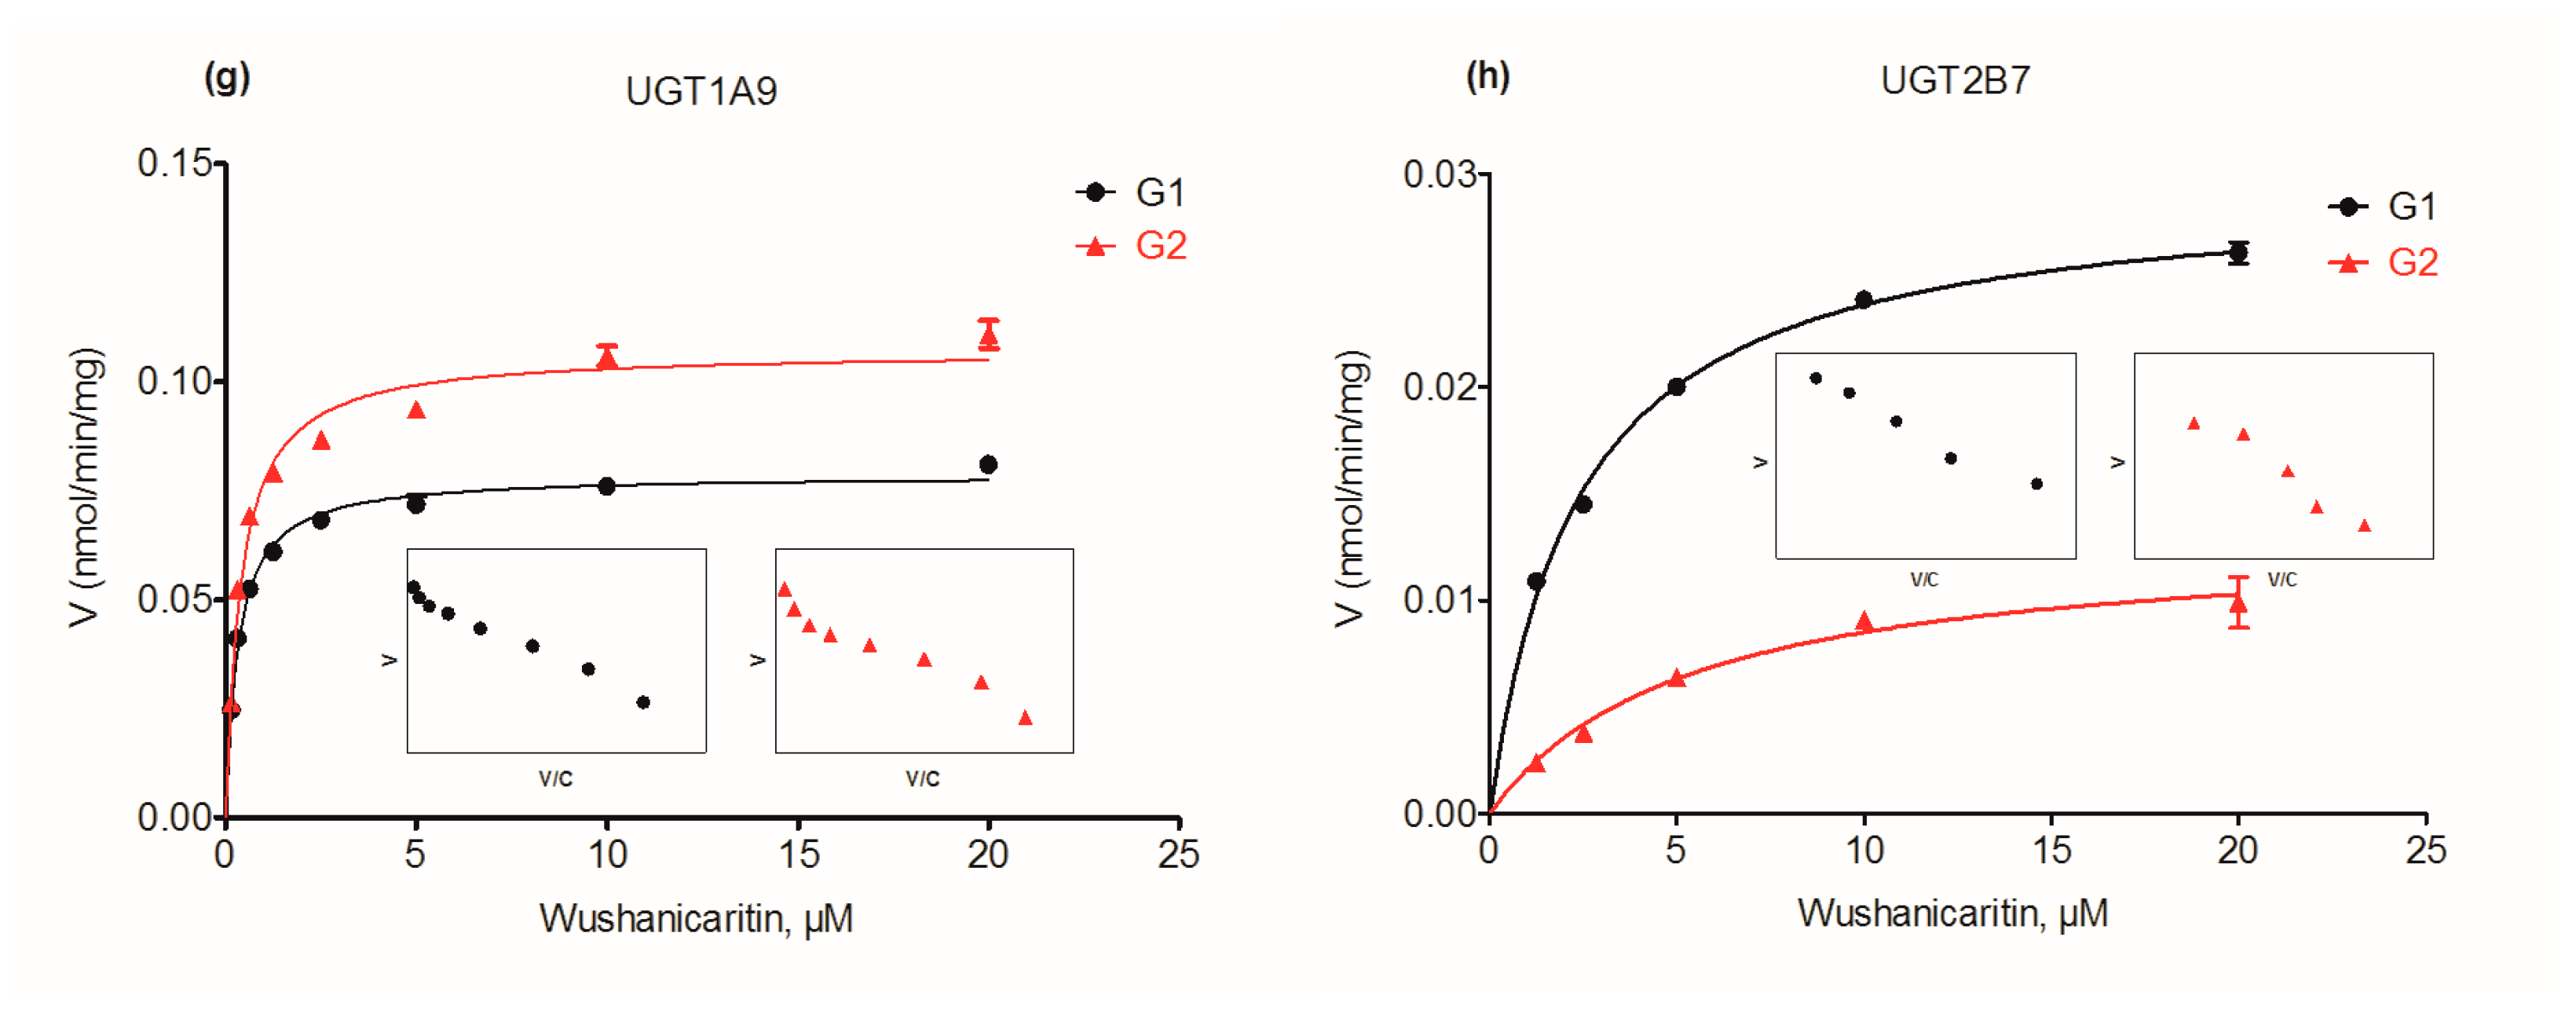
2.4. Glucuronidation Kinetics by Recombinant UGT Enzymes
2.5. Contribution of UGT1A1, 1A3, 1A9 and 2B7 to Wushanicaritin Glucuronidation in HLM
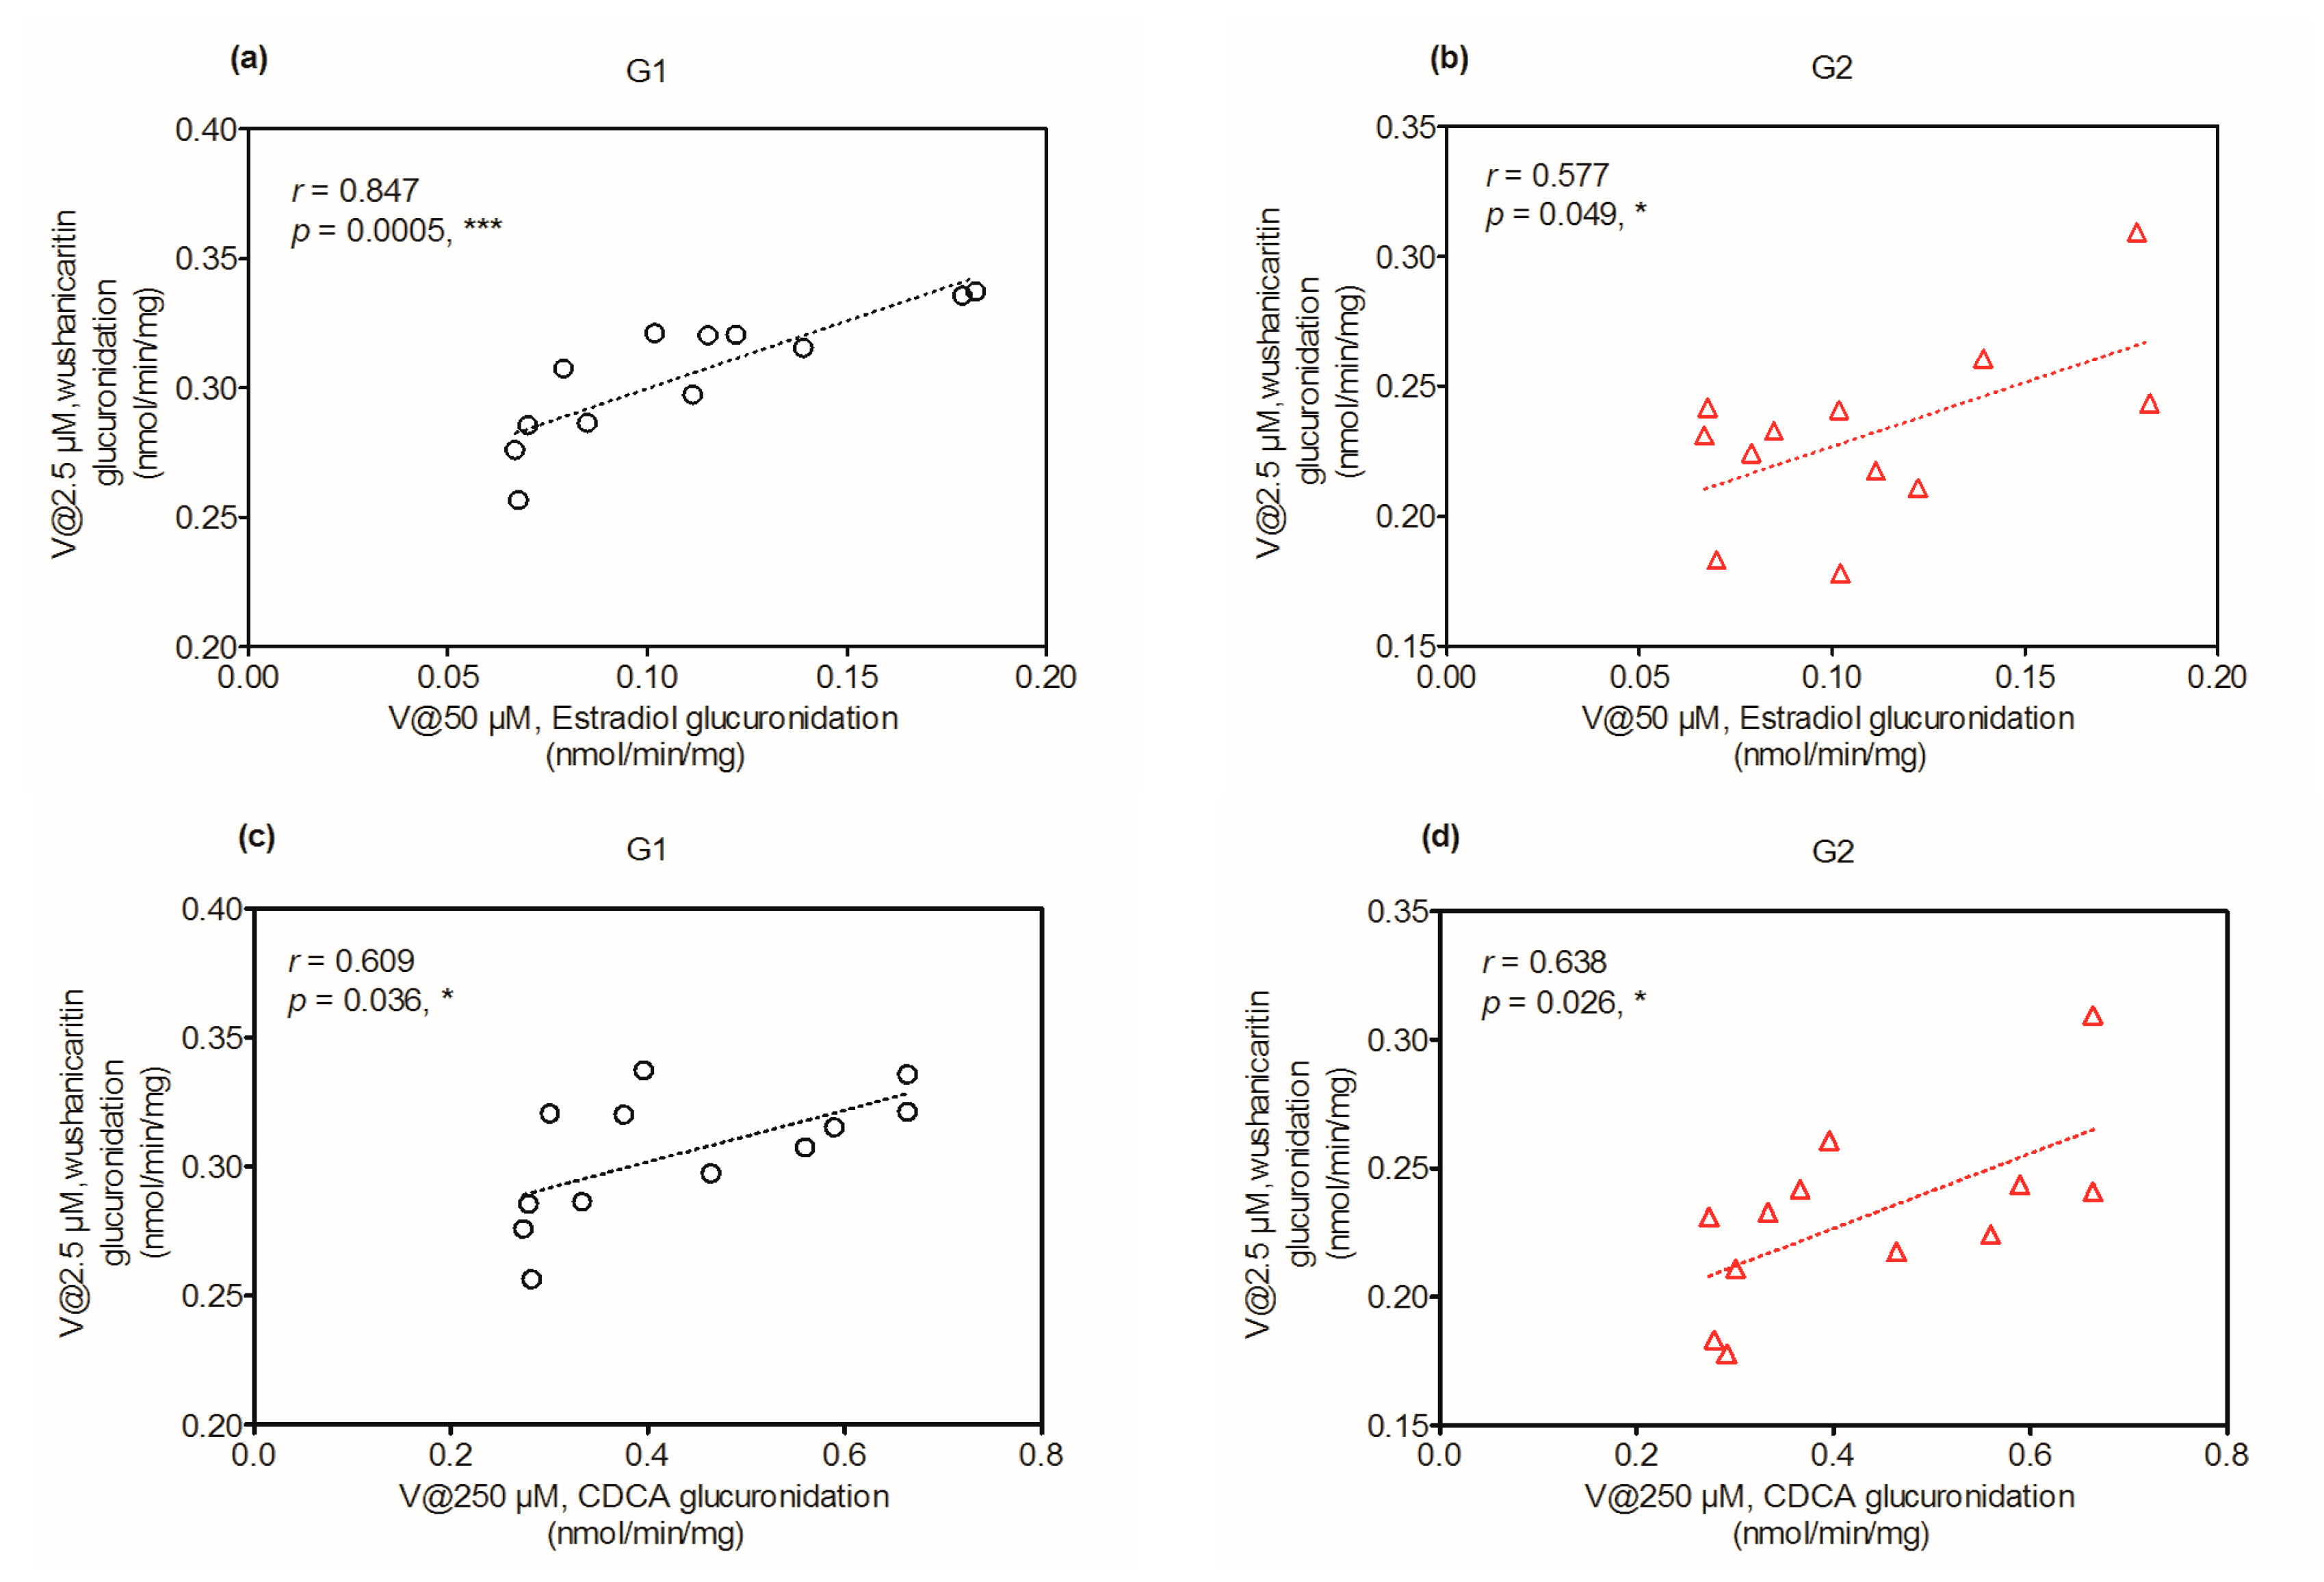
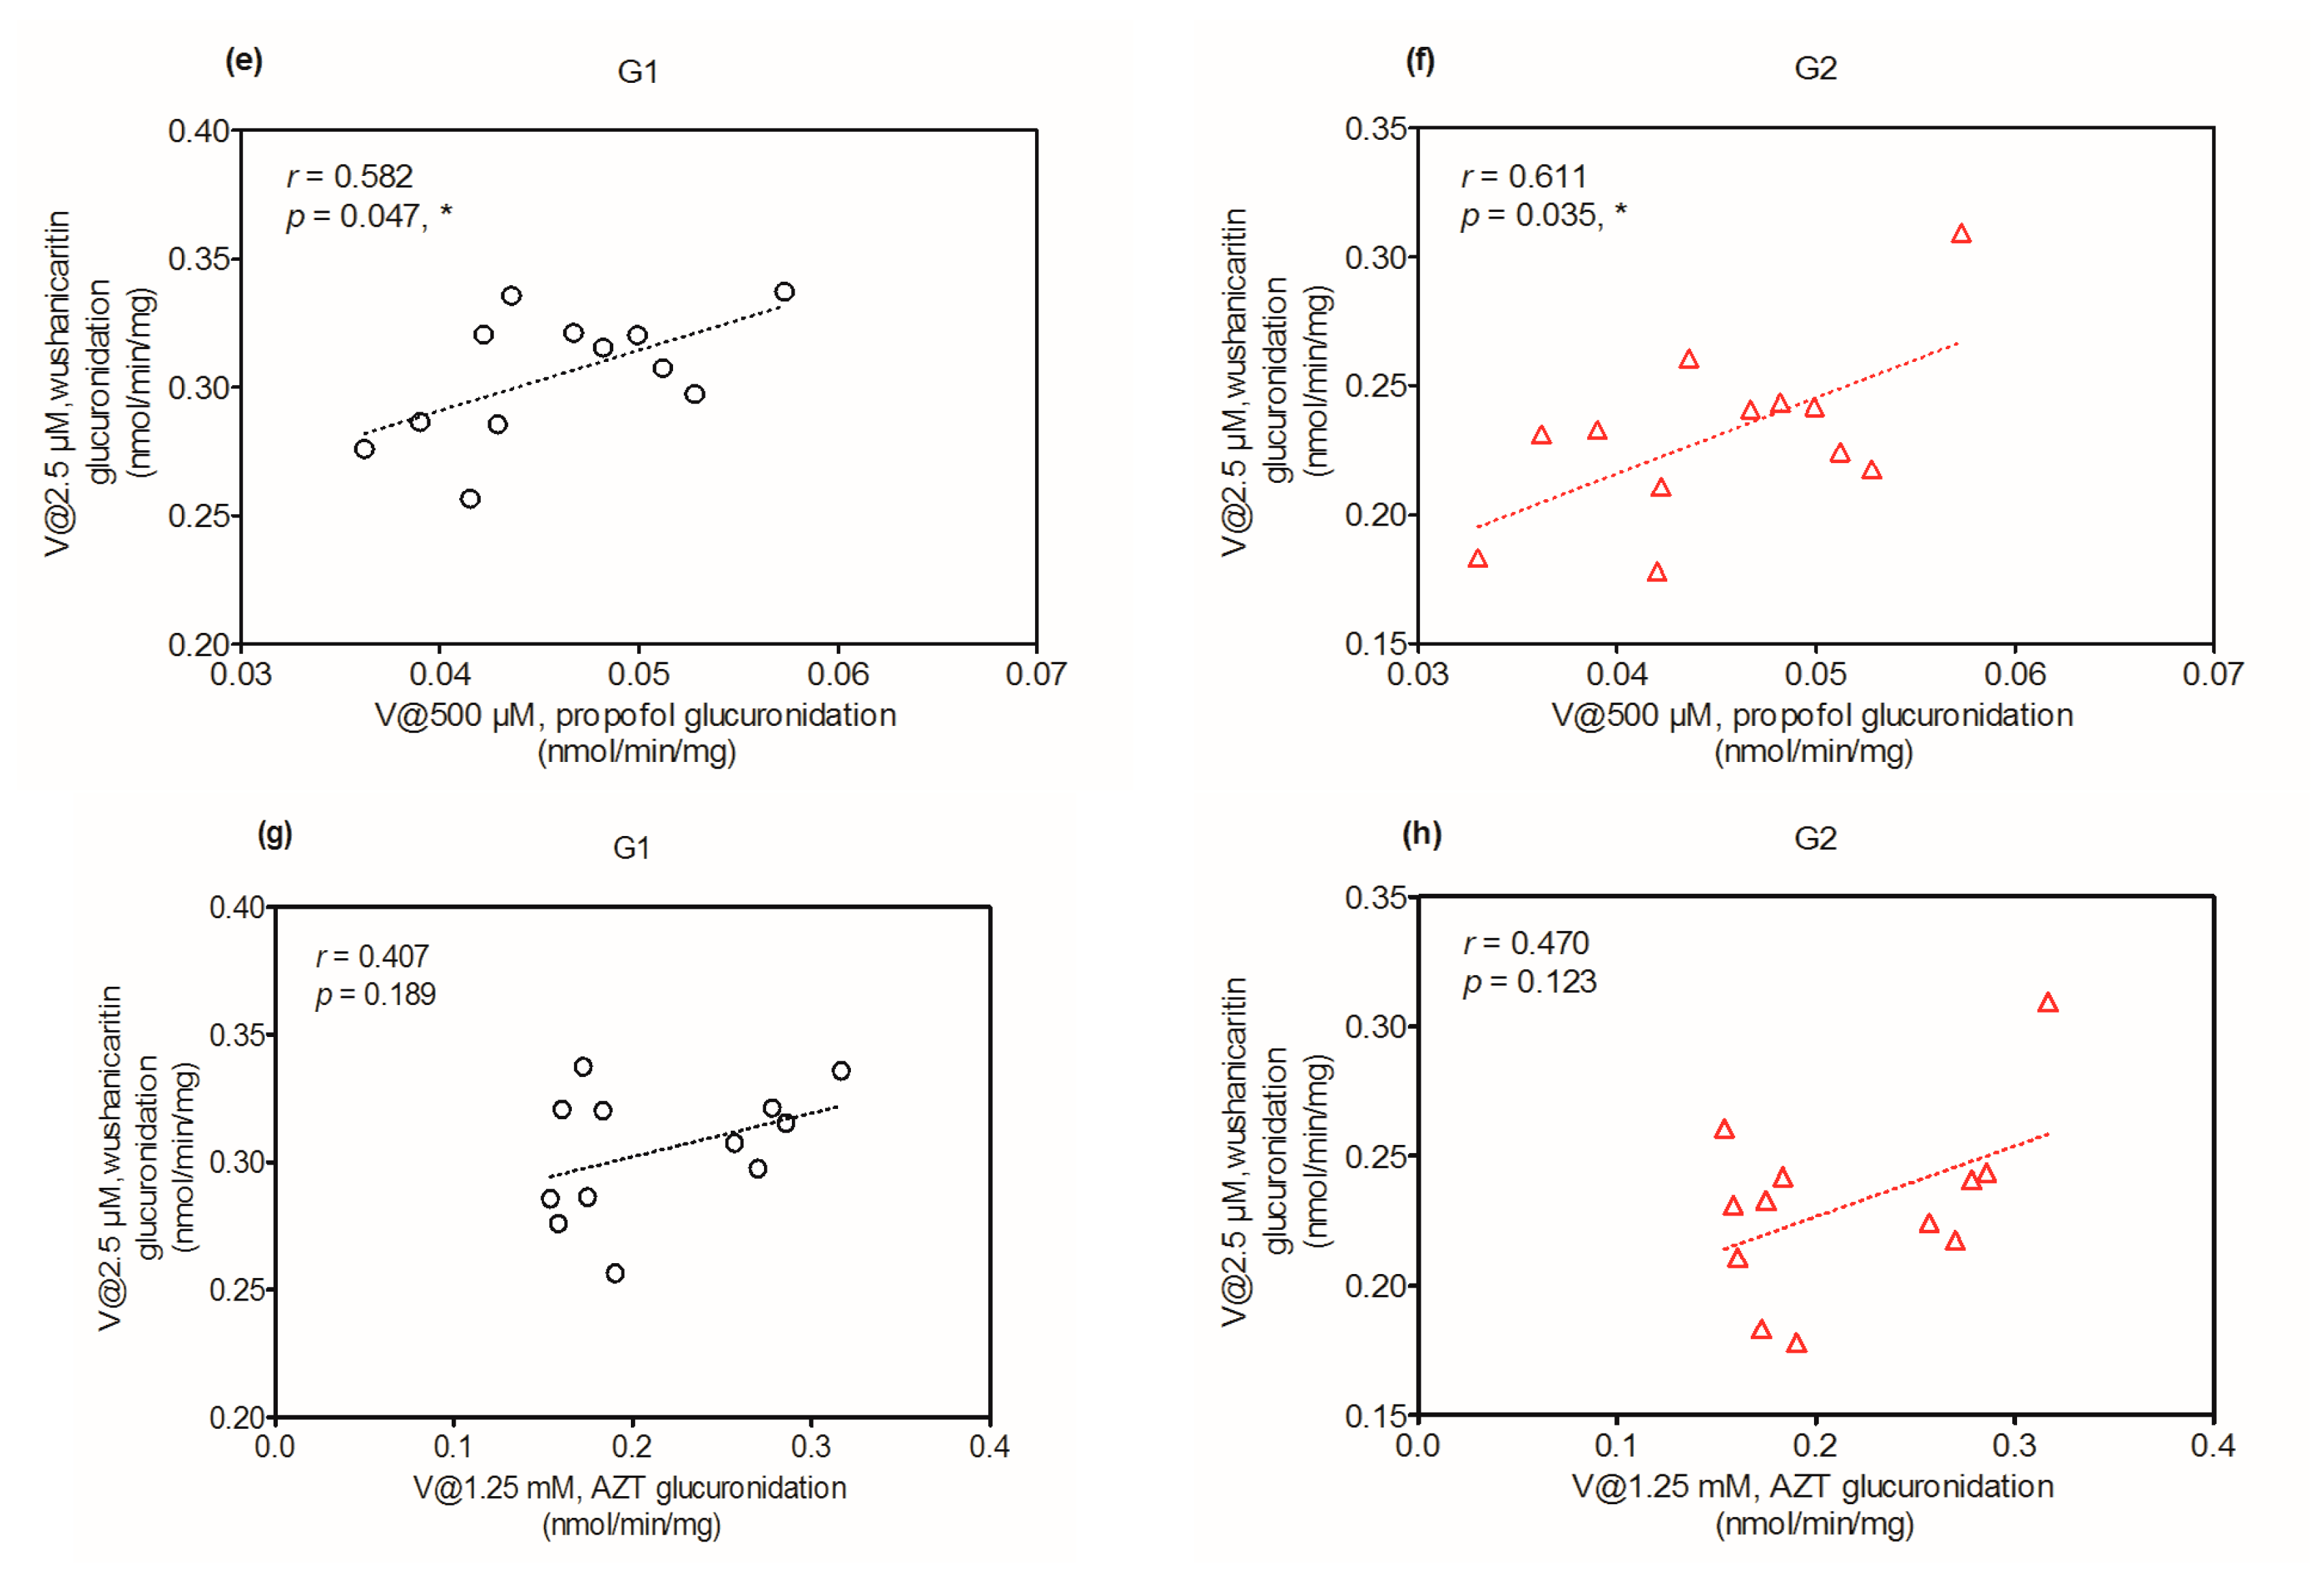
2.6. Activity Correlation Analysis
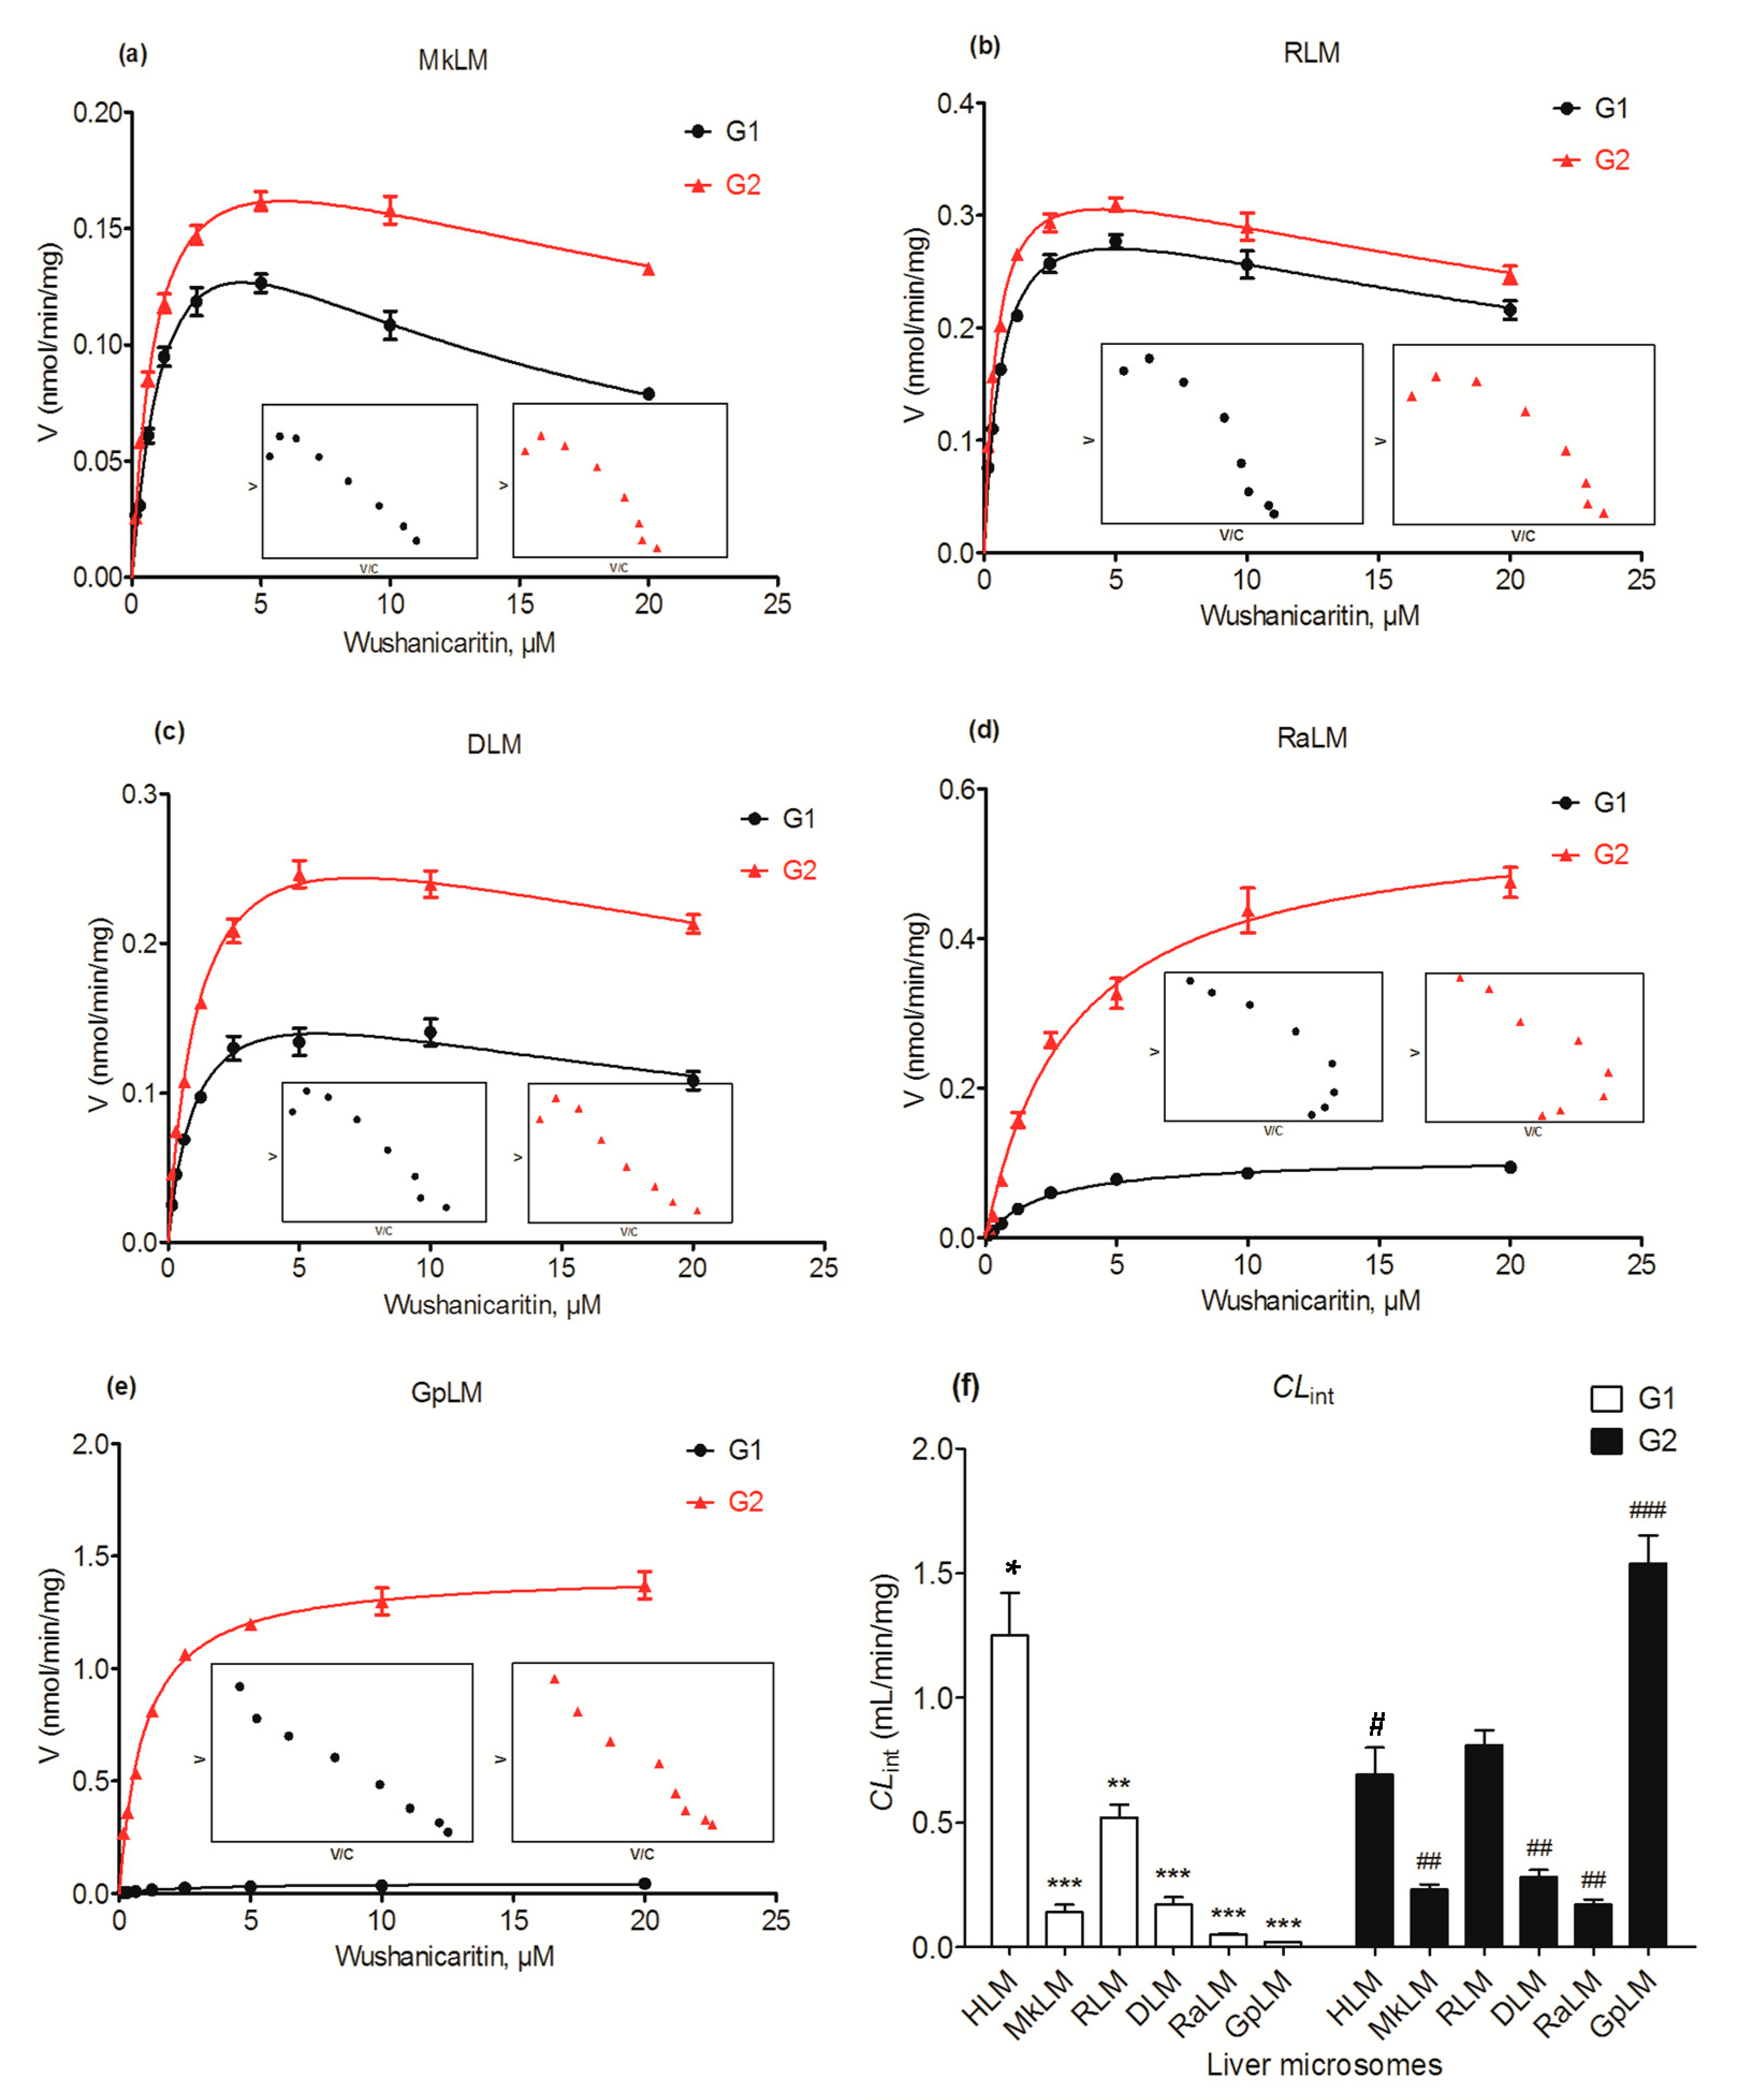
2.7. Glucuronidation of Wushanicaritin by DLM, RLM, MkLM, RaLM and GpLM
3. Discussion
4. Materials and Methods
4.1. Materials
4.2. Glucuronidation Assay
4.3. Structural Identification of Wushanicaritin Glucuronide by UPLC/Q-TOF-MS
4.4. Quantification of Wushanicaritin and Its Glucuronides
4.5. Enzymes Kinetic Evaluation
4.6. Activity Correlation Analysis
4.7. Contribution of UGT Isoforms
4.8. Statistical Analysis
5. Conclusions
Supplementary Materials
Acknowledgments
Author Contributions
Conflicts of Interest
References
- Chen, C.; Gonzalez, F.J. LC-MS-based metabolomics in drug metabolism. Drug Metab. Rev. 2007, 39, 581–597. [Google Scholar] [CrossRef] [PubMed]
- Lu, D.; Ma, Z.; Zhang, T.; Zhang, X.; Wu, B. Metabolism of the anthelmintic drug niclosamide by cytochrome P450 enzymes and UDP-glucuronosyltransferases: Metabolite elucidation and main contributions from CYP1A2 and UGT1A1. Xenobiotica 2016, 46, 1–13. [Google Scholar] [CrossRef] [PubMed]
- Wu, B.; Basu, S.; Meng, S.; Wang, X.; Zhang, S.; Hu, M. Regioselective Sulfation and Glucuronidation of Phenolics: Insights into the Structural Basis of Conjugation. Curr. Drug Metab. 2011, 12, 900–916. [Google Scholar] [CrossRef] [PubMed]
- Sun, S.Y.; Wang, Y.Q.; Li, L.P.; Wang, L.; Zeng, S.; Zhou, H.; Jiang, H.D. Stereoselective interaction between tetrahydropalmatine enantiomers and CYP enzymes in human liver microsomes. Chirality 2013, 25, 43–47. [Google Scholar] [CrossRef] [PubMed]
- Anzenbacher, P.; Anzenbacherová, E. Cytochromes P450 and metabolism of xenobiotics. Cell. Mol. Life Sci. 2001, 58, 737–747. [Google Scholar] [CrossRef] [PubMed]
- Zanger, U.; Schwab, M. Cytochrome p450 enzymes in drug metabolism: Regulation of gene expression, enzyme activities, and impact of genetic variation. Pharmacol. Therap. 2013, 138, 103–141. [Google Scholar] [CrossRef] [PubMed]
- Rowland, A.; Miners, J.O.; Mackenzie, P.I. The UDP-glucuronosyltransferases: Their role in drug metabolism and detoxification. Int. J. Biochem. Cell. Biol. 2013, 45, 1121–1132. [Google Scholar] [CrossRef] [PubMed]
- Zhou, X.; Ma, Z.; Dong, D.; Wu, B. Arylamine N-acetyltransferases: A structural perspective. Br. J. Pharmacol. 2013, 169, 748–760. [Google Scholar] [CrossRef] [PubMed]
- Tang, L.; Zhou, J.; Yang, C.H.; Xia, B.J.; Hu, M.; Liu, Z.Q. Systematic studies of sulfation and glucuronidation of 12 flavonoids in the mouse liver S9 fraction reveal both unique and shared positional preferences. J. Agric. Food Chem. 2012, 60, 3223–3233. [Google Scholar] [CrossRef] [PubMed]
- Wu, B.; Kulkarni, K.; Basu, S.; Zhang, S.; Hu, M. First-pass metabolism via UDP-glucuronosyltransferase: A barrier to oral bioavailability of phenolics. J. Pharm. Sci. 2011, 100, 3655–3681. [Google Scholar] [CrossRef] [PubMed]
- Evans, W.E.; Relling, M.V. Pharmacogenomics: Translating Functional Genomics into Rational Therapeutics. Science 1999, 286, 487–491. [Google Scholar] [CrossRef] [PubMed]
- Sun, H.; Wang, H.; Liu, H.; Zhang, X.; Wu, B. Glucuronidation of capsaicin by liver microsomes and expressed UGT enzymes: Reaction kinetics, contribution of individual enzymes and marked species differences. Expert Opin. Drug Metab. Toxicol. 2014, 10, 1325–1336. [Google Scholar] [CrossRef] [PubMed]
- Sun, H.; Zhou, X.; Zhang, X.; Wu, B. Decreased Expression of Multidrug Resistance-Associated Protein 4 (MRP4/ABCC4) Leads to Reduced Glucuronidation of Flavonoids in UGT1A1-Overexpressing HeLa Cells: The Role of Futile Recycling. J. Agric. Food Chem. 2015, 63, 6001–6008. [Google Scholar] [CrossRef] [PubMed]
- Mackenzie, P.; Bock, K.; Burchell, B.; Guillemette, C.; Ikushiro, S.; Iyanagi, T.; Miners, J.; Owens, I.; Nebert, D. Nomenclature update for the mammalian UDP-glucuronosyltransferase (UGT) gene superfamily. Pharmacogenet. Genom. 2005, 15, 677–685. [Google Scholar] [CrossRef]
- Wu, J.; Cao, Y.; Zhang, Y.; Liu, Y.; Hong, J.Y.; Zhu, L.; Ge, G.; Yang, L. Deoxyschizandrin, a naturally occurring lignan, is a specific probe substrate of human cytochrome P450 3A. Drug Metab. Dispos. 2014, 42, 94–104. [Google Scholar] [CrossRef] [PubMed]
- Tukey, R.; Strassburg, C. Human UDP-glucuronosyltransferases: Metabolism, expression, and disease. Annu. Rev. Pharmacol. Toxicol. 2000, 40, 581–616. [Google Scholar] [CrossRef] [PubMed]
- Li, H.F.; Guan, X.Y.; Yang, W.Z.; Liu, K.D.; Ye, M.; Sun, C.; Lu, S.; Guo, D.A. Antioxidant flavonoids from Epimedium wushanense. Fitoterapia 2012, 83, 44–48. [Google Scholar] [CrossRef] [PubMed]
- Wu, J.; Du, J.; Xu, C.; Le, J.; Liu, B.; Xu, Y.; Dong, J. In vivo and in vitro anti-inflammatory effects of a novel derivative of icariin. Immunopharmacol. Immun. 2011, 33, 49–54. [Google Scholar] [CrossRef] [PubMed]
- Wu, J.; Zhou, J.; Chen, X.; Fortenbery, N.; Eksioglu, E.A.; Wei, S.; Dong, J. Attenuation of LPS-induced inflammation by ICT, a derivate of icariin, via inhibition of the CD14/TLR4 signaling pathway in human monocytes. Int. Immunopharmacol. 2012, 12, 74–79. [Google Scholar] [CrossRef] [PubMed]
- Wu, T.; Wang, S.; Wu, J.; Lin, Z.; Sui, X.; Xu, X.; Shimizu, N.; Chen, B.; Wang, X. Icaritin induces lytic cytotoxicity in extranodal NK/T-cell lymphoma. J. Exp. Clin. Cancer Res. 2015, 34, 1–11. [Google Scholar] [CrossRef] [PubMed]
- Jin, Y.; Wu, C.S.; Zhang, J.L.; Li, Y.F. A new strategy for the discovery of Epimedium metabolites using high-performance liquid chromatography with high resolution mass spectrometry. Anal. Chim. Acta 2013, 768, 111–117. [Google Scholar] [CrossRef] [PubMed]
- Geng, J.; Dai, Y.; Yao, Z.; Qin, Z.; Wang, X.; Qin, L.; Yao, X. Metabolites profile of Xian-Ling-Gu-Bao capsule, a traditional Chinese medicine prescription, in rats by ultra performance liquid chromatography coupled with quadrupole time-of-flight tandem mass spectrometry analysis. J. Pharm. Biomed. Anal. 2014, 96, 90–103. [Google Scholar] [CrossRef] [PubMed]
- Li, F.; Wang, S.; Lu, D.; Wang, Y.; Dong, D.; Wu, B. Identification of UDP-glucuronosyltransferases 1A1, 1A3 and 2B15 as the main contributors to glucuronidation of bakuchiol, a natural biologically active compound. Xenobiotica 2016, 47, 369–375. [Google Scholar] [CrossRef] [PubMed]
- Nakamura, A.; Nakajima, M.; Yamanaka, H.; Fujiwara, R.; Yokoi, T. Expression of UGT1A and UGT2B mRNA in human normal tissues and various cell lines. Drug Metab. Dispos. 2008, 36, 1461–1464. [Google Scholar] [CrossRef] [PubMed]
- Ohno, S.; Nakajin, S. Determination of mRNA expression of human UDP-glucuronosyltransferases and application for localization in various human tissues by real-time reverse transcriptase-polymerase chain reaction. Drug Metab. Dispos. 2009, 37, 32–40. [Google Scholar] [CrossRef] [PubMed]
- Wu, B.; Dong, D.; Hu, M.; Zhang, S. Quantitative prediction of glucuronidation in humans using the in vitro-in vivo extrapolation approach. Curr. Top. Med. Chem. 2013, 13, 1343–1352. [Google Scholar] [CrossRef] [PubMed]
- Bhasker, C.; McKinnon, W.; Stone, A.; Lo, A.; Kubota, T.; Ishizaki, T.; Miners, J. Genetic polymorphism of UDP-glucuronosyltransferase 2B7 (UGT2B7) at amino acid 268: Ethnic diversity of alleles and potential clinical significance. Pharmacogenetics 2010, 10, 679–685. [Google Scholar] [CrossRef]
- Nagar, S.; Blanchard, R.L. Pharmacogenetics of uridine diphosphoglucuronosyltransferase (UGT) 1A family members and its role in patient response to irinotecan. Drug Metab. Rev. 2006, 38, 393–409. [Google Scholar] [CrossRef] [PubMed]
- Liu, W.; Tang, L.; Ye, L.; Cai, Z.; Xia, B.; Zhang, J.; Hu, M.; Liu, Z. Species and Gender Differences Affect the Metabolism of Emodin via glucuronidation. AAPS J. 2010, 12, 424–436. [Google Scholar] [CrossRef] [PubMed]
- Knights, K.; Rowland, A.; Miners, J. Renal drug metabolism in humans: The potential for drug–endobiotic interactions involving cytochrome P450 (CYP) and UDP-glucuronosyltransferase (UGT). Br. J. Clin. Pharmacol. 2010, 76, 587–602. [Google Scholar] [CrossRef] [PubMed] [Green Version]
- Li, J.; He, C.; Fang, L.; Yang, L.; Wang, Z. Identification of Human UDP-Glucuronosyltransferase 1A4 as the Major Isozyme Responsible for the Glucuronidation of 20(S)-Protopanaxadiol in Human Liver Microsomes. Int. J. Mol. Sci. 2016, 17, 205. [Google Scholar] [CrossRef] [PubMed]
- Lu, D.; Dong, D.; Liu, Z.; Wang, Y.; Wu, B. Metabolism elucidation of BJ-B11 (a heat shock protein 90 inhibitor) by human liver microsomes: Identification of main contributing enzymes. Expert Opin. Drug Metab. Toxicol. 2015, 11, 1029–1040. [Google Scholar] [CrossRef] [PubMed]
- Troberg, J.; Jarvinen, E.; Ge, G.; Yang, L.; Finel, M. UGT1A10 Is a High Activity and Important Extrahepatic Enzyme: Why Has Its Role in Intestinal Glucuronidation Been Frequently Underestimated? Mol. Pharm. 2016. [Google Scholar] [CrossRef] [PubMed]
- Hutzler, J.; Tracy, T. Atypical kinetic profiles in drug metabolism reactions. Drug Metab. Dispos. 2002, 30, 355–362. [Google Scholar] [CrossRef] [PubMed]


| Protein Source | Metabolite | Vmax (nmol/min/mg) | Km or S50 (μM) | Ki (μM) | CLint (mL/min/mg) | Model |
|---|---|---|---|---|---|---|
| HLM | G1 | 1.34 ± 0.08 | 1.07 ± 0.13 | 32.990 ± 6.717 | 1.25 ± 0.17 | SI |
| G2 | 0.35 ± 0.01 | 0.50 ± 0.08 | N.A. | 0.69 ± 0.11 | MM | |
| HIM | G1 | 0.74 ± 0.05 | 4.24 ± 0.75 | N.A. | 0.18 ± 0.03 | MM |
| G2 | 1.34 ± 0.10 | 5.91 ± 1.10 | N.A. | 0.23 ± 0.05 | MM | |
| UGT1A1 | G1 | 1.13 ± 0.11 | 0.98 ± 0.20 | 17.150 ± 4.478 | 1.16 ± 0.27 | SI |
| G2 | 0.11 ± 0.003 | 0.68 ± 0.08 | N.A. | 0.16 ± 0.02 | MM | |
| UGT1A3 | G1 | 0.17 ± 0.003 | 0.45 ± 0.04 | N.A. | 0.36 ± 0.03 | MM |
| G2 | 0.23 ± 0.007 | 0.61 ± 0.08 | N.A. | 0.38 ± 0.05 | MM | |
| UGT1A7 | G1 | 0.17 ± 0.003 | 0.47 ± 0.03 | N.A. | 0.36 ± 0.03 | MM |
| G2 | 0.23 ± 0.007 | 0.61 ± 0.08 | N.A. | 0.38 ± 0.05 | MM | |
| UGT1A8 | G1 | 0.02 ± 0.001 | 0.38 ± 0.03 | N.A. | 0.05 ± 0.004 | MM |
| G2 | 0.07 ± 0.002 | 0.58 ± 0.07 | N.A. | 0.12 ± 0.01 | MM | |
| UGT1A9 | G1 | 0.08 ± 0.001 | 0.32 ± 0.03 | N.A. | 0.24 ± 0.02 | MM |
| G2 | 0.11 ± 0.003 | 0.39 ± 0.06 | N.A. | 0.27 ± 0.04 | MM | |
| UGT2B7 | G1 | 0.03 ± 0.001 | 2.34 ± 0.19 | N.A. | 0.01 ± 0.001 | MM |
| G2 | 0.01 ± 0.001 | 5.28 ± 0.98 | N.A. | 0.002 ± 0.001 | MM | |
| MkLM | G1 | 0.22 ± 0.02 | 1.58 ± 0.25 | 11.57 ± 2.15 | 0.14 ± 0.03 | SI |
| G2 | 0.21 ± 0.008 | 0.94 ± 0.08 | 36.23 ± 5.13 | 0.23 ± 0.02 | SI | |
| RLM | G1 | 0.34 ± 0.01 | 0.66 ± 0.06 | 37.11 ± 5.82 | 0.52 ± 0.05 | SI |
| G2 | 0.37 ± 0.009 | 0.45 ± 0.03 | 44.22 ± 5.42 | 0.81 ± 0.06 | SI | |
| DLM | G1 | 0.19 ± 0.01 | 1.11 ± 0.16 | 29.09 ± 6.58 | 0.17 ± 0.03 | SI |
| G2 | 0.32 ± 0.02 | 1.17 ± 0.13 | 44.14 ± 9.09 | 0.28 ± 0.03 | SI | |
| RaLM | G1 | 0.11 ± 0.004 | 2.22 ± 0.26 | N.A. | 0.05 ± 0.006 | MM |
| G2 | 0.56 ± 0.02 | 3.29 ± 0.39 | N.A. | 0.17 ± 0.02 | MM | |
| GpLM | G1 | 0.05 ± 0.002 | 2.53 ± 0.30 | N.A. | 0.02 ± 0.002 | MM |
| G2 | 1.43 ± 0.06 | 0.93 ± 0.06 | N.A. | 1.54 ± 0.11 | MM |
| Substrate | Protein Source | Vmax (nmol/min/mg) | Km (μM) | CLint (μL/min/mg) | Model | RAF |
|---|---|---|---|---|---|---|
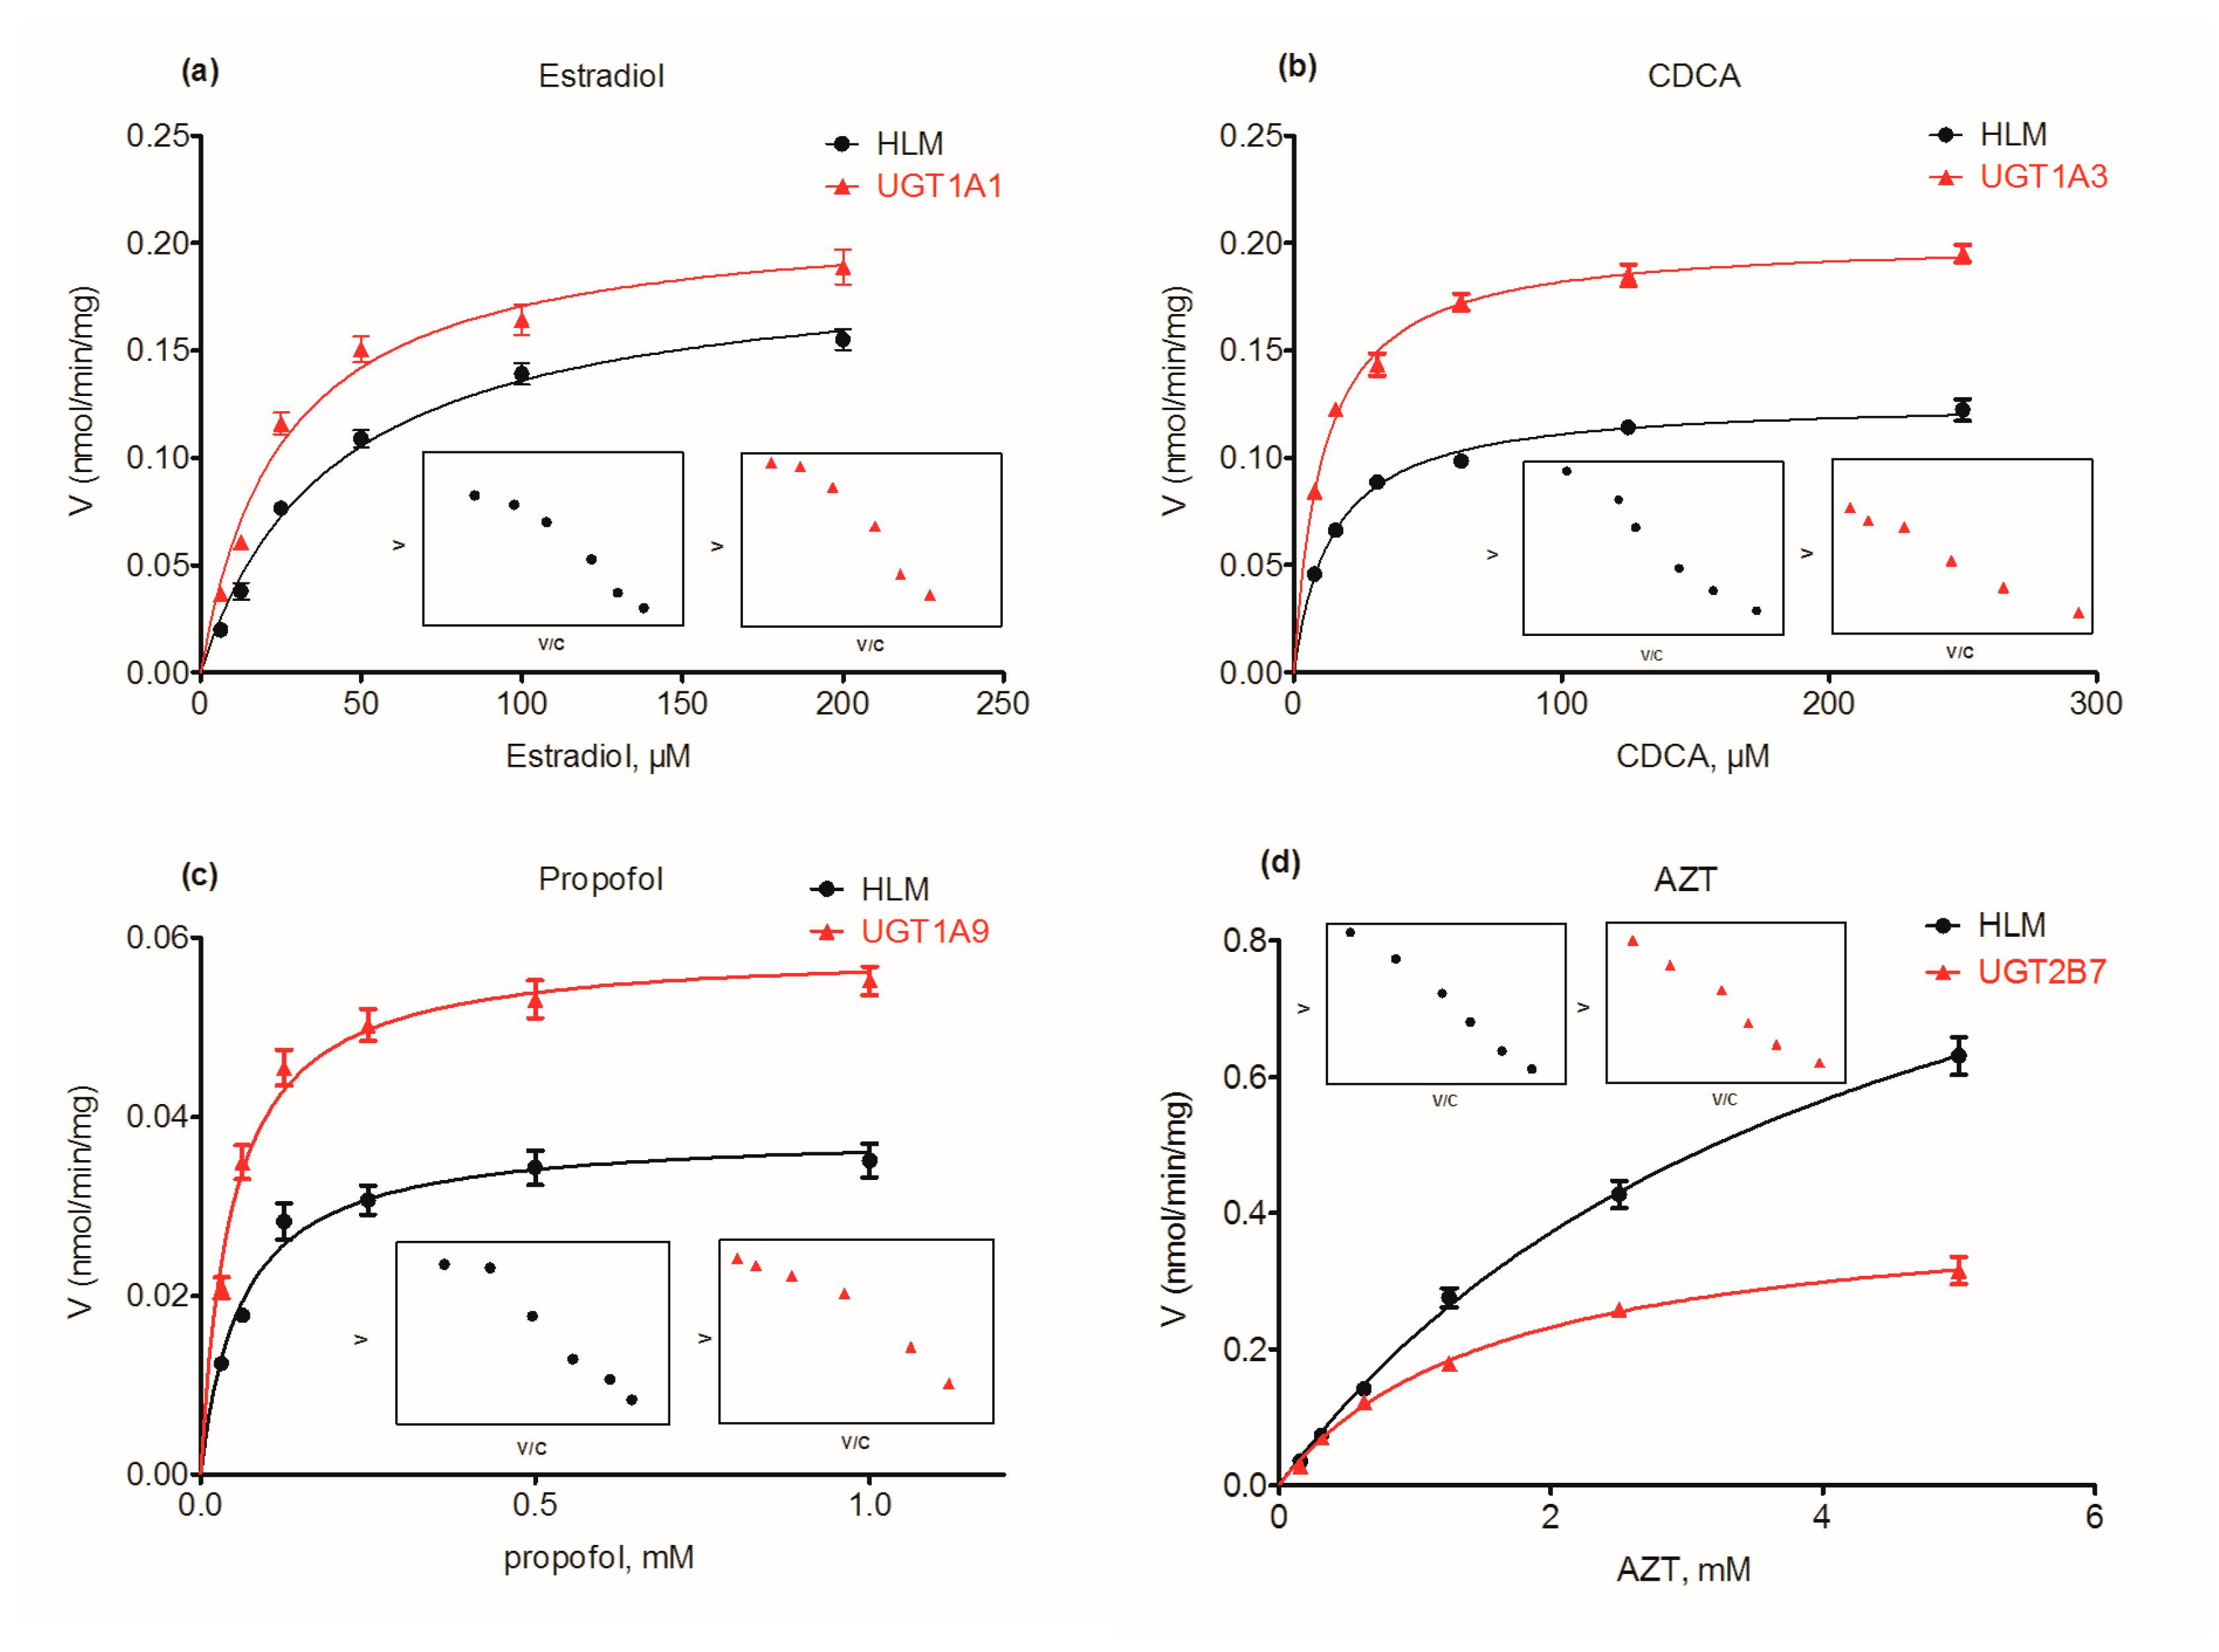
| β-estradiol | HLM | 0.19 ± 0.09 | 40.96 ± 5.44 | 4.68 ± 0.66 | MM | 0.55 |
| UGT1A1 | 0.21 ± 0.01 | 25.31 ± 4.28 | 8.45 ± 1.50 | MM | ||
| CDCA | HLM | 0.13 ± 0.003 | 14.32 ± 1.16 | 8.86 ± 0.74 | MM | 0.48 |
| UGT1A3 | 0.20 ± 0.003 | 10.90 ± 0.74 | 18.51 ± 1.28 | MM | ||
| Propofol | HLM | 0.04 ± 0.001 | 60.71 ± 9.145 | 0.63 ± 0.10 | MM | 0.49 |
| UGT1A9 | 0.06 ± 0.002 | 45.91 ± 5.91 | 1.28 ± 0.17 | MM | ||
| AZT | HLM | 1.18 ± 0.53 | 4359.0 ± 341.4 | 0.27 ± 0.02 | MM | 1.04 |
| UGT2B7 | 0.42 ± 0.01 | 1604.0 ± 121.0 | 0.26 ± 0.02 | MM |
© 2017 by the authors. Licensee MDPI, Basel, Switzerland. This article is an open access article distributed under the terms and conditions of the Creative Commons Attribution (CC BY) license (http://creativecommons.org/licenses/by/4.0/).
Share and Cite
Hong, X.; Zheng, Y.; Qin, Z.; Wu, B.; Dai, Y.; Gao, H.; Yao, Z.; Gonzalez, F.J.; Yao, X. In Vitro Glucuronidation of Wushanicaritin by Liver Microsomes, Intestine Microsomes and Expressed Human UDP-Glucuronosyltransferase Enzymes. Int. J. Mol. Sci. 2017, 18, 1983. https://0-doi-org.brum.beds.ac.uk/10.3390/ijms18091983
Hong X, Zheng Y, Qin Z, Wu B, Dai Y, Gao H, Yao Z, Gonzalez FJ, Yao X. In Vitro Glucuronidation of Wushanicaritin by Liver Microsomes, Intestine Microsomes and Expressed Human UDP-Glucuronosyltransferase Enzymes. International Journal of Molecular Sciences. 2017; 18(9):1983. https://0-doi-org.brum.beds.ac.uk/10.3390/ijms18091983
Chicago/Turabian StyleHong, Xiaodan, Yuanru Zheng, Zifei Qin, Baojian Wu, Yi Dai, Hao Gao, Zhihong Yao, Frank J. Gonzalez, and Xinsheng Yao. 2017. "In Vitro Glucuronidation of Wushanicaritin by Liver Microsomes, Intestine Microsomes and Expressed Human UDP-Glucuronosyltransferase Enzymes" International Journal of Molecular Sciences 18, no. 9: 1983. https://0-doi-org.brum.beds.ac.uk/10.3390/ijms18091983