Impact of UVR Exposure Pattern on Squamous Cell Carcinoma-A Dose–Delivery and Dose–Response Study in Pigmented Hairless Mice


Abstract
:
1. Introduction
2. Results
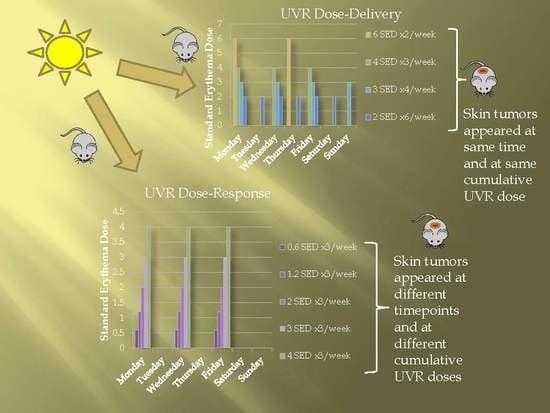
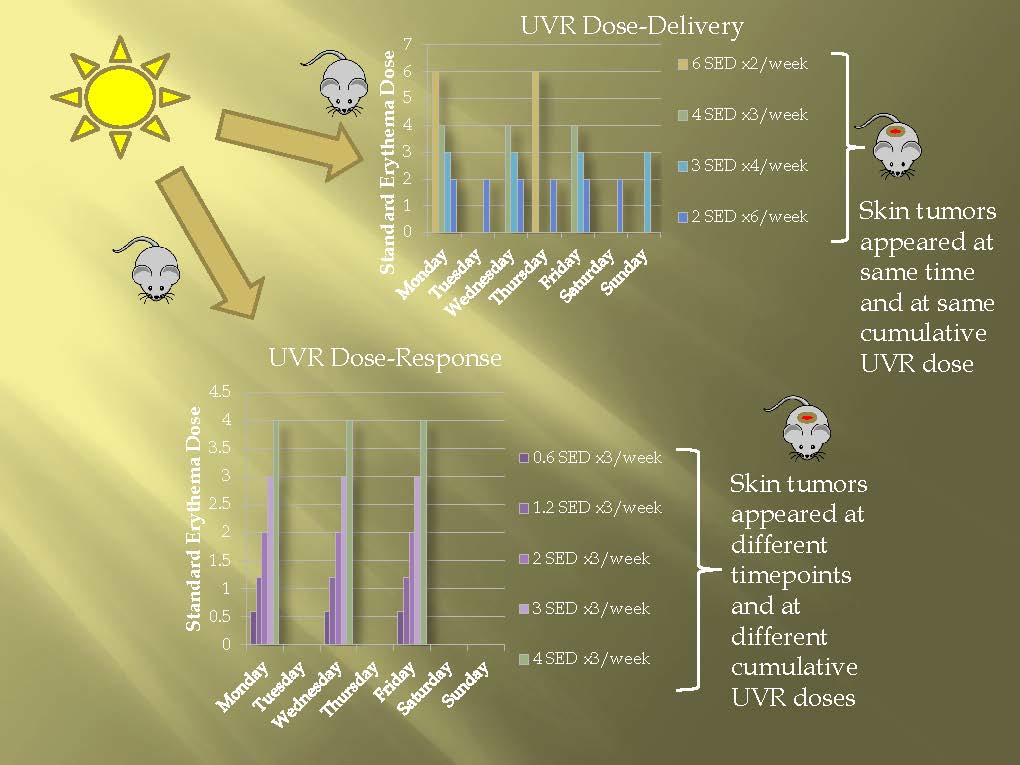
2.1. Dose–Delivery
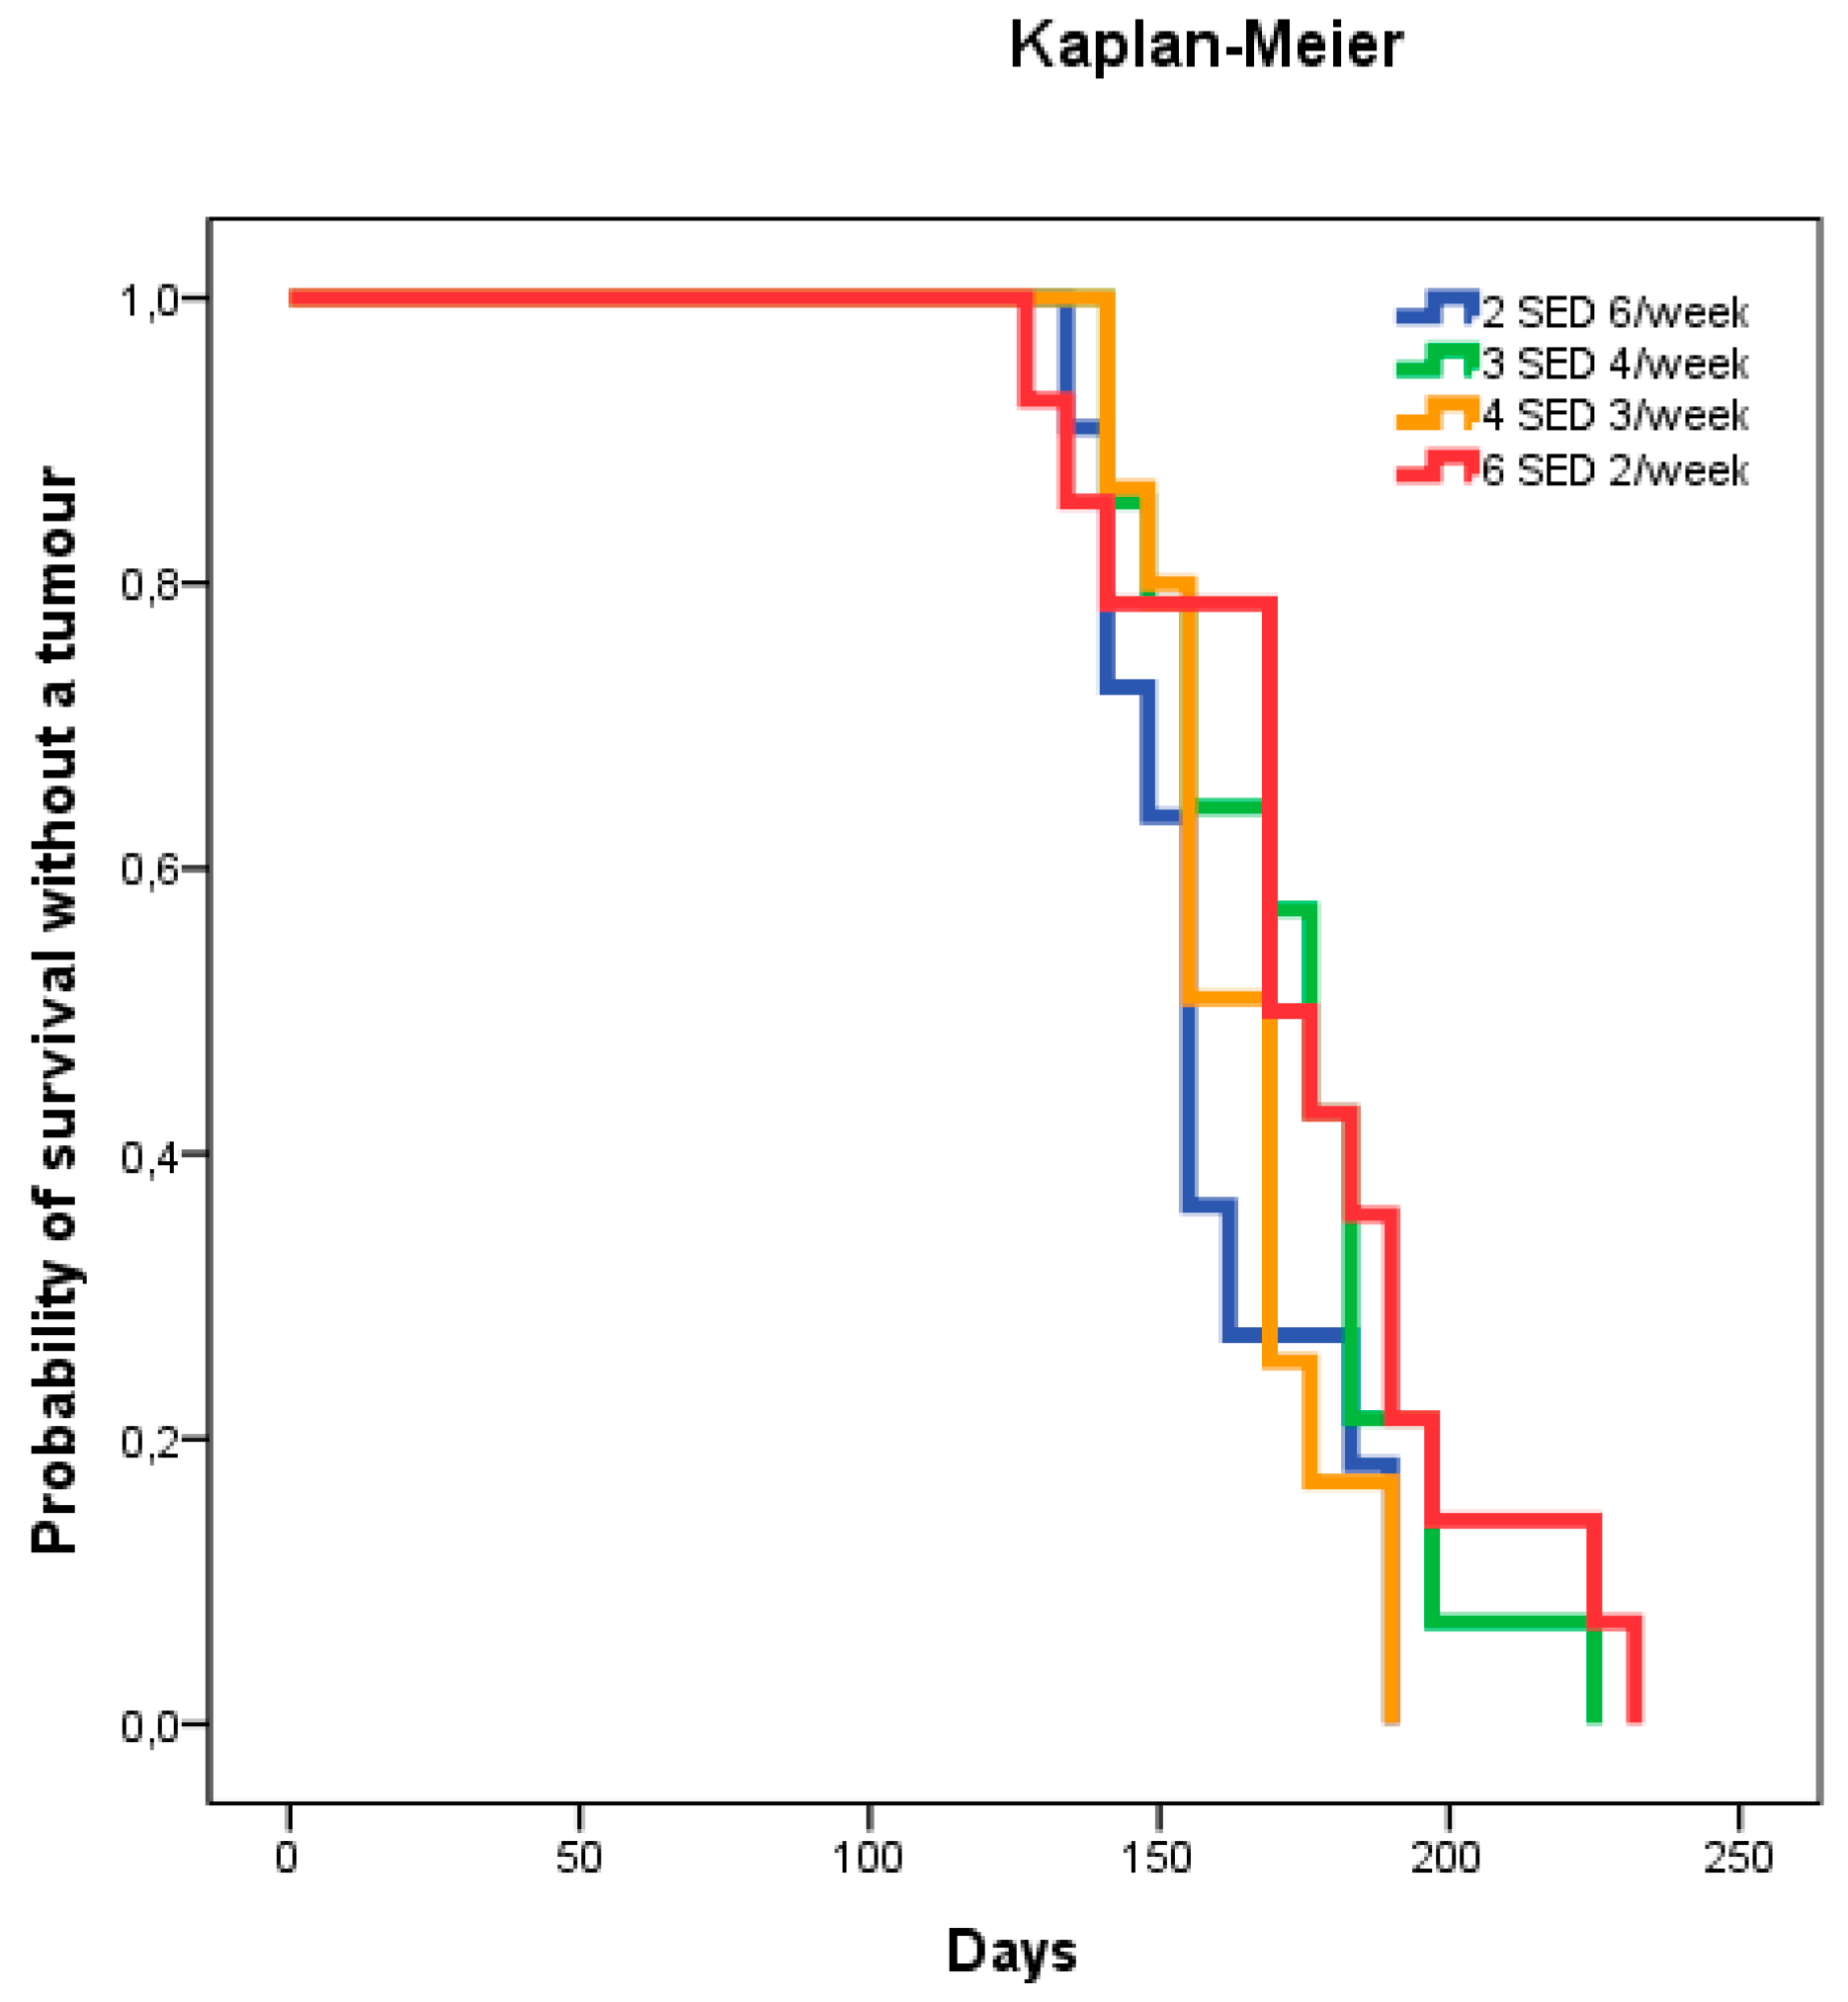
2.1.1. Time to Tumor and Cumulative Dose at Tumor Appearance
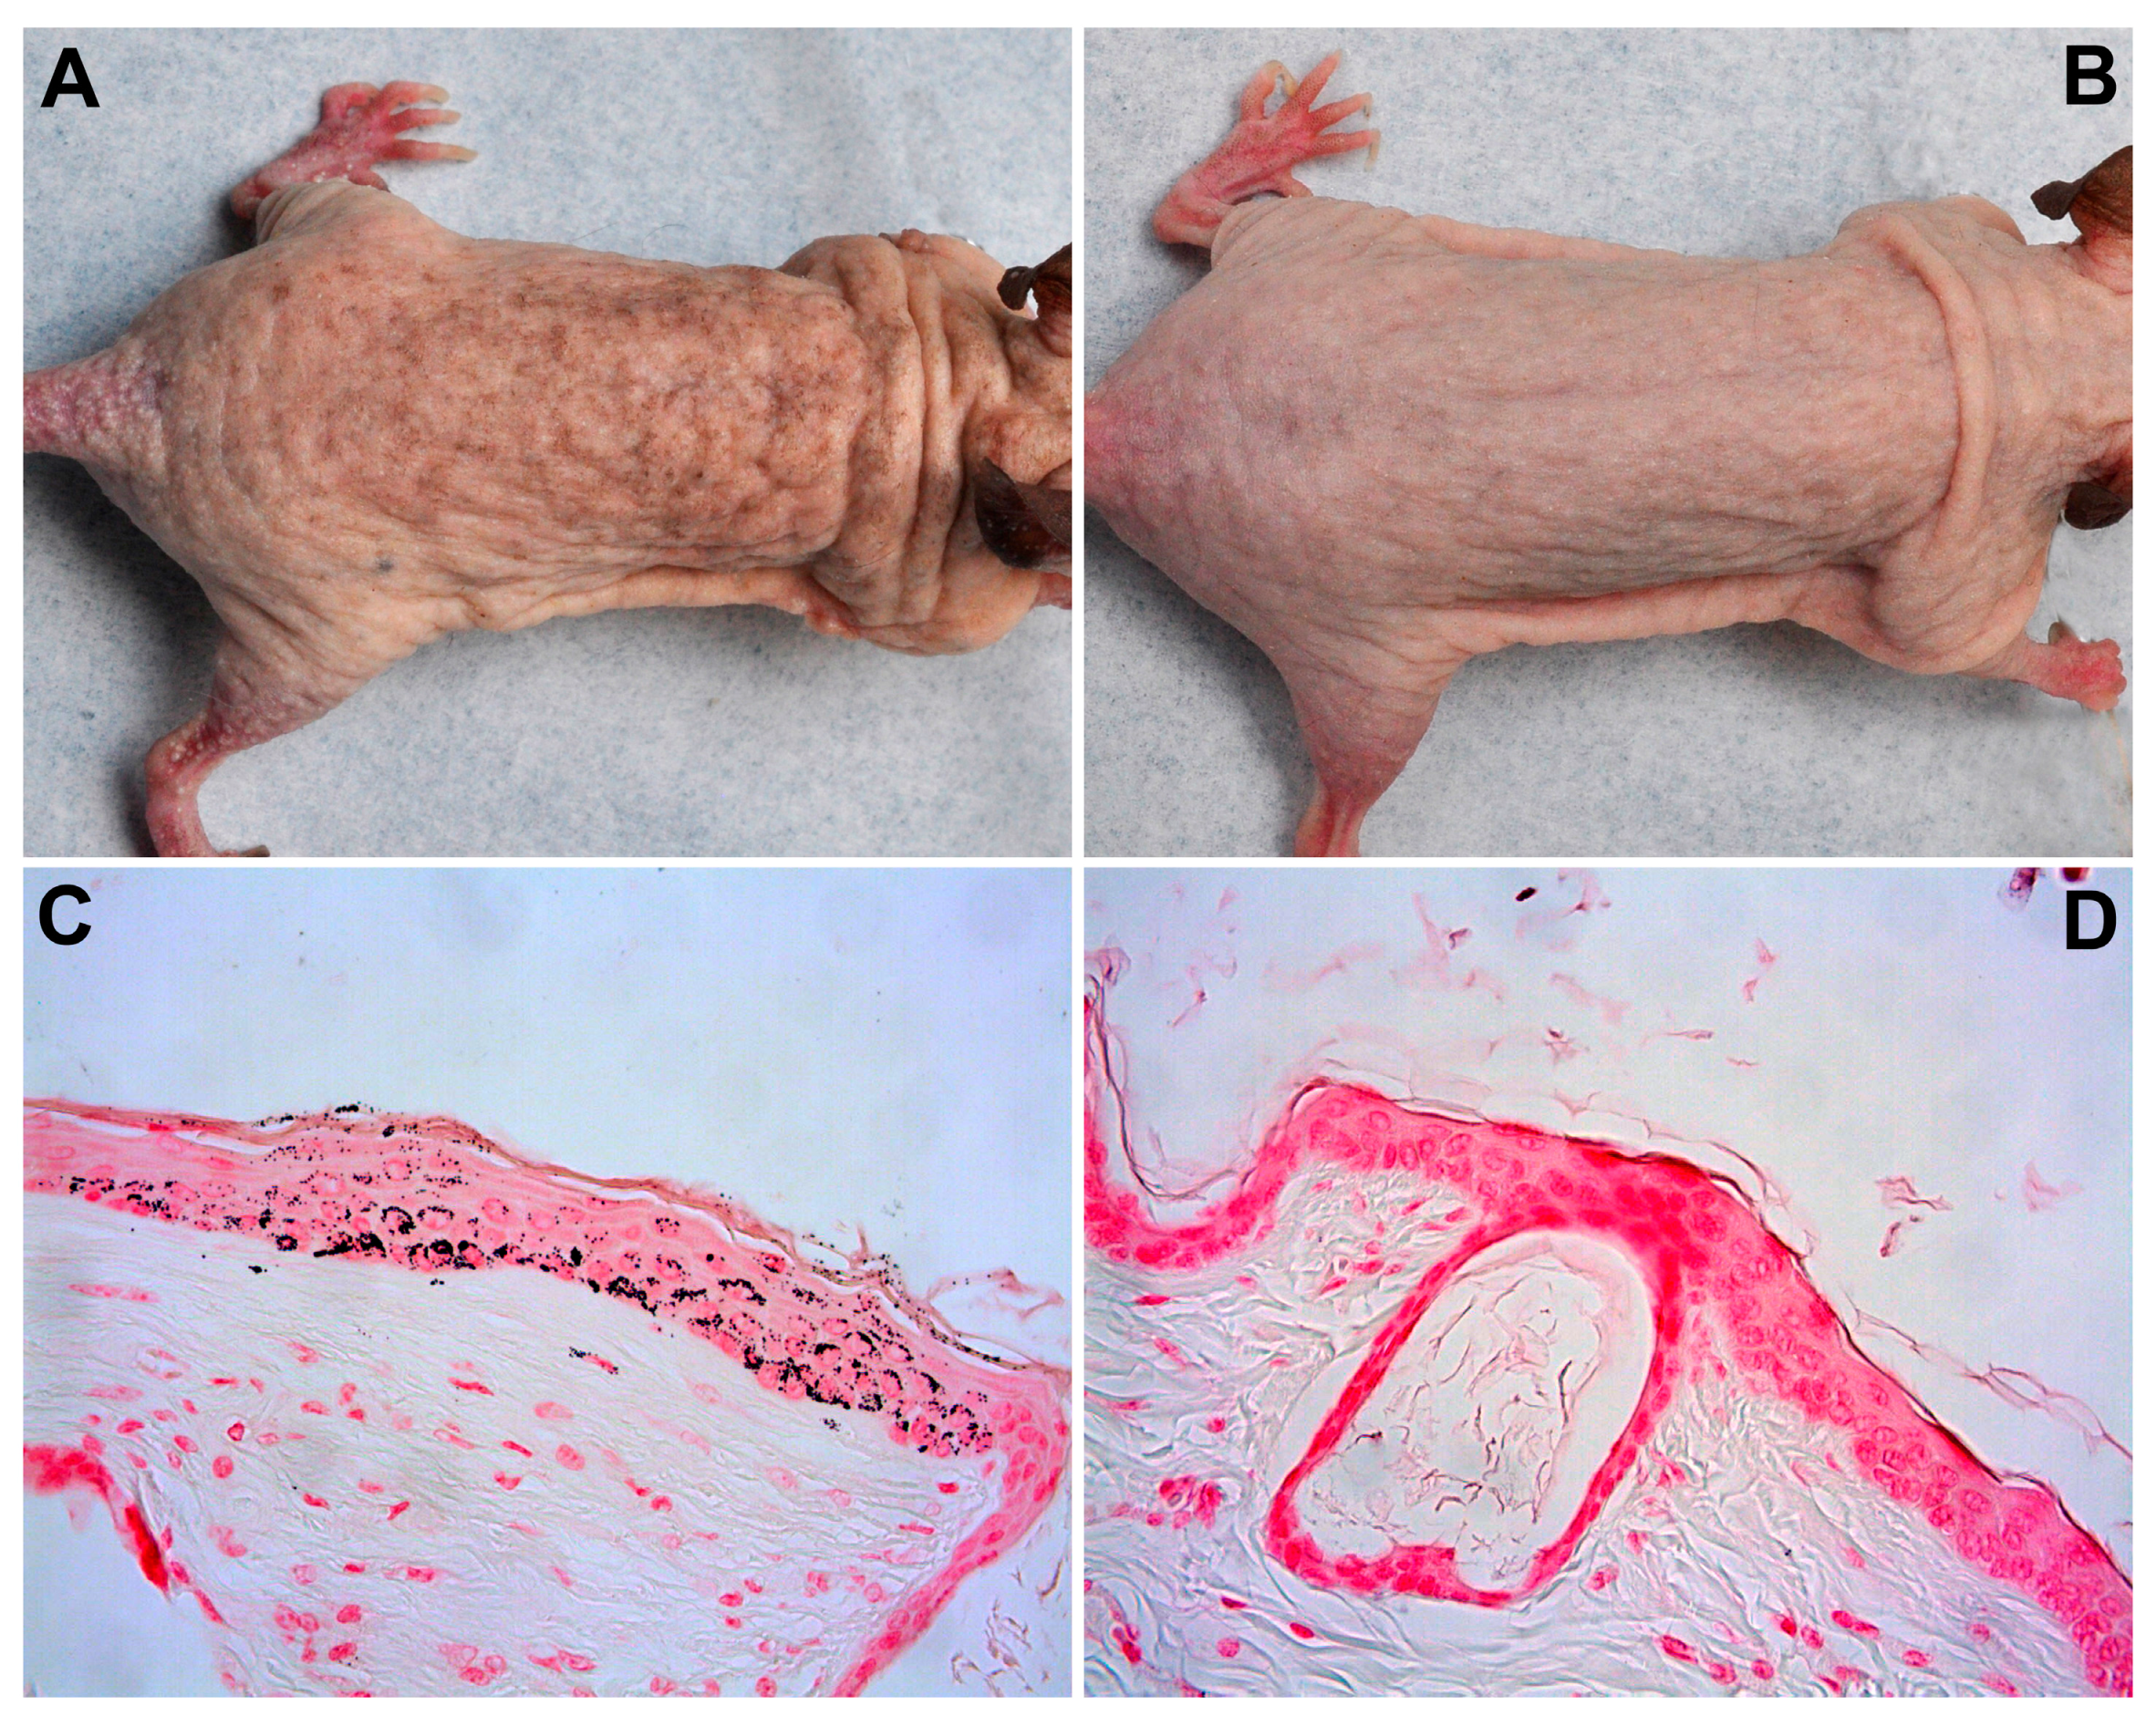
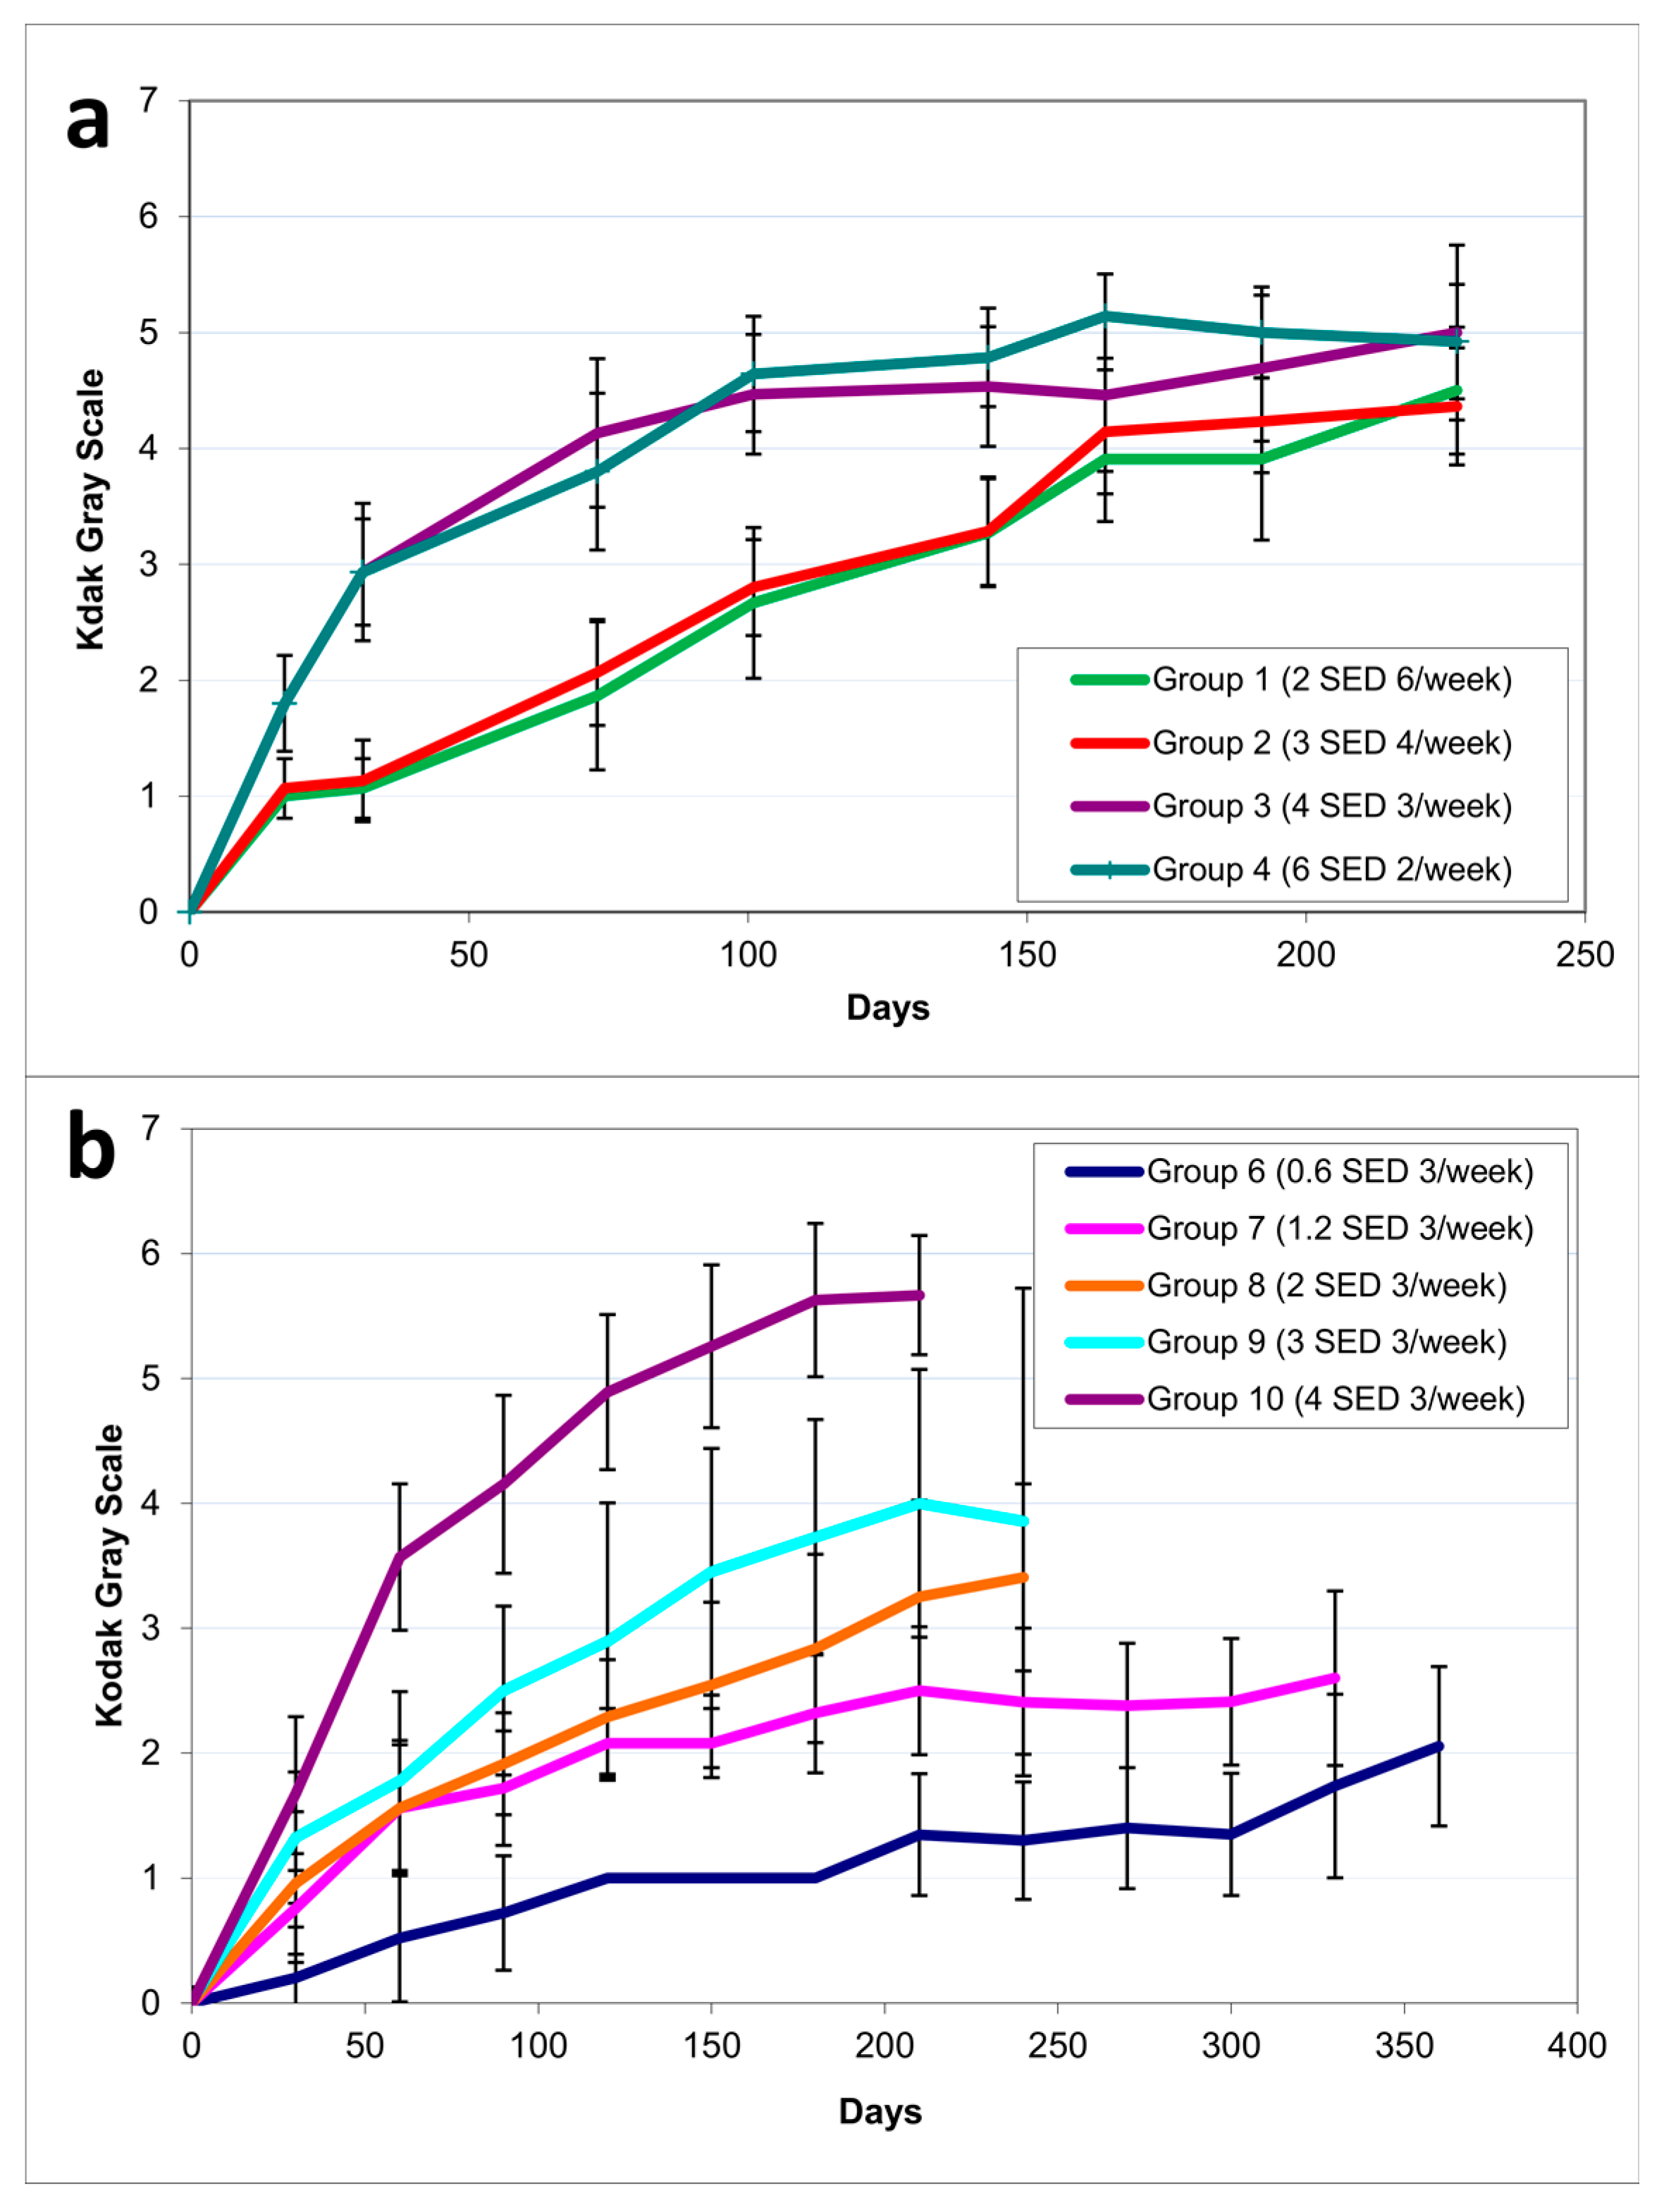
2.1.2. Pigmentation
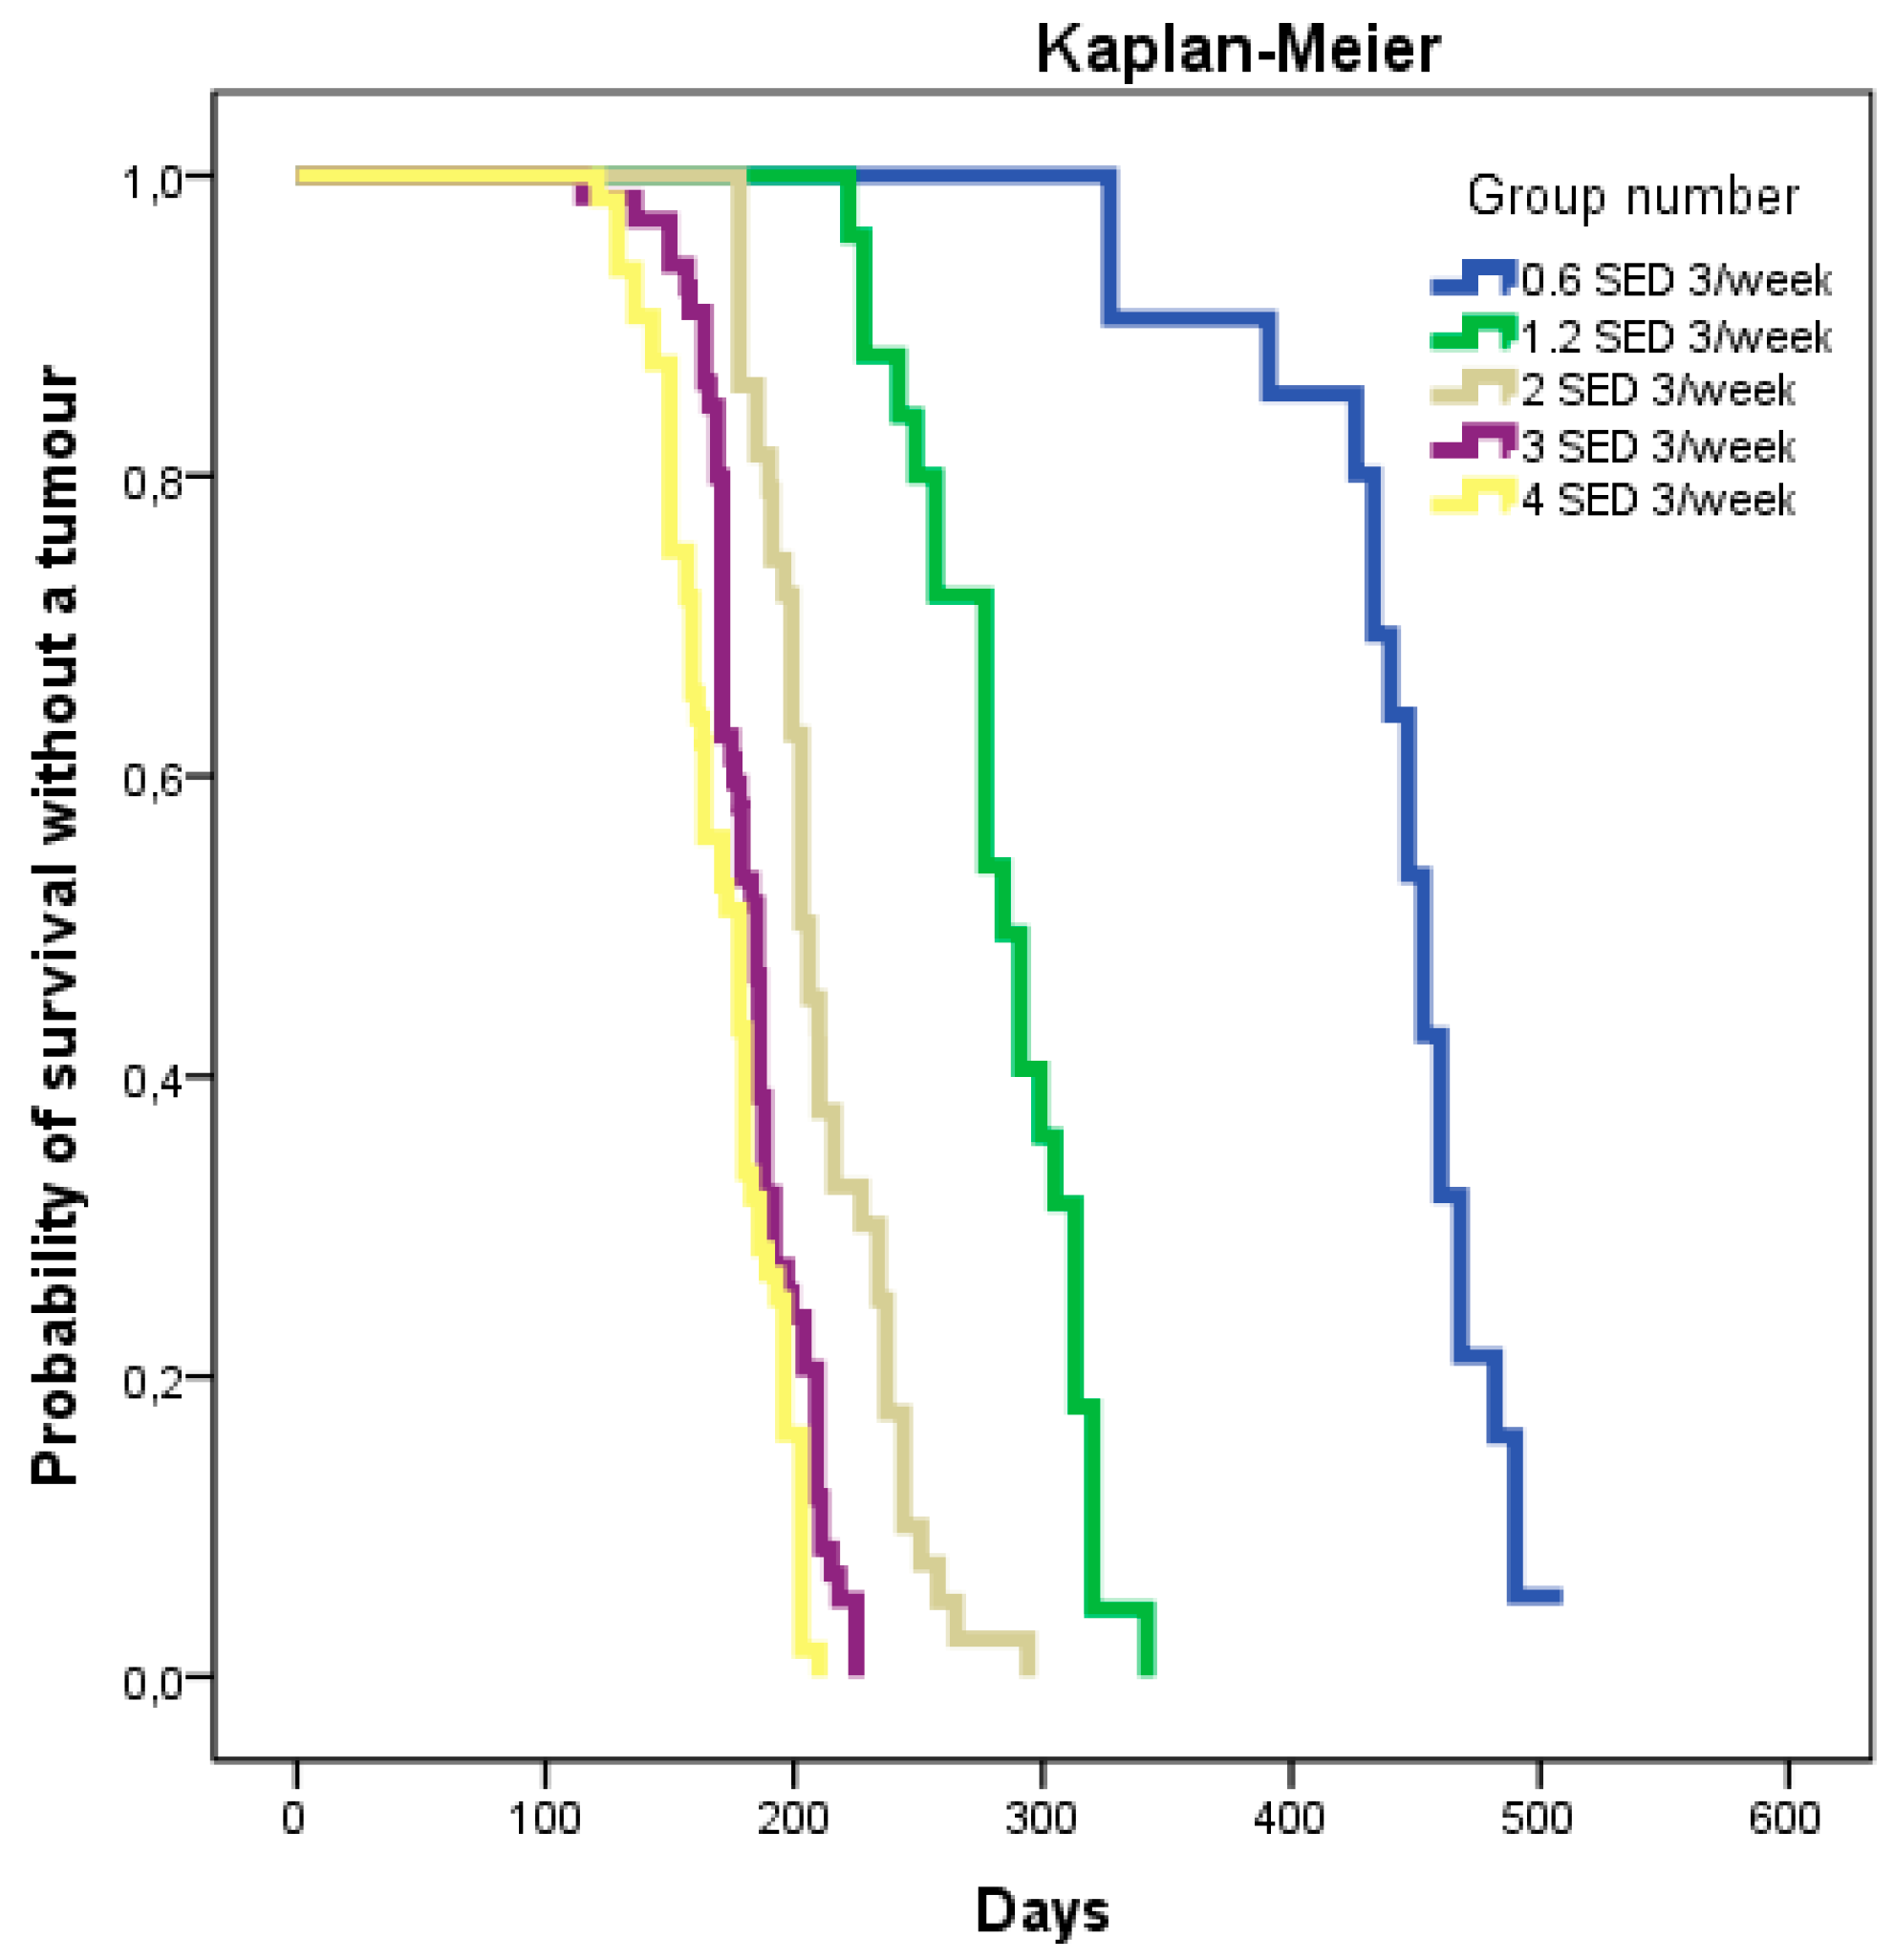
2.2. Dose–Response
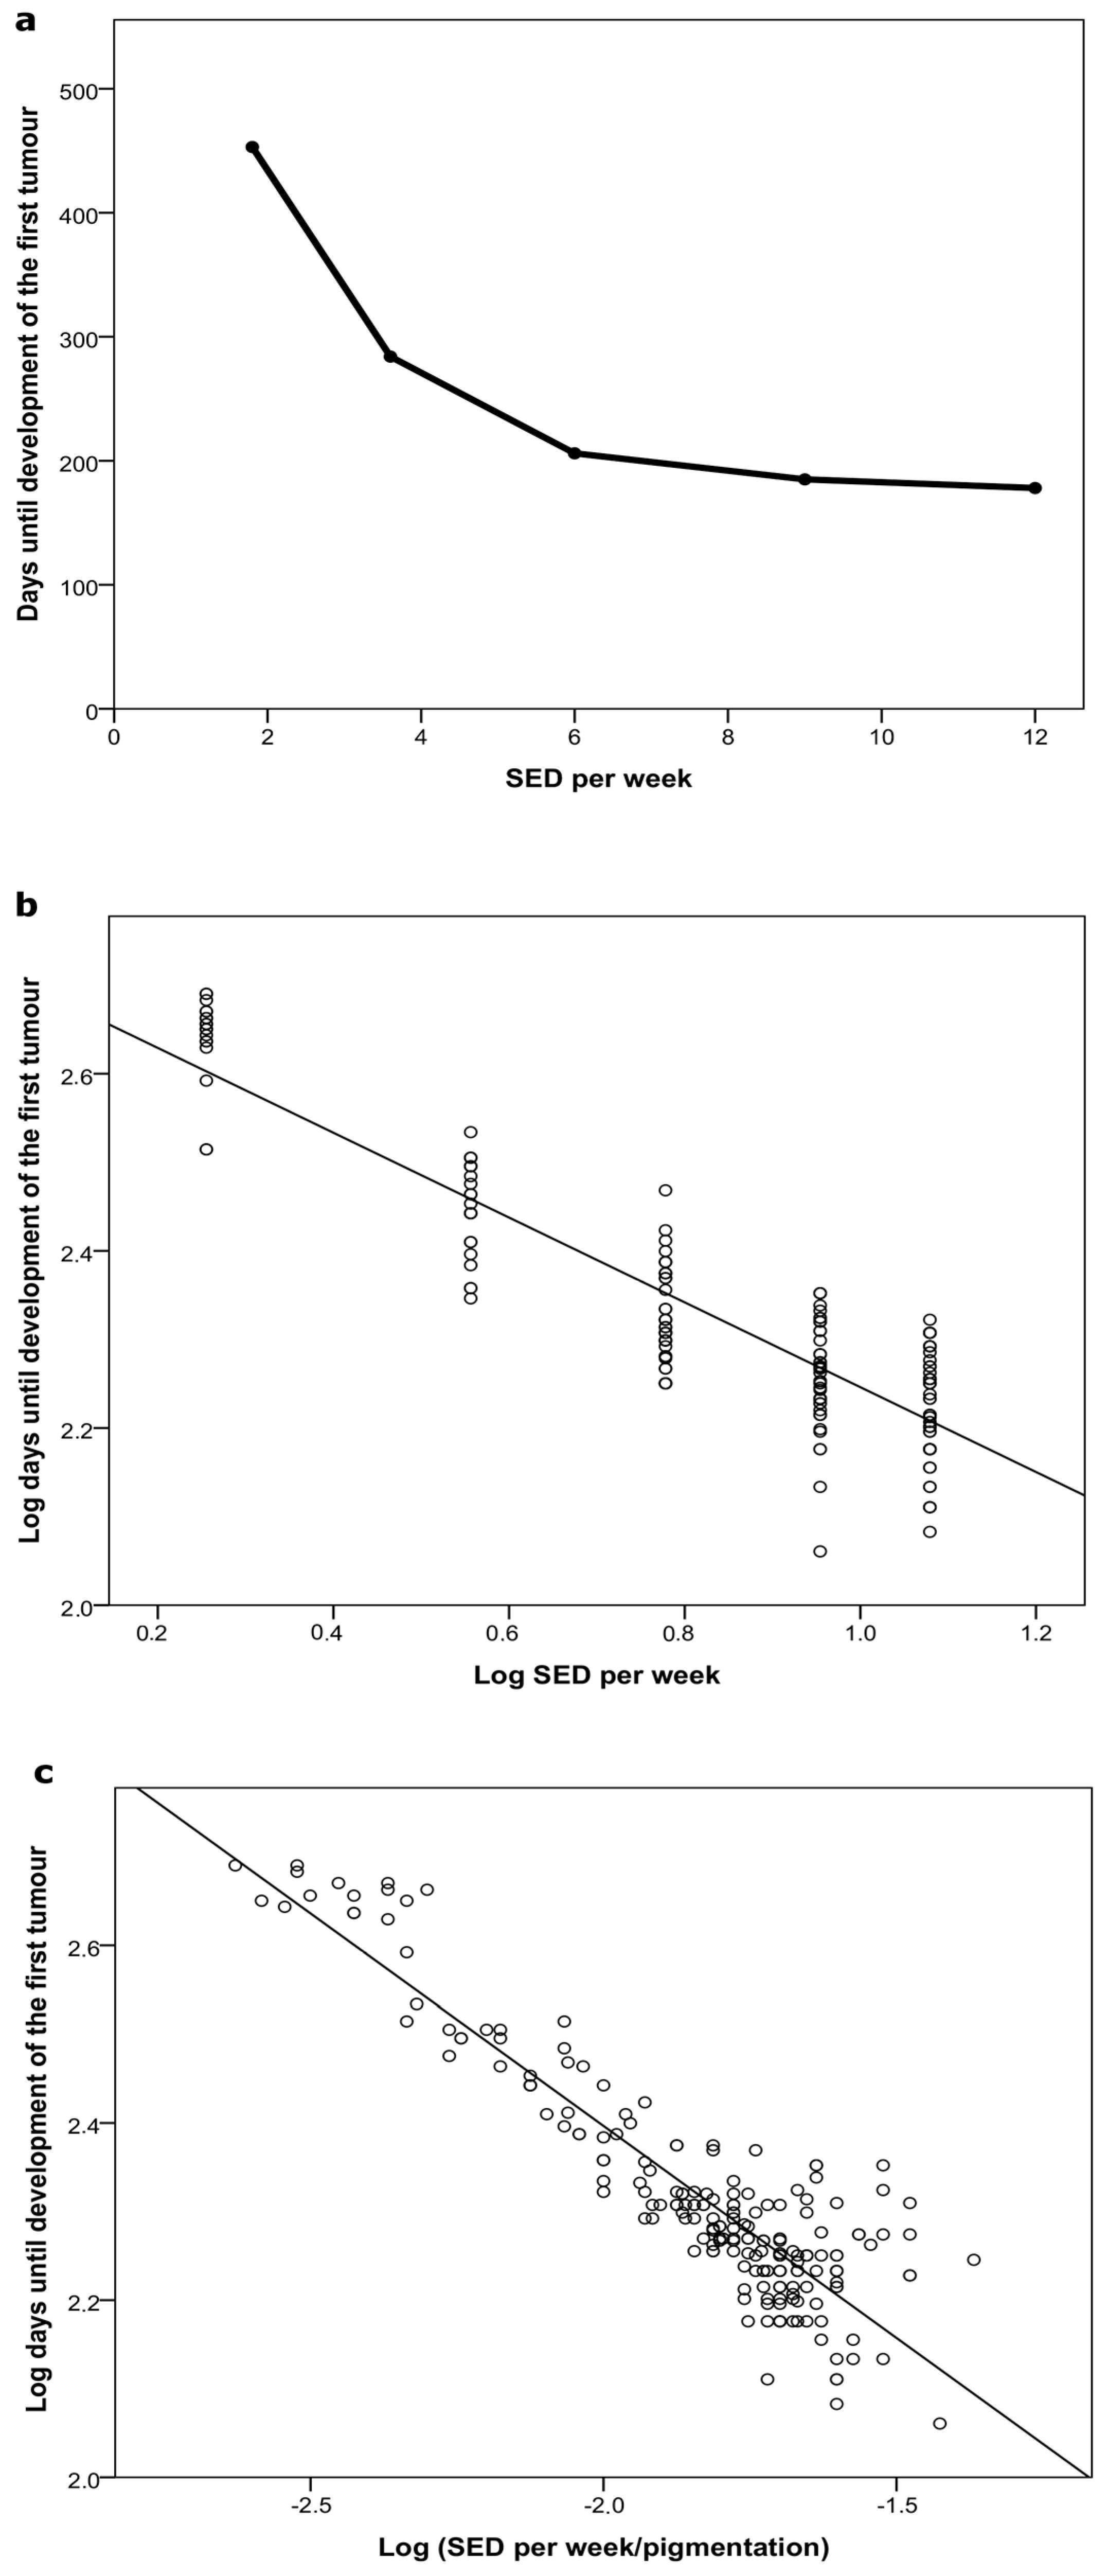
2.2.1. Time to Tumor
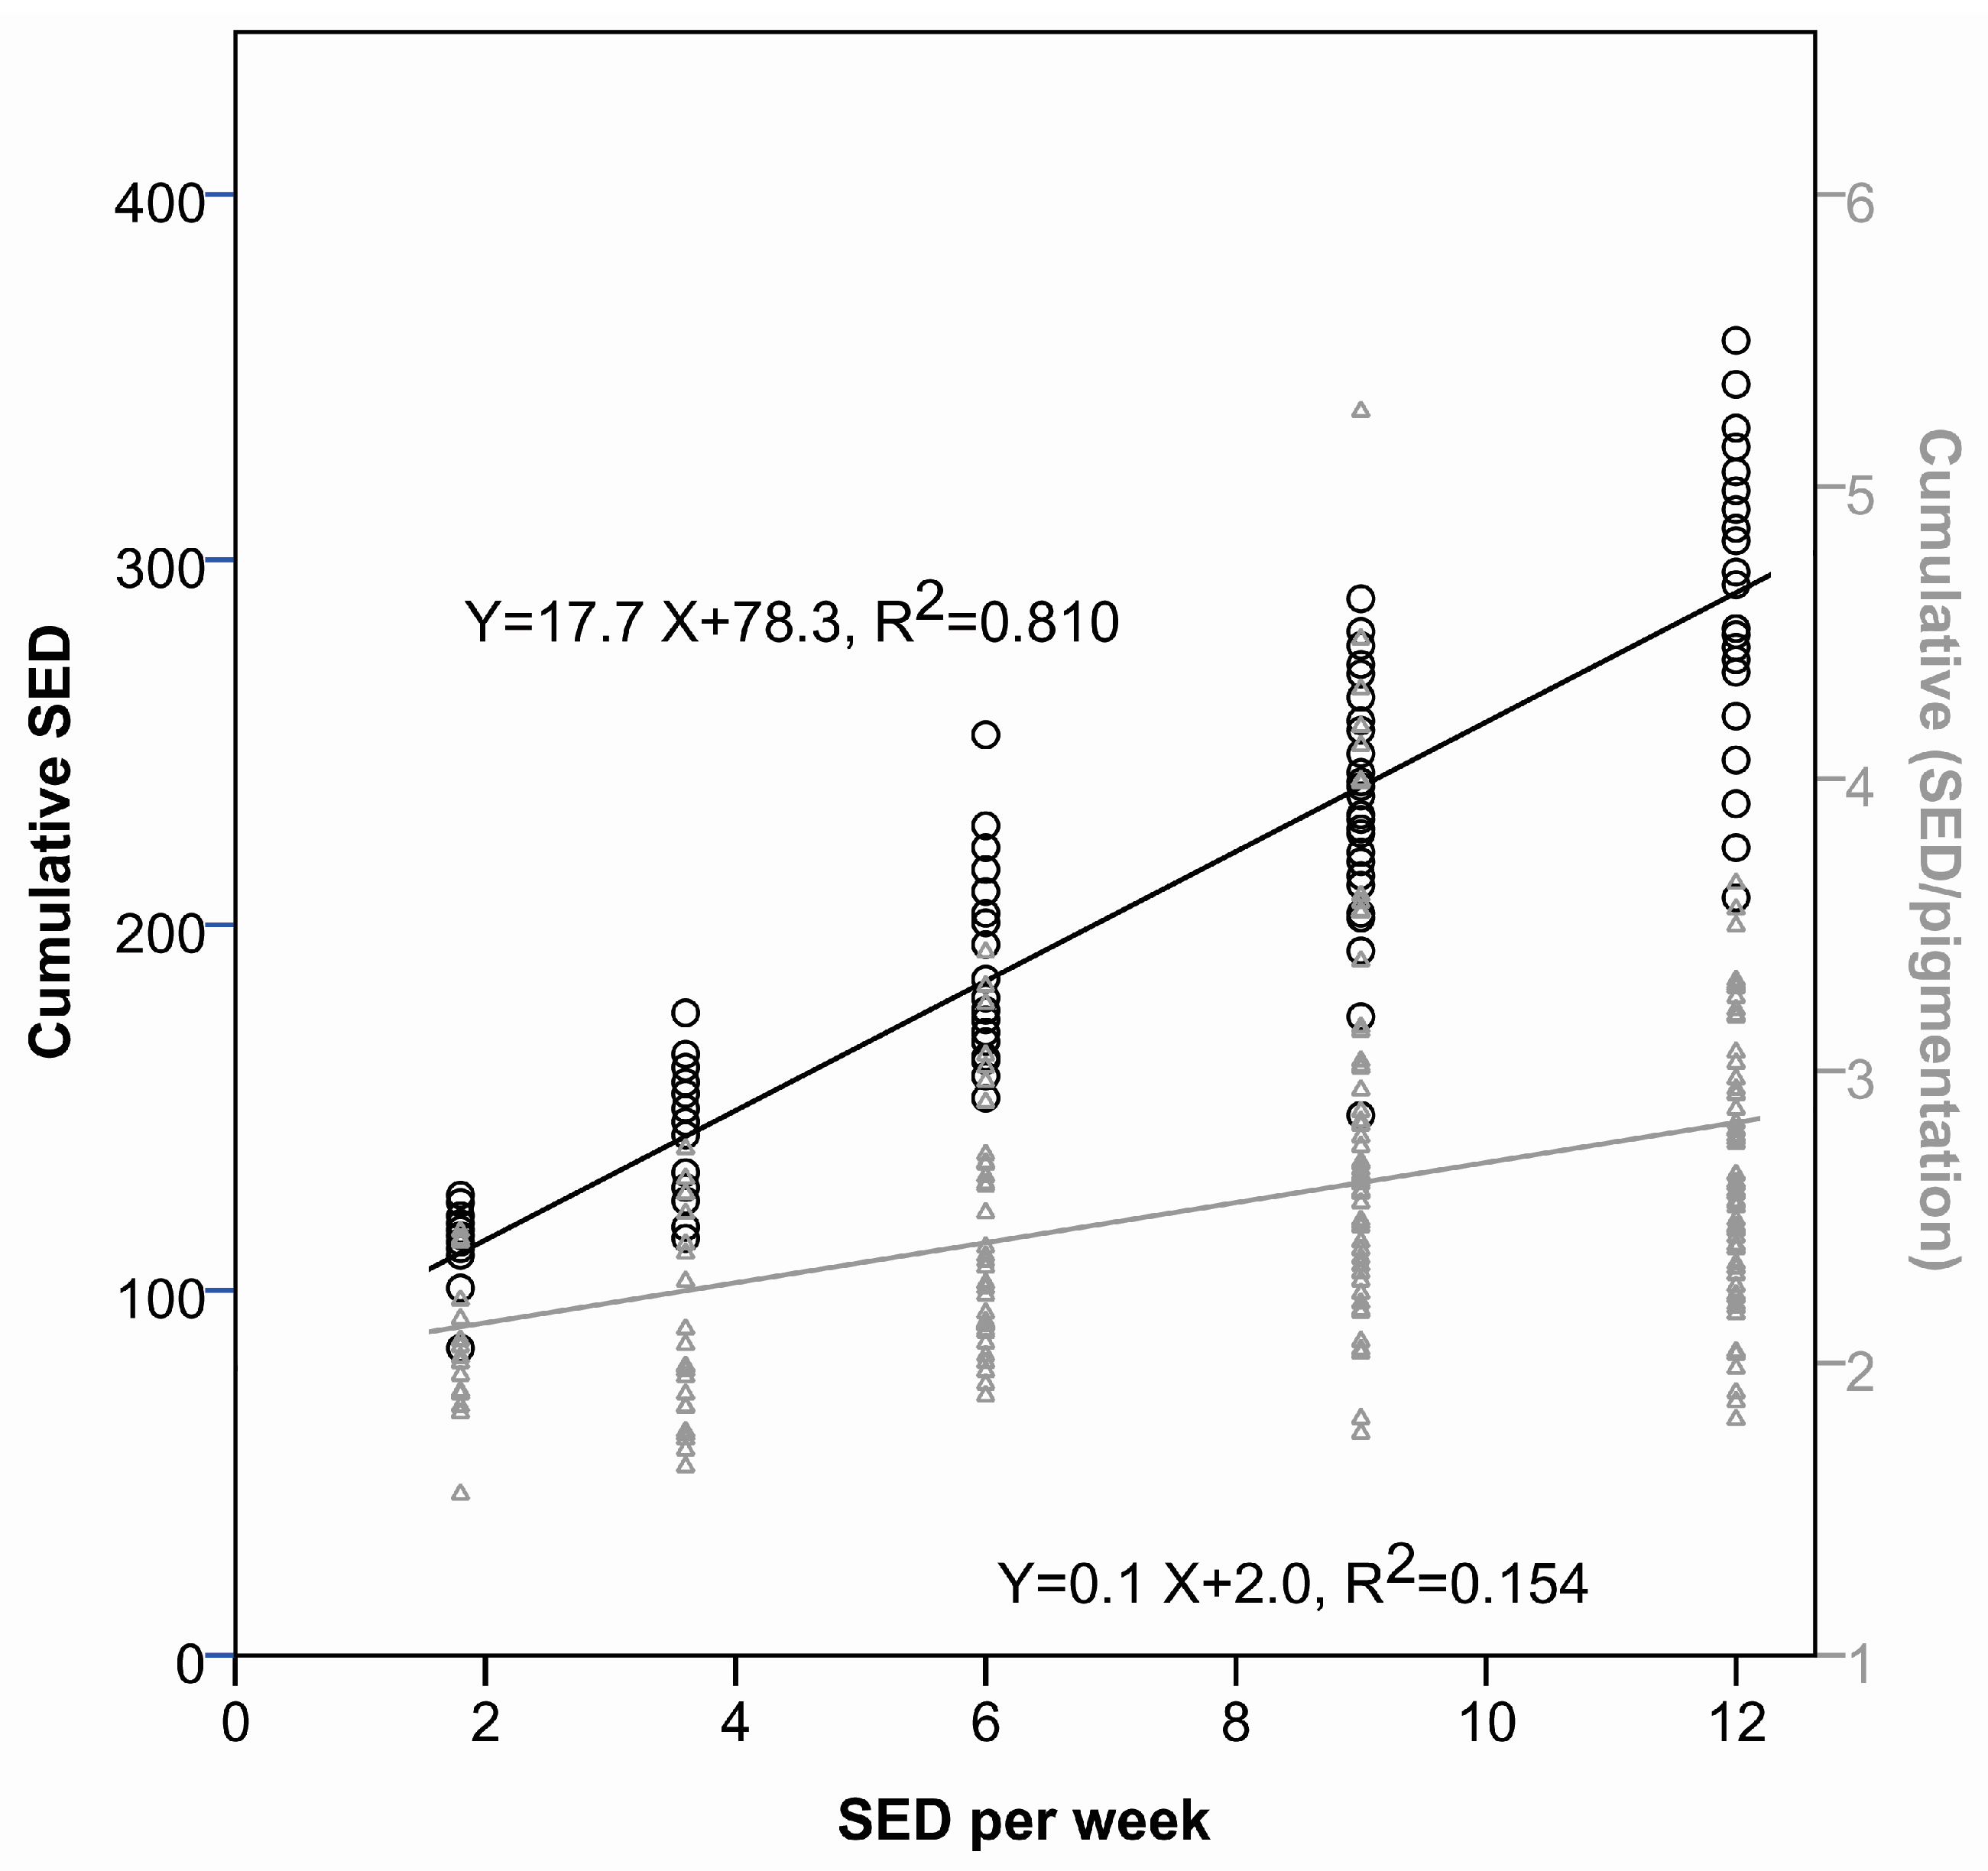
2.2.2. Cumulative Dose at Tumor Appearance
2.2.3. Pigmentation
3. Discussion
3.1. Dose–Delivery
3.2. Dose–Response
4. Materials and Methods
4.1. Animals
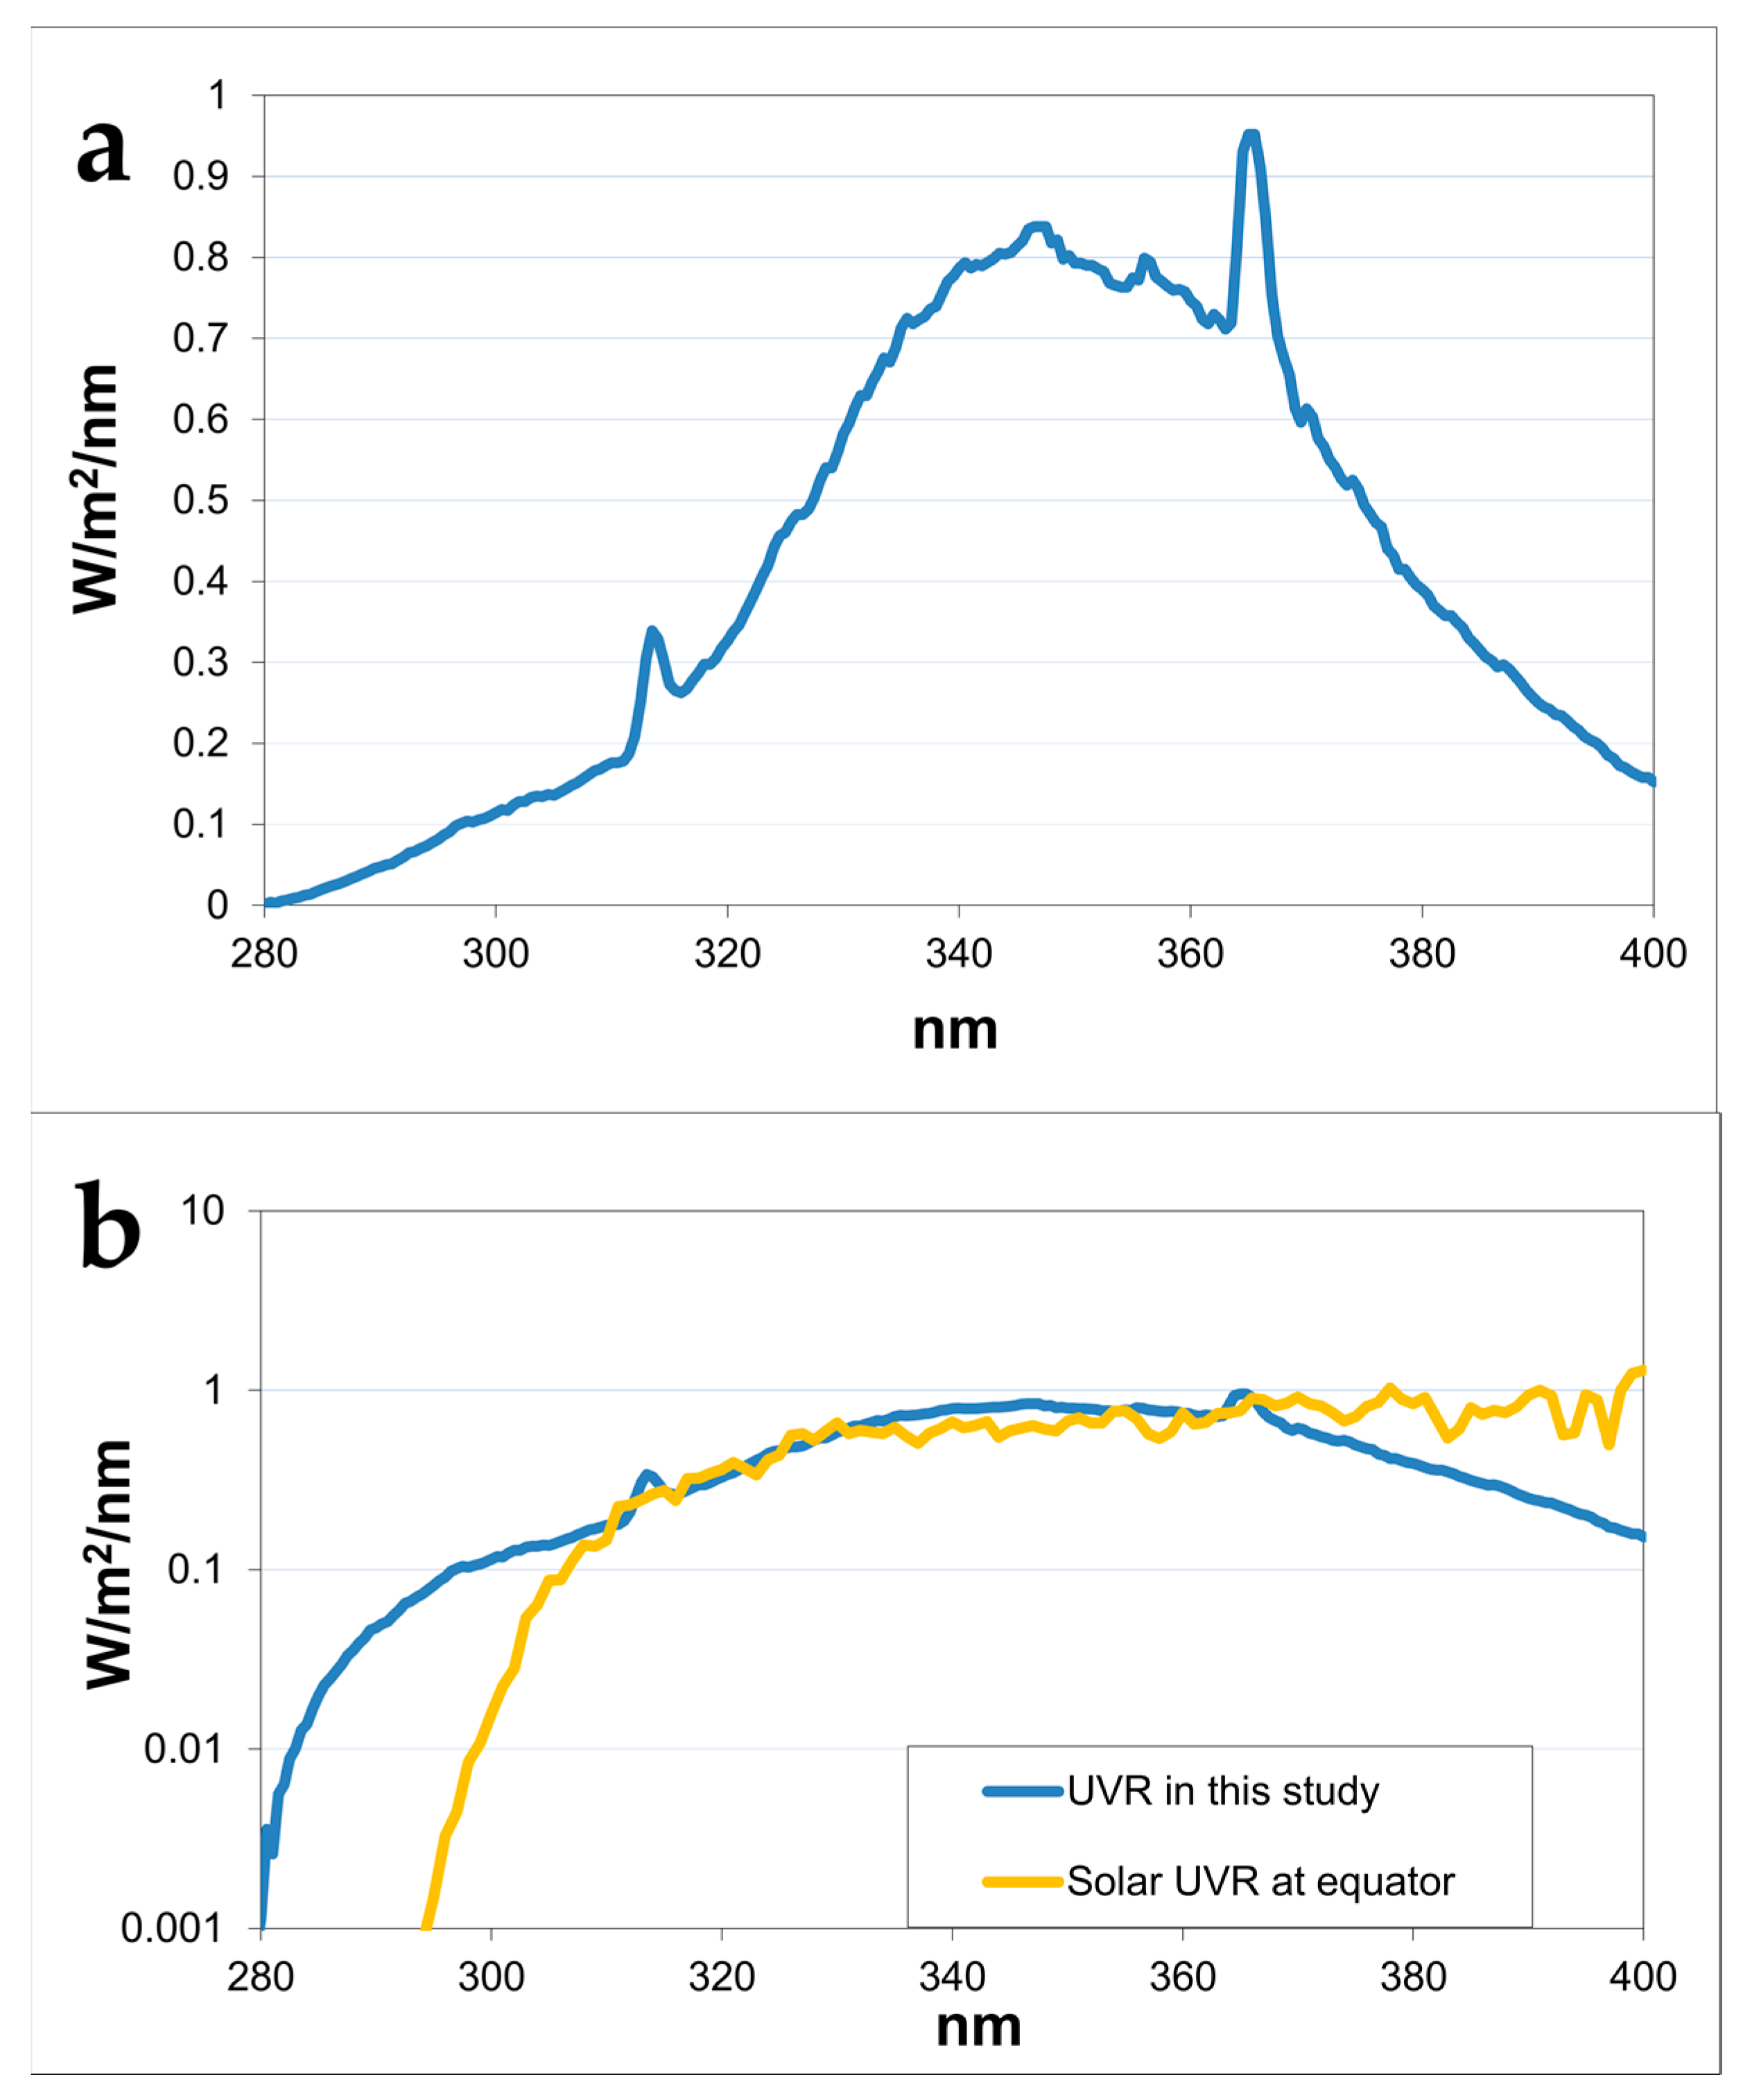
4.2. Light Sources
4.3. Study Design
4.4. Pathology
4.5. Weight and Pigmentation
4.6. Statistics
5. Conclusions
Acknowledgments
Author Contributions
Conflicts of Interest
Abbreviations
| UVR | ultraviolet radiation |
| MED | minimal erythema dose |
| SCC | squamous cell carcinoma |
| SED | standard erythema doses |
Appendix A


References
- MacKie, R.M. Long-term health risk to the skin of ultraviolet radiation. Prog. Biophys. Mol. Biol. 2006, 92, 92–96. [Google Scholar] [CrossRef] [PubMed]
- Lerche, C.M.; Poulsen, T.; Wulf, H.C. Neonatal mice do not have increased sensitivity to induction of squamous cell carcinomas. Photodermatol. Photoimmunol. Photomed. 2012, 28, 26–33. [Google Scholar] [CrossRef] [PubMed]
- Bodekaer, M.; Petersen, B.; Philipsen, P.A.; Heydenreich, J.; Thieden, E.; Wulf, H.C. Sun exposure patterns of urban, suburban, and rural children: A dosimetry and diary study of 150 children. Photochem. Photobiol. Sci. 2015, 14, 1282–1289. [Google Scholar] [CrossRef] [PubMed]
- Thieden, E.; Philipsen, P.A.; Heydenreich, J.; Wulf, H.C. UV radiation exposure related to age, sex, occupation, and sun behavior based on time-stamped personal dosimeter readings. Arch. Dermatol. 2004, 140, 197–203. [Google Scholar] [CrossRef] [PubMed]
- Schindl, A.; Rosado-Schlosser, B.; Trautinger, F. Reciprocity regulation in photobiology. An overview. Hautarzt 2001, 52, 779–785. [Google Scholar] [CrossRef] [PubMed]
- Martin, J.W.; Chin, J.W.; Nguyen, T. Reciprocity law experiments in polymeric photodegradation: A critical review. Prog. Org. Coat. 2003, 47, 292–311. [Google Scholar] [CrossRef]
- Blum, H.F. Environmental radiation and cancer. Science 1959, 130, 1545–1547. [Google Scholar] [CrossRef] [PubMed]
- De Gruijl, F.R. Health effects from solar radiation. Radiat. Prot. Dosim. 1997, 72, 177–196. [Google Scholar] [CrossRef]
- Forbes, P.D.; Blum, H.F.; Davies, R.E. Photocarcinogenesis in hairless mice: Dose-response and the influence of dose-delivery. Photochem. Photobiol. 1981, 34, 361–365. [Google Scholar] [CrossRef] [PubMed]
- Davies, R.E.; Forbes, P.D. Retinoids and photocarcinogenesis: A review. J. Cutan. Ocul. Toxicol. 1988, 7, 241–253. [Google Scholar] [CrossRef]
- Reeve, V.E.; Greenoak, G.E.; Boehm-Wilcox, C.; Canfield, P.J.; Gallagher, C.H. Effect on topical 5-methoxypsoralen on tumorigenesis induced in albino and pigmented hairless mouse skin by UV irradiation. J. Photochem. Photobiol. B 1990, 5, 343–357. [Google Scholar] [CrossRef]
- Van, W.H.; Van der Putte, S.C.; Toonstra, J.; van der Leun, J.C. UVA-induced tumours in pigmented hairless mice and the carcinogenic risks of tanning with UVA. Arch. Dermatol. Res. 1990, 282, 289–294. [Google Scholar]
- Lerche, C.M.; Philipsen, P.A.; Poulsen, T.; Wulf, H.C. Topical tacrolimus in combination with simulated solar radiation does not enhance photocarcinogenesis in hairless mice. Exp. Dermatol. 2008, 17, 57–62. [Google Scholar] [CrossRef] [PubMed]
- Lerche, C.M.; Philipsen, P.A.; Poulsen, T.; Wulf, H.C. Topical hydrocortisone, clobetasol propionate, and calcipotriol do not increase photocarcinogenesis induced by simulated solar irradiation in hairless mice. Exp. Dermatol. 2010, 19, 973–979. [Google Scholar] [CrossRef] [PubMed]
- Ravnbak, M.H.; Wulf, H.C. Pigmentation after single and multiple UV-exposures depending on UV-spectrum. Arch. Dermatol. Res. 2007, 299, 25–32. [Google Scholar] [CrossRef] [PubMed]
- Cui, R.; Widlund, H.R.; Feige, E.; Lin, J.Y.; Wilensky, D.L.; Igras, V.E.; D’Orazio, J.; Fung, C.Y.; Schanbacher, C.F.; Granter, S.R.; et al. Central role of p53 in the suntan response and pathologic hyperpigmentation. Cell 2007, 128, 853–864. [Google Scholar] [CrossRef] [PubMed]
- Lerche, C.M.; Philipsen, P.A.; Poulsen, T.; Wulf, H.C. Topical pimecrolimus and tacrolimus do not accelerate photocarcinogenesis in hairless mice after UVA or simulated solar radiation. Exp. Dermatol. 2009, 18, 246–251. [Google Scholar] [CrossRef] [PubMed]
- Agar, N.; Young, A.R. Melanogenesis: A photoprotective response to DNA damage? Mutat. Res. 2005, 571, 121–132. [Google Scholar] [CrossRef] [PubMed]
- Lerche, C.M.; Philipsen, P.A.; Poulsen, T.; Wulf, H.C. Photocarcinogenesis and toxicity of benzoyl peroxide in hairless mice after simulated solar radiation. Exp. Dermatol. 2010, 19, 381–386. [Google Scholar] [CrossRef] [PubMed]
- Togsverd-Bo, K.; Lerche, C.M.; Poulsen, T.; Haedersdal, M.; Wulf, H.C. Reduced ultraviolet irradiation delays subsequent squamous cell carcinomas in hairless mice. Photodermatol. Photoimmunol. Photomed. 2009, 25, 305–309. [Google Scholar] [CrossRef] [PubMed]
- Togsverd-Bo, K.; Lerche, C.M.; Poulsen, T.; Wulf, H.C.; Haedersdal, M. Photodynamic therapy with topical methyl- and hexylaminolevulinate for prophylaxis and treatment of UV-induced SCC in hairless mice. Exp. Dermatol. 2010, 19, e166–e172. [Google Scholar] [CrossRef] [PubMed]
- Lerche, C.M.; Philipsen, P.A.; Sehested, M.; Wulf, H.C. Photocarcinogenesis of topical tazarotene and isotretinoin alone and in combination with valproic acid in hairless mice. Exp. Dermatol. 2008, 17, 972–974. [Google Scholar] [CrossRef] [PubMed]
- Forbes, P.D. Relevance of animal models of photocarcinogenesis to humans. Photochem. Photobiol. 1996, 63, 357–362. [Google Scholar] [CrossRef] [PubMed]
- Forbes, P.D.; Beer, J.Z.; Black, H.S.; Cesarini, J.P.; Cole, C.A.; Davies, R.E.; Davitt, J.M.; De Gruijl, F.; Epstein, J.; Fourtanier, A.; et al. Standardized protocols for photocarcinogenesis safety testing. Front. Biosci. 2003, 8, d848–d854. [Google Scholar] [CrossRef] [PubMed]
- Benjamin, C.L.; Melnikova, V.O.; Ananthaswamy, H.N. P53 protein and pathogenesis of melanoma and nonmelanoma skin cancer. Adv. Exp. Med. Biol. 2008, 624, 265–282. [Google Scholar] [PubMed]
- Cole, C.A.; Davies, R.E.; Forbes, P.D.; D’Aloisio, L.C. Comparison of action spectra for acute cutaneous responses to ultraviolet radiation: Man and albino hairless mouse. Photochem. Photobiol. 1983, 37, 623–631. [Google Scholar] [CrossRef] [PubMed]
- Coelho, S.G.; Choi, W.; Brenner, M.; Miyamura, Y.; Yamaguchi, Y.; Wolber, R.; Smuda, C.; Batzer, J.; Kolbe, L.; Ito, S.; et al. Short- and long-term effects of UV radiation on the pigmentation of human skin. J. Investig. Dermatol. Symp. Proc. 2009, 14, 32–35. [Google Scholar] [CrossRef] [PubMed]
- De Gruijl, F.R.; Van Der Meer, J.B.; van der Leun, J.C. Dose-time dependency of tumor formation by chronic UV exposure. Photochem. Photobiol. 1983, 37, 53–62. [Google Scholar] [CrossRef] [PubMed]
- Gibbs, N.K.; Young, A.R.; Magnus, I.A. Failure of UVR dose reciprocity for skin tumorigenesis in hairless mice treated with 8-methoxypsoralen. Photochem. Photobiol. 1985, 42, 39–42. [Google Scholar] [CrossRef] [PubMed]
- Willis, I.; Menter, J.M. Effect of varying dose of UV radiation on mammalian skin: Simulation of decreasing stratospheric ozone. J. Investig. Dermatol. 1983, 80, 416–419. [Google Scholar] [CrossRef] [PubMed]
- Sheehan, J.M.; Cragg, N.; Chadwick, C.A.; Potten, C.S.; Young, A.R. Repeated ultraviolet exposure affords the same protection against DNA photodamage and erythema in human skin types II and IV but is associated with faster DNA repair in skin type IV. J. Investig. Dermatol. 2002, 118, 825–829. [Google Scholar] [PubMed]
- Willis, I.; Menter, J.M.; Whyte, H.J. The rapid induction of cancers in the hairless mouse utilizing the principle of photoaugmentation. J. Investig. Dermatol. 1981, 76, 404–408. [Google Scholar] [CrossRef] [PubMed]
- Lerche, C.M.; Philipsen, P.A.; Wulf, H.C. UVR: Sun, lamps, pigmentation and vitamin D. Photochem. Photobiol. Sci. 2017, 16, 291–301. [Google Scholar] [CrossRef] [PubMed]
- Diffey, B.L.; Jansen, C.T.; Urbach, F.; Wulf, H.C. The standard erythema dose: A new photobiological concept. Photodermatol. Photoimmunol. Photomed. 1997, 13, 64–66. [Google Scholar] [CrossRef] [PubMed]
- Lerche, C.M.; Philipsen, P.A.; Wulf, H.C. X-rays and photocarcinogenesis in hairless mice. Arch. Dermatol. Res. 2013, 305, 529–533. [Google Scholar] [CrossRef] [PubMed]
- Hansen, A.B.; Bech-Thomsen, N.; Wulf, H.C. In vivo estimation of pigmentation in ultraviolet-exposed hairless mice. Photodermatol. Photoimmunol. Photomed. 1995, 11, 14–17. [Google Scholar] [CrossRef] [PubMed]


| Study | Group | Irradiation (UVR) Regimen Total SED per Week | N (Hairless Mice) | Previously Published (Reference) | |
|---|---|---|---|---|---|
| Dose–delivery | 1 | 2 SED 6×/week | 12 | 15 | - |
| 2 | 3 SED 4×/week | 12 | 15 | - | |
| 3 | 4 SED 3×/week | 12 | 15 * | - | |
| 4 | 6 SED 2×/week | 12 | 15 | - | |
| Dose–response | 5 | 0 SED | 0 | 50 | [13,19] |
| 6 | 0.6 SED 3×/week | 1.8 | 25 | - | |
| 7 | 1.2 SED 3×/week | 3.6 | 25 | - | |
| 8 | 2 SED 3×/week | 6 | 50 | [19,20] | |
| 9 | 3 SED 3×/week | 9 | 75 | [19,21,22] | |
| 10 | 4 SED 3×/week | 12 | 66 * | [2,19,20] | |
| Study | Group | Irradiation Regimen | Median Days to 1st Tumor (Q3–Q1) | Mean Cumulative UVR Dose (SED) at Time Point of Tumor Development (SD) | Pigmentation (AU) at the Time Point of Tumor Development (SD) |
|---|---|---|---|---|---|
| Dose–delivery | 1 | 2 SED 6×/week | 155 (141–183) | 273 (34.1) | 316 (69) |
| 2 | 3 SED 4×/week | 176 (155–183) | 297 (41.2) | 412 (69) | |
| 3 | 4 SED 3×/week | 169 (155–176) | 279 (27.9) | 586 (107) | |
| 4 | 6 SED 2×/week | 169 (169–190) | 303 (52.1) | 658 (153) | |
| Dose–response | 5 | 0 SED | No tumor | No tumor | No pigmentation |
| 6 | 0.6 SED 3×/week | 453 (433–468) | 113 (12.1) | 489 (134) | |
| 7 | 1.2 SED 3×/week | 284 (257–313) | 145 (17.4) | 487 (122) | |
| 8 | 2 SED 3×/week | 206 (191–237) | 182 (23.7) | 428 (124) | |
| 9 | 3 SED 3×/week | 185 (171–199) | 235 (27.7) | 426 (125) | |
| 10 | 4 SED 3×/week | 178 (150–196) | 293 (39.4) | 648 (133) |
© 2017 by the authors. Licensee MDPI, Basel, Switzerland. This article is an open access article distributed under the terms and conditions of the Creative Commons Attribution (CC BY) license (http://creativecommons.org/licenses/by/4.0/).
Share and Cite
Lerche, C.M.; Togsverd-Bo, K.; Philipsen, P.A.; Wulf, H.C. Impact of UVR Exposure Pattern on Squamous Cell Carcinoma-A Dose–Delivery and Dose–Response Study in Pigmented Hairless Mice. Int. J. Mol. Sci. 2017, 18, 2738. https://0-doi-org.brum.beds.ac.uk/10.3390/ijms18122738
Lerche CM, Togsverd-Bo K, Philipsen PA, Wulf HC. Impact of UVR Exposure Pattern on Squamous Cell Carcinoma-A Dose–Delivery and Dose–Response Study in Pigmented Hairless Mice. International Journal of Molecular Sciences. 2017; 18(12):2738. https://0-doi-org.brum.beds.ac.uk/10.3390/ijms18122738
Chicago/Turabian StyleLerche, Catharina M., Katrine Togsverd-Bo, Peter A. Philipsen, and Hans Christian Wulf. 2017. "Impact of UVR Exposure Pattern on Squamous Cell Carcinoma-A Dose–Delivery and Dose–Response Study in Pigmented Hairless Mice" International Journal of Molecular Sciences 18, no. 12: 2738. https://0-doi-org.brum.beds.ac.uk/10.3390/ijms18122738