Deleterious Effect of Advanced CKD on Glyoxalase System Activity not Limited to Diabetes Aetiology

 ,
,
Abstract
:1. Introduction
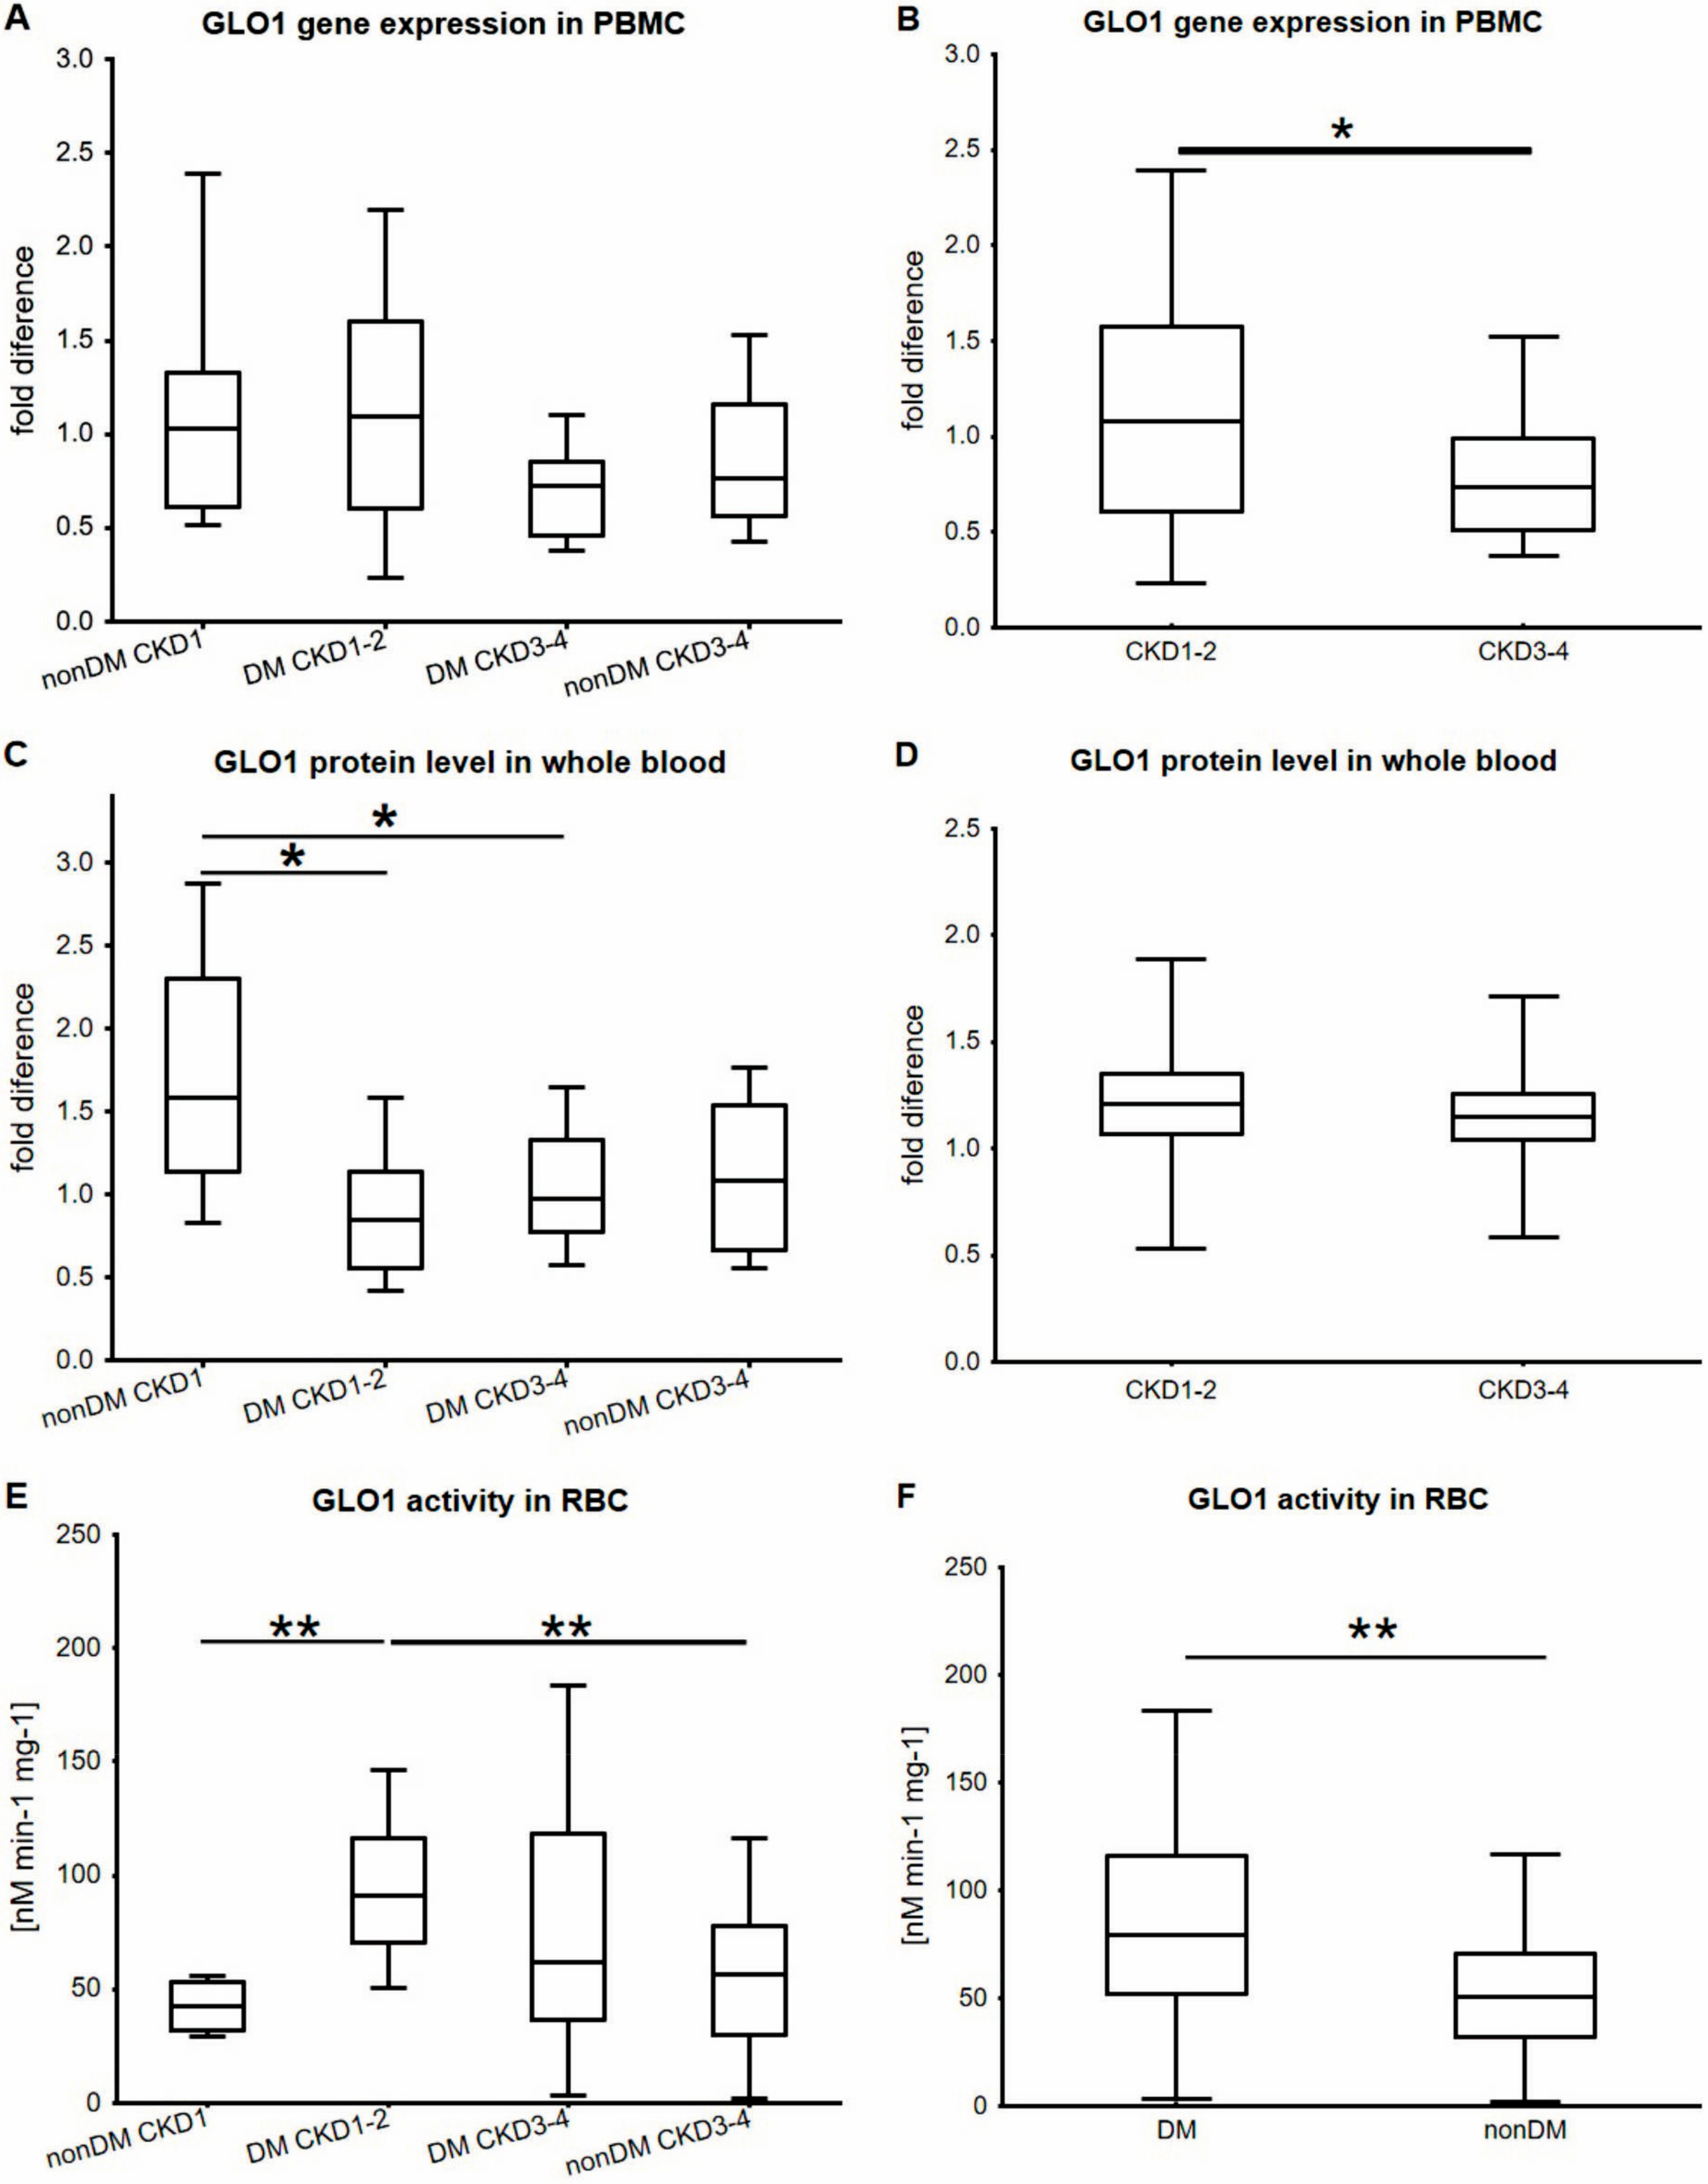
2. Results
3. Discussion
4. Materials and Methods
4.1. Human Study—Subjects, Study Design, and Criteria
4.2. Blood Samples—Pre-Analytical Processing
4.3. Glyoxalase 1 (GLO1) Activity Measurement
4.4. Gene Expression Analysis
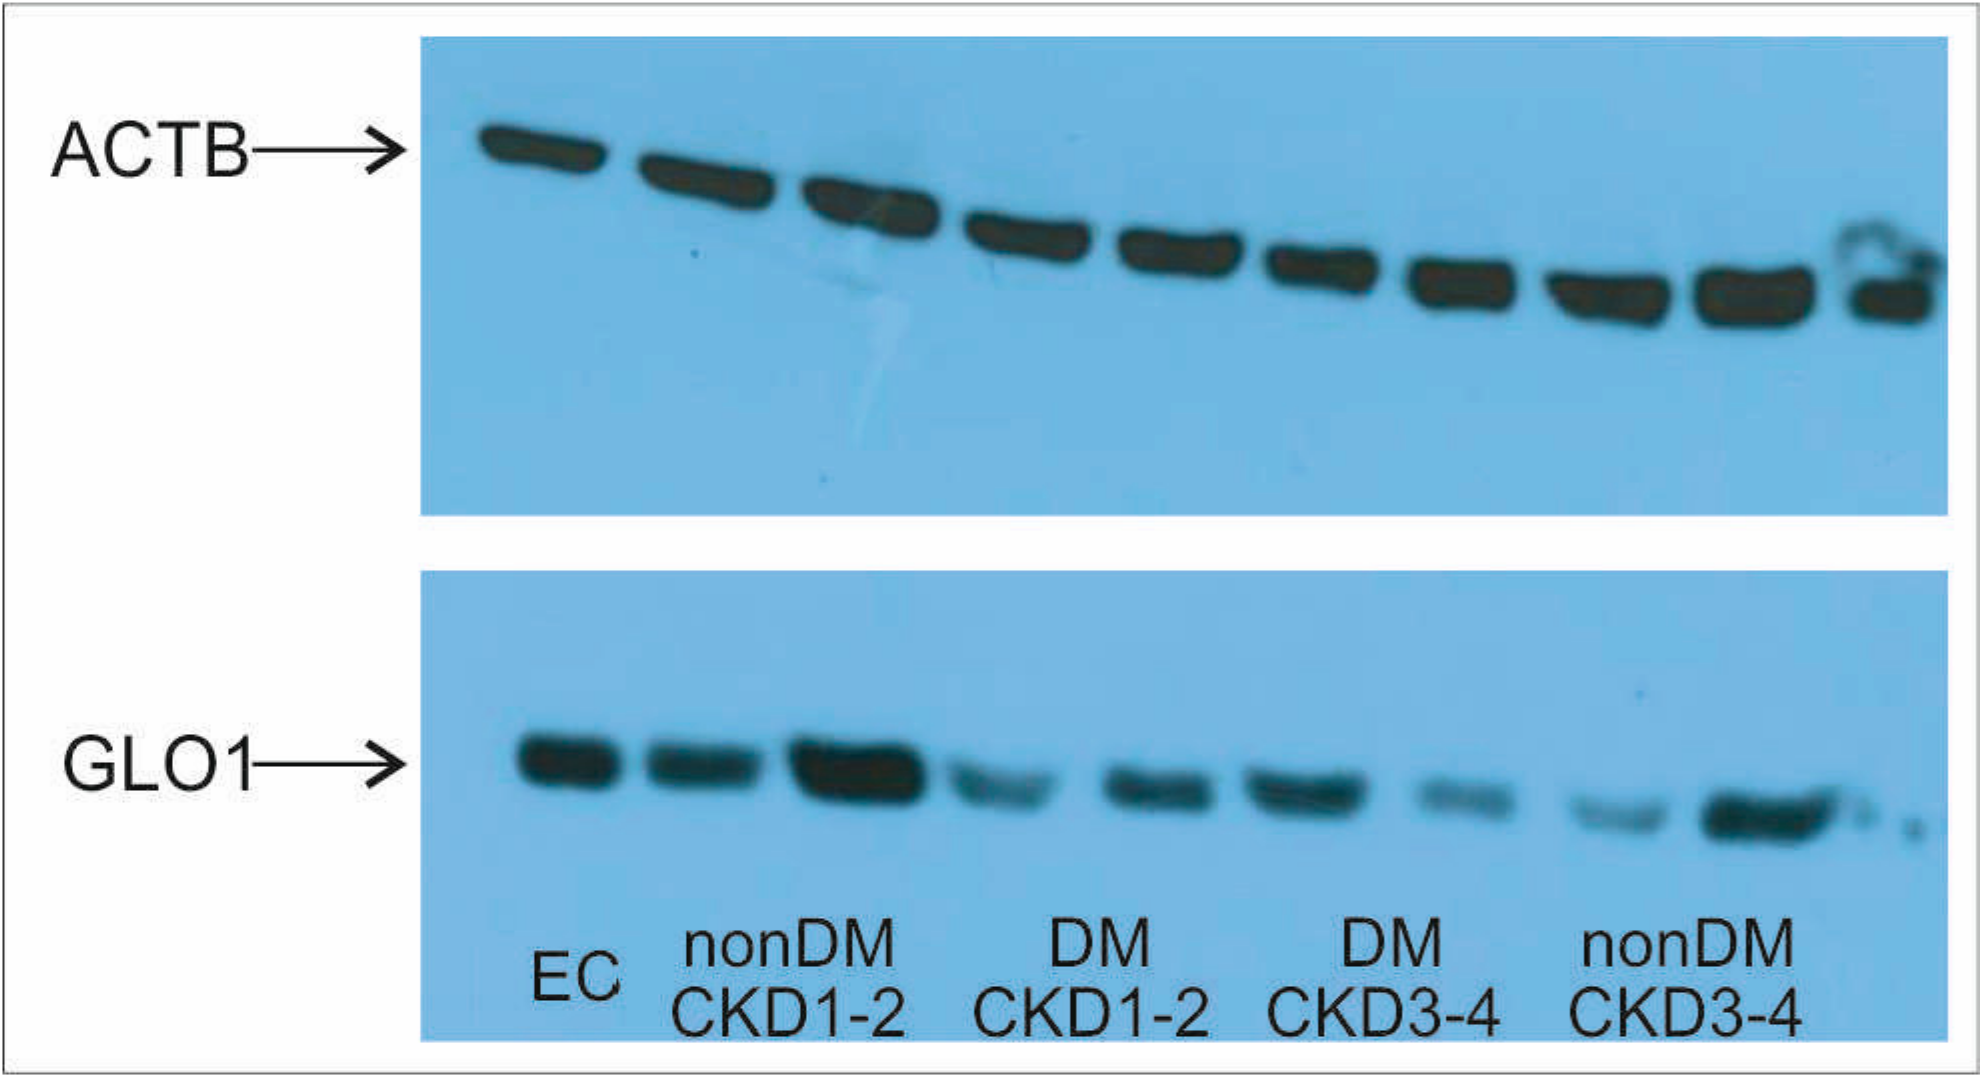
4.5. Protein Isolation and Western Blotting
4.6. Statistical Analysis
Author Contributions
Acknowledgments
Conflicts of Interest
Abbreviations
| AGE | Advanced Glycation End Product |
| CKD | Chronic Kidney Disease |
| DM | Diabetes Mellitus |
| DKD | Diabetic Kidney Disease |
| GFR | Glomerular Filtration Rate |
| GLO1 | Glyoxalase 1 |
| HbA1c | Glycated Haemoglobin |
| MGO | Methylglyoxal |
| PBMC | Peripheral Blood Mononuclear Cell |
| PPP | Pentose Phosphate Pathway |
| RBC | Red Blood Cell |
| T2DM | Type 2 Diabetes Mellitus |
References
- Phillips, S.A.; Thornalley, P.J. The formation of methylglyoxal from triose phosphates. Investigation using a specific assay for methylglyoxal. Eur. J. Biochem. 1993, 212, 101–105. [Google Scholar] [CrossRef] [PubMed]
- Rabbani, N.; Thornalley, P.J. Methylglyoxal, glyoxalase 1 and the dicarbonyl proteome. Amino Acids 2012, 42, 1133–1142. [Google Scholar] [CrossRef] [PubMed]
- Rabbani, N.; Thornalley, P.J. Dicarbonyl stress in cell and tissue dysfunction contributing to ageing and disease. Biochem. Biophys. Res. Commun. 2015, 458, 221–226. [Google Scholar] [CrossRef] [PubMed]
- Nigro, C.; Leone, A.; Raciti, G.A.; Longo, M.; Mirra, P.; Formisano, P.; Beguinot, F.; Miele, C. Methylglyoxal-glyoxalase 1 balance: The root of vascular damage. Int. J. Mol. Sci. 2017, 18, 188. [Google Scholar] [CrossRef] [PubMed]
- Rabbani, N.; Thornalley, P.J. The critical role of methylglyoxal and glyoxalase 1 in diabetic nephropathy. Diabetes 2014, 63, 50–52. [Google Scholar] [CrossRef] [PubMed]
- Rabbani, N.; Thornalley, P.J. Glyoxalase 1 modulation in obesity and diabetes. Antioxid. Redox Signal. 2018. [Google Scholar] [CrossRef] [PubMed]
- Giacco, F.; Du, X.; D’Agati, V.D.; Milne, R.; Sui, G.; Geoffrion, M.; Brownlee, M. Knockdown of glyoxalase 1 mimics diabetic nephropathy in nondiabetic mice. Diabetes 2014, 63, 291–299. [Google Scholar] [CrossRef] [PubMed]
- Inagi, R. Glycative stress and glyoxalase in kidney disease and aging. Biochem. Soc. Trans. 2014, 42, 457–460. [Google Scholar] [CrossRef] [PubMed]
- McLellan, A.C.; Thornalley, P.J.; Benn, J.; Sonksen, P.H. Glyoxalase system in clinical diabetes mellitus and correlation with diabetic complications. Clin. Sci. (Lond.) 1994, 87, 21–29. [Google Scholar] [CrossRef] [PubMed]
- Kumagai, T.; Nangaku, M.; Kojima, I.; Nagai, R.; Ingelfinger, J.R.; Miyata, T.; Fujita, T.; Inagi, R. Glyoxalase I overexpression ameliorates renal ischemia-reperfusion injury in rats. Am. J. Physiol. Ren. Physiol. 2009, 296, F912–F921. [Google Scholar] [CrossRef] [PubMed]
- Brouwers, O.; Niessen, P.M.; Ferreira, I.; Miyata, T.; Scheffer, P.G.; Teerlink, T.; Schrauwen, P.; Brownlee, M.; Stehouwer, C.D.; Schalkwijk, C.G. Overexpression of glyoxalase-I reduces hyperglycemia-induced levels of advanced glycation end products and oxidative stress in diabetic rats. J. Biol. Chem. 2011, 286, 1374–1380. [Google Scholar] [CrossRef] [PubMed] [Green Version]
- Kim, K.M.; Kim, Y.S.; Jung, D.H.; Lee, J.; Kim, J.S. Increased glyoxalase I levels inhibit accumulation of oxidative stress and an advanced glycation end product in mouse mesangial cells cultured in high glucose. Exp. Cell Res. 2012, 318, 152–159. [Google Scholar] [CrossRef] [PubMed]
- Harjutsalo, V.; Groop, P.H. Epidemiology and risk factors for diabetic kidney disease. Adv. Chronic Kidney Dis. 2014, 21, 260–266. [Google Scholar] [CrossRef] [PubMed]
- Kronenberg, F. Emerging risk factors and markers of chronic kidney disease progression. Nat. Rev. Nephrol. 2009, 5, 677–689. [Google Scholar] [CrossRef] [PubMed]
- Brouwers, O.; Niessen, P.M.; Miyata, T.; Østergaard, J.A.; Flyvbjerg, A.; Peutz-Kootstra, C.J.; Sieber, J.; Mundel, P.H.; Brownlee, M.; Janssen, B.J.; et al. Glyoxalase-1 overexpression reduces endothelial dysfunction and attenuates early renal impairment in a rat model of diabetes. Diabetologia 2014, 57, 224–235. [Google Scholar] [CrossRef] [PubMed]
- Tikellis, C.; Pickering, R.J.; Tsorotes, D.; Huet, O.; Cooper, M.E.; Jandeleit-Dahm, K.; Thomas, M.C. Dicarbonyl stress in the absence of hyperglycemia increases endothelial inflammation and atherogenesis similar to that observed in diabetes. Diabetes 2014, 63, 3915–3925. [Google Scholar] [CrossRef] [PubMed]
- Chalásová, K.; Pácal, L.; Pleskačová, A.; Knopfová, L.; Řehořová, J.; Tomandlová, M.; Tomandl, J.; Kaňková, K. Transketolase activity but not thiamine membrane transport change in response to hyperglycaemia and kidney dysfunction. Exp. Clin. Endocrinol. Diabetes 2018, 126, 255–262. [Google Scholar] [CrossRef] [PubMed]
- Pacal, L.; Tomandl, J.; Svojanovsky, J.; Krusova, D.; Stepankova, S.; Rehorova, J.; Olsovsky, J.; Belobradkova, J.; Tanhaeuserova, V.; Tomandlova, M.; et al. Role of thiamine status and genetic variability in transketolase and other pentose phosphate cycle enzymes in the progression of diabetic nephropathy. Nephrol. Dialysis Transplant. 2011, 26, 1229–1236. [Google Scholar] [CrossRef] [PubMed]
- Miyata, T.; van Ypersele de Strihou, C.; Imasawa, T.; Yoshino, A.; Ueda, Y.; Ogura, H.; Kominami, K.; Onogi, H.; Inagi, R.; Nangaku, M.; et al. Glyoxalase I deficiency is associated with an unusual level of advanced glycation end products in a hemodialysis patient. Kidney Int. 2001, 60, 2351–2359. [Google Scholar] [CrossRef] [PubMed]
- Nakayama, K.; Nakayama, M.; Iwabuchi, M.; Terawaki, H.; Sato, T.; Kohno, M.; Ito, S. Plasma α-oxoaldehyde levels in diabetic and nondiabetic chronic kidney disease patients. Am. J. Nephrol. 2008, 28, 871–878. [Google Scholar] [CrossRef] [PubMed]
- Nemet, I.; Turk, Z.; Duvnjak, L.; Car, N.; Varga-Defterdarović, L. Humoral methylglyoxal level reflects glycemic fluctuation. Clin. Biochem. 2005, 38, 379–383. [Google Scholar] [CrossRef] [PubMed]
- Rabbani, N.; Thornalley, P.J. Advanced glycation end products in the pathogenesis of chronic kidney disease. Kidney Int. 2018, 93, 803–813. [Google Scholar] [CrossRef] [PubMed]
- McLellan, A.C.; Thornalley, P.J. Glyoxalase activity in human red blood cells fractioned by age. Mech. Ageing Dev. 1989, 48, 63–71. [Google Scholar] [CrossRef]
- Taylor, S.C.; Posch, A. The design of a quantitative western blot experiment. Biomed. Res. Int. 2014, 2014, 361590. [Google Scholar] [CrossRef] [PubMed]


| Parameter | Non-DM CKD1 | T2DM CKD1-2 | T2DM CKD3-4 | Non-DM CKD3-4 | p |
|---|---|---|---|---|---|
| (n = 11) | (n = 24) | (n = 35) | (n = 13) | ||
| Age (years) | 65.0 (52.0–77.0) | 64.5 (60.5–67.0) | 67.5 (64.0–75.0) | 53.0 (31.0–67.0) | <0.01 |
| HbA1c (mmol/mol) | --- | 57.0 (49.5–68.0) | 57.0 (50.0–73.5) | --- | NS |
| DM duration (years) | --- | 13.5 (11.5–16.5) | 17.0 (10.0–25.0) | --- | NS |
| Creatinine (µmol/L) | 70.8 (49.0–86.0) | 85.5 (75.5–103.0) | 199.5 (160.0–250.0) | 212.0 (140.0–371.0) | <0.01 |
| GFR (mL/s) | 1.82 (1.16–1.87) | 0.55 (0.38–0.78) | 0.51 (0.34–0.79) | <0.01 | |
| Glucose (mmol/L) | 5.15 (4.5–5.25) | 6.95 (5.8–8.5) | 8.3 (6.0–11.6) | 5.0 (4.3–5.5) | <0.01 |
| CKD-EPI (mL/s/1.73 m2) | --- | 1.2 (0.99–1.45) | 0.46 (0.3–0.57) | 0.36 (0.23–0.63) | <0.01 |
| GLO1 activity (nmol/min/mg) | 42.3 (31.85–53.2) | 90.9 (70.7–116.1) | 62.0 (36.4–118.3) | 56.7 (30.1–77.75) | <0.01 |
© 2018 by the authors. Licensee MDPI, Basel, Switzerland. This article is an open access article distributed under the terms and conditions of the Creative Commons Attribution (CC BY) license (http://creativecommons.org/licenses/by/4.0/).
Share and Cite
Pácal, L.; Chalásová, K.; Pleskačová, A.; Řehořová, J.; Tomandl, J.; Kaňková, K. Deleterious Effect of Advanced CKD on Glyoxalase System Activity not Limited to Diabetes Aetiology. Int. J. Mol. Sci. 2018, 19, 1517. https://0-doi-org.brum.beds.ac.uk/10.3390/ijms19051517
Pácal L, Chalásová K, Pleskačová A, Řehořová J, Tomandl J, Kaňková K. Deleterious Effect of Advanced CKD on Glyoxalase System Activity not Limited to Diabetes Aetiology. International Journal of Molecular Sciences. 2018; 19(5):1517. https://0-doi-org.brum.beds.ac.uk/10.3390/ijms19051517
Chicago/Turabian StylePácal, Lukáš, Katarína Chalásová, Anna Pleskačová, Jitka Řehořová, Josef Tomandl, and Kateřina Kaňková. 2018. "Deleterious Effect of Advanced CKD on Glyoxalase System Activity not Limited to Diabetes Aetiology" International Journal of Molecular Sciences 19, no. 5: 1517. https://0-doi-org.brum.beds.ac.uk/10.3390/ijms19051517