Article

RBM4a-SRSF3-MAP4K4 Splicing Cascade Constitutes a Molecular Mechanism for Regulating Brown Adipogenesis

1
School of Medical Laboratory Science and Biotechnology, College of Medical Science and Technology, Taipei Medical University, Taipei 110, Taiwan
2
Ph.D. Program in Medicine Biotechnology, College of Medical Science and Technology, Taipei Medical University, Taipei 110, Taiwan
3
Immunology Research Center, National Health Research Institutes, Zhunan 35053, Taiwan
4
School of Chinese Medicine, China Medical University, Taichung 40402, Taiwan
*
Author to whom correspondence should be addressed.
Int. J. Mol. Sci. 2018, 19(9), 2646; https://0-doi-org.brum.beds.ac.uk/10.3390/ijms19092646
Submission received: 7 August 2018 / Revised: 24 August 2018 / Accepted: 4 September 2018 / Published: 6 September 2018
(This article belongs to the Special Issue Nutrition, Brown and White Adipose Tissue)

Abstract

:
An increase in mitogen-activated protein kinase kinase kinase kinase 4 (MAP4K4) reportedly attenuates insulin-mediated signaling which participates in the development of brown adipose tissues (BATs). Nevertheless, the effect of MAP4K4 on brown adipogenesis remains largely uncharacterized. In this study, results of a transcriptome analysis (also referred as RNA-sequencing) showed differential expressions of MAP4K4 or SRSF3 transcripts isolated from distinct stages of embryonic BATs. The discriminative splicing profiles of MAP4K4 or SRSF3 were noted as well in brown adipocytes (BAs) with RNA-binding motif protein 4-knockout (RBM4−/−) compared to the wild-type counterparts. Moreover, the relatively high expressions of authentic SRSF3 transcripts encoding the splicing factor functioned as a novel regulator toward MAP4K4 splicing during brown adipogenesis. The presence of alternatively spliced MAP4K4 variants exerted differential effects on the phosphorylation of c-Jun N-terminal protein kinase (JNK) which was correlated with the differentiation or metabolic signature of BAs. Collectively, the RBM4-SRSF3-MAP4K4 splicing cascade constitutes a novel molecular mechanism in manipulating the development of BAs through related signaling pathways.

1. Introduction

Adipose tissues are known to preserve food-derived lipids as excess energy and function as an endocrine organ for energy homeostasis by secreting related hormones [1]. Dysfunction of the physiological roles of adipose tissues occurs with an expanded mass of white adipocytes (WAs) that subsequently induce human obesity [2]. In contrast, brown adipocytes (BAs) were discovered to execute non-shivering thermogenesis by dissipating stored lipid droplets in small rodents and infants [3]. Several studies revealed the impact of cold exposure and exercise on inducing white-to-brown shift within white adipose tissues (WATs) [4,5]. Therefore, BAs are considered a potential target for combating human obesity and related diseases [6]. Lineage tracing analyses indicated the existence of Myf5-positive progenitors for the development of myocytes and BAs [7]. Regulatory factors that participate in the differentiation of distinct adipocytes were uncovered using transcriptome analyses, but the post-transcriptional regulation involved in the developmental process of BAs is still largely being debated.
Alternative splicing (AS) functions as a post-transcriptional mechanism involved in expanding the diversity or manipulating the expression profiles of mammalian genomes [8]. Cellular process and corresponding function is specified by accurately executing AS events in a spatiotemporal manner, whereas imbalanced splicing regulation acts as a pathogenic cause toward cellular defects and diseases [9,10]. The interplay between trans-factors, such as the serine/arginine splicing factor (SRSF) and the heterogeneous ribonucleoprotein (hnRNP) protein, and corresponding elements constituting the regulatory mechanism involved in determining accurate splicing profiles [11,12]. Development of transcriptome analyses brought a comprehensive insight into tissue- and stage-specific AS profiles in the genome-wide era [13]. Results of transcriptome analyses revealed several BA-related splicing events, such as insulin receptor and serine/arginine protein kinase 1 in our previous studies, which participated in manipulating differentiation and the physiological function of brown adipose tissues (BATs) [14,15,16].
Results of transcriptome analyses indicated a shift in splicing profiles of SRSF3 (previously referred to as SRp20) and mitogen-activated protein 4 kinase 4 (MAP4K4) during brown adipogenesis in this report. Moreover, altered splicing patterns of SRSF3 and MAP4K4 transcripts were noted in RNA-binding motif protein 4a (RBM4a)-depleted BATs. The sequence-specific mechanism that participates in programming splicing profiles of the SRSF3-MAP4K4 splicing cascade was further characterized. Temporal expressions of MAP4K4 variants exhibited discriminative impacts on expressions of BA-specific factors and the mitochondrial activity of BA-like cells through manipulating the activity of c-Jun N-terminal kinase (JNK) signaling. Those results disclosed the impacts of a novel splicing cascade involved in BA development.

2. Results

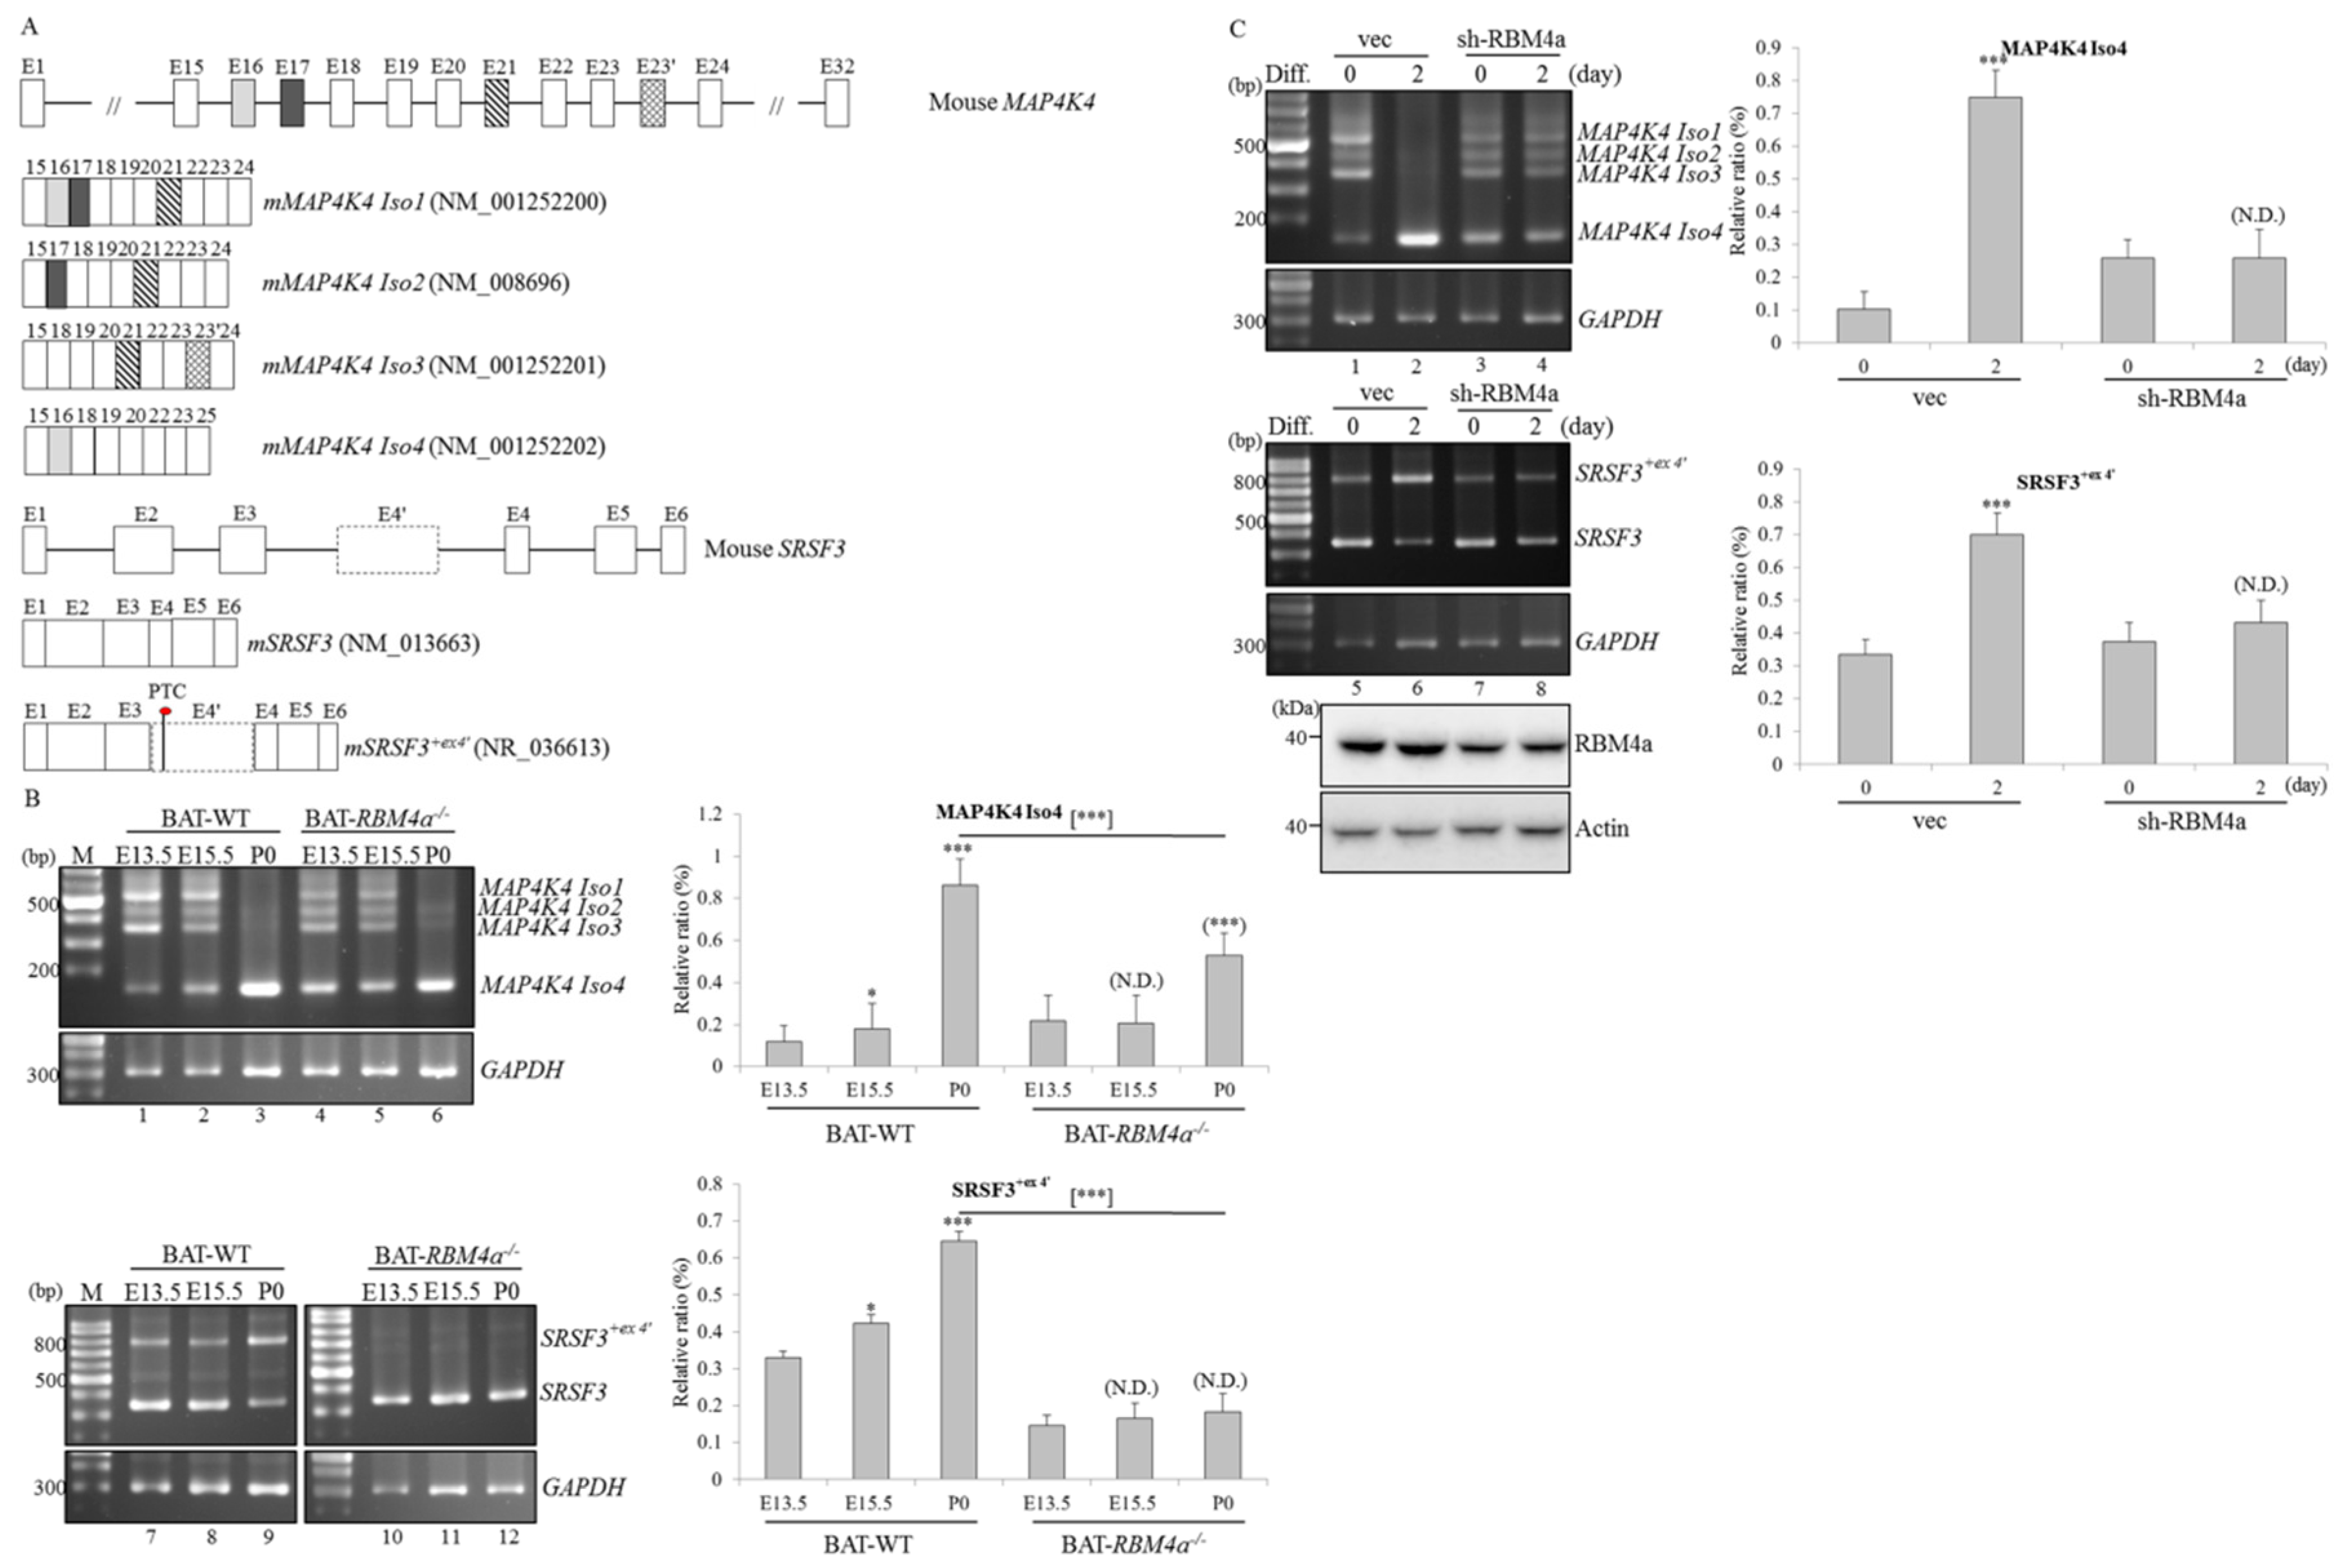
2.1. Transcriptome Analyses Reveal Differential Expressions and Splicing Profiles of MAP4K4 and SRSF3 in Differentiating and RBM4a−/− BAs

In our previous study, results of transcriptome analyses disclosed discriminative splicing profiles of 186 genes from a total of 13,217 splicing events in postnatal RBM4a−/− BATs compared to wild-type (WT) BATs [15]. Among those candidates, the splicing profiles of mitogen-activated protein kinase kinase kinase kinase 4 (MAP4K4) and SRSF3 transcripts were altered after ablation of endogenous RBM4a in postnatal BATs. As shown in Table 1, MAP4K4 isoforms 3 and 4 are major transcripts expressed by postnatal BATs (Table 1A; fragments per kilobase of transcript per million mapped reads (FPKM) = 15.15 and 14.76, respectively), whereas MAP4K4 isoforms (Iso) 1 and 3 were mainly transcribed in embryonic BATs (Table 1A; FPKM = 42.23 and 32.43, respectively). In contrast, depletion of RBM4a mediated a drastic shift in MAP4K4 Iso 3 to Iso 2 (Table 1A, FPKM = 20.32) in embryonic BATs, and reduced expression of MAP4K4 Iso 4 was noted in postnatal RBM4a−/− BATs (Table 1A, FPKM = 5.64) compared to the WT counterparts. Relatively high expressions of total MAP4K4 transcripts were observed in embryonic and postnatal WT BATs (Table 1A, lower, FPKM = 32.8794 and 71.2371, respectively) compared to RBM4a−/− BATs (Table 1A, lower, FPKM = 17.3019 and 30.2237, respectively). Moreover, results of transcriptome assays showed an increase in the relative level of the non-coding SRSF3 transcript (NR_036613) in postnatal WT BATs compared to that of embryonic WT BATs (Table 1B, PII = 53.68% and 13.91%, respectively), whereas expressions of the coding SRSF3 transcript (NM_013663) was elevated in embryonic and postnatal RBM4a−/− BATs (Table 1B, FPKM = 213.5991 and 54.33154, respectively) compared to those of the WT counterparts (Table 1B, FPKM = 108.2105 and 10.98038, respectively). These results disclosed the reprogrammed expression and splicing profiles of MAP4K4 and SRSF3 throughout brown adipogenesis, which is relevant to the abundance of RBM4a.

2.2. Splicing and Expression Profiles of MAP4K4 and SRSF3 Transcripts are Reprogrammed Throughout BAT Development

The reviewed sequences indicated that the MAP4K4 gene generated four transcripts by alternatively selecting exons 16, 17, 21, and 24 (Figure 1A, upper). Retention of SRSF3 intron 3 (also referred to as exon 4′) resulted in the generation of premature termination codon-containing transcripts which were considered to be candidates of the nonsense-mediated decay pathway (Figure 1A, lower) [16]. As shown in Figure 1B, results of the RT-PCR showed that the majority of MAP4K4 transcripts were Iso 1 and 2 generated in embryonic (E)13.5 and E15.5 BATs (Figure 1B, lanes 1 and 2), whereas predominant expression of MAP4K4 Iso 4 was noted in postnatal (P0) BATs isolated from WT mice (Figure 1B, lane 3). In contrast, postnatal RBM4a−/− BATs exhibited a relatively low level of MAP4K4 Iso 4 (Figure 1B, lane 6, PII = 52.82%) compared to that of postnatal WT BATs (Figure 1B, lane 3, PII = 86.38%). RT-PCR results showed a gradual increase in relative levels of SRSF3+ex4′ transcripts in postnatal WT BATs compared to those of embryonic BATs (Figure 1B, lanes 7–9). Nevertheless, splicing profiles of SRSF3 continued to be sustained throughout the development of RBM4a/ BATs (Figure 1B, lanes 10–12). The reprogramming of MAP4K4 and SRSF3 transcripts was consistently represented using an in vitro cell model. As shown in Figure 1C, splicing profiles of the MAP4K4 and SRSF3 transcripts respectively shifted to MAP4K4 Iso 4 and SRSF3+ex4′ transcripts in the presence of the differentiating cocktail (Figure 1C, lanes 2 and 6) compared to those of C3H10T1/2 cells cultured in growth medium (Figure 1C, lanes 1 and 5). In contrast, splicing profiles of MAP4K4 and SRSF3 transcripts in RBM4a-depleted cells showed no response to the presence of the differentiating cocktail (Figure 1C, lanes 4 and 8) compared to those of non-differentiated cells (Figure 1C, lanes 3 and 7). These results suggested a potential link between RBM4a abundance and splicing profiles of the MAP4K4 and SRSF3 transcripts throughout brown adipogenesis.

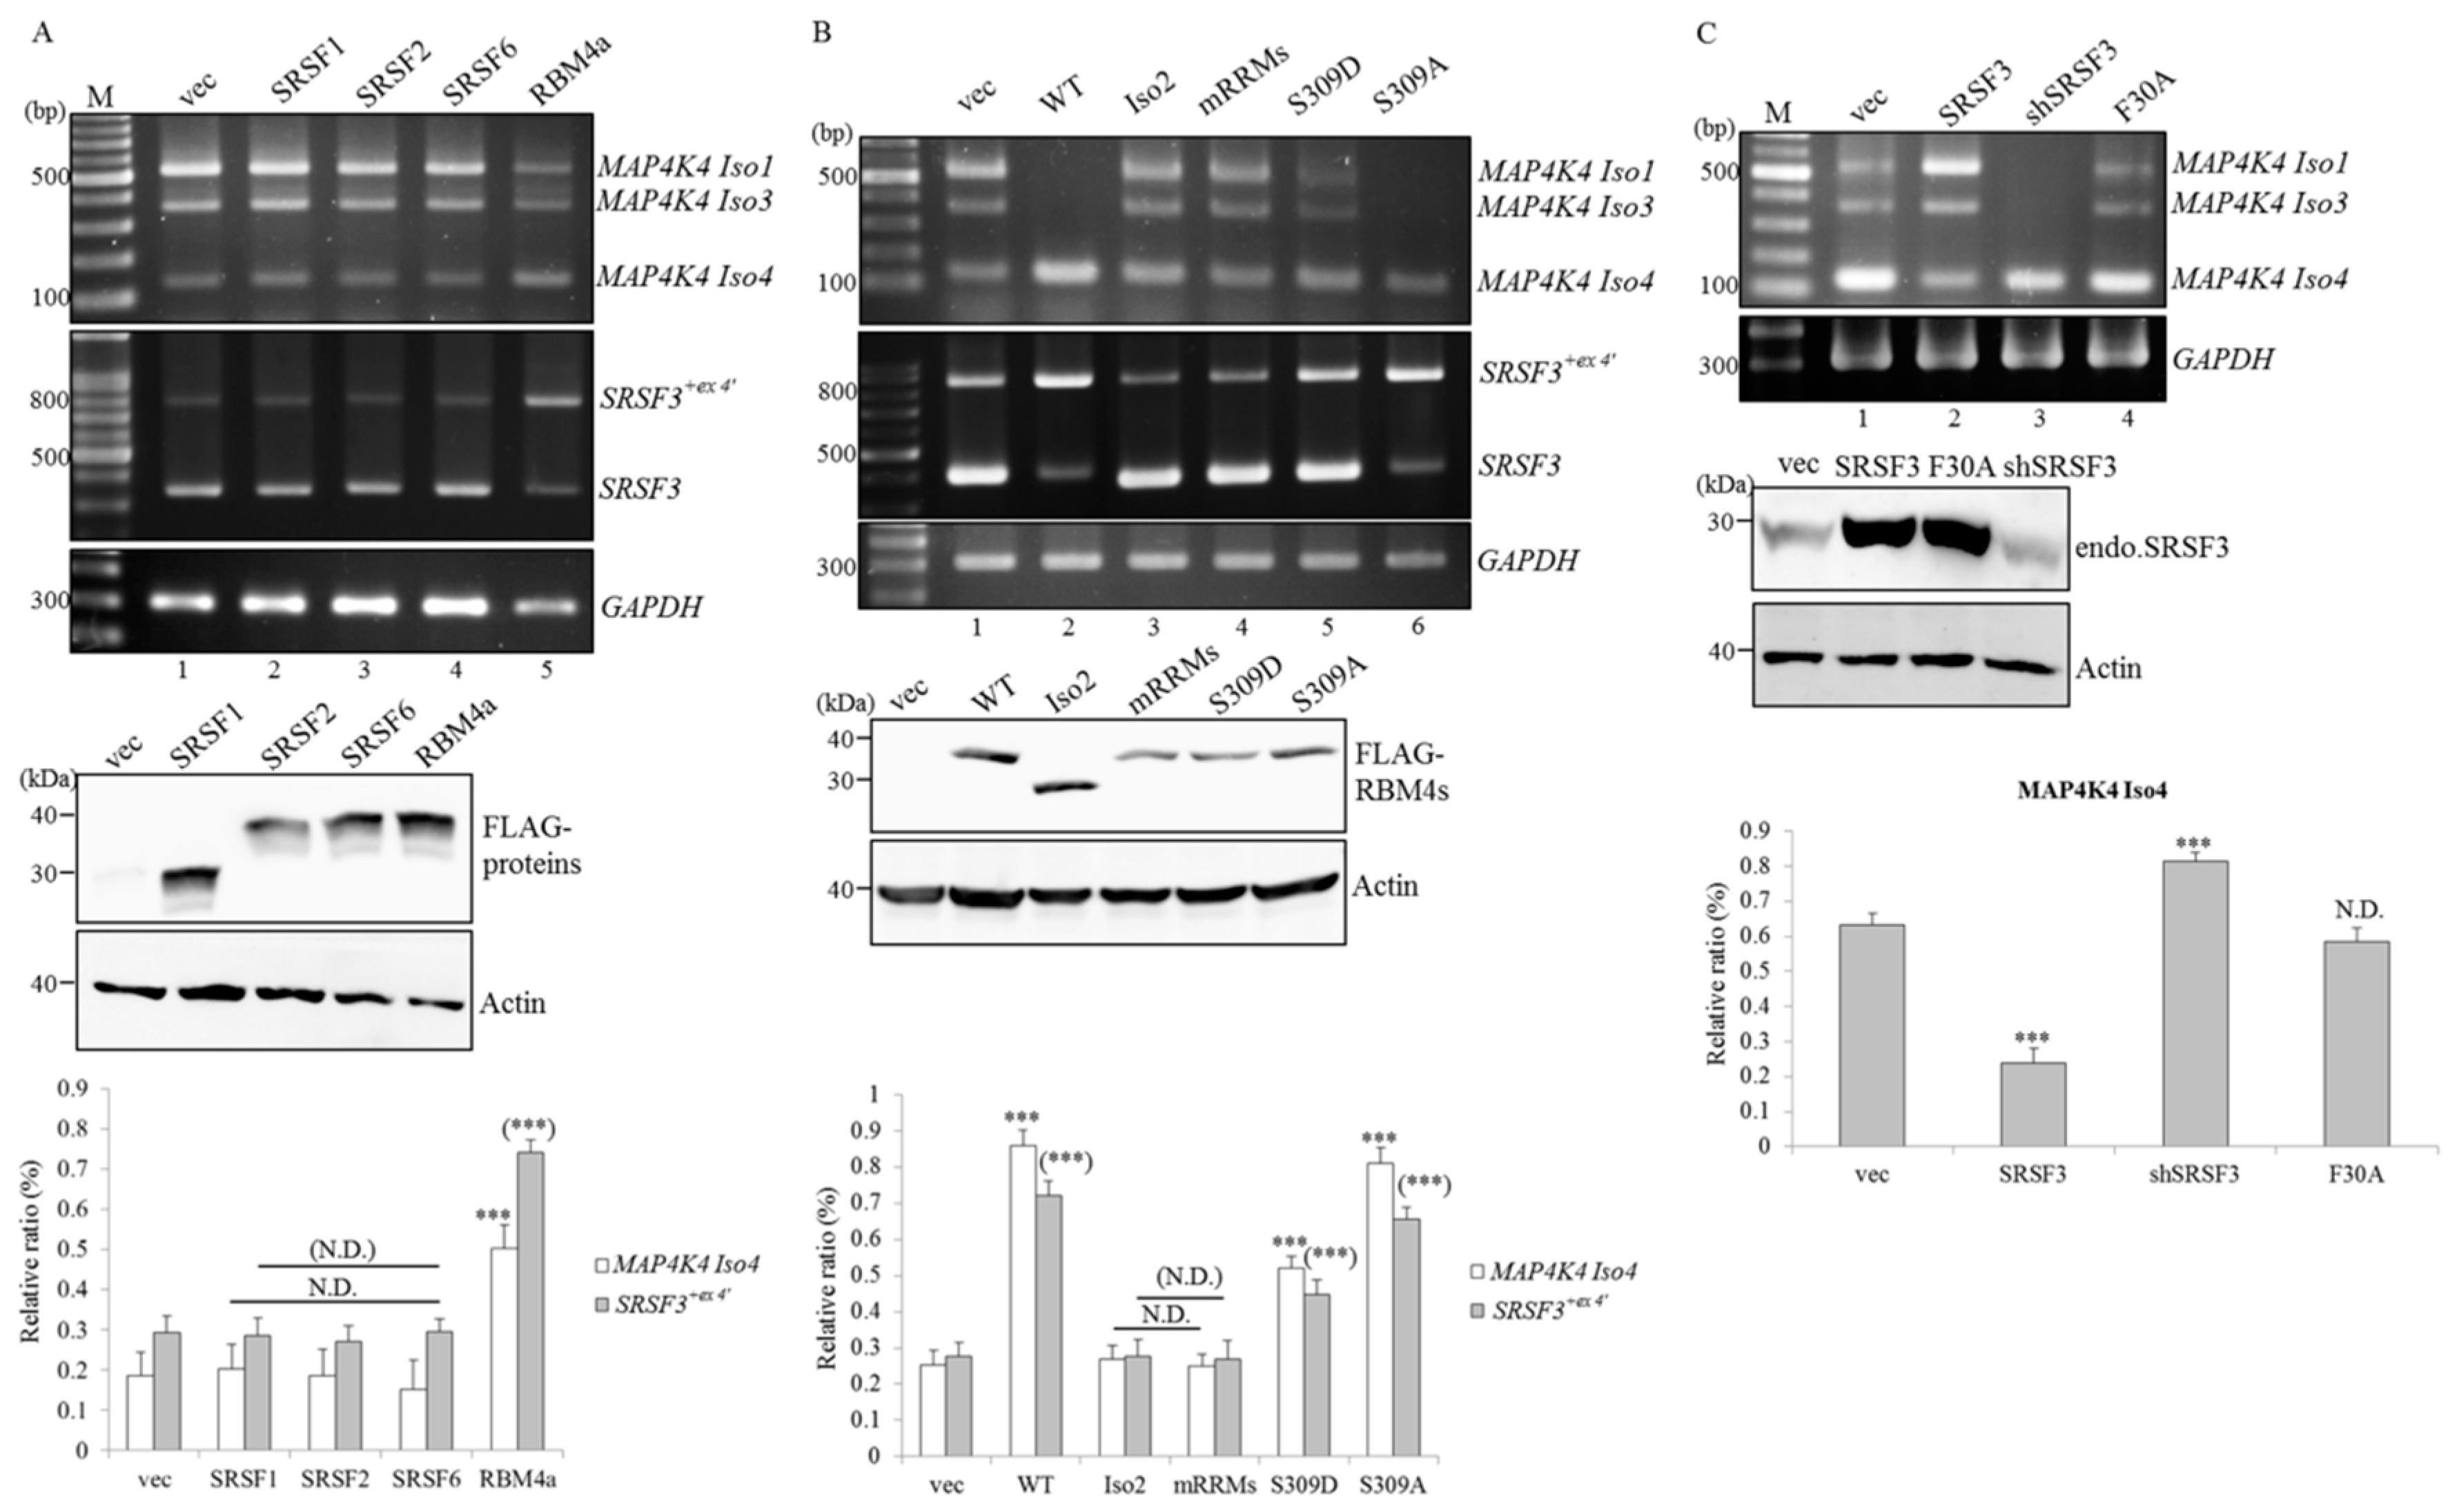
2.3. RBM4a Exerts a Specific Influence on Modulating Splicing Profiles of MAP4K4 and SRSF3 Transcripts

Results of Spearman’s correlation test verified respective coefficients of 0.68 and 0.63 by comparing increases in relative levels of MAP4K4 Iso 4 and SRSF3+ex4′ transcripts and the upregulated RBM4a protein throughout the development of WT BATs (n = 4; p = 0.0207 and 0.0334, respectively). An in vitro cell model was next applied to validate impacts of RBM4a on splicing profiles of endogenous MAP4K4 and SRSF3. Results of RT-PCR assays showed that overexpression of RBM4a led to increases in the relative levels of MAP4K4 Iso 4 and SRSF3+ex4′ (Figure 2A, lane 5) compared to empty-vector transfectants (Figure 2A, lane 1). Splicing profiles of MAP4K4 and SRSF3 showed no responses to the overexpression of other SRSF family members (Figure 2A, lanes 2–4). The presence of overexpressed RBM4a Iso 2 and the engineered RBM4a mutant containing four amino acid substitutions (Y37A, F39A, Y113A, and F115A) within two RNA recognition motifs exerted no effect on altering splicing profiles of MAP4K4 and SRSF3 transcripts (Figure 2B, lanes 3 and 4) compared to that of empty-vector transfectants (Figure 2B, lane 1). The serine-to-aspartate (S309D) substitution partially interfered with the influence of derived RBM4a mutant on yields of MAP4K4 Iso 4 and SRSF3+ex4′ transcripts (Figure 2B, lane 5), whereas the derived RBM4a S309A mutant exhibited similar effects of enhancing levels of MAP4K4 Iso 4 and SRSF3+ex4′ transcripts (Figure 2B, lane 6) compared to overexpressed RBM4a. In contrast, RT-PCR results showed that overexpression of SRSF3 resulted in a decrease in the relative level of MAP4K4 Iso 4 (Figure 2C, lane 2, PII = 23.96%), whereas ablation of endogenous SRSF3 had a similar effect as that of overexpressed RBM4a on enhancing yields of MAP4K4 Iso 4 (Figure 2C, lane 3, PII = 81.47%) compared to empty-vector transfectants (Figure 2C, lane 1, PII = 63.27%). Nevertheless, the presence of the derived SRSF3 mutant harboring amino acid substitution (F30A) within the RNA recognition motif exhibited no effect on splicing profiles of MAP4K4 transcripts (Figure 2C, lane 4, PII = 58.46%). These results suggested that RBM4a, SRSF3, and MAP4K4 constituted an alternative splicing circuit during brown adipogenesis.

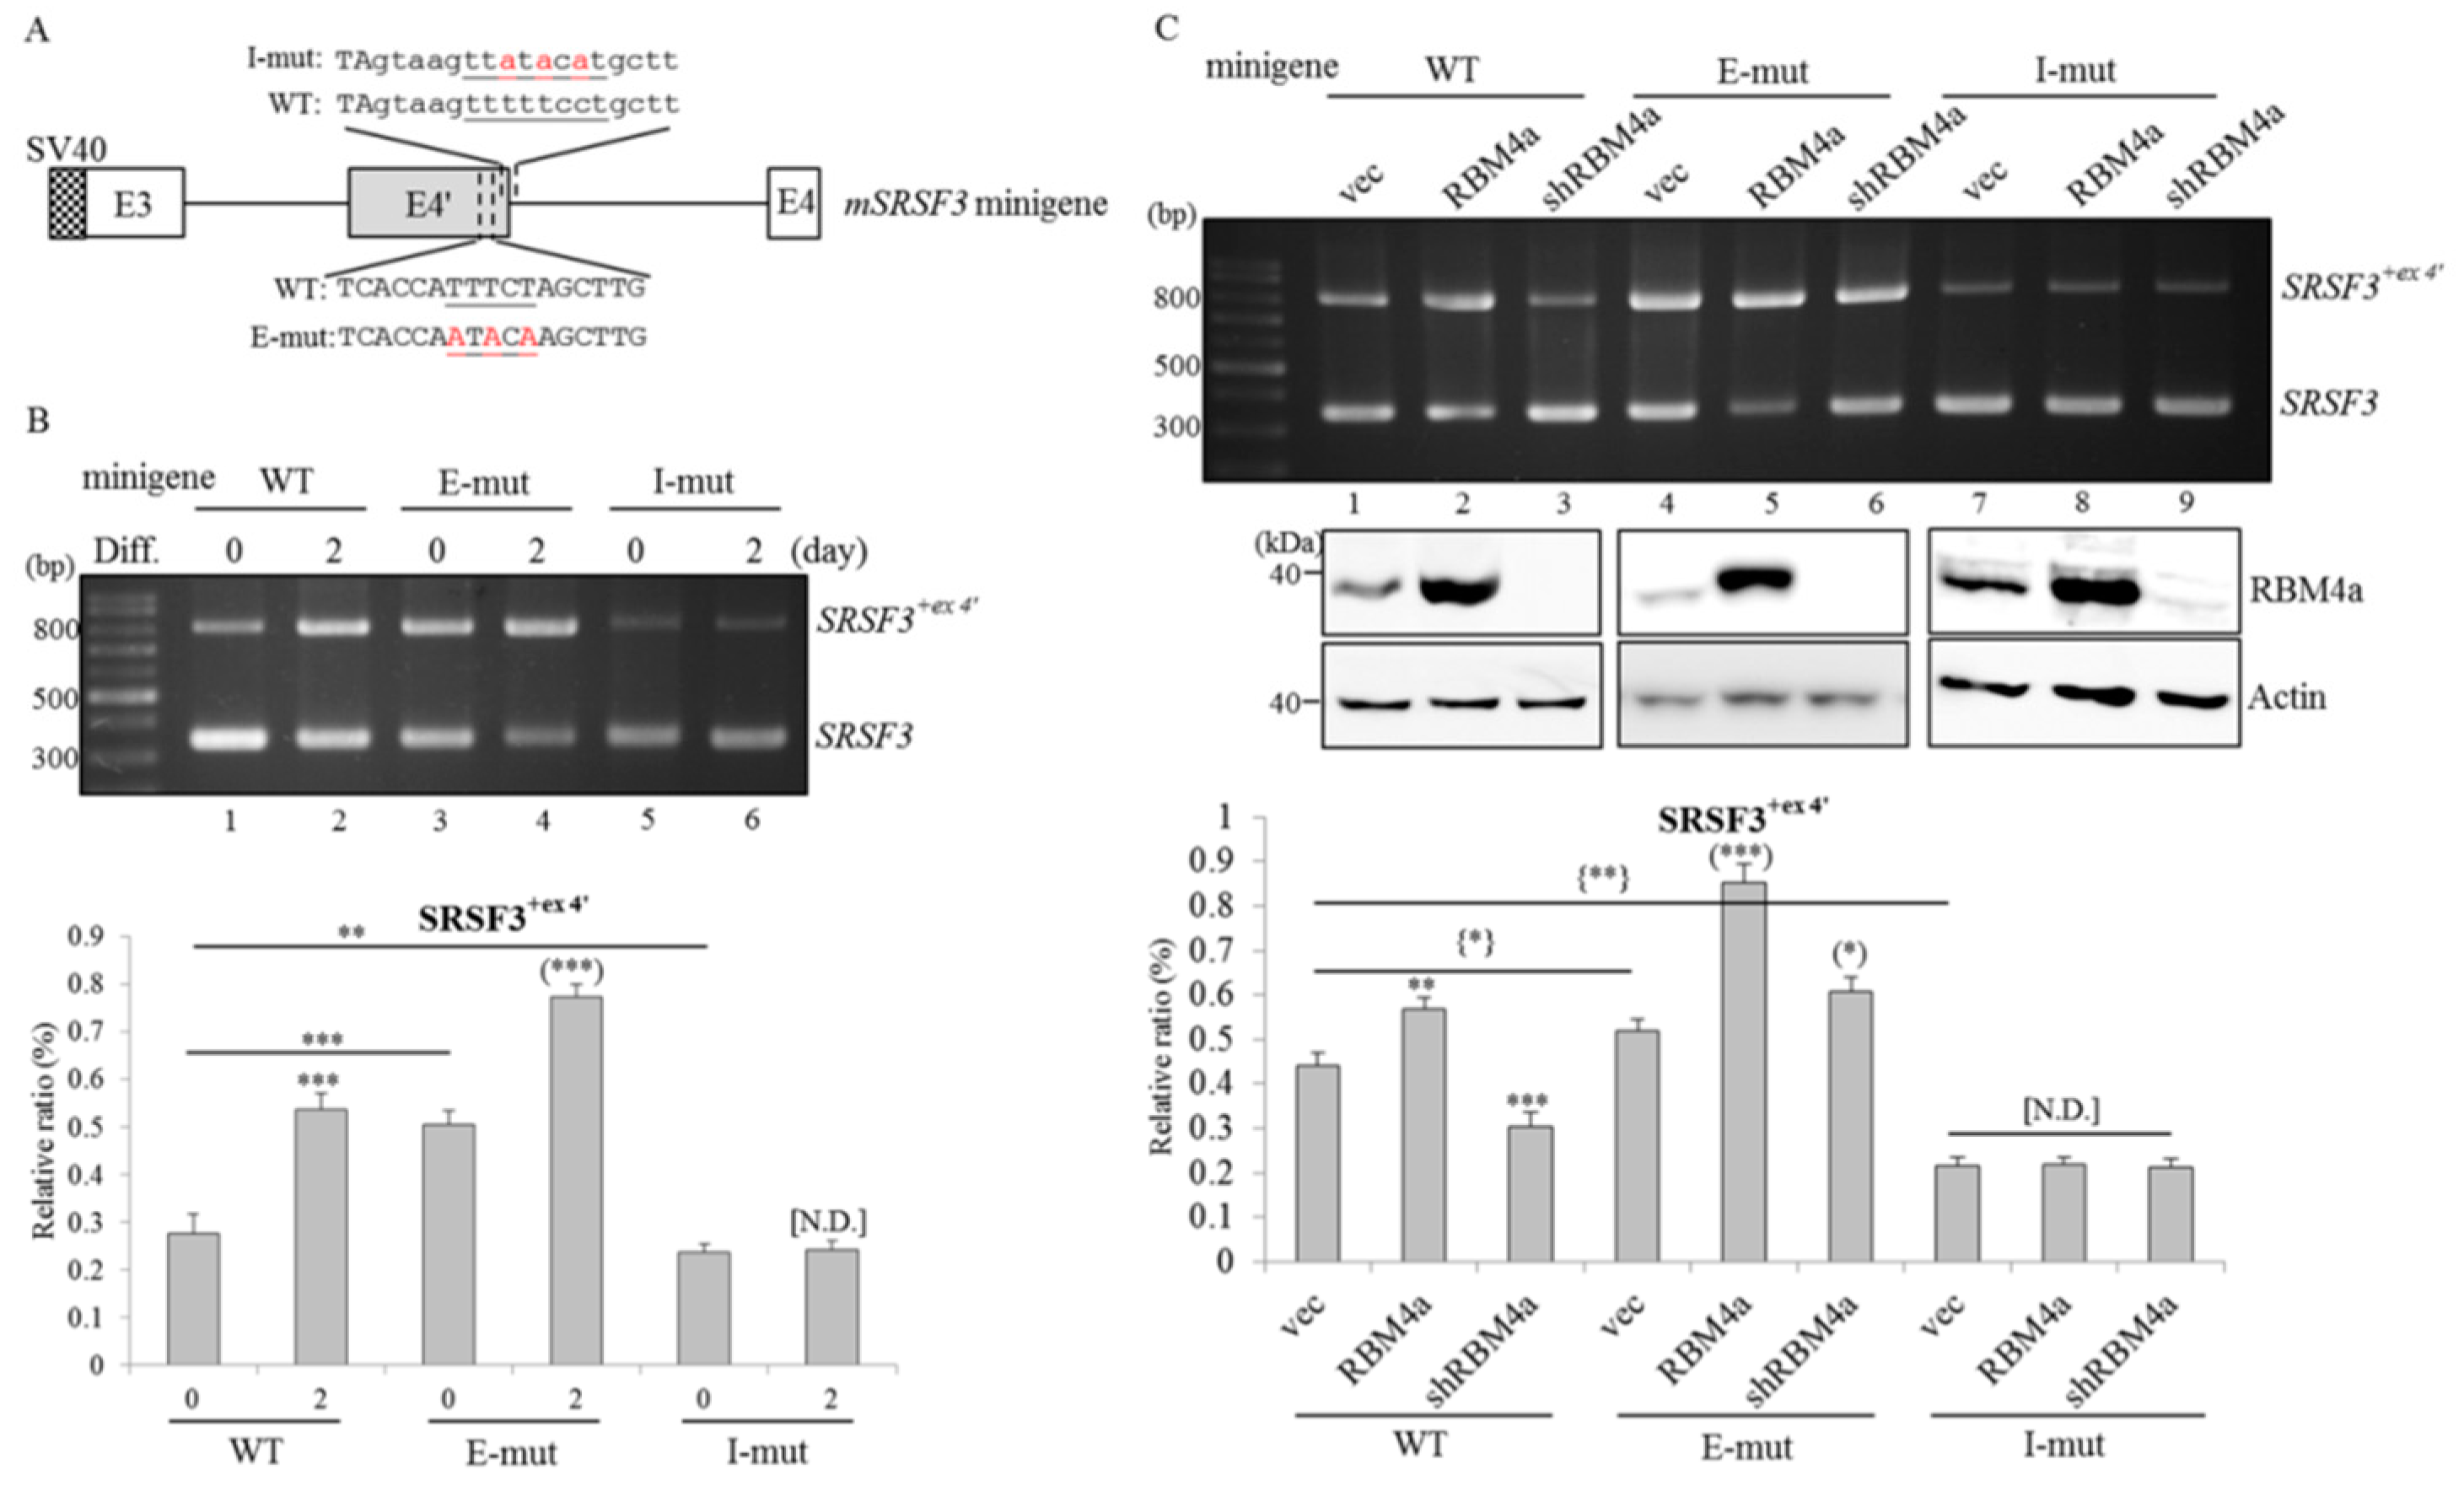
2.4. RBM4a Modulates the Alternative Splicing of SRSF3 Transcripts in a Sequence-Specific Manner

The interplay between the heterogeneous nuclear ribonucleoprotein (HnRNP) I (also referred to as PTBP1) and the UUUCU element within SRSF3 exon 4′ was documented to impair SRSF3-mediated autoregulation [17]. We therefore wondered whether RBM4a exhibited an antagonistic effect on PTBP1-regulated SRSF3 splicing as demonstrated in previous reports [18]. The reporter containing intact SRSF3 exon 3, intron 3, and exon 4 elements and nucleotide-substituted mutants were constructed and applied to in vivo splicing assays (Figure 3A). Results of RT-PCR assays showed that an increase in SRSF3+ex4′ transcripts generated from the WT reporter was observed after treatment with the differentiating cocktail compared to undifferentiated cells (Figure 3B, lanes 1 and 2, PII = 27.54% and 53.8%). Nucleotide substitutions within the UUUCU element of SRSF3 exon 4′ led to elevation of SRSF3+ex4′ transcripts in transfected cells cultured in growth and differentiating media (Figure 3B, lanes 3 and 4, PII = 50.48% and 77.32%), whereas nucleotide substitutions within the intronic CU element diminished utilization of SRSF3 exon 4′ in both undifferentiated and differentiated cells (Figure 3B, lanes 5 and 6, PII = 23.67% and 24.24%) compared to those of the WT reporter. Moreover, overexpression of RBM4a mediated increases in relative levels of SRSF3+ex4′ transcripts generated from the WT reporter and exonic mutant (Figure 3C, lanes 2 and 5, PII = 56.8% and 85.27%) compared to empty-vector transfectants (Figure 3C, lanes 1 and 4, PII = 44.19% and 52.02%). In contrast, reduced yields of SRSF3+e 4′ transcripts generated from the WT reporter and exonic mutant were noted after depletion of endogenous RBM4a (Figure 3C, lanes 3 and 6, PII = 30.42% and 43.47%). Nevertheless, splicing profiles of the SRSF3 intronic mutant showed no response to altered levels of RBM4a compared to empty-vector transfectants (Figure 3C, lanes 7–9). These results suggested that RBM4a mainly modulated utilization of SRSF3 exon 4′ through the intronic CU element which potentially functions as a splicing enhancer.

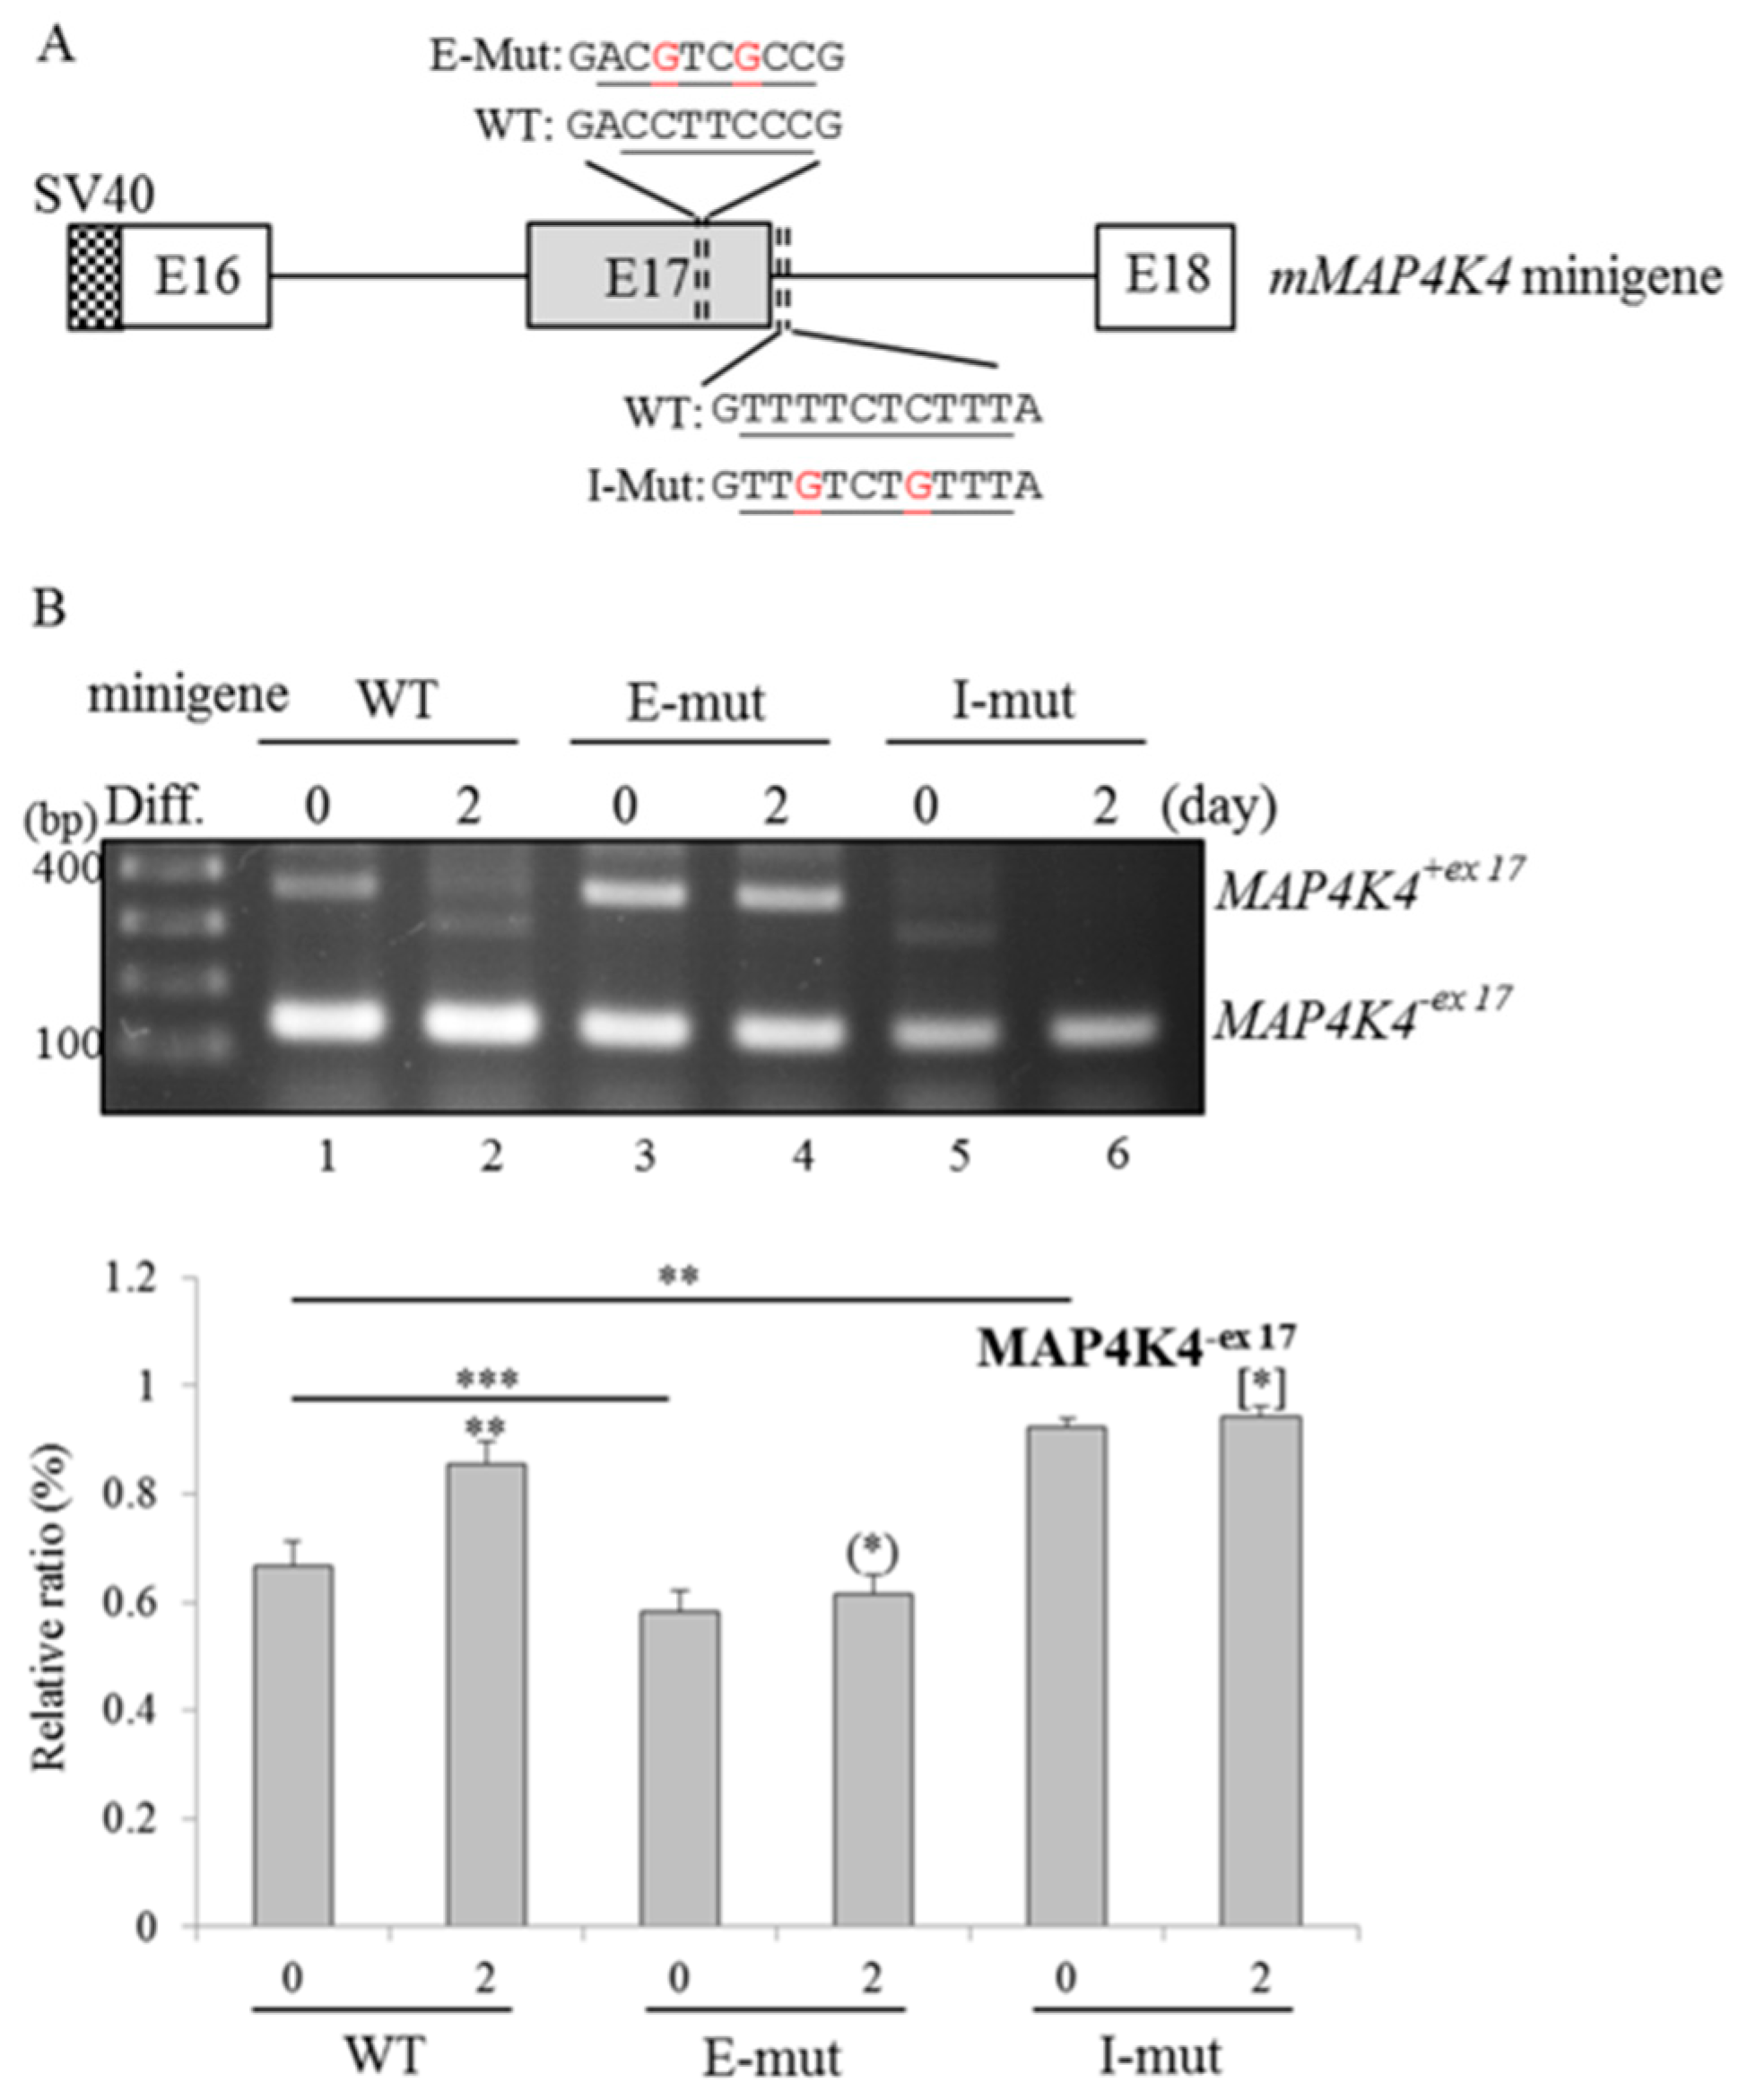
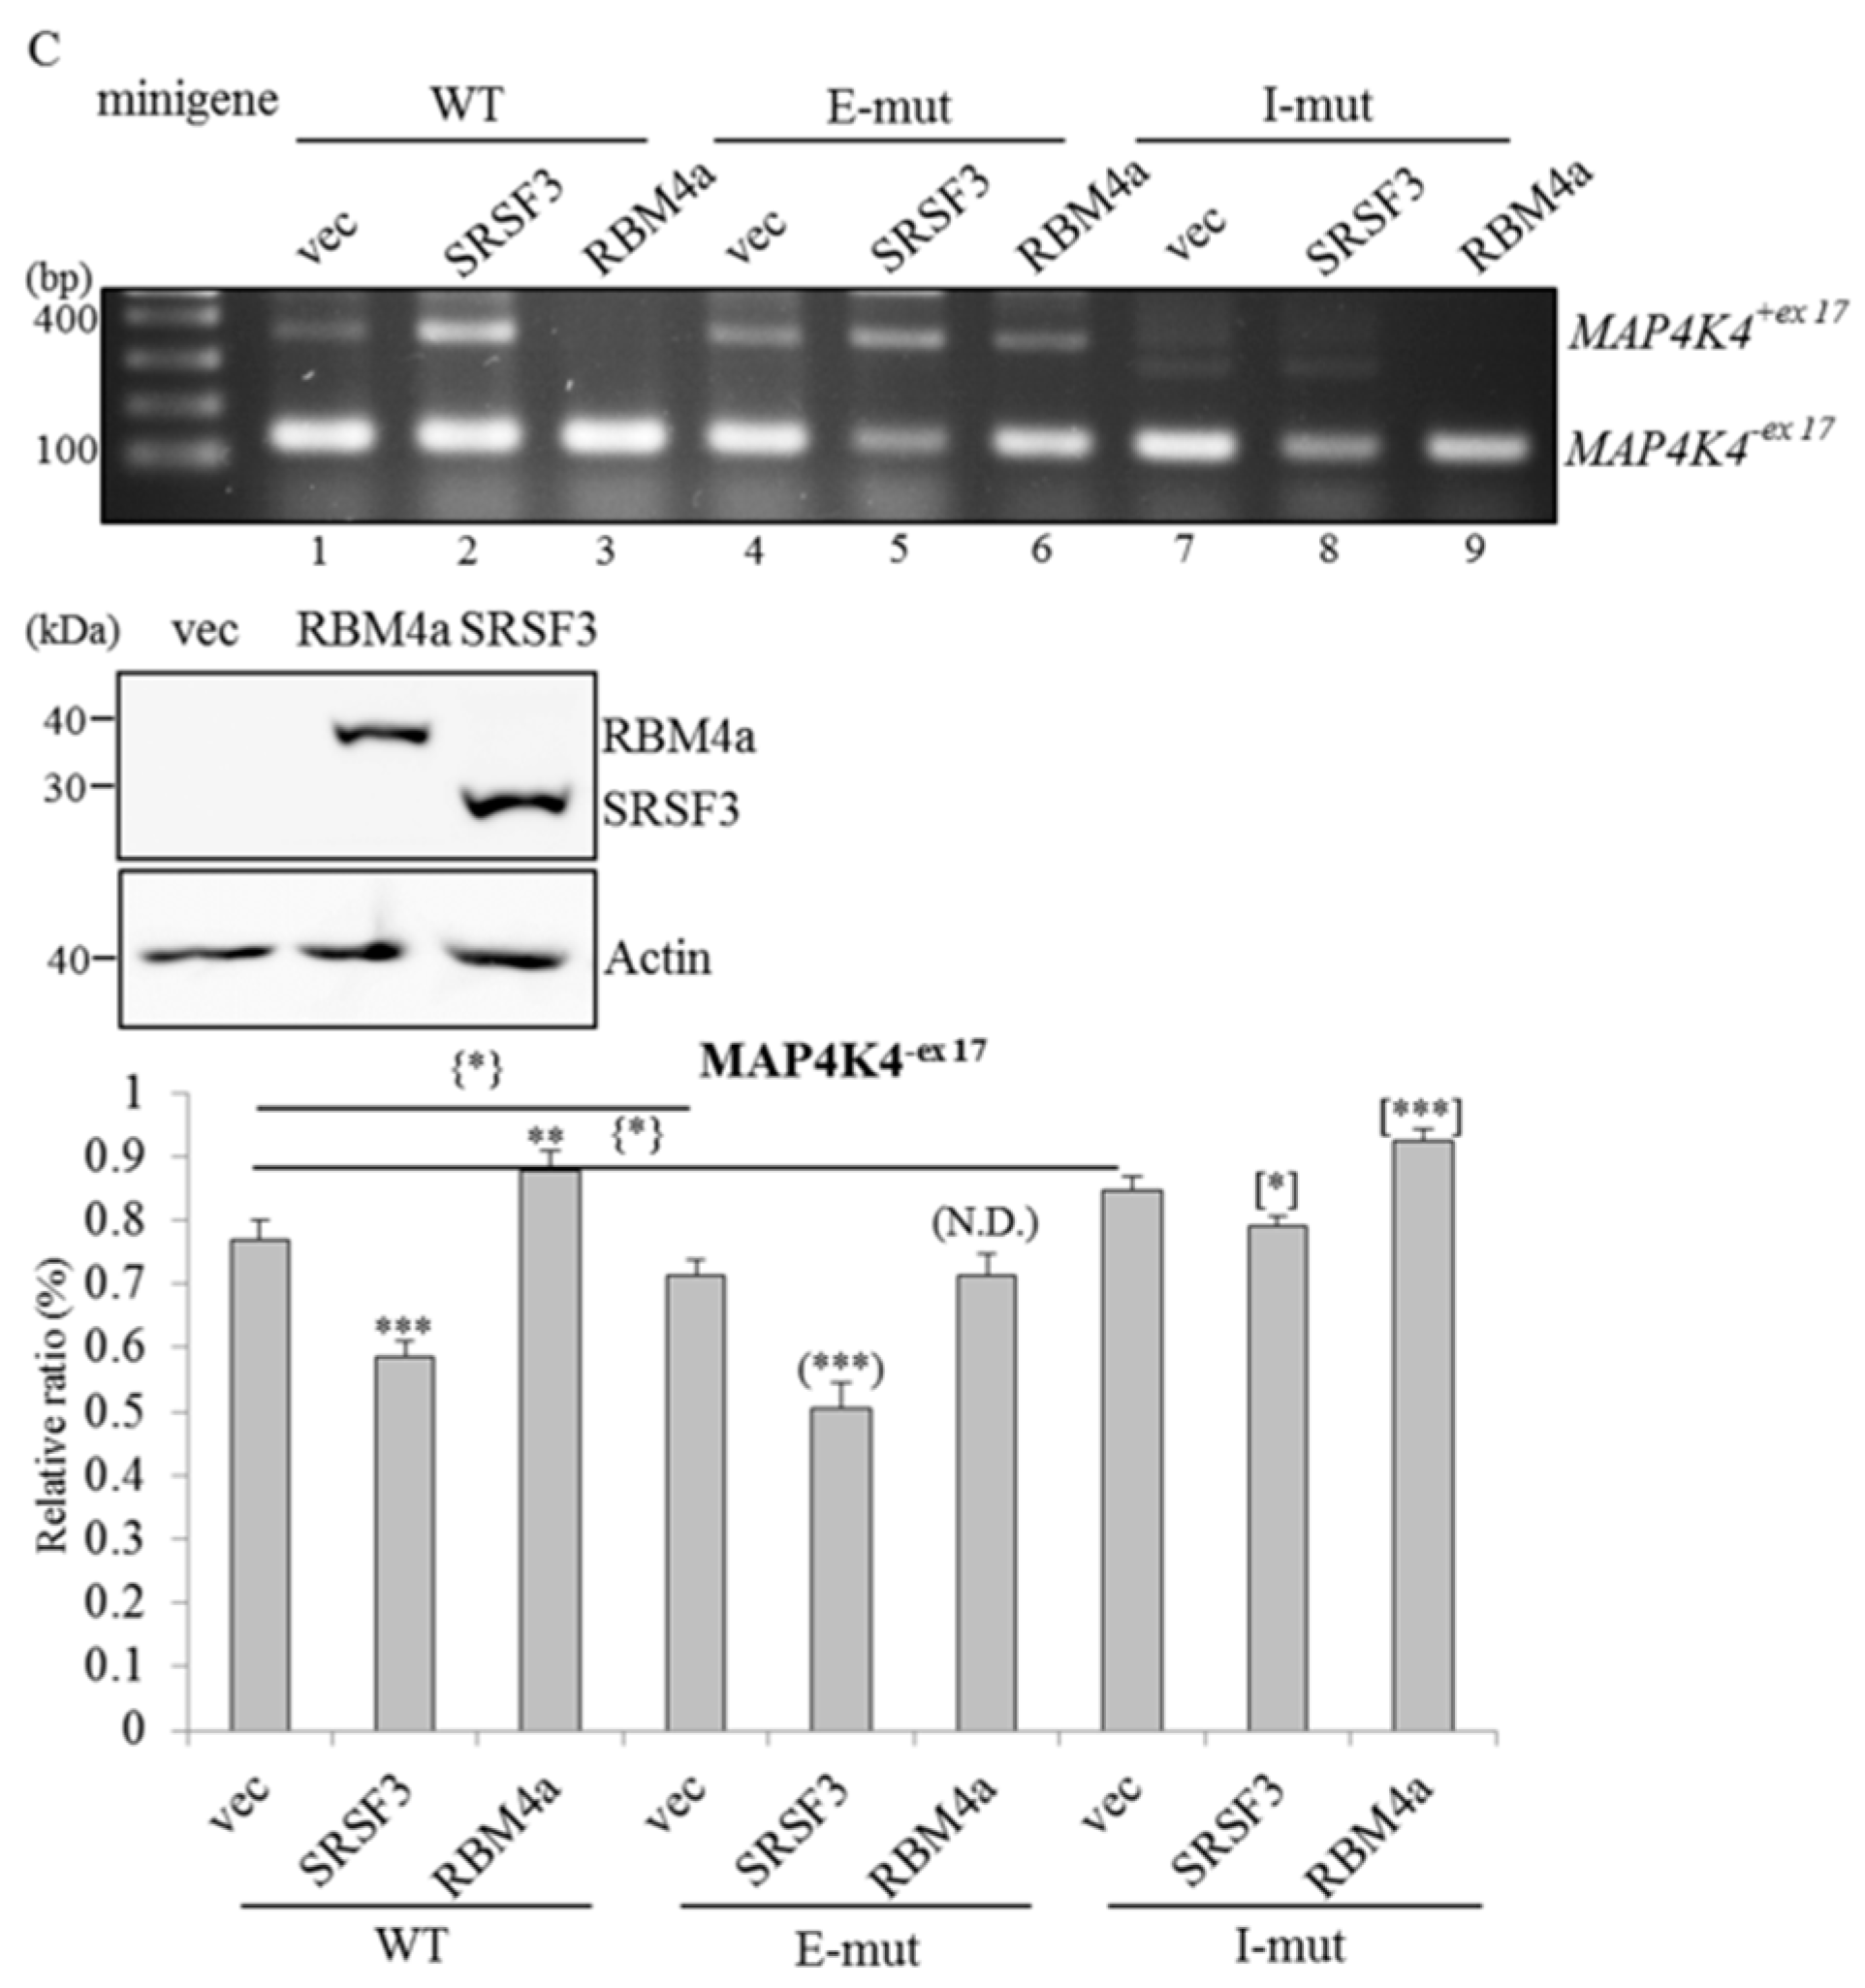
2.5. RBM4a and SRSF3 Exert Antagonistic Effects on Utilization of MAP4K4 Exon 17

In addition to MAP4K4 iso 4, inclusion of MAP4K4 exon 17 was identified in other MAP4K4 variants. By surveying the genomic sequence of the MAP4K4 transcript, a high-affinity CU element (CUCUUU) of SRSF3 was noted within MAP4K4 intron 17 (Figure 4A) [19]. To validate the influence of RBM4a and SRSF3 involved in utilization of MAP4K4 exon 17, the WT MAP4K4 minigene and derived mutants were constructed and applied to the following reporter assays (Figure 4A). As shown in Figure 4B, results of RT-PCR analyses showed that treatment with the differentiating cocktail mediated an increase in MAP4K4−ex17 transcripts generated from the WT MAP4K4 reporter compared to undifferentiated cells (Figure 4B, lanes 1 and 2, PII = 66.82% and 85.38%). Reduced expressions of MAP4K4−ex17 transcripts generated from the exonic mutant were noted in both undifferentiated and differentiated cells (Figure 4B, lanes 3 and 4, PII = 58.18% and 61.55%) compared to those of the WT minigene. In contrast, nucleotide substitutions within the intronic CU element further strengthened the influence of the differentiating cocktail on enhancing relative levels of MAP4K4−ex17 transcripts (Figure 4B, lane 6, PII = 94.17%) compared to that of the WT reporter (Figure 4B, lane 2 PII = 85.38%). Overexpression of RBM4a enhanced yields of MAP4K4−ex17 transcripts generated from the WT MAP4K4 reporter, whereas a decrease in MAP4K4−ex17 transcripts was identified with the overexpression of SRSF3 (Figure 4C, lanes 2 and 3, PII = 58.47% and 87.66%) compared to the empty-vector transfectant (Figure 4C, lane 1, PII = 77%). In contrast, the splicing profile of the exonic mutant showed no response to the presence of overexpressed RBM4a compared to the empty-vector transfectant (Figure 4C, lanes 4 and 5, PII = 71.26% and 71.38%). Overexpression of SRSF3 continually enhanced yields of MAP4K4+ex17 transcripts generated from the exonic mutant (Figure 4C, lane 6, PII = 50.48%). In contrast, a nucleotide substitution within MAP4K4 intron 17 lessened the impact of overexpressed SRSF3 on enhancing inclusion of exon 17 compared to that of the empty-vector transfectant (Figure 4C, lanes 7 and 8, PII = 84.77% and 78.96%), whereas overexpressed RBM4a exhibited a repressive effect on the selection of exon 17 (Figure 4C, lane 7, PII = 92.46%). These results suggested that the interplay between RBM4a and the exonic CU element constituted a splicing silencer toward inclusion of MAP4K4 exon 17. The interaction between SRSF3 and the intronic CU element functioned as a splicing enhancer to maintain the homeostasis of MAP4K4 variants by antagonizing RBM4a-mediated regulation involved in MAP4K4 splicing.

2.6. MAP4K4 Isoforms Differentially Modulate Activity of the Brown Adipogenesis-Related Signaling Pathway

Treatment with rapamycin was documented to reduce insulin sensitivity and mitochondrial activity of BAs, which was prohibited in the presence of a JNK inhibitor (19). Moreover, expressions of thermogenic genes by BAs were induced after depletion of MAP4K4 which served as an activator of the JNK signaling pathway [20,21]. Potential impacts of MAP4K4 isoforms on JNK signaling were therefore investigated using an in vitro cell model. Results of an immunoblot assay showed gradual decreases in phosphorylated (p)-JNK-1 throughout the development of BATs (Figure 5A, left, lanes 1 and 2) and differentiation of C3H10T1/2 cells (Figure 5B, lanes 1 and 2), whereas depletion of RBM4a impaired the reduction in p-JNK-1 along with the development of BATs (Figure 5A, lanes 3 and 4) and cultured cells (Figure 5B, lanes 3 and 4). Nevertheless, total JNK expression was not altered by the differentiating condition or RBM4a ablation (Figure 5A,B, T-JNK). Phosphorylation of JNK-1 was induced only in the presence of overexpressed MAP4K4 Iso 1, but not MAP4K4 Iso 4, compared to that of the empty-vector transfectant (Figure 5C, p-JNK, lanes 1–3). Overexpressed MAP4K4 isoforms exhibited no influence on expression of total JNK (Figure 5C, T-JNK) or the loading control. Results of IP assays showed that JNK-1 protein was more associated with FLAG-tagged MAP4K4 Iso1 than with overexpressed MAP4K4 Iso4 in transfected cells (Figure 5D, lanes 5 and 6), which may have subsequently led to the differential phosphorylation of JNK-1 proteins (Figure 5C). Taken together, RBM4a-mediated splicing constituted a regulatory mechanism for manipulating the impact of MAP4K4 on JNK-1 activation.

2.7. MAP4K4 Isoforms and SRSF3 Exert Discriminative Effects on Brown Adipogenesis

An in vitro cell model coupled with overexpression of MAP4K4 isoforms or alteration of SRSF3 abundances was next conducted to validate the influence of MAP4K4 isoforms and SRSF3 on the development of brown adipogenesis. Results of qPCR assays indicated that the presence of overexpressed MAP4K4 Iso 4 mediated an increase in expression of uncoupling protein 1 (UCP1) transcript, that serve as a key factor involved in non-shivering thermogenesis in BAs compared to the empty-vector transfectant (Figure 6A, UCP1). In contrast, overexpression of MAP4K4 Iso1 resulted in reduced level of UCP1 transcript. An increase in BMP2 transcripts with concomitant decreases in brown adipocytes-specific (PRDM 16 and BMP7) and beige cell-related factors (Cited 1 and Hoxa9) were noted in the MAP4K4 Iso 1—and SRSF3-overexpressing cells (Figure 6A,B, gray bar) compared to those of the empty-vector transfectants (Figure 6A,B, white bar). Overexpression of MAP4K4 Iso 4 and depletion of SRSF3 reversely manipulated the expression profiles of adipocyte-related transcription factors (Figure 6A,B, black bar). Besides the altered expression profiles of a thermogenic factor, overexpression of MAP4K4 Iso 4 mediated elevated basal and maximal OCRs, and ATP production (Figure 6C, red bar) compared to those of empty-vector transfected C3H10T1/2 cells (Figure 6C, blue bar). Reversely, overexpression of MAP4K4 Iso1 resulted in reduced basal and maximal OCRs, and ATP production (Figure 6C, green bar). SRSF3-knockdown cells also exhibited elevated basal and maximal OCRs, and ATP production (Figure 6D, red bar), whereas the reduced basal and maximal OCRs, and ATP production were monitored in SRSF3-overexpressing cells (Figure 6D, green bar) compared to empty-vector transfectants (Figure 6D, blue bar). These results indicated the repressive influence of MAP4K4 iso 1 and SRSF3 on brown adipogenesis, whereas the presence of MAP4K4 iso 4 enhanced the physiological signatures of brown adipocytes.

3. Discussion

AS cascades constitute a common mechanism for determining cell and tissue development. For instance, NMD-coupled autoregulation and cross-regulation of PTBP1 and neuronal PTB (also referred to as PTBP2) led to reprogramming of splicing networks throughout neuronal development [22]. In this report, a postnatal switch of the SRSF3 and RBM4a protein expression reprogrammed splicing profiles of MAP4K4 transcripts, which lessened the repressive effect of JNK signaling on the development and functioning of BATs.
MAP4K4 contains a serine/threonine kinase domain at the N-terminus and a citron-homology (CNH) domain at the C-terminus which participate in protein interactions [23]. The CNH and kinase domains of the MAP4K4 protein were demonstrated to be essential for activation of downstream signaling, including the JNK pathway [24]. Functional MAP4K4 isoforms were previously identified to contain a distinct intermediate region and a regulatory region at the C-terminus which are encoded by alternatively spliced transcripts [24,25]. Despite this, the influences of distinct MAP4K4 isoforms on carcinogenesis or adipogenesis are as yet uncharacterized. Repressive effects of MAP4K4 on insulin sensitivity, oxidative metabolism, and adipogenesis were revealed using RNA interference (RNAi)-based screening [26]. MAP4K4 was next documented to abolish adipogenesis by downregulating the expression of peroxisome proliferator-activated receptor (PPAR) gamma protein through various signaling pathway, including Wnt, Tumor necrosis factor alpha, and c-JNK pathway [27,28,29]. Although the influence of JNK signaling on adipogenesis was controvertible, treatment with an immunosuppressive agent, such as rapamycin, was recently demonstrated to diminish insulin sensitivity and mitochondrial activity in skeletal muscles and BAs through a MAP4K4-activated JNK pathway [19,27]. Application of a JNK inhibitor inversely lessened the influence of the MAP4K4-mediated pathway on reducing insulin signaling in BATs [19]. In this study, the presence of MAP4K4 Iso4 alone was first reported to enhance the differentiation and metabolism of pre-adipocytes, which may release the repressive effect of MAP4K4 Iso1 throughout brown adipogenesis. These results suggested that the effect of functional protein can be fine-tuned by manipulating the composition of encoded isoforms instead of altering the transcriptional activity. Nevertheless, the influence of MAP4K4 gene on development of WATs or beige cells was worthy of further investigation.
The SRSF family functions as a major group that orchestrates post-transcriptional regulation to coordinate spatial and temporal gene profiles involved in diverse cellular processes, including differentiation and maturation [28,29]. The AS-coupled NMD mechanism constitutes a common mechanism for auto- and cross-regulation of SRSF family members, such as SRSF3, SRSF6, and other splicing regulators [18,30,31]. The binding tendency of SRSF3 toward the CU element (CUCUUC), which frequently functions as an exonic splicing silencer, was identified using cross-linked IP-coupled sequencing and subsequent functional assays [32,33]. The interplay between SRSF3 and a corresponding element within the 3′ region of its own exon 4′ led to an increase in NMD-targeted SRSF3 transcripts, subsequently maintaining the homeostasis of SRSF3 expression [17]. Upregulation of hnRNP proteins was documented to impair the autoregulation of SRSF3 splicing and subsequently resulted in imbalanced expression of SRSF3 in various cancers [17]. The simultaneous interplay between RBM4a and the CU element within the SRSF3 exon 4′ and downstream intron constituted another mechanism for maintaining the homeostasis of SRSF3 during BAT development. Nevertheless, the regulation of SRSF3 splicing throughout BAT development and the repressive effect of SRSF3 on metabolic activity of BAs was first reported in this study. Although the reduced mass of BATs was previously noted in the SRSF3-knockout mice [34], overexpression of SRSF3 was demonstrated to enhance the relative levels of PKM2 transcripts which were predominantly transcribed in WAs [35]. These controversial results suggested that proper expressions of SRSF3 might play a potential role in the development of BAT or other adipose tissues, which is worthy of further investigation.
A gradual increase in RBM4a was previously demonstrated to reprogram splicing profiles of transcription and splicing regulators throughout brown adipogenesis. In this study, a novel splicing network composed of RBM4a, SRSF3, and MAP4K4 was identified in BAs using a transcriptome analysis, and subsequently manipulating the effect of downstream JNK signaling which contributes to insulin resistance and reduced metabolism. Therefore, the impacts and regulatory mechanism of a brown adipogenic splicing network are worthy of further investigation, which could function as a therapeutic target for obesity-related diseases.

4. Materials and Methods

4.1. Ethics Statement for Animal Research

Animal experiments were approved by the Institutional Animal Care and Use Committee of Taipei Medical University (no. LAC-2016-0351) and were conducted according to relevant guidelines to minimize animal suffering. The creation of RBM4a−/− mice and isolation of interscapular BATs at distinct stages were described in previous studies [14,16].

4.2. Transcriptome Analyses

Transcriptome assays of mice BATs were performed as in previous studies [15]. Briefly, total RNAs were purified using a PureLink RNA mini kit (Invitrogen, Carlsbad, CA, USA) according to the manufacturer’s protocol. Total RNAs (8 μg) with a high integrity number (RIN > 8.0) were used for library construction with the NEBNext Ultra RNA Library Prep Kit (NEB, Ipswich, MA, USA) according to the manufacturer’s instructions. Paired-end reads (150 bp) were amplified on an Illumina Hi-Seq 4000 platform with the prepared libraries. Preliminary reads were trimmed, filtered, and aligned to the mouse reference genome (GRCm37) using the Tophat v2.0.9 program. Aligned reads were applied to transcriptome assemblies using the Cufflink program. Transcriptome assemblies generated from individual samples were merged using the Cuffmerge utility to estimate transcript levels in each condition. Expression levels and the statistical significance of the merged assemblies were examined using a Cuffdiff and CLC genomic workbench analysis.

4.3. Cell Culture and In Vitro Differentiation

Mouse C3H10T1/2 fibroblast cells were cultured in Dulbecco’s modified Eagle medium (DMEM; Invitrogen) supplemented with 10% fetal bovine serum (FBS; Invitrogen). In vitro differentiation was conducted by shifting C3H10T1/2 cells to induction medium supplemented with 20% FBS, 0.5 mM IBMX, 12.7 μM dexamethasone, and 10 µg/mL insulin. The induction medium was replaced with differentiation medium (DM) supplemented with 10% FBS and 10 μg/mL insulin after 48 h and replenished every 2 days.

4.4. Plasmid Construction

Coding regions of human MAP4K4 and SRSF3 were amplified using a polymerase chain reaction (PCR) with a mice fetal complementary (c)DNA library as the template. The PCR product was digested with Hind III/EcoR I and EcoR I/EcoR V restriction enzymes and inserted into the p3XFLAG-CMV14 vector (Sigma, St. Louis, MO, USA). The mouse genomic element containing SRSF3 exon 3, intron 3, and exon 4 was PCR-amplified with genomic DNA prepared from C3H10T1/2 cells as the template. The PCR product was digested with EcoR V and Sac I restriction enzymes, and then the insert was placed into the pUC19 vector (NEB). The MAP4K4 minigene was constructed by inserting mouse MAP4K4 genomic fragments containing exon 15, exon16, exon 18, and the complete introns into the pUC19 vector (NEB). PCR-amplified fragments were digested with EcoR I and Hind III restriction enzymes prior to DNA ligation. Derived mutants of the expressing vectors or minigene reporters harboring substituted nucleotides were constructed using the QuikChange site-directed mutagenesis system (Stratagene, Amsterdam, The Netherlands). The vector-based short hairpin RNA targeting mouse SRSF3 was purchased from the RNAi core facility at Academia Sinica (Taipei, Taiwan).

4.5. Transient Transfection, Reverse-Transcription (RT)-PCR, and Quantitative (q)PCR Analyses

Cultured C3H10T1/2 cells at ~60% confluence were transfected with the indicated plasmid using Lipofectamine 3000 according to the manufacturer’s protocol (Invitrogen). Total RNAs and cell extracts were isolated using a PureLink RNA mini kit (Invitrogen) at 24 h post-transfection. Total RNA (1 µg) was reverse-transcribed using SuperScriptase III (Invitrogen) in a 10-μL reaction and then subjected to PCR assays with specific primer sets (Supplementary Table S1). Levels of GAPDH transcripts served as a loading reference. The qPCR assay was performed using SYBR green fluorescent dye and gene-specific primer sets (Supplementary Table S2) on an ABI One Step™ PCR machine (Applied Biosystems, Foster City, CA, USA). The relative messenger (m)RNA level was quantitated by the ΔΔ−Ct method, and normalized to levels of GAPDH transcripts.

4.6. Co-Immunoprecipitation (Co-IP) and Immunoblot Assays

An expressing vector encoding the FLAG-tagged MAP4K4 iso1 and iso4 was transfected into C3H10T1/2 cells using Lipofectamine 3000 (Invitrogen). Transfected cells were lysed in RIPA solution containing 10 mM sodium phosphate (pH 7.2), 150 mM sodium chloride, 2 mM EDTA, and 1% Nonidet P-40 at 24 h post-transfection. The FLAG-tagged MAP4K4 isoform and associated protein were immunoprecipitated using anti-FLAG M2 agarose (Sigma) and washed with RIPA buffer containing 0.1% Nonidet P-40. To extract the precipitated complex, the washed beads were incubated at 95 °C for 15 min and removed by centrifugation. The immunoblot analysis was conducted using an enhanced chemiluminescence (ECL) system (Millipore, Billerica, MA, USA), and results were monitored using the LAS-4000 imaging system (Fujifilm, Tokyo, Japan). Primary antibodies used in this study included polyclonal anti-RBM4a (dilution 1:1000; Santa Cruz Biotechnology, Santa Cruz, CA, USA), polyclonal anti-GAPDH (dilution 1:2000; MDBio, Taipei, Taiwan), polyclonal anti-phosphorylated JNK (dilution 1:1000; R&D Systems, Minneapolis, MN, USA), monoclonal anti-SRSF3 (dilution 1:2000; Abnova, Taipei, Taiwan), monoclonal anti-actin (dilution 1:4000; Millipore), monoclonal anti-JNK (dilution 1:1000; R&D Systems), and monoclonal anti-MAP4K4 (dilution 1:500; Cell Signaling Technology, Beverly, MA, USA) Signal intensities were evaluated using TotalLab Quant Software.

4.7. Mitochondrial Respiration Assay

The oxygen consumption rate of cultured C3H10T1/2 cells was measured using a Seahorse XF24 bioanalyzer (Seahorse Bioscience, Billerica, MA, USA). In brief, C3H10T1/2 cells (2 × 10⁴) were seeded in wells of Seahorse XF24 plates with 250 µL of DMEM overnight. Prior to the measurement, cells were washed with unbuffered medium and immersed in 675 µL of unbuffered medium without CO2 for 1 h. The oxygen consumption rate (OCR) was assessed in 8-min cycles as recommended by Seahorse Bioscience. Basal and maximal OCRs, and the spare respiratory capacity were recorded following injection of complex-specific substrates, including FCCP (2 μM), rotenone (2 μM), and oligomycin (2.5 µg/mL).

4.8. Statistical Analyses

An analysis of variance (ANOVA) and Student’s t-tests were performed to determine the significance of the experimental results. p < 0.05 was considered statistically significant.

Supplementary Materials

Supplementary materials can be found at https://0-www-mdpi-com.brum.beds.ac.uk/1422-0067/19/9/2646/s1.

Author Contributions

H.-Y.P., J.-C.L., T.-H.T., H.-C.C. and Y.-J.L. designed and performed the experiments and analyzed the results. J.-C.L. wrote the manuscript.

Acknowledgments

This work was supported by grants (MOST106-2320-B-038-059 and MOST107-2320-B-038-060) from the Ministry of Science and Technology, Taiwan.

Conflicts of Interest

The authors declare no conflict of interest.

References

  1. Kim, S.P.; Frey, J.L.; Li, Z.; Kushwaha, P.; Zoch, M.L.; Tomlinson, R.E.; Da, H.; Aja, S.; Noh, H.L.J.; Kim, K.; et al. Sclerostin influences body composition by regulating catabolic and anabolic metabolism in adipocytes. Proc. Natl. Acad. Sci. USA 2017, 114, E11238–E11247. [Google Scholar] [CrossRef] [PubMed]
  2. Hung, C.; Bronec, C.; Napoli, E.; Graham, J.; Stanhope, K.L.; Marsilio, L.; Giron, M.C.; Havel, P.J.; Giulivi, C. Adipose depot-specific effects of ileal interposition surgery in UCD-T2D rats: Unexpected implications for obesity and diabetes. Biochem. J. 2018, 475, 649–662. [Google Scholar] [CrossRef] [PubMed]
  3. Banfi, S.; Gusarova, V.; Gromada, J.; Cohen, J.C.; Hobbs, H.H. Increased thermogenesis by a noncanonical pathway in ANGPTL3/8-deficient mice. Proc. Natl. Acad. Sci. USA 2018, 115, E1249–E1258. [Google Scholar] [CrossRef] [PubMed] [Green Version]
  4. Xiong, Y.; Yue, F.; Jia, Z.; Gao, Y.; Jin, W.; Hu, K.; Zhang, Y.; Zhu, D.; Yang, G.; Kuang, S. A novel brown adipocyte-enriched long non-coding RNA that is required for brown adipocyte differentiation and sufficient to drive thermogenic gene program in white adipocytes. Biochim. Biophys. Acta 2018, 1863, 409–419. [Google Scholar] [CrossRef] [PubMed]
  5. Reza, M.M.; Subramaniyam, N.; Sim, C.M.; Ge, X.; Sathiakumar, D.; McFarlane, C.; Sharma, M.; Kambadur, R. Irisin is a pro-myogenic factor that induces skeletal muscle hypertrophy and rescues denervation-induced atrophy. Nat. Commun. 2017, 8, 1104. [Google Scholar] [CrossRef] [PubMed] [Green Version]
  6. Christoffersen, C.; Federspiel, C.K.; Borup, A.; Christensen, P.M.; Madsen, A.N.; Heine, M.; Nielsen, C.H.; Kjaer, A.; Holst, B.; Heeren, J.; et al. The apolipoprotein M/S1P axis controls triglyceride metabolism and brown fat activity. Cell Rep. 2018, 22, 175–188. [Google Scholar] [CrossRef] [PubMed]
  7. An, Y.; Wang, G.; Diao, Y.; Long, Y.; Fu, X.; Weng, M.; Zhou, L.; Sun, K.; Cheung, T.H.; Ip, N.Y.; et al. A molecular switch regulating cell fate choice between muscle progenitor cells and brown adipocytes. Dev. Cell 2017, 41, 382–391. [Google Scholar] [CrossRef] [PubMed]
  8. Nilsen, T.W.; Graveley, B.R. Expansion of the eukaryotic proteome by alternative splicing. Nature 2010, 463, 457–463. [Google Scholar] [CrossRef] [PubMed] [Green Version]
  9. Xu, Y.; Wang, Y.; Luo, J.; Zhao, W.; Zhou, X. Deep learning of the splicing (epi)genetic code reveals a novel candidate mechanism linking histone modifications to ESC fate decision. Nucleic Acids Res. 2017, 45, 12100–12112. [Google Scholar] [CrossRef] [PubMed] [Green Version]
  10. Chen, L.; Luo, C.; Shen, L.; Liu, Y.; Wang, Q.; Zhang, C.; Guo, R.; Zhang, Y.; Xie, Z.; Wei, N. SRSF1 prevents DNA damage and promotes tumorigenesis through regulation of DBF4B pre-mrna splicing. Cell Rep. 2017, 21, 3406–3413. [Google Scholar] [CrossRef] [PubMed]
  11. Xie, N.; Chen, M.; Dai, R.; Zhang, Y.; Zhao, H.; Song, Z.; Zhang, L.; Li, Z.; Feng, Y.; Gao, H.; et al. SRSF1 promotes vascular smooth muscle cell proliferation through a Δ133p53/EGR1/KLF5 pathway. Nat. Commun. 2017, 8, 16016. [Google Scholar] [CrossRef] [PubMed] [Green Version]
  12. Peng, Y.; Yuan, J.; Zhang, Z.; Chang, X. Cytoplasmic poly(A)-binding protein 1 (PABPC1) interacts with the RNA-binding protein hnRNPLL and thereby regulates immunoglobulin secretion in plasma cells. J. Biol. Chem. 2017, 292, 12285–12295. [Google Scholar] [CrossRef] [PubMed]
  13. Parikshak, N.N.; Swarup, V.; Belgard, T.G.; Irimia, M.; Ramaswami, G.; Gandal, M.J.; Hartl, C.; Leppa, V.; Ubieta, L.T.; Huang, J.; et al. Genome-wide changes in lncRNA, splicing, and regional gene expression patterns in autism. Nature 2016, 540, 423–427. [Google Scholar] [CrossRef] [PubMed]
  14. Lin, J.C.; Tarn, W.Y.; Hsieh, W.K. Emerging role for RNA binding motif protein 4 in the development of brown adipocytes. Biochim. Biophys. Acta 2014, 1843, 769–779. [Google Scholar] [CrossRef] [PubMed]
  15. Lin, J.C. Multi-posttranscriptional regulations lessen the repressive effect of SRPK1 on brown adipogenesis. Biochim. Biophys. Acta 2018, 1863, 503–514. [Google Scholar] [CrossRef] [PubMed]
  16. Lin, J.C.; Yan, Y.T.; Hsieh, W.K.; Peng, P.J.; Su, C.H.; Tarn, W.Y. RBM4 promotes pancreas cell differentiation and insulin expression. Mol. Cell. Biol. 2013, 33, 319–327. [Google Scholar] [CrossRef] [PubMed]
  17. Guo, J.; Jia, J.; Jia, R. PTBP1 and PTBP2 impaired autoregulation of SRSF3 in cancer cells. Sci. Rep. 2015, 5, 14548. [Google Scholar] [CrossRef] [PubMed] [Green Version]
  18. Lin, J.C.; Tarn, W.Y. RBM4 down-regulates PTB and antagonizes its activity in muscle cell-specific alternative splicing. J. Cell Biol. 2011, 193, 509–520. [Google Scholar] [CrossRef] [PubMed] [Green Version]
  19. García-Casarrubios, E.; de Moura, C.; Arroba, A.I.; Pescador, N.; Calderon-Dominguez, M.; Garcia, L.; Herrero, L.; Serra, D.; Cadenas, S.; Reis, F.; et al. Rapamycin negatively impacts insulin signaling, glucose uptake and uncoupling protein-1 in brown adipocytes. Biochim. Biophys. Acta 2016, 1861, 1929–1941. [Google Scholar] [CrossRef] [PubMed] [Green Version]
  20. Guntur, K.V.; Guilherme, A.; Xue, L.; Chawla, A.; Czech, M.P. Map4k4 negatively regulates peroxisome proliferator-activated receptor (PPAR) gamma protein translation by suppressing the mammalian target of rapamycin (mTOR) signaling pathway in cultured adipocytes. J. Biol. Chem. 2010, 285, 6595–6603. [Google Scholar] [CrossRef] [PubMed]
  21. Yang, N.; Wang, Y.; Hui, L.; Li, X.; Jiang, X. Silencing SOX2 Expression by RNA Interference Inhibits Proliferation, Invasion and Metastasis, and Induces Apoptosis through MAP4K4/JNK Signaling Pathway in Human Laryngeal Cancer TU212 Cells. J. Histochem. Cytochem. 2015, 63, 721–733. [Google Scholar] [CrossRef] [PubMed] [Green Version]
  22. Vuong, J.K.; Lin, C.H.; Zhang, M.; Chen, L.; Black, D.L.; Zheng, S. PTBP1 and PTBP2 Serve Both Specific and Redundant Functions in Neuronal Pre-mRNA Splicing. Cell Rep. 2016, 17, 2766–2775. [Google Scholar] [CrossRef] [PubMed]
  23. Wright, J.H.; Wang, X.; Manning, G.; LaMere, B.J.; Le, P.; Zhu, S.; Khatry, D.; Flanagan, P.M.; Buckley, S.D.; Whyte, D.B.; et al. The STE20 kinase HGK is broadly expressed in human tumor cells and can modulate cellular transformation, invasion, and adhesion. Mol. Cell. Biol. 2003, 23, 2068–2082. [Google Scholar] [CrossRef] [PubMed]
  24. Su, Y.C.; Han, J.; Xu, S.; Cobb, M.; Skolnik, E.Y. NIK is a new Ste20-related kinase that binds NCK and MEKK1 and activates the SAPK/JNK cascade via a conserved regulatory domain. EMBO J. 1997, 16, 1279–1290. [Google Scholar] [CrossRef] [PubMed] [Green Version]
  25. Becker, E.; Huynh-Do, U.; Holland, S.; Pawson, T.; Daniel, T.O.; Skolnik, E.Y. Nck-interacting Ste20 kinase couples Eph receptors to c-Jun N-terminal kinase and integrin activation. Mol. Cell. Biol. 2000, 20, 1537–1545. [Google Scholar] [CrossRef] [PubMed]
  26. Tang, X.; Guilherme, A.; Chakladar, A.; Powelka, A.M.; Konda, S.; Virbasius, J.V.; Nicoloro, S.M.; Straubhaar, J.; Czech, M.P. An RNA interference-based screen identifies MAP4K4/NIK as a negative regulator of PPARgamma, adipogenesis, and insulin-responsive hexose transport. Proc. Natl. Acad. Sci. USA 2006, 103, 2087–2092. [Google Scholar] [CrossRef] [PubMed]
  27. Tesz, G.J.; Guilherme, A.; Guntur, K.V.; Hubbard, A.C.; Tang, X.; Chawla, A.; Czech, M.P. Tumor necrosis factor alpha (TNFalpha) stimulates Map4k4 expression through TNFalpha receptor 1 signaling to c-Jun and activating transcription factor 2. J. Biol. Chem. 2007, 282, 19302–19312. [Google Scholar] [CrossRef] [PubMed]
  28. Isakson, P.; Hammarstedt, A.; Gustafson, B.; Smith, U. Impaired preadipocyte differentiation in human abdominal obesity: Role of Wnt, tumor necrosis factor-alpha, and inflammation. Diabetes 2009, 58, 1550–1557. [Google Scholar] [CrossRef] [PubMed]
  29. Danai, L.V.; Guilherme, A.; Guntur, K.V.; Straubhaar, J.; Nicoloro, S.M.; Czech, M.P. Map4k4 suppresses Srebp-1 and adipocyte lipogenesis independent of JNK signaling. J. Lipid Res. 2013, 54, 2697–2707. [Google Scholar] [CrossRef] [PubMed] [Green Version]
  30. Roth Flach, R.J.; Danai, L.V.; DiStefano, M.T.; Kelly, M.; Menendez, L.G.; Jurczyk, A.; Sharma, R.B.; Jung, D.Y.; Kim, J.H.; Kim, J.K.; et al. Protein Kinase Mitogen-activated Protein Kinase Kinase Kinase Kinase 4 (MAP4K4) Promotes Obesity-induced Hyperinsulinemia. J. Biol. Chem. 2016, 291, 16221–16230. [Google Scholar] [CrossRef] [PubMed] [Green Version]
  31. Harhouri, K.; Navarro, C.; Depetris, D.; Mattei, M.G.; Nissan, X.; Cau, P.; De Sandre-Giovannoli, A.; Lévy, N. MG132-induced progerin clearance is mediated by autophagy activation and splicing regulation. EMBO Mol. Med. 2017, 9, 1294–1313. [Google Scholar] [CrossRef] [PubMed]
  32. Liu, B.; Bossing, T. Single neuron transcriptomics identify SRSF/SR protein B52 as a regulator of axon growth and Choline acetyltransferase splicing. Sci. Rep. 2016, 6, 34952. [Google Scholar] [CrossRef] [PubMed] [Green Version]
  33. Barbagallo, D.; Caponnetto, A.; Cirnigliaro, M.; Brex, D.; Barbagallo, C.; D’Angeli, F.; Morrone, A.; Caltabiano, R.; Barbagallo, G.M.; Ragusa, M.; et al. CircSMARCA5 Inhibits Migration of Glioblastoma Multiforme Cells by Regulating a Molecular Axis Involving Splicing Factors SRSF1/SRSF3/PTB. Int. J. Mol. Sci. 2018, 19, 480. [Google Scholar] [CrossRef] [PubMed]
  34. Sen, S.; Jumaa, H.; Webster, N.J. Splicing factor SRSF3 is crucial for hepatocyte differentiation and metabolic function. Nat. Commun. 2013, 4, 1336. [Google Scholar] [CrossRef] [PubMed] [Green Version]
  35. Jiang, H.; Zhang, S.; Song, T.; Guan, X.; Zhang, R.; Chen, X. Trichostatin a Protects Dendritic Cells against Oxygen-Glucose Deprivation via the SRSF3/PKM2/Glycolytic Pathway. Front. Pharmacol. 2018, 9, 612. [Google Scholar] [CrossRef] [PubMed]
Figure 1. Splicing profiles of mitogen-activated protein kinase kinase kinase kinase 4 (MAP4K4) and serine/arginine-rich splicing factor 3 (SRSF3) transcripts are reprogrammed during brown adipogenesis. (A) The schemes respectively present the exon composition of mouse MAP4K4 and SRSF3 transcripts. (B) Total RNAs prepared from embryonic (E13.5 and E15.5) and postnatal (P0) brown adipose tissues dissected from wild-type (WT) and RBM4a−/− mice (n = 4) were subjected to RT-PCR assays using specific primer sets as listed in Supplementary Table S1. The bar graph presents relative levels of the MAP4K4 Iso 4 and SRSF3+ex4 transcripts. (C) C3H1oT1/2 cells were respectively transfected with empty vector or the RBM4a targeting vector (sh-RBM4a), followed by culturing in growth medium and differentiating medium for 48 h. Total RNAs extracted from non-differentiating (0 day) and differentiating cells (2 day) were subjected to RT-PCR assays using indicated primer sets (n = 4). The bar graph shows relative levels of MAP4K4 Iso 4 and SRSF3+ex4 transcripts. Signal densities of the RT-PCR products were quantified using TotalLab Quant Software. Quantitative results are shown as the mean ± SD. Statistical significance was determined using Student’s unpaired t-test (* p < 0.05; ** p < 0.01; *** p < 0.005), N.D., No Difference.
Ijms 19 02646 g001
Figure 2. Overexpression of RNA-binding motif protein 4a (RBM4a) specifically reprograms splicing profiles of mitogen-activated protein kinase kinase kinase kinase 4 (MAP4K4) and serine/arginine-rich splicing factor 3 (SRSF3) transcripts. (A) Total RNAs and cell extracts were prepared from C3H10T1/2 cells respectively transfected with an expression vector encoding various SRSF family members or RBM4a, followed by culturing in growth medium for 24 h. (B) Total RNAs and cell extracts were isolated from C3H10T1/2 cells respectively transfected with an expression vector encoding wild-type (WT) RBM4a or the derived mutants, followed by culturing in growth medium for 24 h. (C) Total RNAs and cell lysates were extracted from C3H10T1/2 cells respectively transfected with an SRSF3-targeting vector, or expression vector encoding WT SRSF3 or the derived mutant, followed by culturing in growth medium for 24 h. Splicing profiles of MAP4K4 and SRSF3 transcripts were analyzed using RT-PCR assays with specific primer sets as listed in Supplementary Table S1. Immunoblot analyses were performed using specific antibodies against FLAG-tagged proteins, GAPDH, and SRSF3. The bar graph presents relative levels of MAP4K4 Iso 4 and SRSF3+ex4 transcripts in independent experiments (n = 4). Signal densities of the RT-PCR results were analyzed using TotalLab Quant Software, and quantitative results are shown as the mean ± SD (* p < 0.05; ** p < 0.01; *** p < 0.005), N.D., No Difference.
Ijms 19 02646 g002
Figure 3. Overexpression of RNA-binding motif protein 4a (RBM4a) leads to an upregulated level of serine/arginine-rich splicing factor 3 (SRSF3)+ex4 transcripts in a intronic CU element-dependent manner. (A) The diagram presents the sequence of CU elements (underlined) within mouse SRSF3 exon 4′ and the downstream intron. (B) C3H10T1/2 cells were respectively transfected with the wild-type (WT) SRSF3 reporter and derived mutants, followed by culturing in growth (0 day) or differentiating (2 day) medium (n = 4). (C) An empty vector, or RBM4a-expressing vector, or RBM4a-targeting vector were respectively co-transfected with the WT SRSF3 minigene or derived mutants into C3H10T1/2 cells (n = 4). Total RNAs and cell extracts were isolated and subjected to RT-PCR and immunoblotting assays using primer sets as listed in Supplementary Table S1 and specific antibodies. The bar graph shows relative levels of SRSF3+ex4 transcripts. Signal densities of the RT-PCR results were quantified using TotalLab Quant Software. Quantitative results are shown as the mean ± SD. Statistical significance was determined using Student’s unpaired t-test (* p < 0.05; ** p < 0.01; *** p < 0.005), N.D., No Difference.
Ijms 19 02646 g003
Figure 4. RNA-binding motif protein 4a (RBM4a) and serine/arginine-rich splicing factor 3 (SRSF3) discriminatively modulate the selection of mitogen-activated protein kinase kinase kinase kinase 4 (MAP4K4) exon 17 by interacting with distinct CU elements. (A) The scheme shows sequences of CU elements (underlined) within mouse MAP4K4 exon 17 and the downstream intron. (B) The wild-type (WT) MAP4K4 reporter and derived mutants were respectively transfected into C3H10T1/2 cells, followed by maintenance in growth (0 day) or differentiating (2 days) medium (n = 4). (C) The WT MAP4K4 reporter and derived mutants were respectively co-transfected with an expressing vector encoding RBM4a or SRSF3 into C3H10T1/2 cells. Total RNAs and cell extracts were prepared from transfected cells after 24 h and subjected to RT-PCR and immunoblotting assays with primer sets as listed in Supplementary Table S1 and specific antibodies (n = 4). The bar graph shows relative levels of MAP4K4−ex17 transcripts. Signal densities of the RT-PCR results were quantified using TotalLab Quant Software. Quantitative results are shown as the mean ± SD. Statistical significance was determined using Student’s unpaired t-test (* p < 0.05; ** p < 0.01; *** p < 0.005), N.D., No Difference.
Ijms 19 02646 g004aIjms 19 02646 g004b
Figure 5. Mitogen-activated protein kinase kinase kinase kinase 4 (MAP4K4) isoforms differentially manipulate activation of c-Jun N-terminal kinase (JNK) signaling throughout brown adipogenesis. (A) Cell extracts were prepared from embryonic or postnatal brown adipose tissues (BATs) or (B) in vitro cultured cells transfected with an RNA-binding motif protein 4a (RBM4a)-targeting vector, followed by culturing in growth or differentiating medium. (C) C3H10T1/2 cells were respectively transfected with an empty vector or expression vectors encoding MAP4K4 isoforms. The cells extracts were isolated after 24 h and subjected to immunoblot assays. (D) Cell extracts were isolated from FLAG-tagged MAP4K4 Iso-overexpressing cells, followed by incubation with anti-FLAG M2 agarose. Cell extracts and precipitated complexes were analyzed with immunoblot assays using indicated antibodies (n = 4).
Ijms 19 02646 g005
Figure 6. Mitogen-activated protein kinase kinase kinase kinase 4 (MAP4K4) isoforms and serine/arginine-rich splicing factor 3 (SRSF3) exhibit differential impacts on brown adipogenic gene expressions and metabolic signatures. (A,B) C3H10T1/2 cells were respectively transfected with an empty vector, expression vectors encoding MAP4K4 isoforms, or SRSF3-overexpressing or SRSF3-targeting vectors (n = 4). Total RNAs were prepared from transfected cells and subjected to qPCR assays with specific primer sets as listed in Supplementary Table S2. The bar graph shows relative levels of adipogenic genes normalized with the levels of Gapdh transcripts. (C,D) C3H10T1/2 cells were respectively transfected with an empty vector, expressing vectors encoding MAP4K4 isoforms, or SRSF3-overexpressing, or SRSF3-targeting vector, followed by culturing in growth medium for 24 h and then were subjected to bioenergetic analyses. The bar graph shows mean values of the basal and maximal oxygen consumption rates, and ATP production which were measured using a Seahorse XF24 Bioanalyzer (n = 4). Quantitative results are shown as the mean ± SD. Statistical significance was determined using Student’s unpaired t-test (* p < 0.05; ** p < 0.01; *** p < 0.005).
Ijms 19 02646 g006
Table 1. Distinct splicing and expression profiles of the mitogen-activated protein kinase kinase kinase kinase 4 (MAP4K4) and serine/arginine-rich splicing factor 3 (SRSF3) genes were characterized throughout development of brown adipose tissues (BATs). Results of transcriptome analyses were analyzed using the CLC genomics workbench (CLC, GWB) (n = 4). (A) Differential splicing and expression profiles of the MAP4K4 gene were identified in embryonic (E13.5) and postnatal (P0) BATs dissected from wild-type (WT) and RNA-binding motif protein 4a-depleted (RBM4a−/−) mice. (B) Discriminative splicing and expression profiles of the SRSF3 gene were identified by performing parallel experiments as described in (A). A percentage isoform index (PII) was applied to describe relative levels of indicated transcripts.
(A)
SampleSymbolAccession No.LocusLengthCoverageFPKMp-ValuePercentage Isoform Index (NM_001177995)
WT BAT (E13.5)PRDM16NM_001177995chr4:154316124-15463687384332.34351.951420.023135.18%
PRDM16NM_027504chr4:154316124-15463687386053.46593.595510.0347
RBM4a−/−
BAT (E13.5)
PRDM16NM_001177995chr4:154316124-154636873843301.69 × 10−50.0219<1%
PRDM16NM_027504chr4:154316124-15463687386054.359094.125310.0147
WT BAT (P0)PRDM16NM_001177995chr4:154316124-15463687384334.1124752.040780.0341>99%
PRDM16NM_027504chr4:154316124-154636873860502.71 × 10−50.0157
RBM4a−/−
BAT (P0)
PRDM16NM_001177995chr4:154316124-15463687384332.1024181.656390.026777.24%
PRDM16NM_027504chr4:154316124-15463687386051.1124250.4878910.0271
Percentage   Isoform   Index = Isoform   A Isoform   A + B × 100 % .
(B)
GeneLocusSample-1Sample-2FPKM-1FPKM-2Log 2 (Fold Change)p-Valueq-Value
PRDM16 (E13.5)chr4:154316124-154636873BAT-WTBAT- RBM4a−/−8.214126.213240.4030.03970.0455
PRDM16 (P0)chr4:154316124-154636873BAT-WTBAT- RBM4a−/−12.03657.547040.6740.02410.0361
p = 0.0207p > 0.05

