Combining TIR and FRET in Molecular Test Systems


 and
and 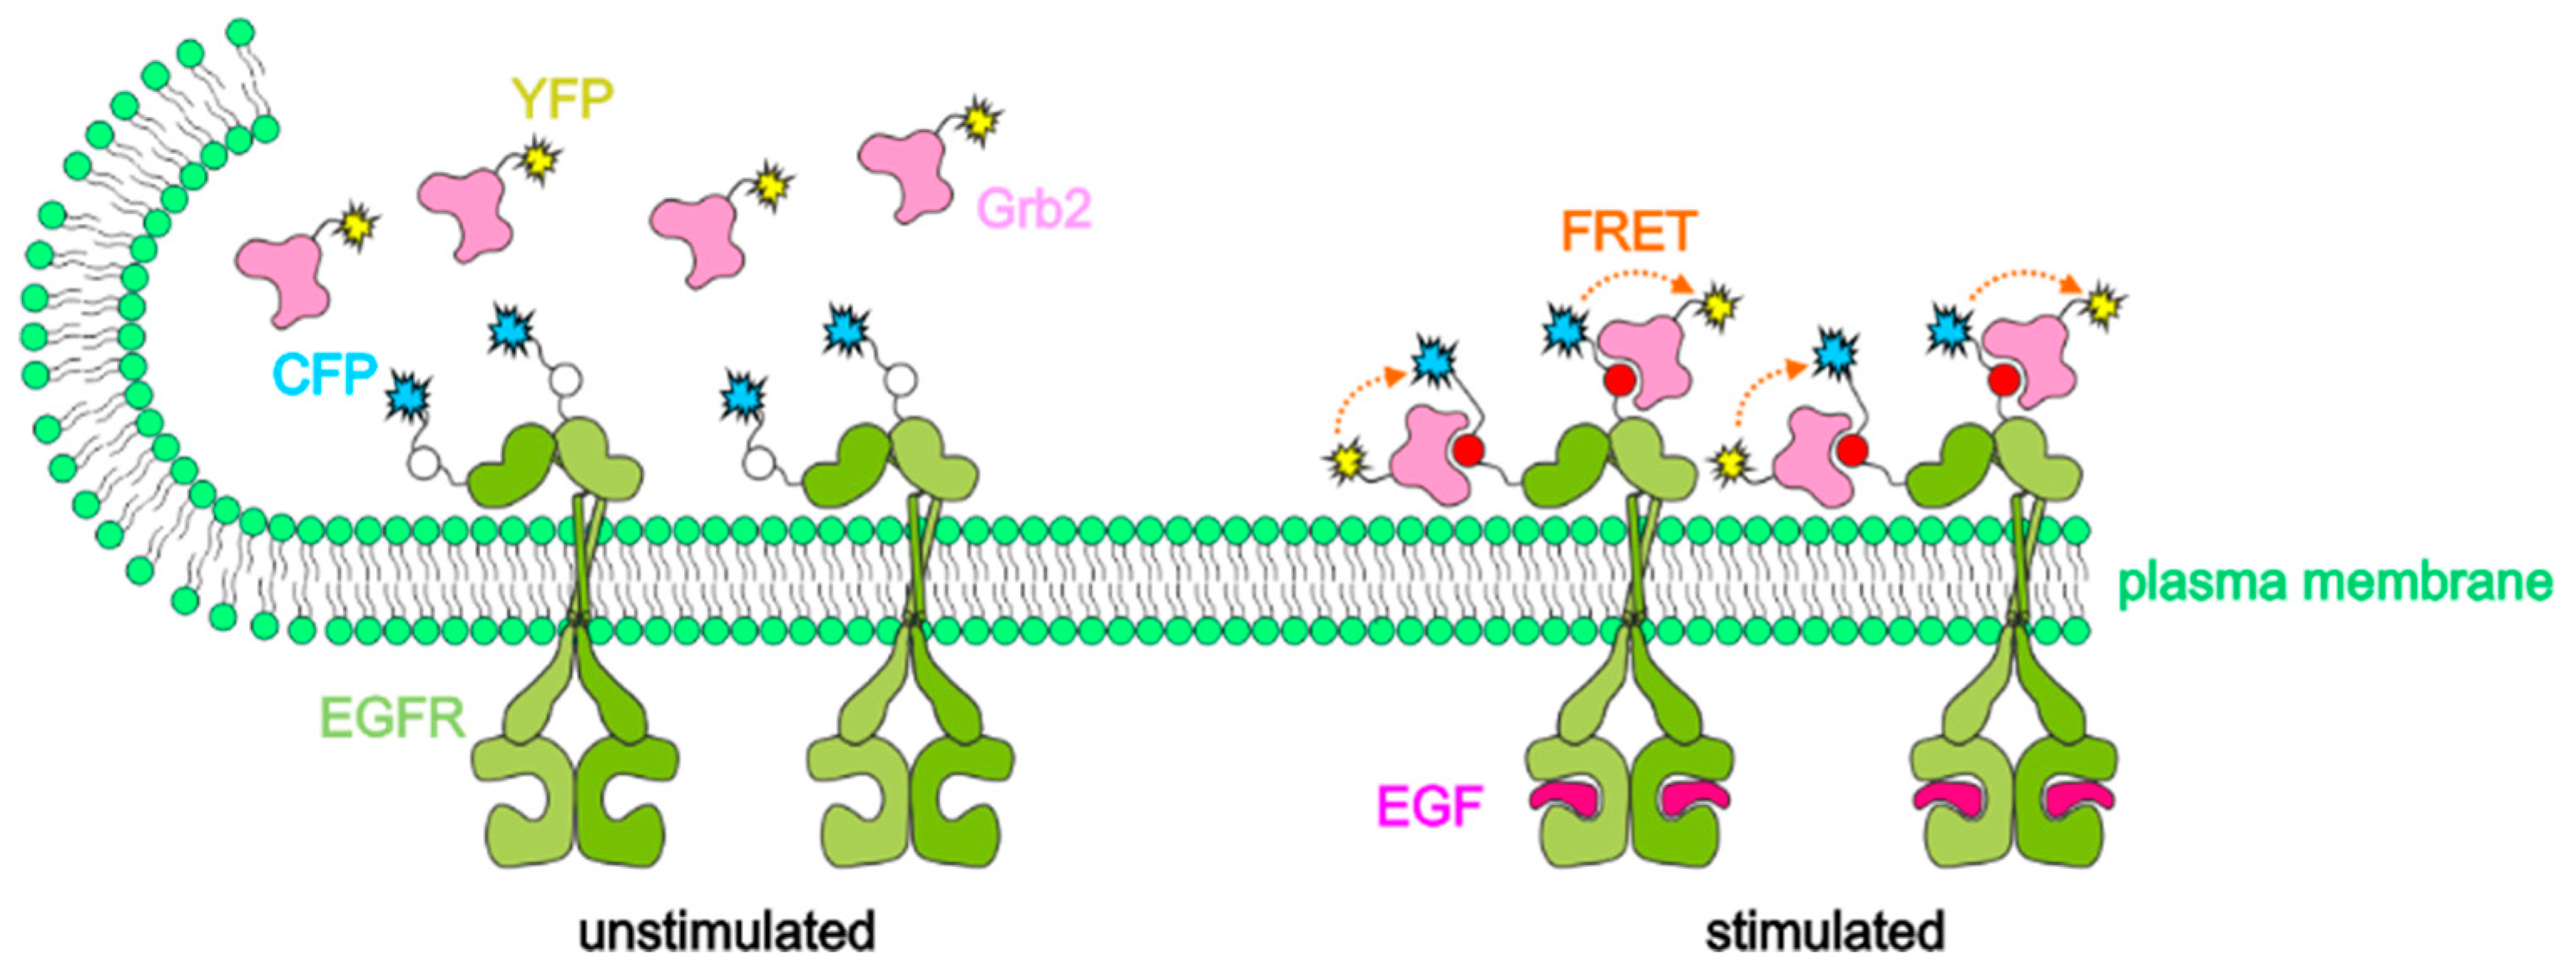
Abstract
:1. Introduction
2. Results
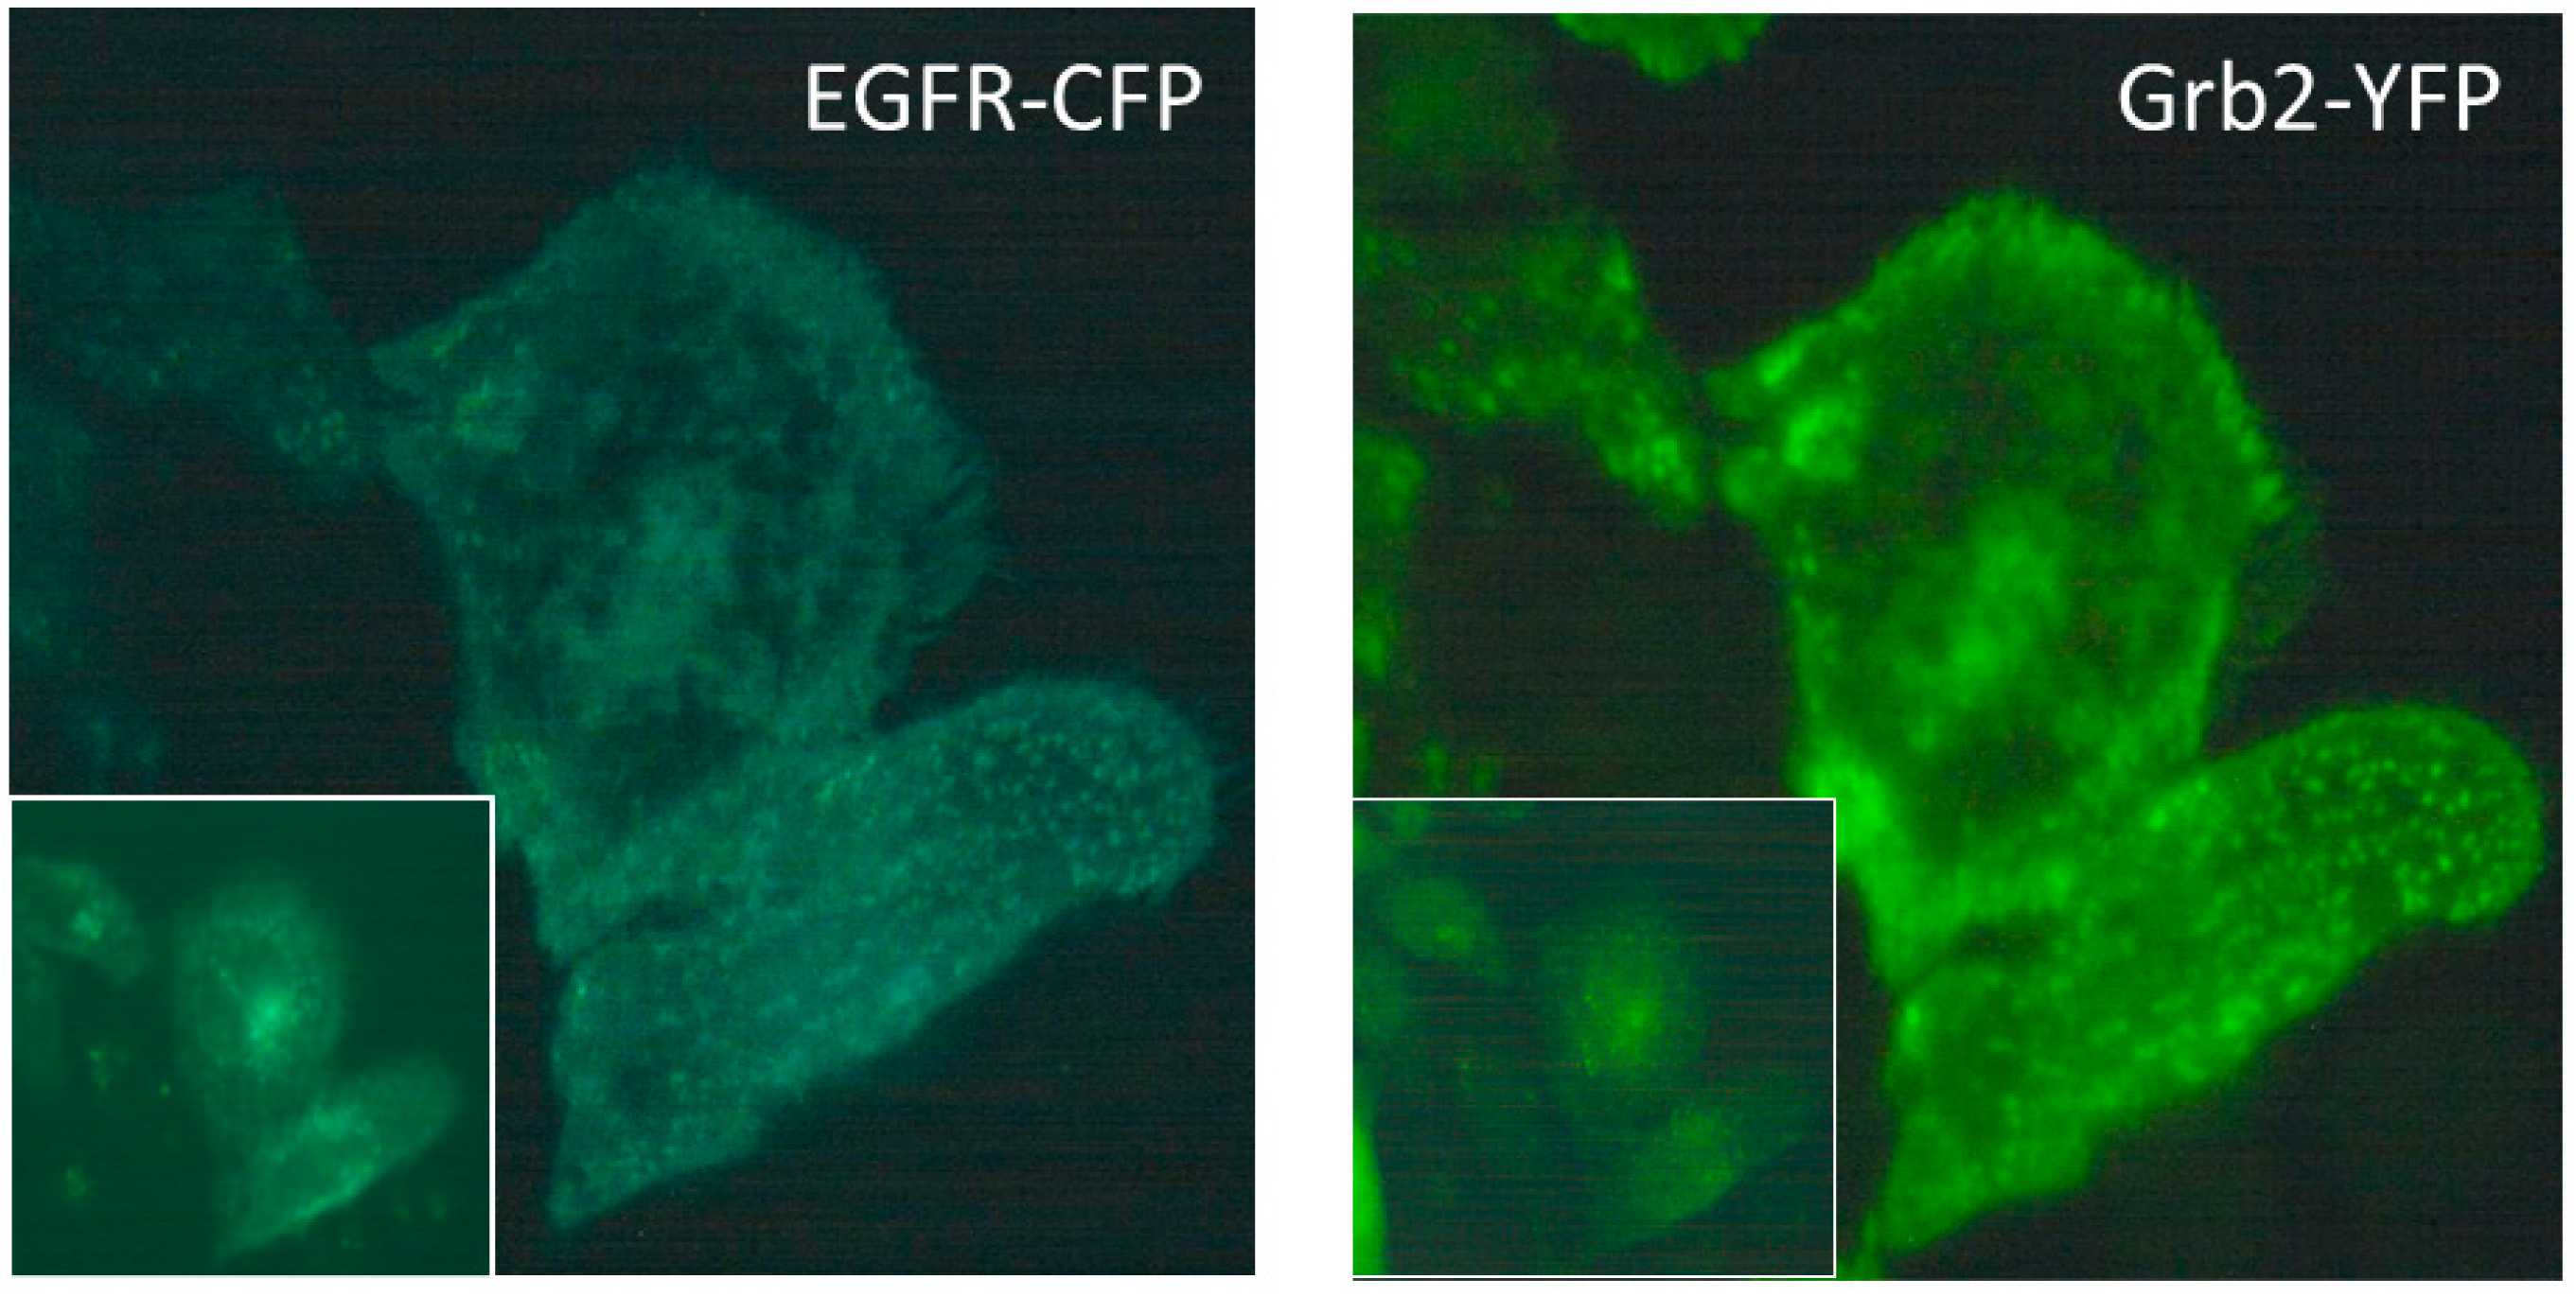
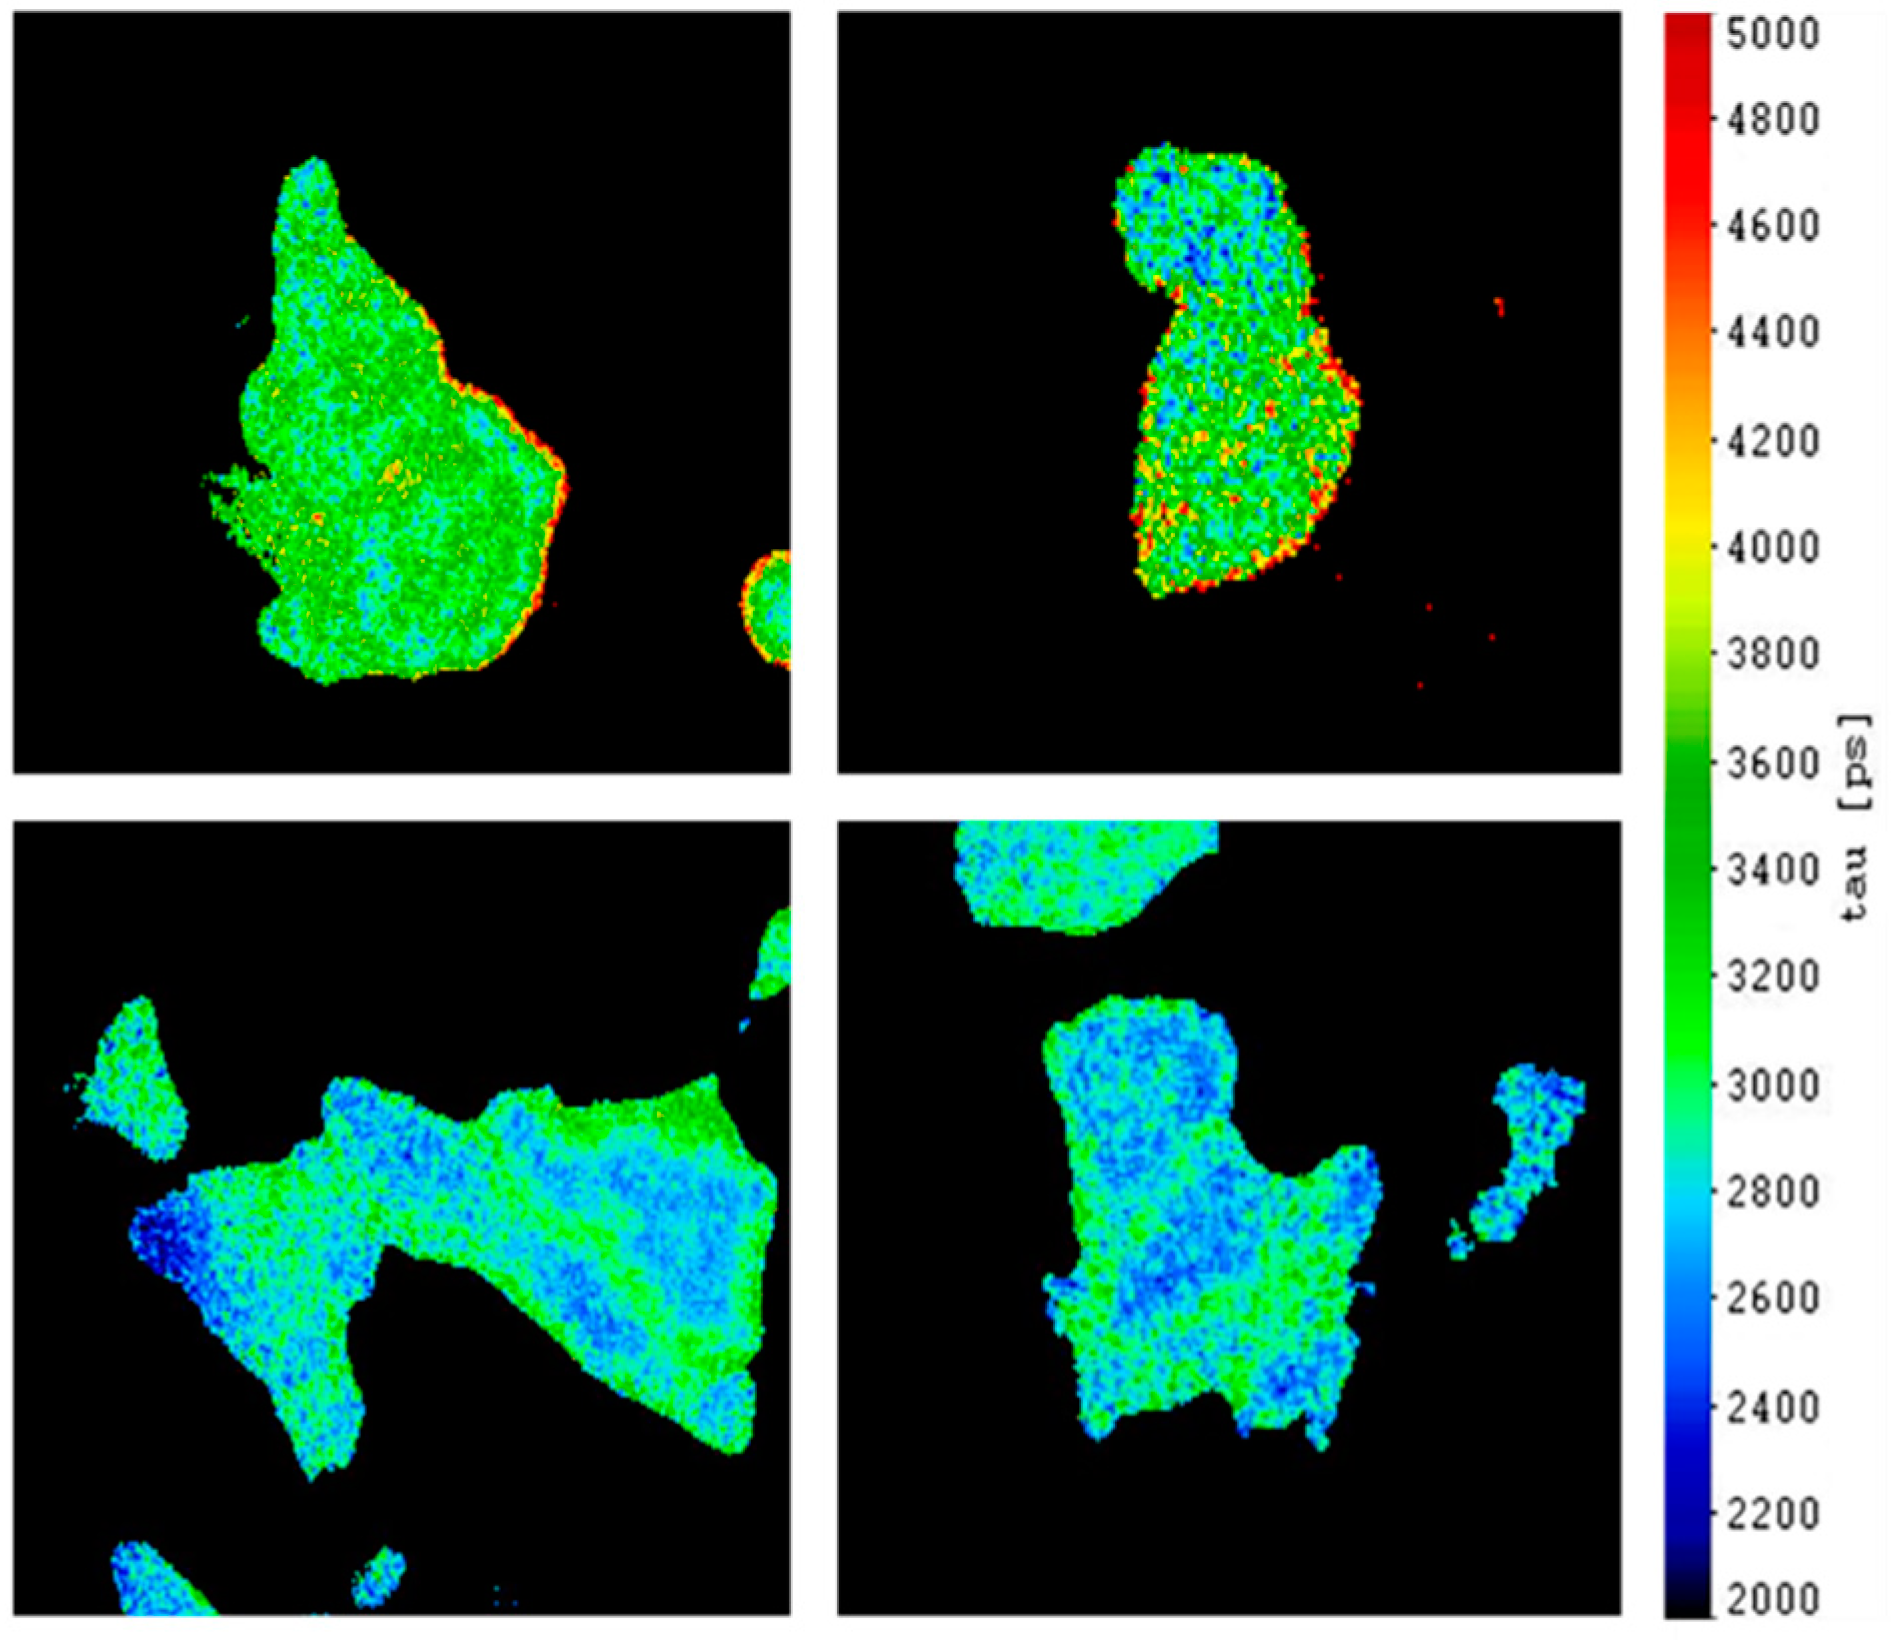
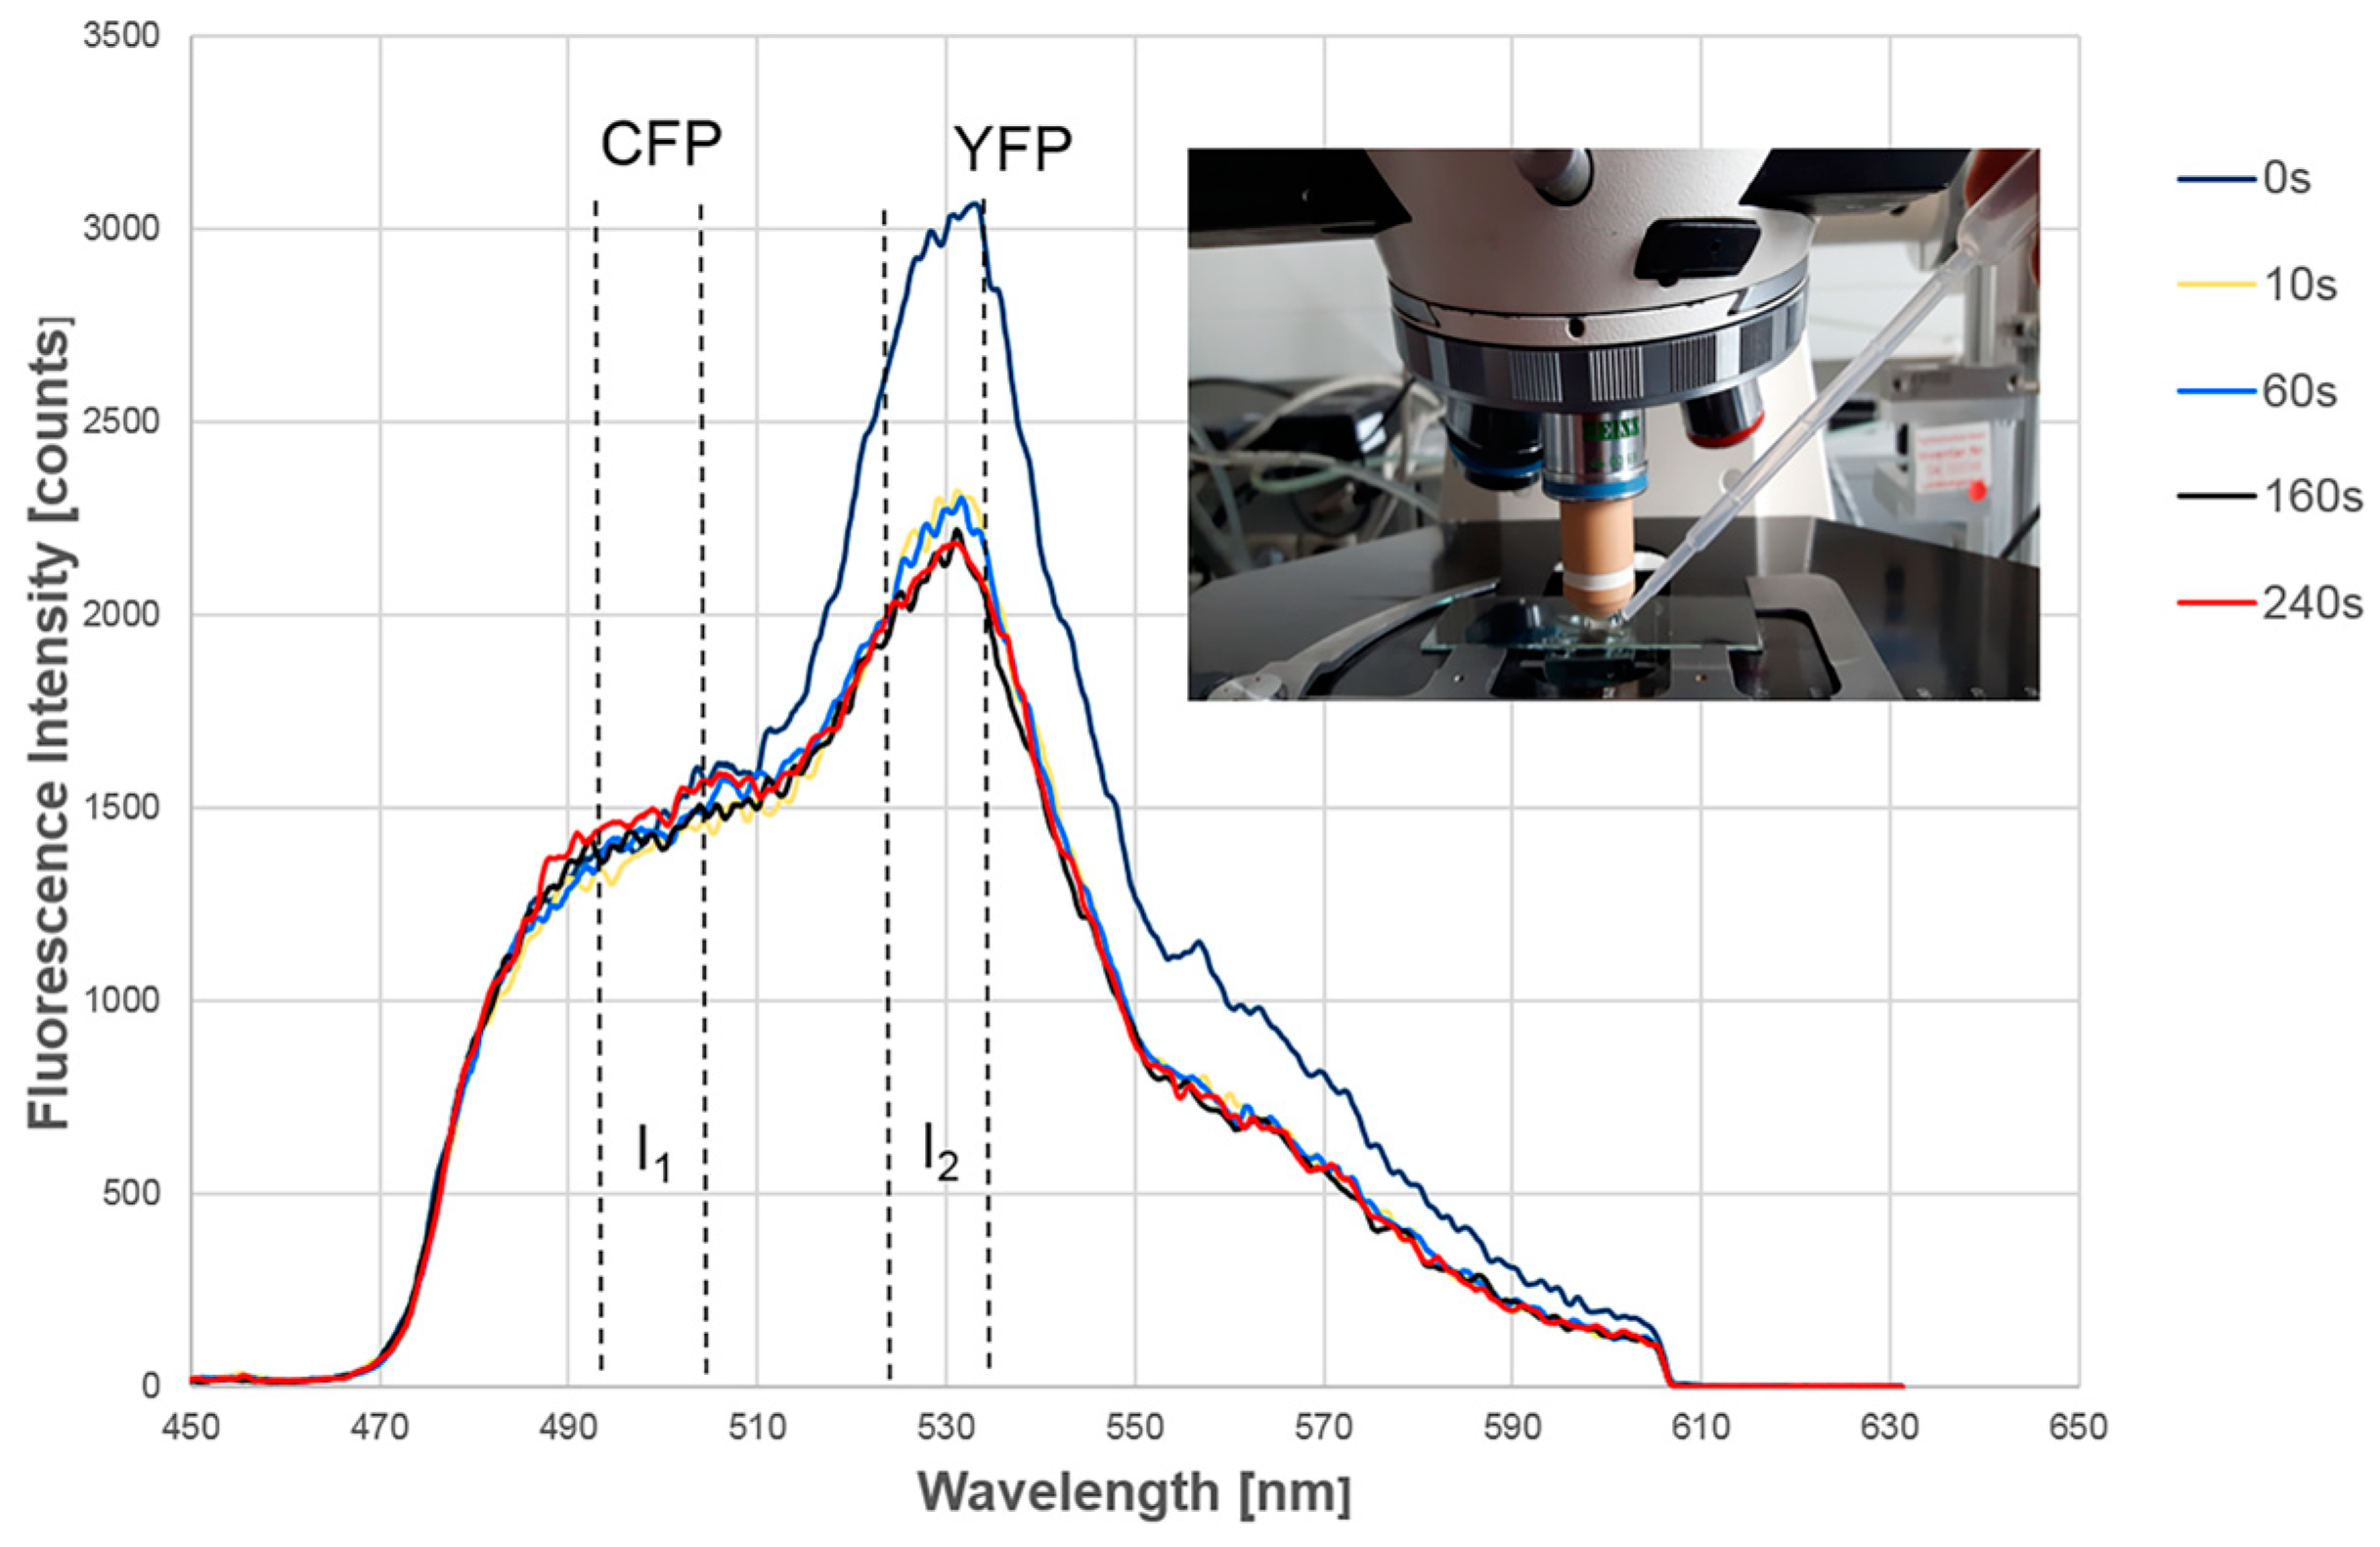
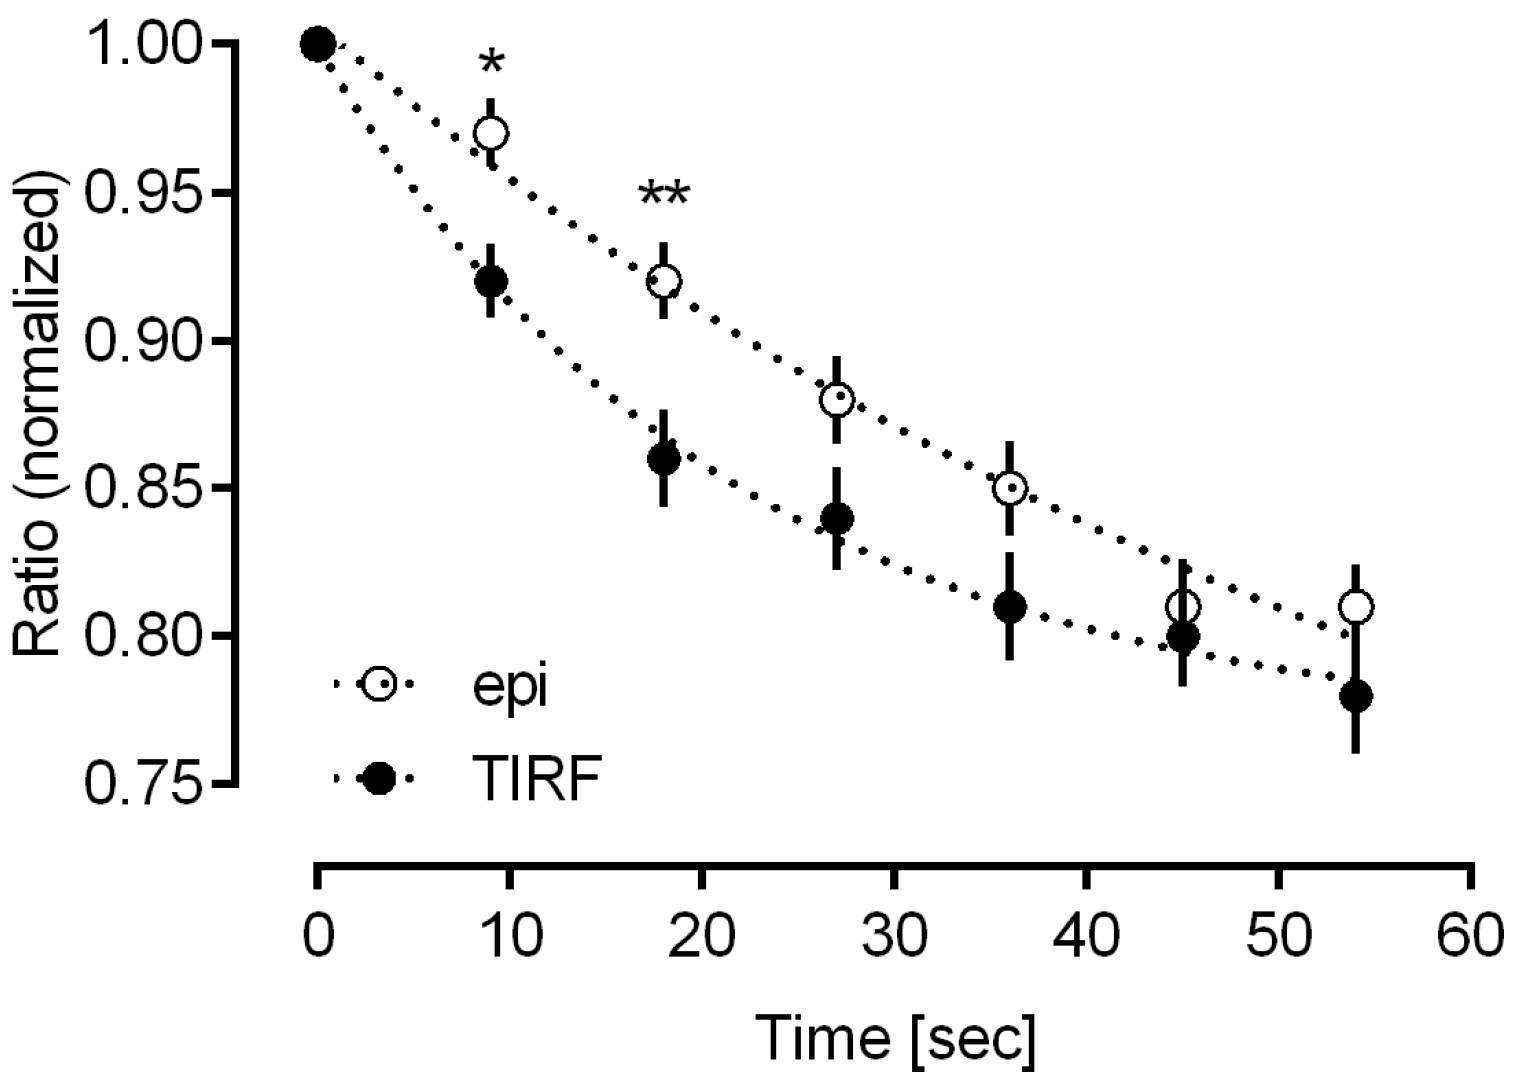
2.1. Intermolecular FRET between EGFR-CFP and Grb2-YFP
2.2. Intramolecular FRET within Epac-SH188 Biosensor
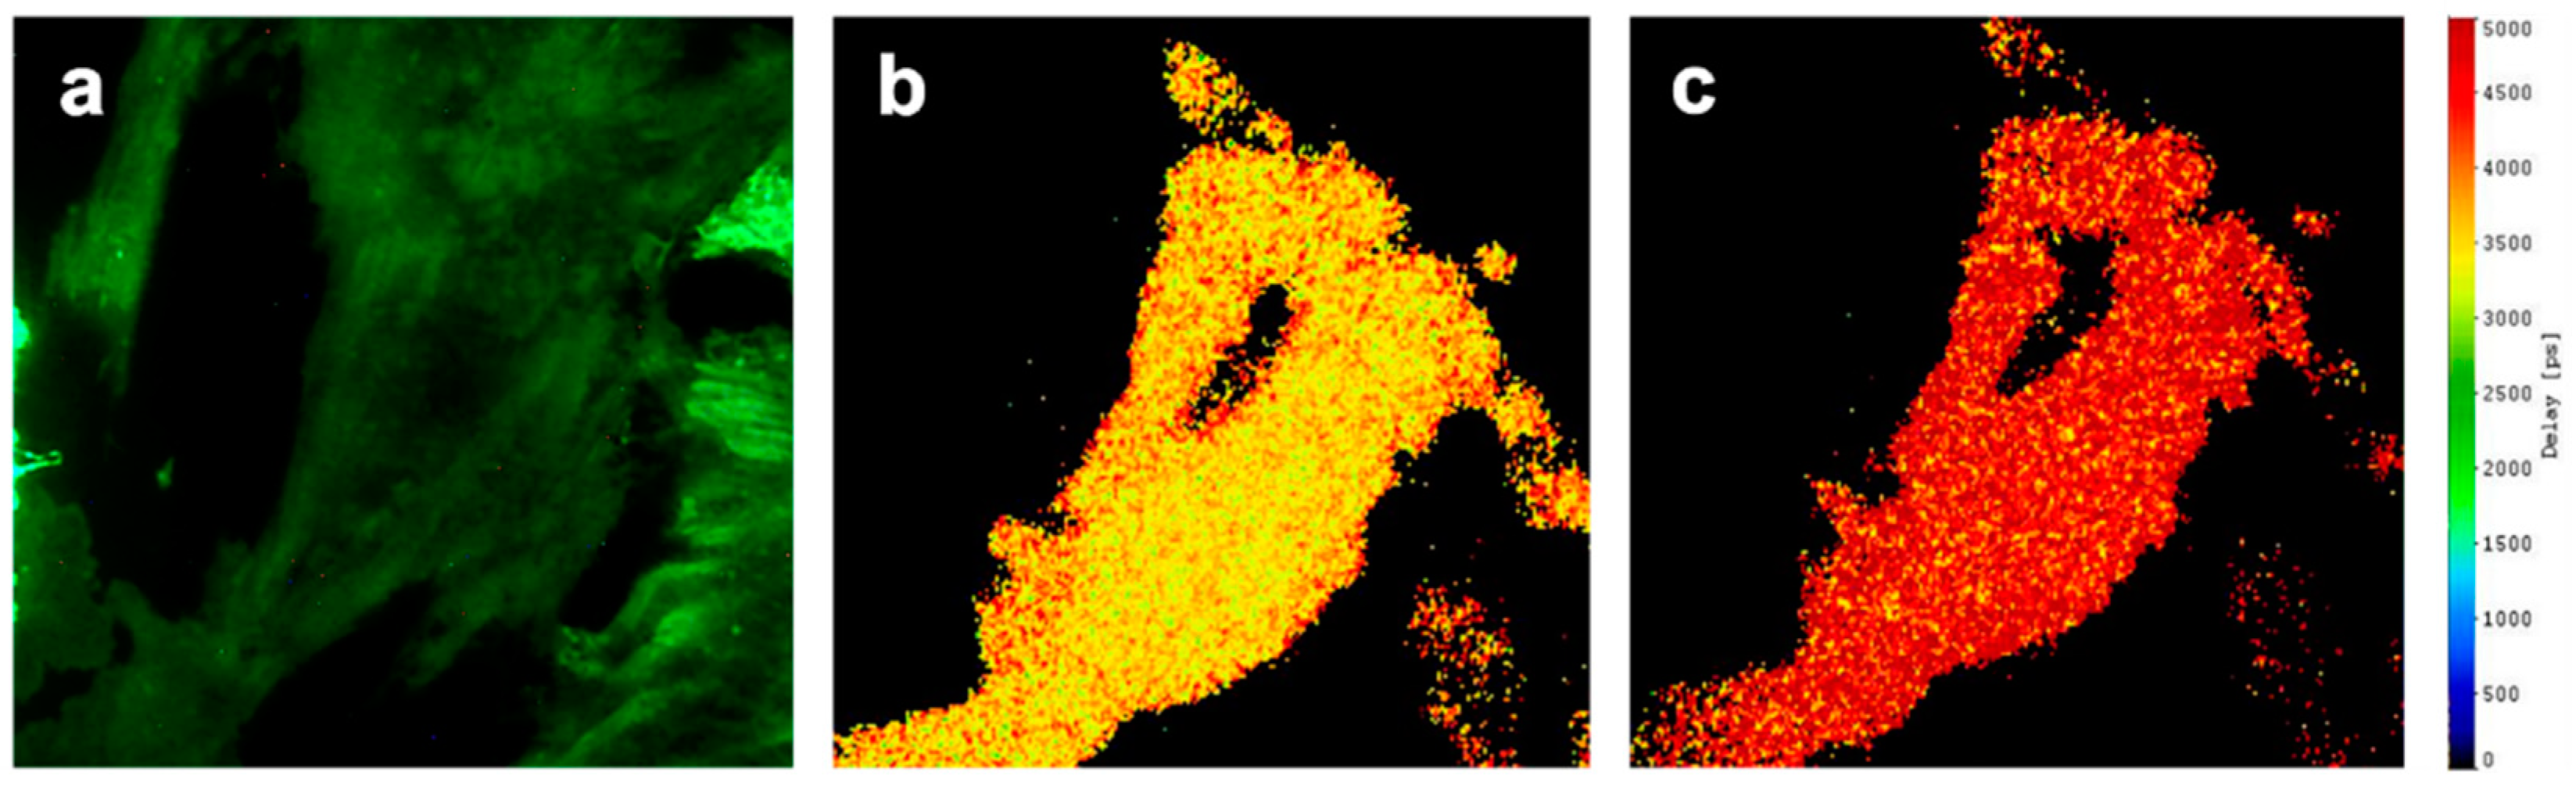
2.3. Intermolecular FRET in a HeLa hFR-GPI-GFP Test System Using Nile Red as an Energy Acceptor
3. Discussion
4. Materials and Methods
4.1. Recombinant Cell Lines and Cell Culture Conditions
4.2. Fluorescence Microscopy
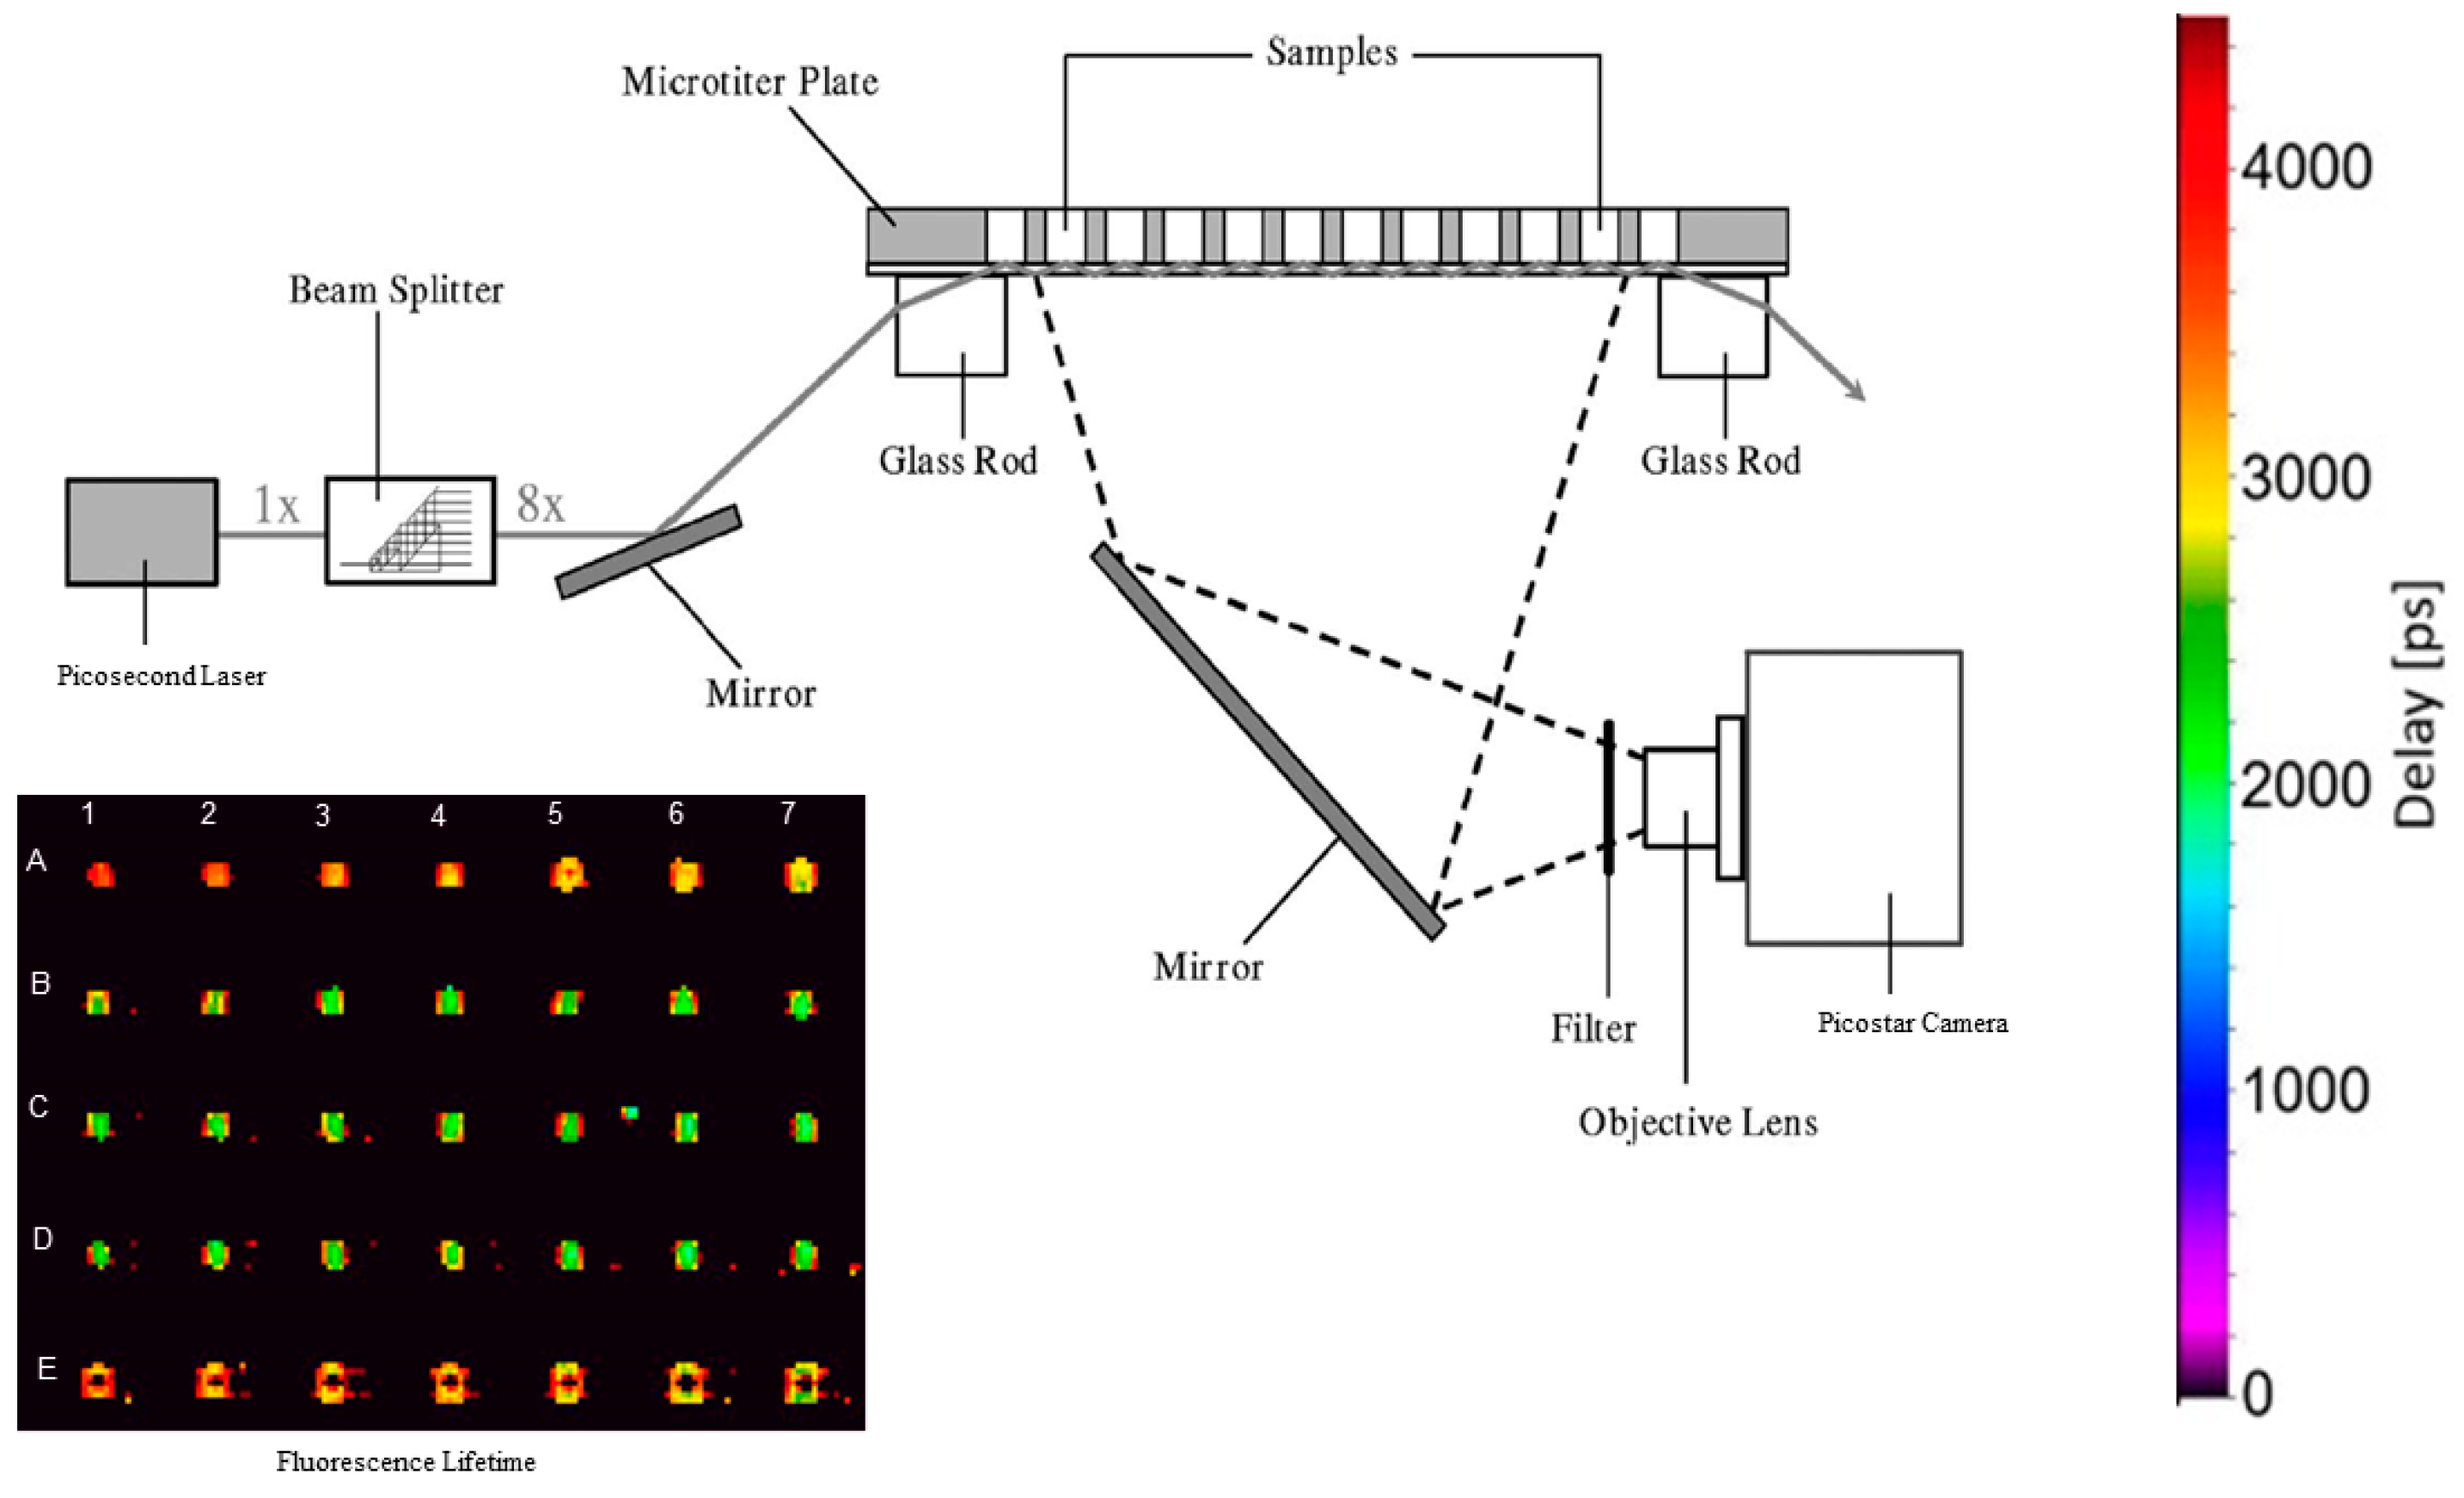
4.3. TIR Fluorescence Multi-Well Reader
4.4. Statistics
5. Conclusions
Author Contributions
Funding
Acknowledgments
Conflicts of Interest
References
- Förster, T. Zwischenmolekulare Energiewanderung und Fluoreszenz. Ann. Phys. 1948, 437, 55–75. [Google Scholar] [CrossRef] [Green Version]
- Angres, B.; Steuer, H.; Weber, P.; Wagner, M.; Schneckenburger, H. A membrane-bound FRET-based caspase sensor for detection of apoptosis using fluorescence lifetime and total internal reflection microscopy. Cytometry 2009, 75, 420–427. [Google Scholar] [CrossRef] [PubMed] [Green Version]
- Hochreiter, B.; Garcia, A.P.; Schmid, J.A. Fluorescent proteins as genetically encoded FRET biosensors in life sciences. Sensors 2015, 15, 26281–26314. [Google Scholar] [CrossRef] [PubMed]
- Conway, J.R.W.; Warren, S.C.; Timpson, P. Context-dependent intravital imaging of therapeutic response using intramolecular FRET biosensors. Methods 2017, 128, 78–94. [Google Scholar] [CrossRef] [PubMed]
- Halls, M.L.; Canals, M. Genetically encoded FRET biosensors to illuminate compartmentalized GPCR signaling. Trends Pharmacol. Sci. 2017. [Google Scholar] [CrossRef]
- Uster, P.S.; Pagano, R.E. Resonance energy transfer microscopy: Observations of membrane-bound fluorescent probes in model membranes and in living cells. J. Cell Biol. 1986, 103, 1221–1234. [Google Scholar] [CrossRef] [PubMed]
- Szöllösi, J.; Damjanovich, S.; Mulhern, S.A.; Tron, L. Fluorescence energy transfer and membrane potential measurements monitor dynamic properties of cell membranes: A critical review. Prog. Biophys. Molec. Biol. 1987, 49, 65–87. [Google Scholar] [CrossRef]
- Schneckenburger, H. Total internal reflection fluorescence microscopy: Technical innovations and novel applications. Curr. Opin. Biotechnol. 2005, 16, 13–18. [Google Scholar] [CrossRef]
- Bierbower, S.M.; Shapiro, M.S. Förster resonance energy transfer-based imaging at the cell surface of live cells. Methods Mol. Biol. 2013, 998, 209–216. [Google Scholar] [CrossRef]
- Lin, J.; Hoppe, A.D. Uniform total internal reflection fluorescence illumination enables live cell fluorescence resonance energy transfer microscopy. Microsc. Microanal. 2013, 19, 350–359. [Google Scholar] [CrossRef]
- Schütz, G.J.; Huppa, J.B. Förster Resonance Energy Transfer to Study TCR-pMHC Interactions in the Immunological Synapse. Methods Mol. Biol. 2017, 1584, 207–229. [Google Scholar] [CrossRef] [PubMed]
- Bal, M.; Zaika, O.; Martin, P.; Shapiro, M.S. Calmodulin binding to M-type K+ channels assayed by TIRF/FRET in living cells. J. Physiol. 2008, 586, 2307–2320. [Google Scholar] [CrossRef] [PubMed]
- Yamamura, H.; Suzuki, Y.; Imaizumi, Y. New light on ion channel imaging by total internal reflection fluorescence (TIRF) microscopy. J. Pharmacol. Sci. 2015, 128, 1–7. [Google Scholar] [CrossRef] [PubMed] [Green Version]
- von Arnim, C.A.F.; von Einem, B.; Weber, P.; Wagner, M.; Schwanzar, D.; Spoelgen, R.; Strauss, W.S.L.; Schneckenburger, H. Impact of cholesterol level upon APP and BACE proximity and APP cleavage. Biochem. Biophys. Res. Commun. 2008, 370, 207–212. [Google Scholar] [CrossRef] [PubMed]
- Masi, A.; Cicchi, R.; Carloni, A.; Pavone, F.S.; Arcangeli, A. Optical methods in the study of protein-protein interactions. Adv. Exp. Med. Biol. 2010, 674, 33–42. [Google Scholar] [PubMed]
- Lam, A.D.; Ismail, S.; Wu, R.; Yizhar, O.; Passmore, D.R.; Ernst, S.A.; Steunkel, E.L. Mapping dynamic protein interactions to insulin secretory granule behavior with TIRF-FRET. Biophys. J. 2010, 99, 1311–1320. [Google Scholar] [CrossRef] [PubMed]
- Fernández-Dueñas, V.; Llorente, J.; Gandía, J.; Borroto-Escuela, D.O.; Agnati, L.F.; Tasca, C.I.; Fuxe, K.; Ciruela, F. Fluorescence resonance energy transfer-based technologies in the study of protein-protein interactions at the cell surface. Methods 2012, 57, 467–472. [Google Scholar] [CrossRef]
- Hildebrandt, L.L.; Preus, S.; Birkedal, V. Quantitative single molecule FRET efficiencies using TIRF microscopy. Faraday Discuss. 2015, 184, 131–142. [Google Scholar] [CrossRef]
- Gauer, J.W.; LeBlanc, S.; Hao, P.; Qiu, R.; Case, B.C.; Sakato, M.; Hingorani, M.M.; Erie, D.A.; Weninger, K.R. Single-Molecule FRET to Measure Conformational Dynamics of DNA Mismatch Repair Proteins. Methods Enzymol. 2016, 581, 285–315. [Google Scholar] [CrossRef] [Green Version]
- Castell, O.K.; Dijkman, P.M.; Wiseman, D.N.; Goddard, A.D. Single molecule fluorescence for membrane proteins. Methods 2018, 147, 221–228. [Google Scholar] [CrossRef]
- Grewal, T.; Enrich, C. Annexins—Modulators of EGF receptor signalling and trafficking. Cell Signal 2009, 21, 847–858. [Google Scholar] [CrossRef] [PubMed]
- Normanno, N.; De Luca, A.; Bianco, C.; Strizzi, L.; Mancino, M.; Maiello, M.R.; Carotenuto, A.; De Feo, G.; Caponigro, F.; Salomon, D.S. Epidermal growth factor receptor (EGFR) signalling in cancer. Gene 2006, 366, 2–16. [Google Scholar] [CrossRef] [PubMed]
- Seshacharyulu, P.; Ponnusamy, M.P.; Haridas, D.; Jain, M.; Ganti, A.K.; Batra, S.K. Targeting the EGFR signalling pathway in cancer therapy. Expert Opin. Ther. Targets 2012, 16, 15–31. [Google Scholar] [CrossRef] [PubMed]
- Sorkin, A.; McClure, M.; Huang, F.; Carter, R. Interaction of EGF receptor and Grb2 in living cells visualized by fluorescence resonance energy transfer (FRET) microscopy. Curr. Biol. 2000, 10, 1395–1398. [Google Scholar] [CrossRef] [Green Version]
- Poland, S.P.; Krstajic, N.; Monypenny, J.; Coelho, S.; Tyndall, D.; Walker, R.J.; Devuages, V.; Richardson, J.; Dutton, N.; Barber, P.; et al. A high speed multifocal multiphoton fluorescence lifetime imaging microscope for live-cell FRET imaging. Biomed. Opt. Express 2015, 6, 277–296. [Google Scholar] [CrossRef]
- Lanzerstorfer, P.; Borgmann, D.; Schütz, G.; Winkler, S.M.; Höglinger, O.; Weghuber, J. Quantification and kinetic analysis of Grb2-EGFR interaction on micro-patterned surfaces for the characterization of EGFR-modulating substances. PLoS ONE 2014, 9, e92151. [Google Scholar] [CrossRef]
- Nikolaev, V.O.; Bünemann, M.; Hein, N.; Hannawacker, A.; Lohse, M.J. Novel single chain cAMP sensors for receptor-induced signal propagation. J. Biol. Chem. 2004, 279, 37251–37258. [Google Scholar] [CrossRef]
- Klarenbeek, J.; Goedhart, J.; van Batenburg, A.; Groenewald, D.; Jalink, K. Fourth-generation epac-based FRET sensors for cAMP feature exceptional brightness, photostability and dynamic range: Characterization of dedicated sensors for FLIM, for ratiometry and with high affinity. PLoS ONE 2015, 10, e0122513. [Google Scholar] [CrossRef]
- Weghuber, J.; Aichinger, M.C.; Brameshuber, M.; Wieser, S.; Ruprecht, V.; Plochberger, B.; Madl, J.; Horner, A.; Reipert, S.; Lohner, K.; et al. Cationic amphipatic peptides accumulate sialylated proteins and lipids in the plasma membrane of eukaryotic host cells. Biochim. Biophys. Acta 2011, 1808, 2581–2590. [Google Scholar] [CrossRef]
- Goedhart, J.; von Stettem, D.; Noirclerc-Savoye, M.; Lelimousin, L.; Hink, M.A.; van Weeren, L.; Gadella, T.W., Jr.; Royant, A. Structure-guided evolution of cyan fluorescent proteins towards a quantum yield of 93%. Nat. Commun. 2012, 3, 751. [Google Scholar] [CrossRef]
- Enderle, S. Spektroskopische Methoden an Membranen lebender Zellen. Bachelor’s Thesis, Aalen University, Aalen, Germany, 2018. [Google Scholar]
- Sytnik, A.I.; Chumachenko, Y.V.; Demchenko, A.P. Spectroscopic evidence for NADH-induced conformational changes in rabbit muscle aldolase. Biochim. Biophys. Acta 1991, 1079, 123–127. [Google Scholar] [CrossRef]
- Maltas, J.; Amer, L.; Long, Z.; Palo, D.; Oliva, A.; Folz, J.; Urayama, P. Autofluorescence from NADH Conformations Associated with Different Metabolic Pathways Monitored Using Nanosecond-Gated Spectroscopy and Spectral Phasor Analysis. Anal. Chem. 2015, 87, 5117–5124. [Google Scholar] [CrossRef] [PubMed]
- Schneckenburger, H.; Weber, P.; Wagner, M.; Schickinger, S.; Richter, V.; Bruns, T.; Strauss, W.S.L.; Wittig, R. Light exposure and cell viability in fluorescence microscopy. J. Microsc. 2012, 245, 311–318. [Google Scholar] [CrossRef] [PubMed]
- Alibhai, D.; Kelly, D.J.; Warren, S.; Kumar, S.; Margineau, A.; Serwa, R.A.; Thinon, E.; Alexandrov, Y.; Murray, E.J.; Stuhmeier, F.; et al. Automated fluorescence lifetime imaging plate reader and its application to Förster resonant energy transfer readout of Gag protein aggregation. J. Biophotonics 2013, 6, 398–408. [Google Scholar] [CrossRef] [PubMed]
- Petersen, K.J.; Peterson, K.C.; Muretta, J.M.; Higgins, S.E.; Gillispie, G.D.; Thomas, D.D. Fluorescence lifetime plate reader: Resolution and precision meet high-throughput. Rev. Sci. Inst. 2014, 85, 113101. [Google Scholar] [CrossRef] [PubMed] [Green Version]
- Bruns, T.; Strauss, W.S.L.; Sailer, R.; Wagner, M.; Schneckenburger, H. Total internal reflectance fluorescence reader for selective investigations of cell membranes. J. Biomed. Opt. 2006, 11, 34011. [Google Scholar] [CrossRef] [PubMed]
- Bruns, T.; Angres, B.; Steuer, H.; Weber, P.; Wagner, M.; Schneckenburger, H. A FRET-based total internal reflection (TIR) fluorescence reader for apoptosis. J. Biomed. Opt. 2009, 14, 021003. [Google Scholar] [CrossRef]
- Yagublu, V.; Ahmadova, Z.; Hajiyeva, Y.; Hafner, M.; Keese, M. Combination of the EGFR tyrosine kinase inhibitor AG1478 and 5-FU: No synergistic effect on EGFR phosphorylation, cell proliferation and apoptosis induction. Anticancer Res. 2013, 33, 3753–3758. [Google Scholar]
- Itoh, R.E.; Kurokawa, K.; Fujioka, A.; Sharma, A.; Mayer, B.J.; Matsuda, M. A FRET-based probe for epidermal growth factor receptor bound non-covalently to a pair of synthetic amphipathic helixes. Exp. Cell Res. 2005, 307, 142–152. [Google Scholar] [CrossRef]
- Schneckenburger, H.; Stock, K.; Lyttek, M.; Strauss, W.S.L.; Sailer, R. Fluorescence lifetime imaging (FLIM) of rhodamine 123 in living cells. Photochem. Photobiol. Sci. 2004, 3, 127–131. [Google Scholar] [CrossRef]


© 2019 by the authors. Licensee MDPI, Basel, Switzerland. This article is an open access article distributed under the terms and conditions of the Creative Commons Attribution (CC BY) license (http://creativecommons.org/licenses/by/4.0/).
Share and Cite
Schneckenburger, H.; Weber, P.; Wagner, M.; Enderle, S.; Kalthof, B.; Schneider, L.; Herzog, C.; Weghuber, J.; Lanzerstorfer, P. Combining TIR and FRET in Molecular Test Systems. Int. J. Mol. Sci. 2019, 20, 648. https://0-doi-org.brum.beds.ac.uk/10.3390/ijms20030648
Schneckenburger H, Weber P, Wagner M, Enderle S, Kalthof B, Schneider L, Herzog C, Weghuber J, Lanzerstorfer P. Combining TIR and FRET in Molecular Test Systems. International Journal of Molecular Sciences. 2019; 20(3):648. https://0-doi-org.brum.beds.ac.uk/10.3390/ijms20030648
Chicago/Turabian StyleSchneckenburger, Herbert, Petra Weber, Michael Wagner, Sandra Enderle, Bernd Kalthof, Linn Schneider, Claudia Herzog, Julian Weghuber, and Peter Lanzerstorfer. 2019. "Combining TIR and FRET in Molecular Test Systems" International Journal of Molecular Sciences 20, no. 3: 648. https://0-doi-org.brum.beds.ac.uk/10.3390/ijms20030648