Soil Application of Effective Microorganisms (EM) Maintains Leaf Photosynthetic Efficiency, Increases Seed Yield and Quality Traits of Bean (Phaseolus vulgaris L.) Plants Grown on Different Substrates

 ,
,  ,
,  , and
, and
Abstract
:1. Introduction
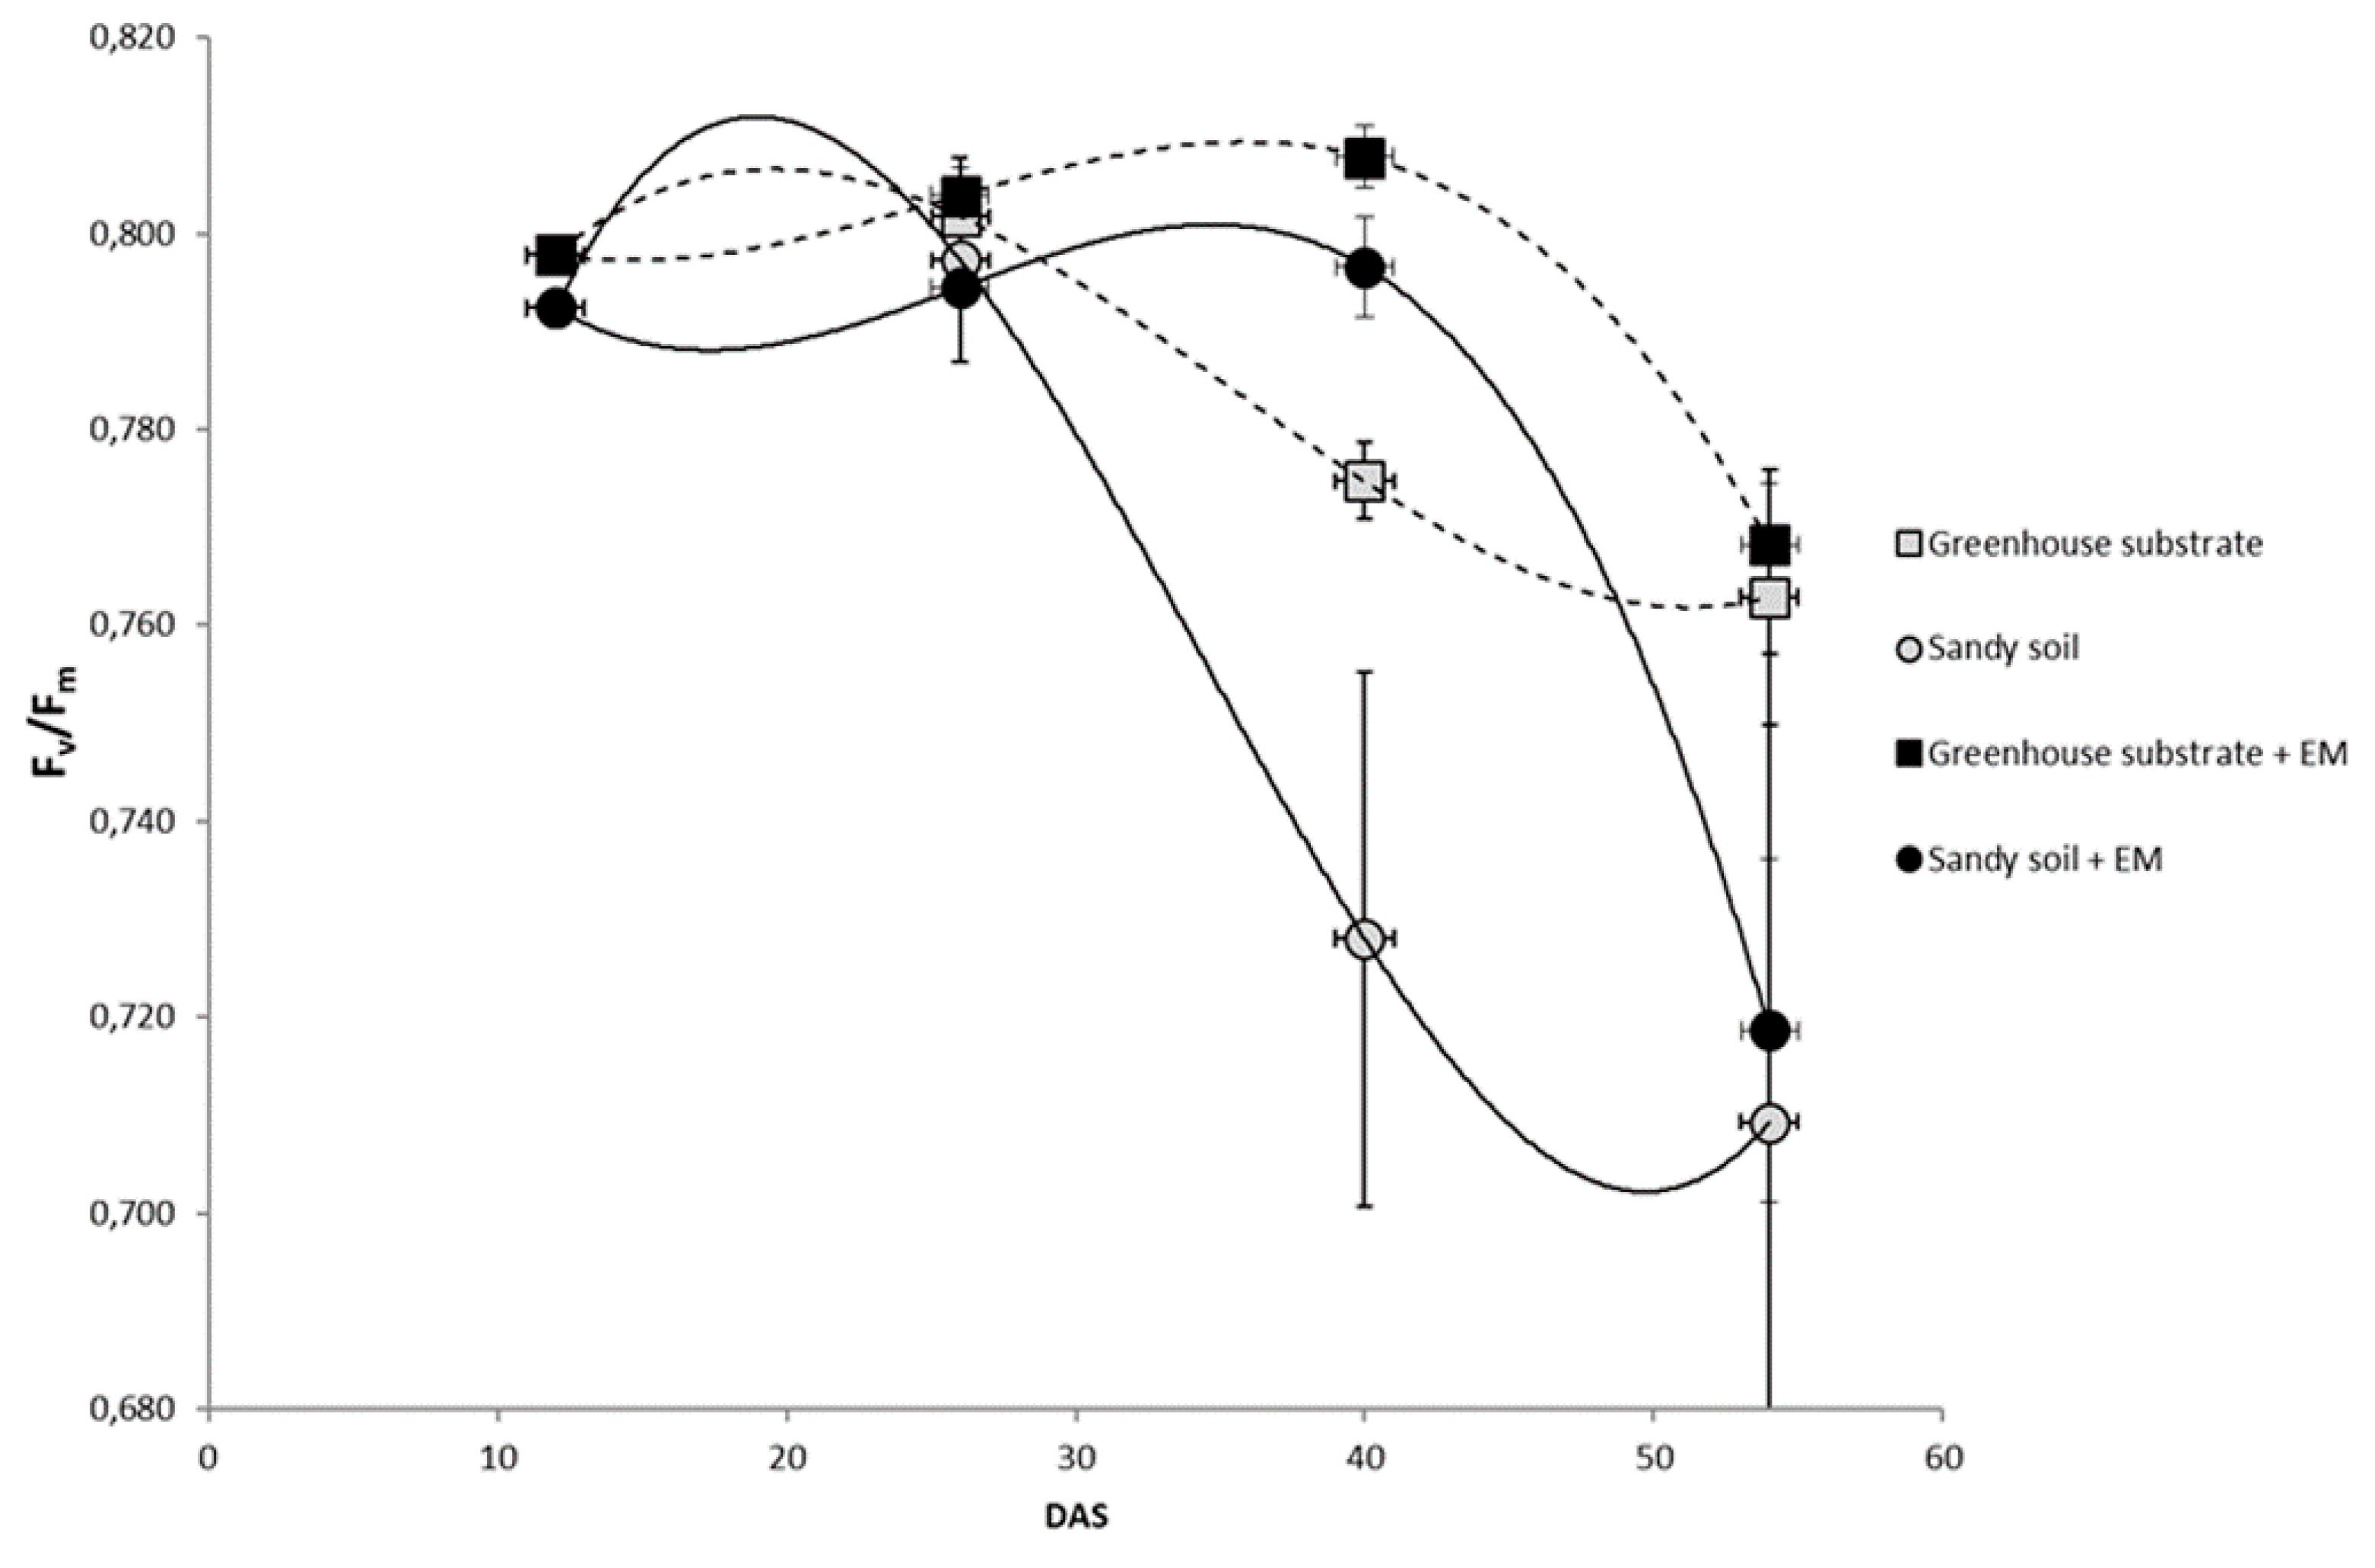
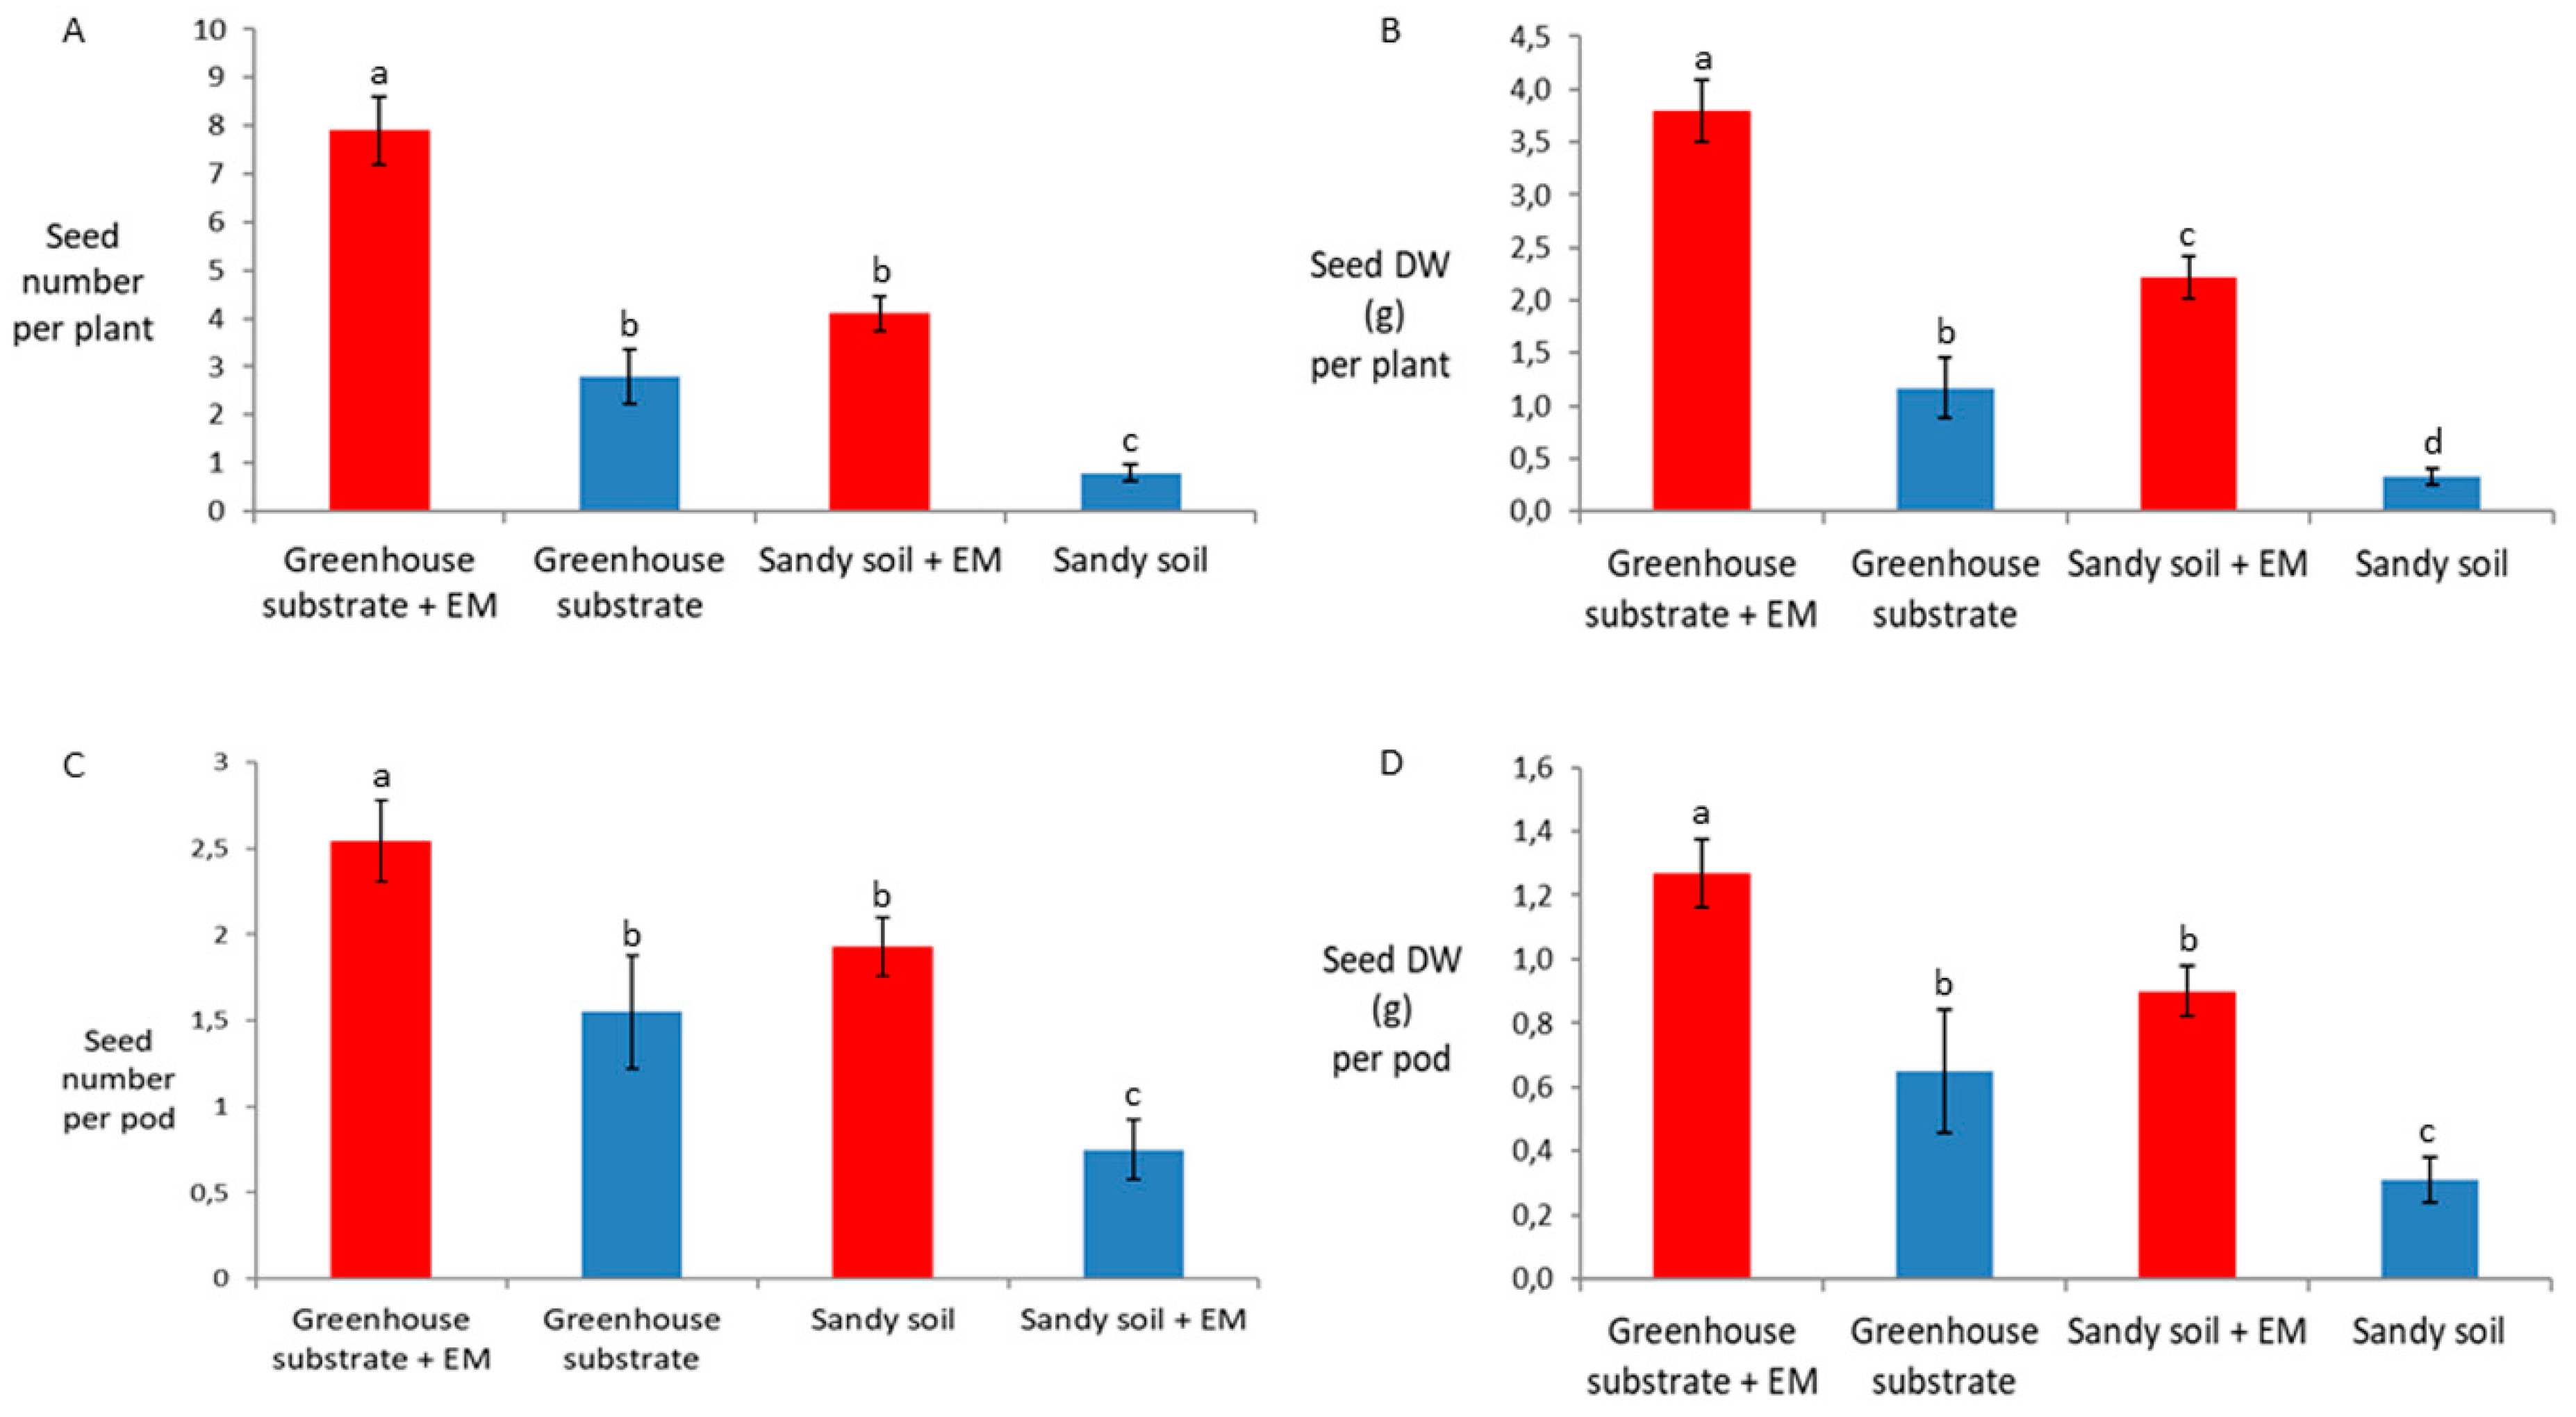
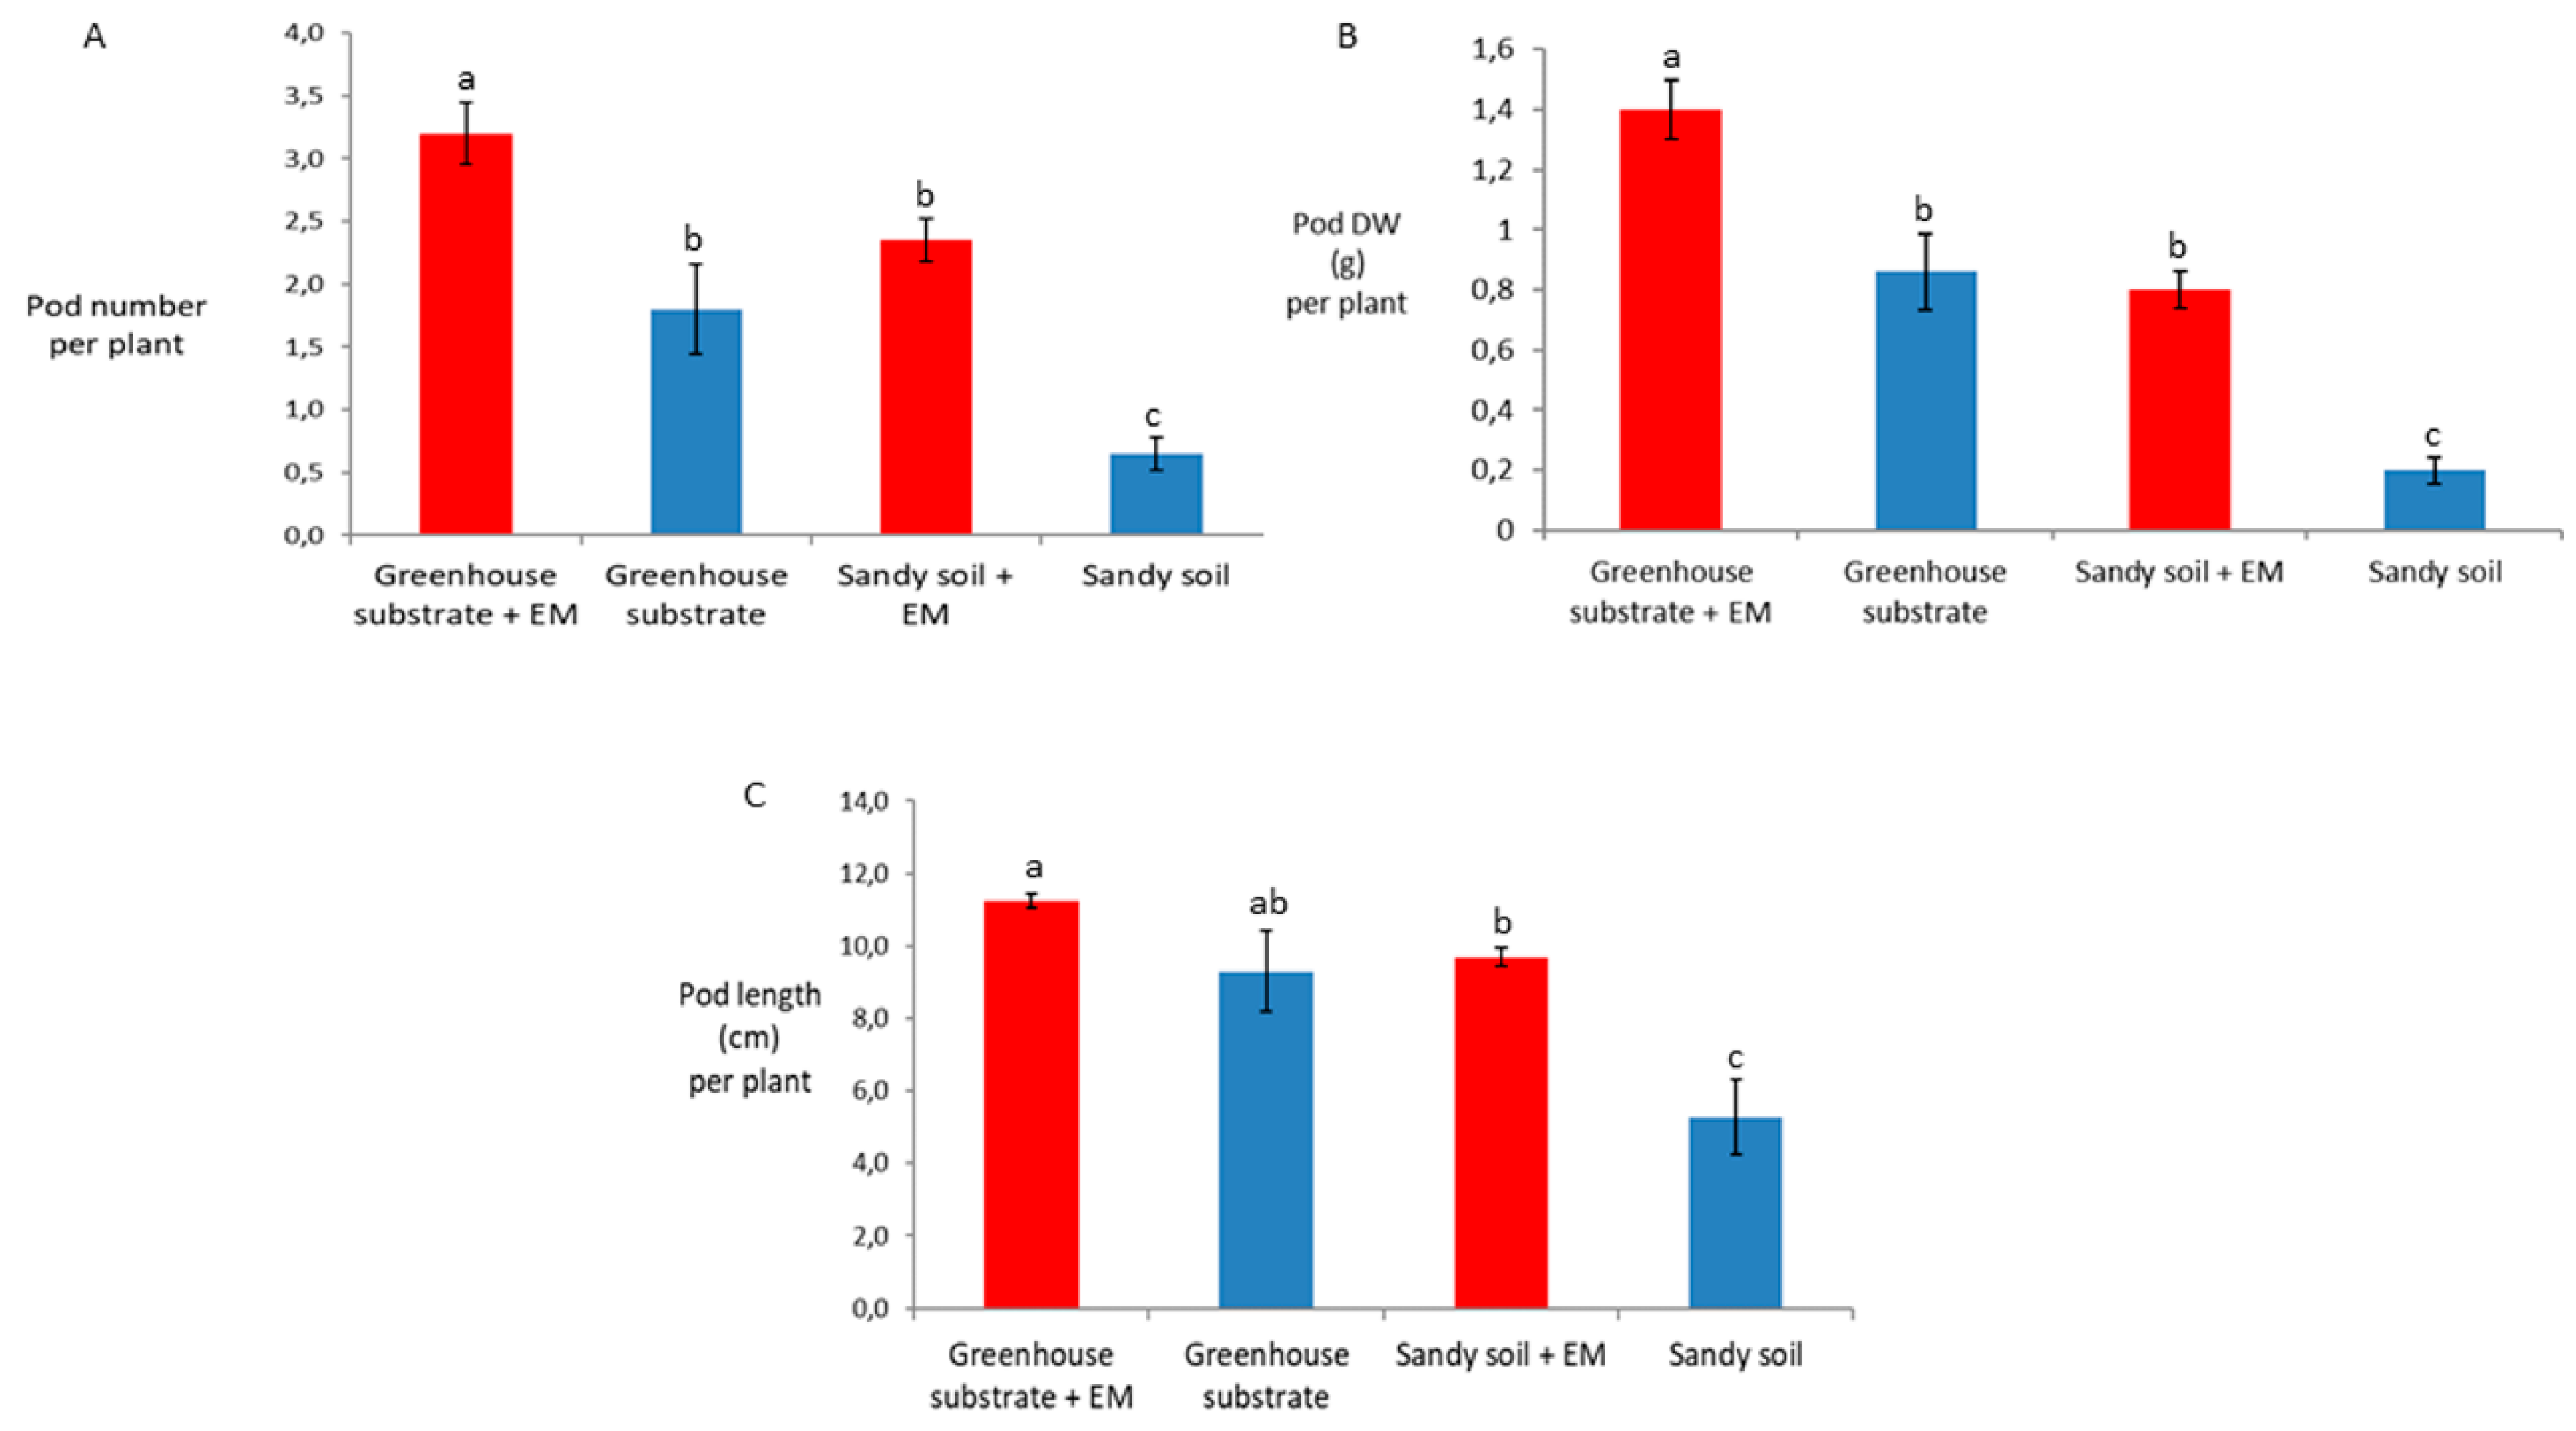
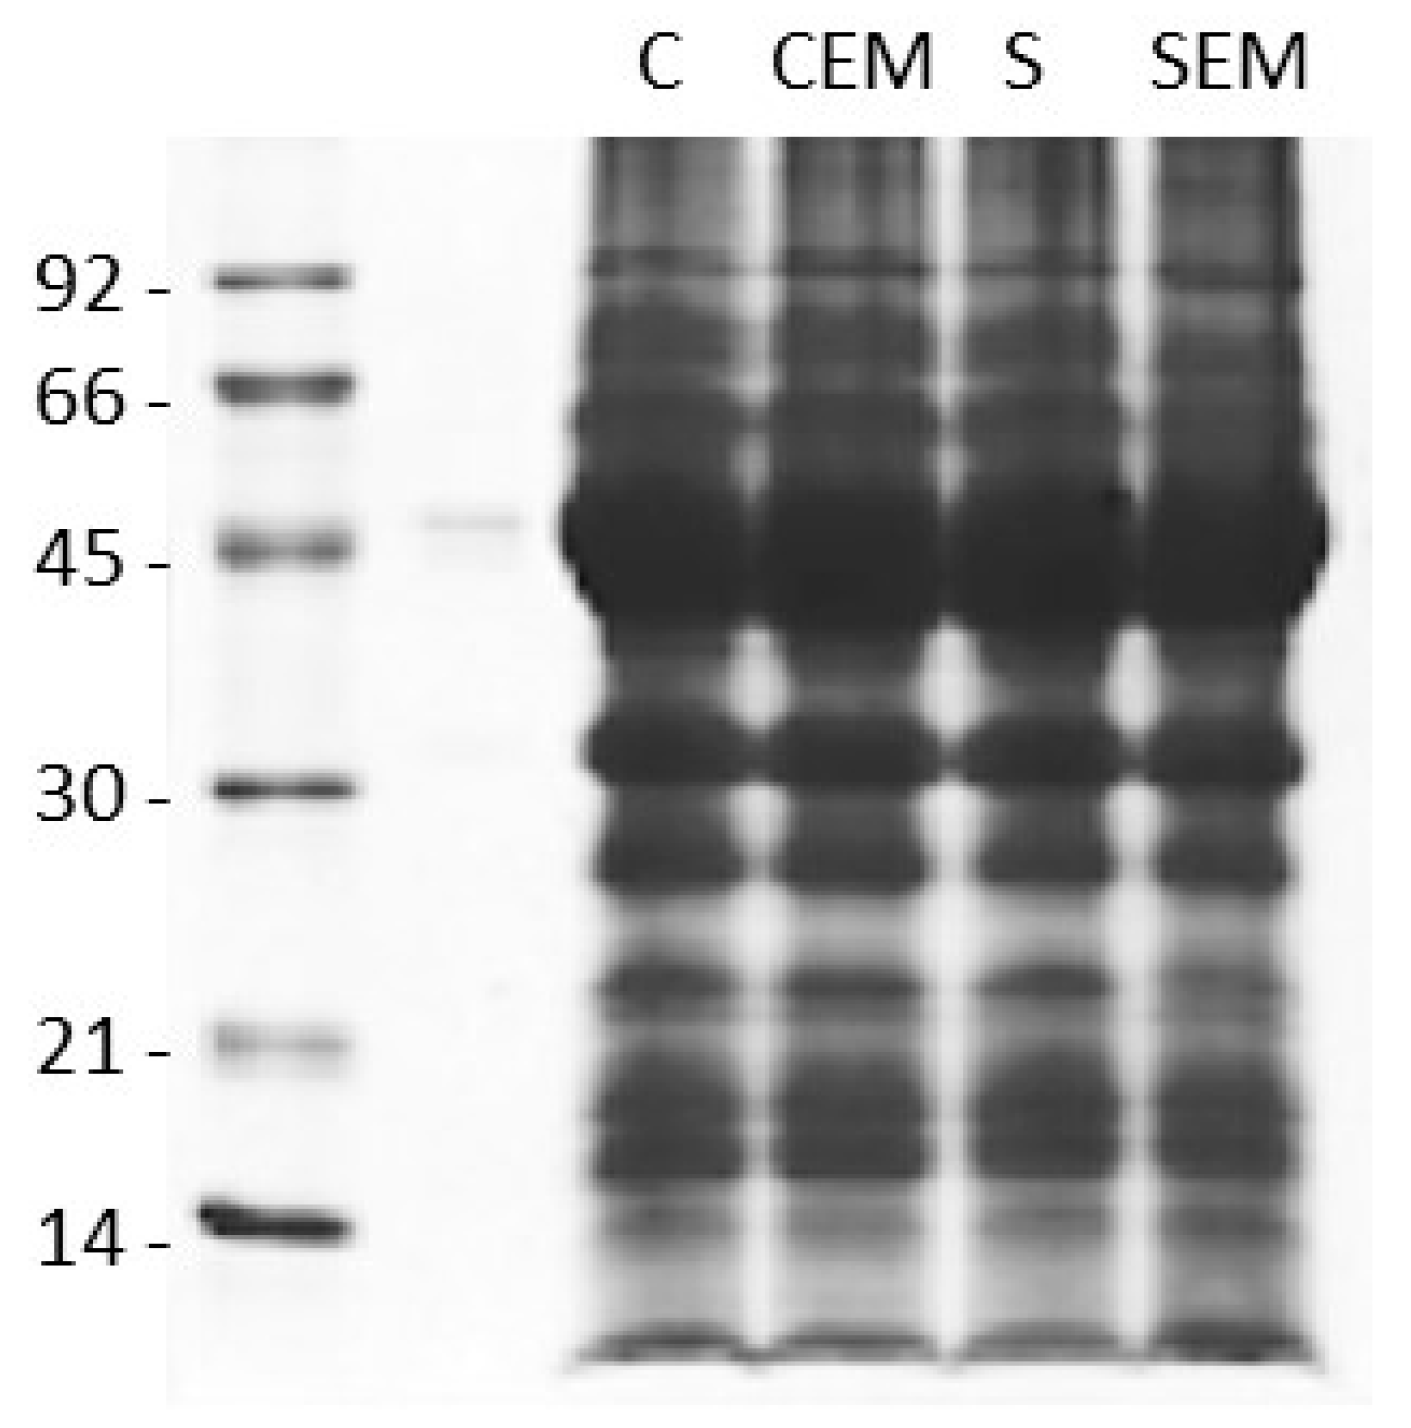
2. Results
3. Discussion
4. Materials and Methods
4.1. Plant Material and EM Treatments
4.2. Leaf Chlorophyll a Fluorescence Analysis
4.3. Effects of EM on Plant Production
4.4. Seed Composition Analyses
4.5. Metal Ion Contents
4.6. Statistical Analysis
Author Contributions
Funding
Acknowledgments
Conflicts of Interest
References
- Food and Agriculture Organization of the United Nations. The state of food and agriculture. Social protection and agriculture: Breaking the cycle of rural poverty. Available online: http://www.fao.org/publications/sofa/2015/en/ (accessed on 10 May 2019).
- Halpern, M.; Bar-Tal, A.; Ofek, M.; Minz, D.; Muller, T.; Yermiyahu, U. The use of biostimulants for enhancing nutrient uptake. In Advances in Agronomy; Academic Press: New York, NY, USA, 2015; pp. 141–174. [Google Scholar]
- Bradáčová, K.; Florea, A.S.; Bar-Tal, A.; Minz, D.; Yermiyahu, U.; Shawahna, R.; Kraut-Cohen, J.; Zolti, A.; Erel, R.; Dietel, K.; et al. Microbial Consortia versus Single-Strain Inoculants: An Advantage in PGPM-Assisted Tomato Production? Agronomy 2019, 9, 105. [Google Scholar]
- Higa, T.; Parr, J.F. Beneficial and Effective Micro-organisms for a Sustainable Agriculture and Environment. Available online: http://www.em-la.com/archivos-de-usuario/base_datos/ (accessed on 10 May 2019).
- Ndona, R.K.; Friedel, J.K.; Spornberger, A.; Rinnofner, T.; Jezik, K. Effective micro-organisms (EM): An effective plant strengthening agent for tomatoes in protected cultivation. Biol. Agric. Hortic. 2011, 27, 189–203. [Google Scholar] [CrossRef]
- Rezende, A.M.F.; Tomita, C.K.; Uesugi, C.H. Cupric fungicides, benzalconium chlorides and liquid bioactive compost (Bokashi): Phytotoxicity and control of guava bacterial blight caused by Erwinia psidii. Trop. Plant Pathol. 2008, 33, 288–294. [Google Scholar] [CrossRef]
- Javaid, A.; Bajwa, R. Field evaluation of effective microorganisms (EM) application for growth, nodulation, and nutrition of mung bean. Turk. J. Agric. For. 2011, 35, 443–452. [Google Scholar] [CrossRef]
- Hu, C.; Qi, Y. Long-term effective microorganisms application promote growth and increase yields and nutrition of wheat in China. Eur. J. Agron. 2013, 46, 63–67. [Google Scholar] [CrossRef]
- Roberti, R.; Bergonzoni, F.; Finestrelli, A.; Leonardi, P. Biocontrol of Rhizoctonia solani disease and biostimulant effect by microbial products on bean plants. Italian J. Mycol. 2015, 44, 49–61. [Google Scholar] [CrossRef]
- Talaat, N.B.; Ghoniem, A.E.; Abdelhamid, M.T.; Shawky, B.T. Effective microorganisms improve growth performance, alter nutrients acquisition and induce compatible solutes accumulation in common bean (Phaseolus vulgaris L.) plants subjected to salinity stress. Plant Growth Regul. 2015, 75, 281–295. [Google Scholar] [CrossRef]
- Pierce, S.; Quaglino, F.; Montagna, M.; Spada, A.; Casati, P.; Iriti, M. Evaluation of effective microorganisms® efficacy on ‘Candidatus Phytoplasma solani’-infected and healthy periwinkle plants. Mitt. Klosterneubg. Rebe Wein Obstbau Früchteverwert. 2016, 66, 89–92. [Google Scholar]
- Shin, K.; van Diepen, G.; Blok, W.; van Bruggen, A.H. Variability of Effective Micro-organisms (EM) in bokashi and soil and effects on soil-borne plant pathogens. Crop Prot. 2017, 99, 168–176. [Google Scholar] [CrossRef]
- Khaliq, A.; Abbasi, M.K.; Hussain, T. Effects of integrated use of organic and inorganic nutrient sources with effective microorganisms (EM) on seed cotton yield in Pakistan. Bioresour. Technol. 2006, 97, 967–972. [Google Scholar] [CrossRef] [PubMed]
- Ncube, L.; Minkeni, P.N.S.; Brutsch, O. Agronomic suitability of effective microorganisms for tomato production. Afr. J. Agric. Res. 2011, 6, 650–654. [Google Scholar]
- Chantal, K.; Xiaohou, S.; Weimu, W.; Ong’or, B.T.I. Effects of effective microorganisms on yield and quality of vegetable cabbage comparatively to nitrogen and phosphorus fertilizers. Pak. J. Nutr. 2010, 9, 1039–1042. [Google Scholar] [CrossRef]
- Talaat, N.B. Effective microorganisms enhance the scavenging capacity of the ascorbate–glutathione cycle in common bean (Phaseolus vulgaris L.) plants grown in salty soils. Plant Physiol. Biochem. 2014, 80, 136–143. [Google Scholar] [CrossRef] [PubMed]
- Talaat, N.B. Effective microorganisms modify protein and polyamine pools in common bean (Phaseolus vulgaris L.) plants grown under saline conditions. Sci. Hortic. 2015, 190, 1–10. [Google Scholar] [CrossRef]
- Murchie, E.H.; Lawson, T. Chlorophyll fluorescence analysis: a guide to good practice and understanding some new applications. J. Exp. Bot. 2013, 64, 3983–3998. [Google Scholar] [CrossRef] [PubMed] [Green Version]
- Björkman, O.; Demmig, B. Photon yield of O2 evolution and chlorophyll fluorescence characteristics at 77K among vascular plants of diverse origin. Planta 1987, 170, 489–504. [Google Scholar] [CrossRef] [PubMed]
- Bradford, M.M. A rapid and sensitive method for the quantitation of micrograms quantities of proteins utilising the principle of protein-dye binding. Anal. Biochem. 1976, 72, 248–254. [Google Scholar] [CrossRef]
- Laemmli, U.K. Cleavage of structural proteins during the assembly of the head of bacteriophage T4. Nature 1970, 227, 660–665. [Google Scholar] [CrossRef]


| Constituents | Greenhouse Substrate | Sandy Soil | ||
|---|---|---|---|---|
| CTRL | EM | CTRL | EM | |
| Proteins | 25.02 ± 3.61 a | 25.02 ± 0.53 a | 23.47 ± 1.51 a | 26.53 ± 1.14 b |
| Lipids | 8.99 ± 0.02 a | 7.57 ± 0.03 b | 9.0 ± 0.03 a | 7.04 ± 0.02 c |
| Total starch | 37.01 ± 1.70 a | 38.47 ± 1.85 a | 33.00 ± 1.33 b | 32.29 ± 1.42 b |
| Resistant | 32.56 ± 1.49 a | 33.58 ± 1.61 a | 28.66 ± 1.15 b | 28.27 ± 1.24 b |
| Non-resistant | 4.45 ± 0.21 a | 4.89 ± 0.24 a | 4.37 ± 0.18 a | 4.02 ± 0.18 a |
| Water | 10.17 ± 0.01 a | 9.45 ± 0.02 b | 10.19 ± 0.03 c | 9.68 ± 0.02 d |
| Metal Ions | Greenhouse Substrate | Sandy Soil | ||
|---|---|---|---|---|
| CTRL | EM | CTRL | EM | |
| Calcium | 250.23 ± 7.81 a | 230.45 ± 6.93 b | 525.63 ± 19.95 c | 564.05 ± 21.65 c |
| Copper | 1.69 ± 0.09 a | 1.49 ± 0.11 a | 3.50 ± 0.25 b | 2.97 ± 0.18 b |
| Iron | 22.43 ± 0.56 a | 24.33 ± 0.53 a | 32.20 ± 0.84 b | 41.57 ± 0.91 c |
| Magnesium | 507.72 ± 9.63 a | 594.40 ± 9.85 b | 611.65 ± 9.76 b | 597.26 ± 9.11 b |
| Manganese | 4.28 ± 0.07 a | 4.67 ± 0.11 b | 5.08 ± 0.12 c | 5.32 ± 0.09 c |
| Phosphorus | 1469.44 ± 25.91 a | 1984.14 ± 22.67 b | 1433.33 ± 21.48 a | 1888.12 ± 19.88 b |
| Potassium | 4487.46 ± 55.64 a | 5875.30 ± 58.35 b | 5718.39 ± 60.12 b | 5329.87 ± 56.93 c |
| Sodium | 6.35 ± 0.12 a | 14.28 ± 0.13 b | 10.66 ± 0.12 c | 16.01 ± 0.12 d |
| Zinc | 13.69 ± 0.66 a | 8.96 ± 0.35 b | 11.61 ± 0.43 c | 17.59 ± 1.21 d |
| Substrate | Properties | |||||
| Components | pH | Total N (%, Dry Weight) | Electrical Conductivity (dS m−1) | Apparent Density (kg m−3) | Total Porosity (%v/v) | |
| Greenhouse substrate (potting soil unfertilized) | Peat | 6.0 | 1.4 | 0.25 | 120 | 90 |
| Substrate | Properties | |||||
| Components | pH | Ø (mm) | SiO2 (%) | Mohs scale | ||
| Sandy soil (unfertilized) | Sand | 7.5 | 0 | 0.6 | 75–80 | 6 |
© 2019 by the authors. Licensee MDPI, Basel, Switzerland. This article is an open access article distributed under the terms and conditions of the Creative Commons Attribution (CC BY) license (http://creativecommons.org/licenses/by/4.0/).
Share and Cite
Iriti, M.; Scarafoni, A.; Pierce, S.; Castorina, G.; Vitalini, S. Soil Application of Effective Microorganisms (EM) Maintains Leaf Photosynthetic Efficiency, Increases Seed Yield and Quality Traits of Bean (Phaseolus vulgaris L.) Plants Grown on Different Substrates. Int. J. Mol. Sci. 2019, 20, 2327. https://0-doi-org.brum.beds.ac.uk/10.3390/ijms20092327
Iriti M, Scarafoni A, Pierce S, Castorina G, Vitalini S. Soil Application of Effective Microorganisms (EM) Maintains Leaf Photosynthetic Efficiency, Increases Seed Yield and Quality Traits of Bean (Phaseolus vulgaris L.) Plants Grown on Different Substrates. International Journal of Molecular Sciences. 2019; 20(9):2327. https://0-doi-org.brum.beds.ac.uk/10.3390/ijms20092327
Chicago/Turabian StyleIriti, Marcello, Alessio Scarafoni, Simon Pierce, Giulia Castorina, and Sara Vitalini. 2019. "Soil Application of Effective Microorganisms (EM) Maintains Leaf Photosynthetic Efficiency, Increases Seed Yield and Quality Traits of Bean (Phaseolus vulgaris L.) Plants Grown on Different Substrates" International Journal of Molecular Sciences 20, no. 9: 2327. https://0-doi-org.brum.beds.ac.uk/10.3390/ijms20092327