High Fructose Intake and Adipogenesis


 , and
, and 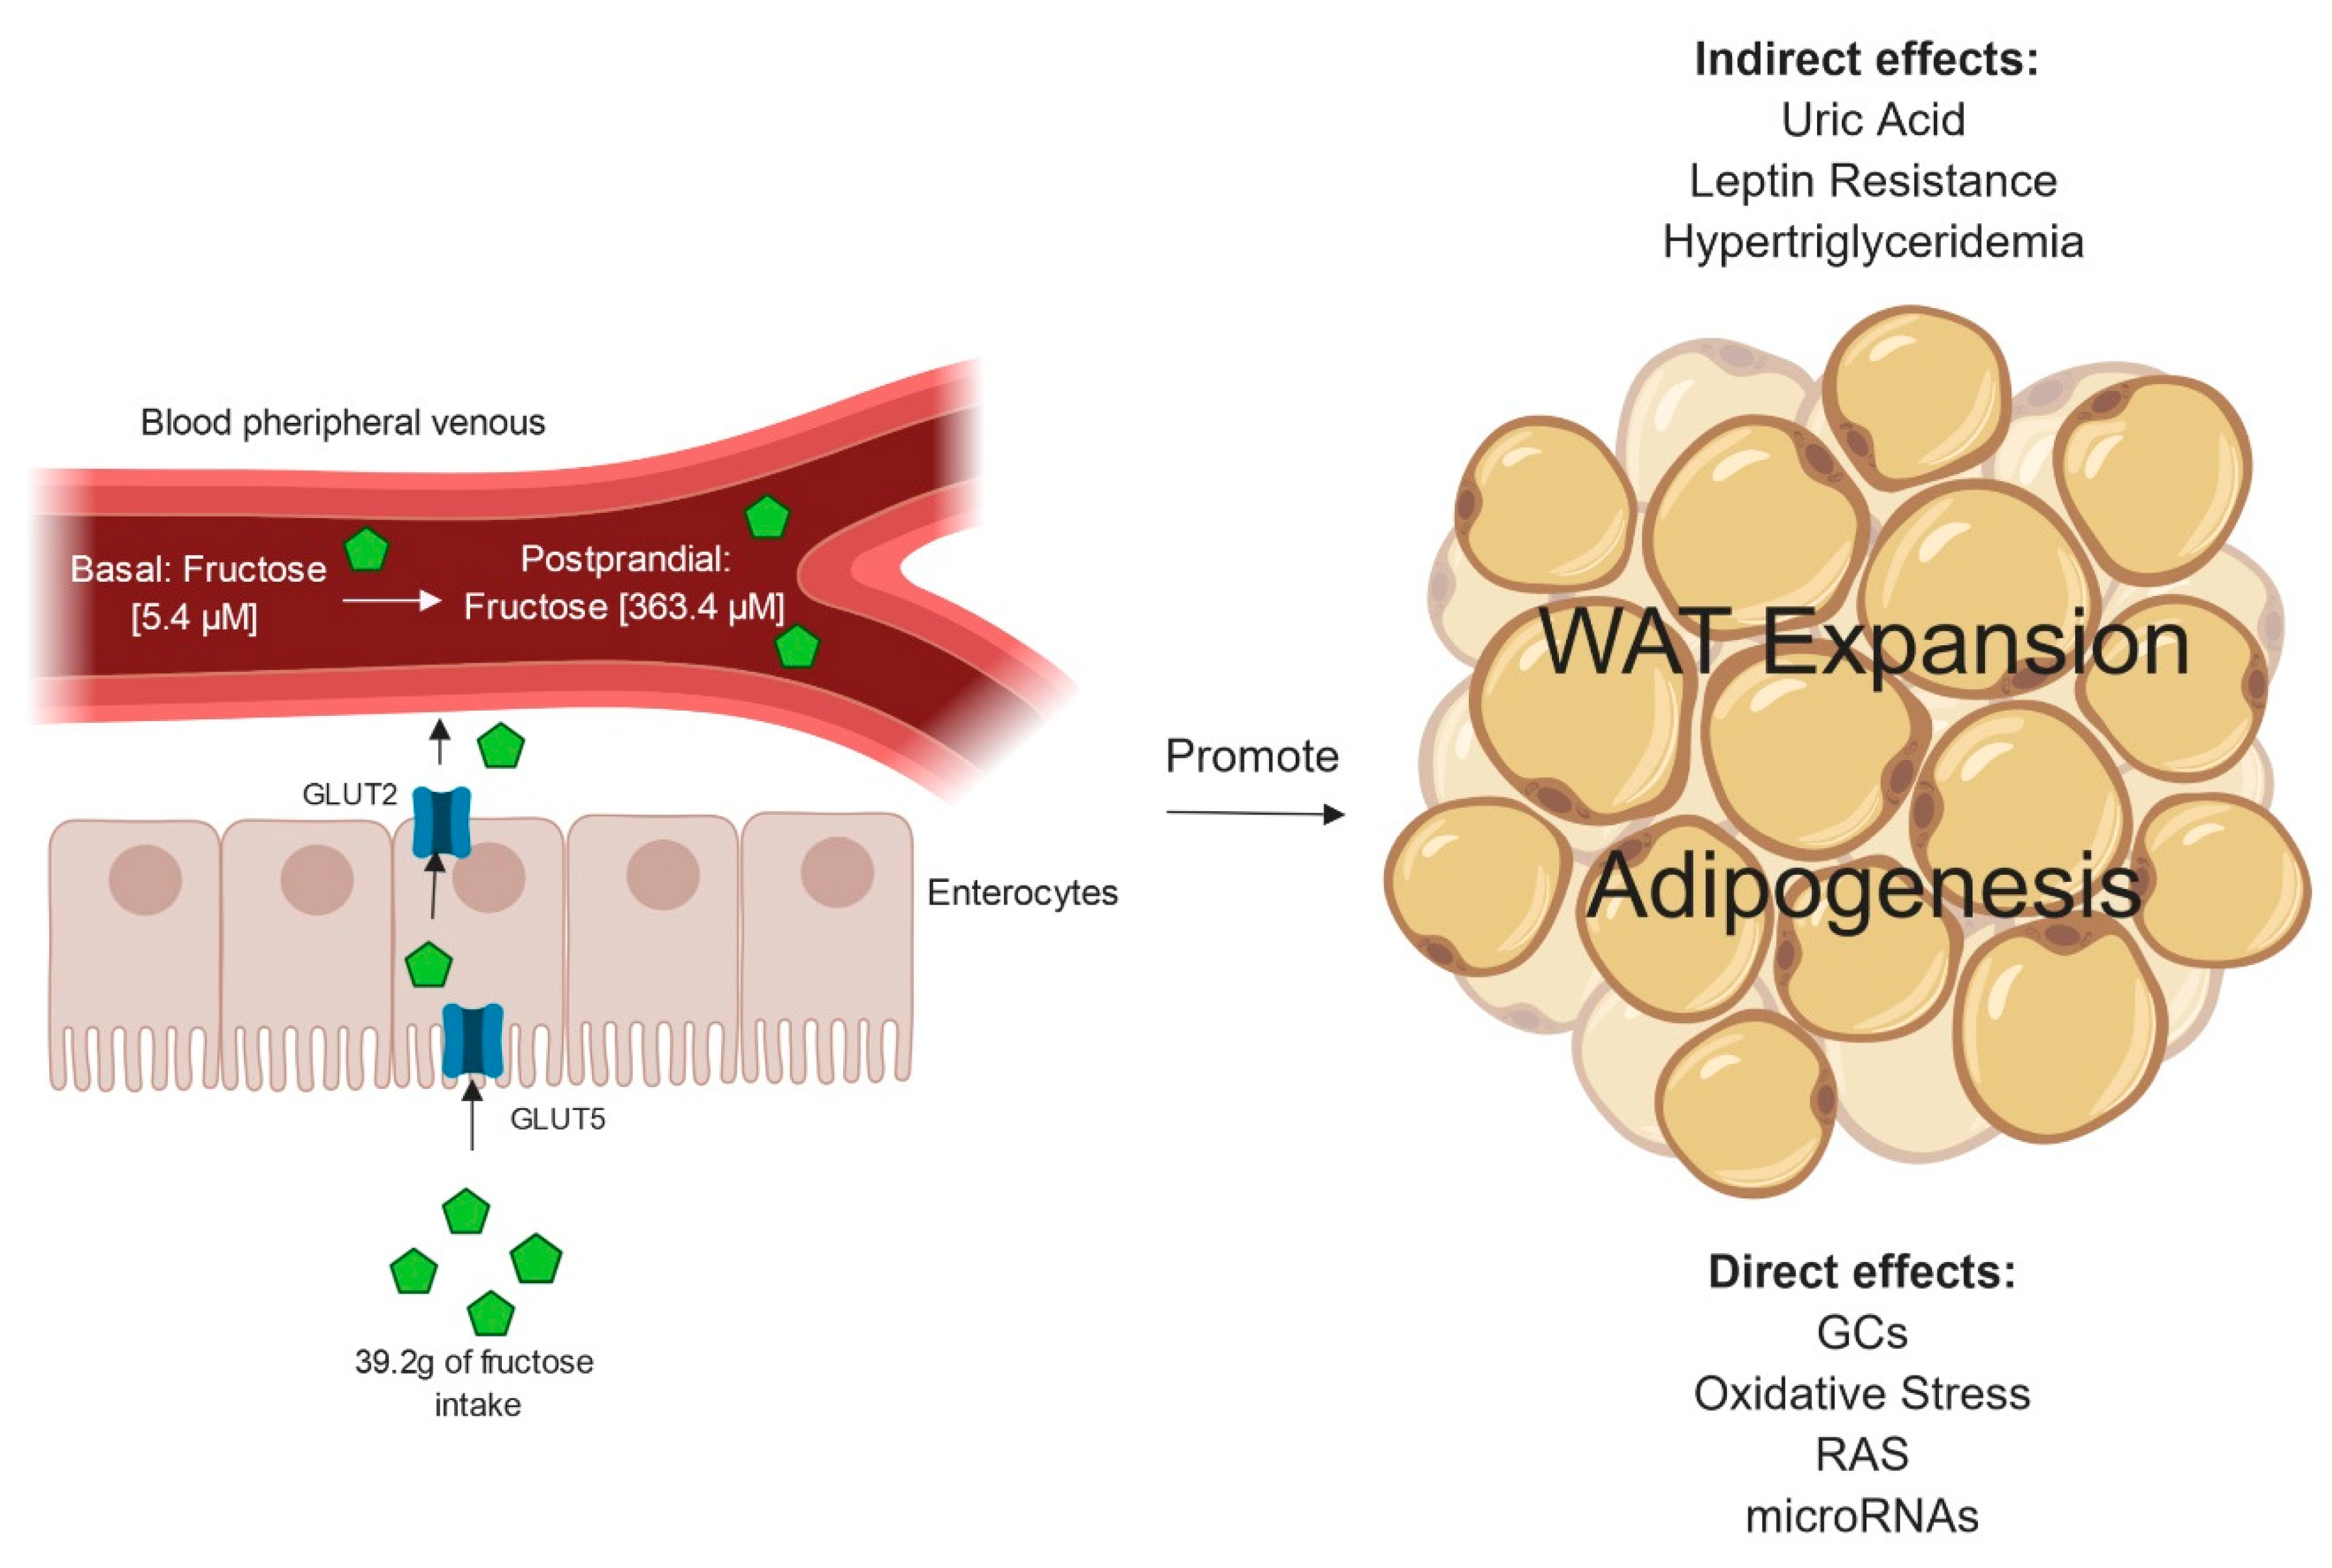
Abstract
:1. Introduction
2. Fructose Absorption to the Systemic Circulation
3. Effects of Excessive Fructose Intake on WAT Accumulation
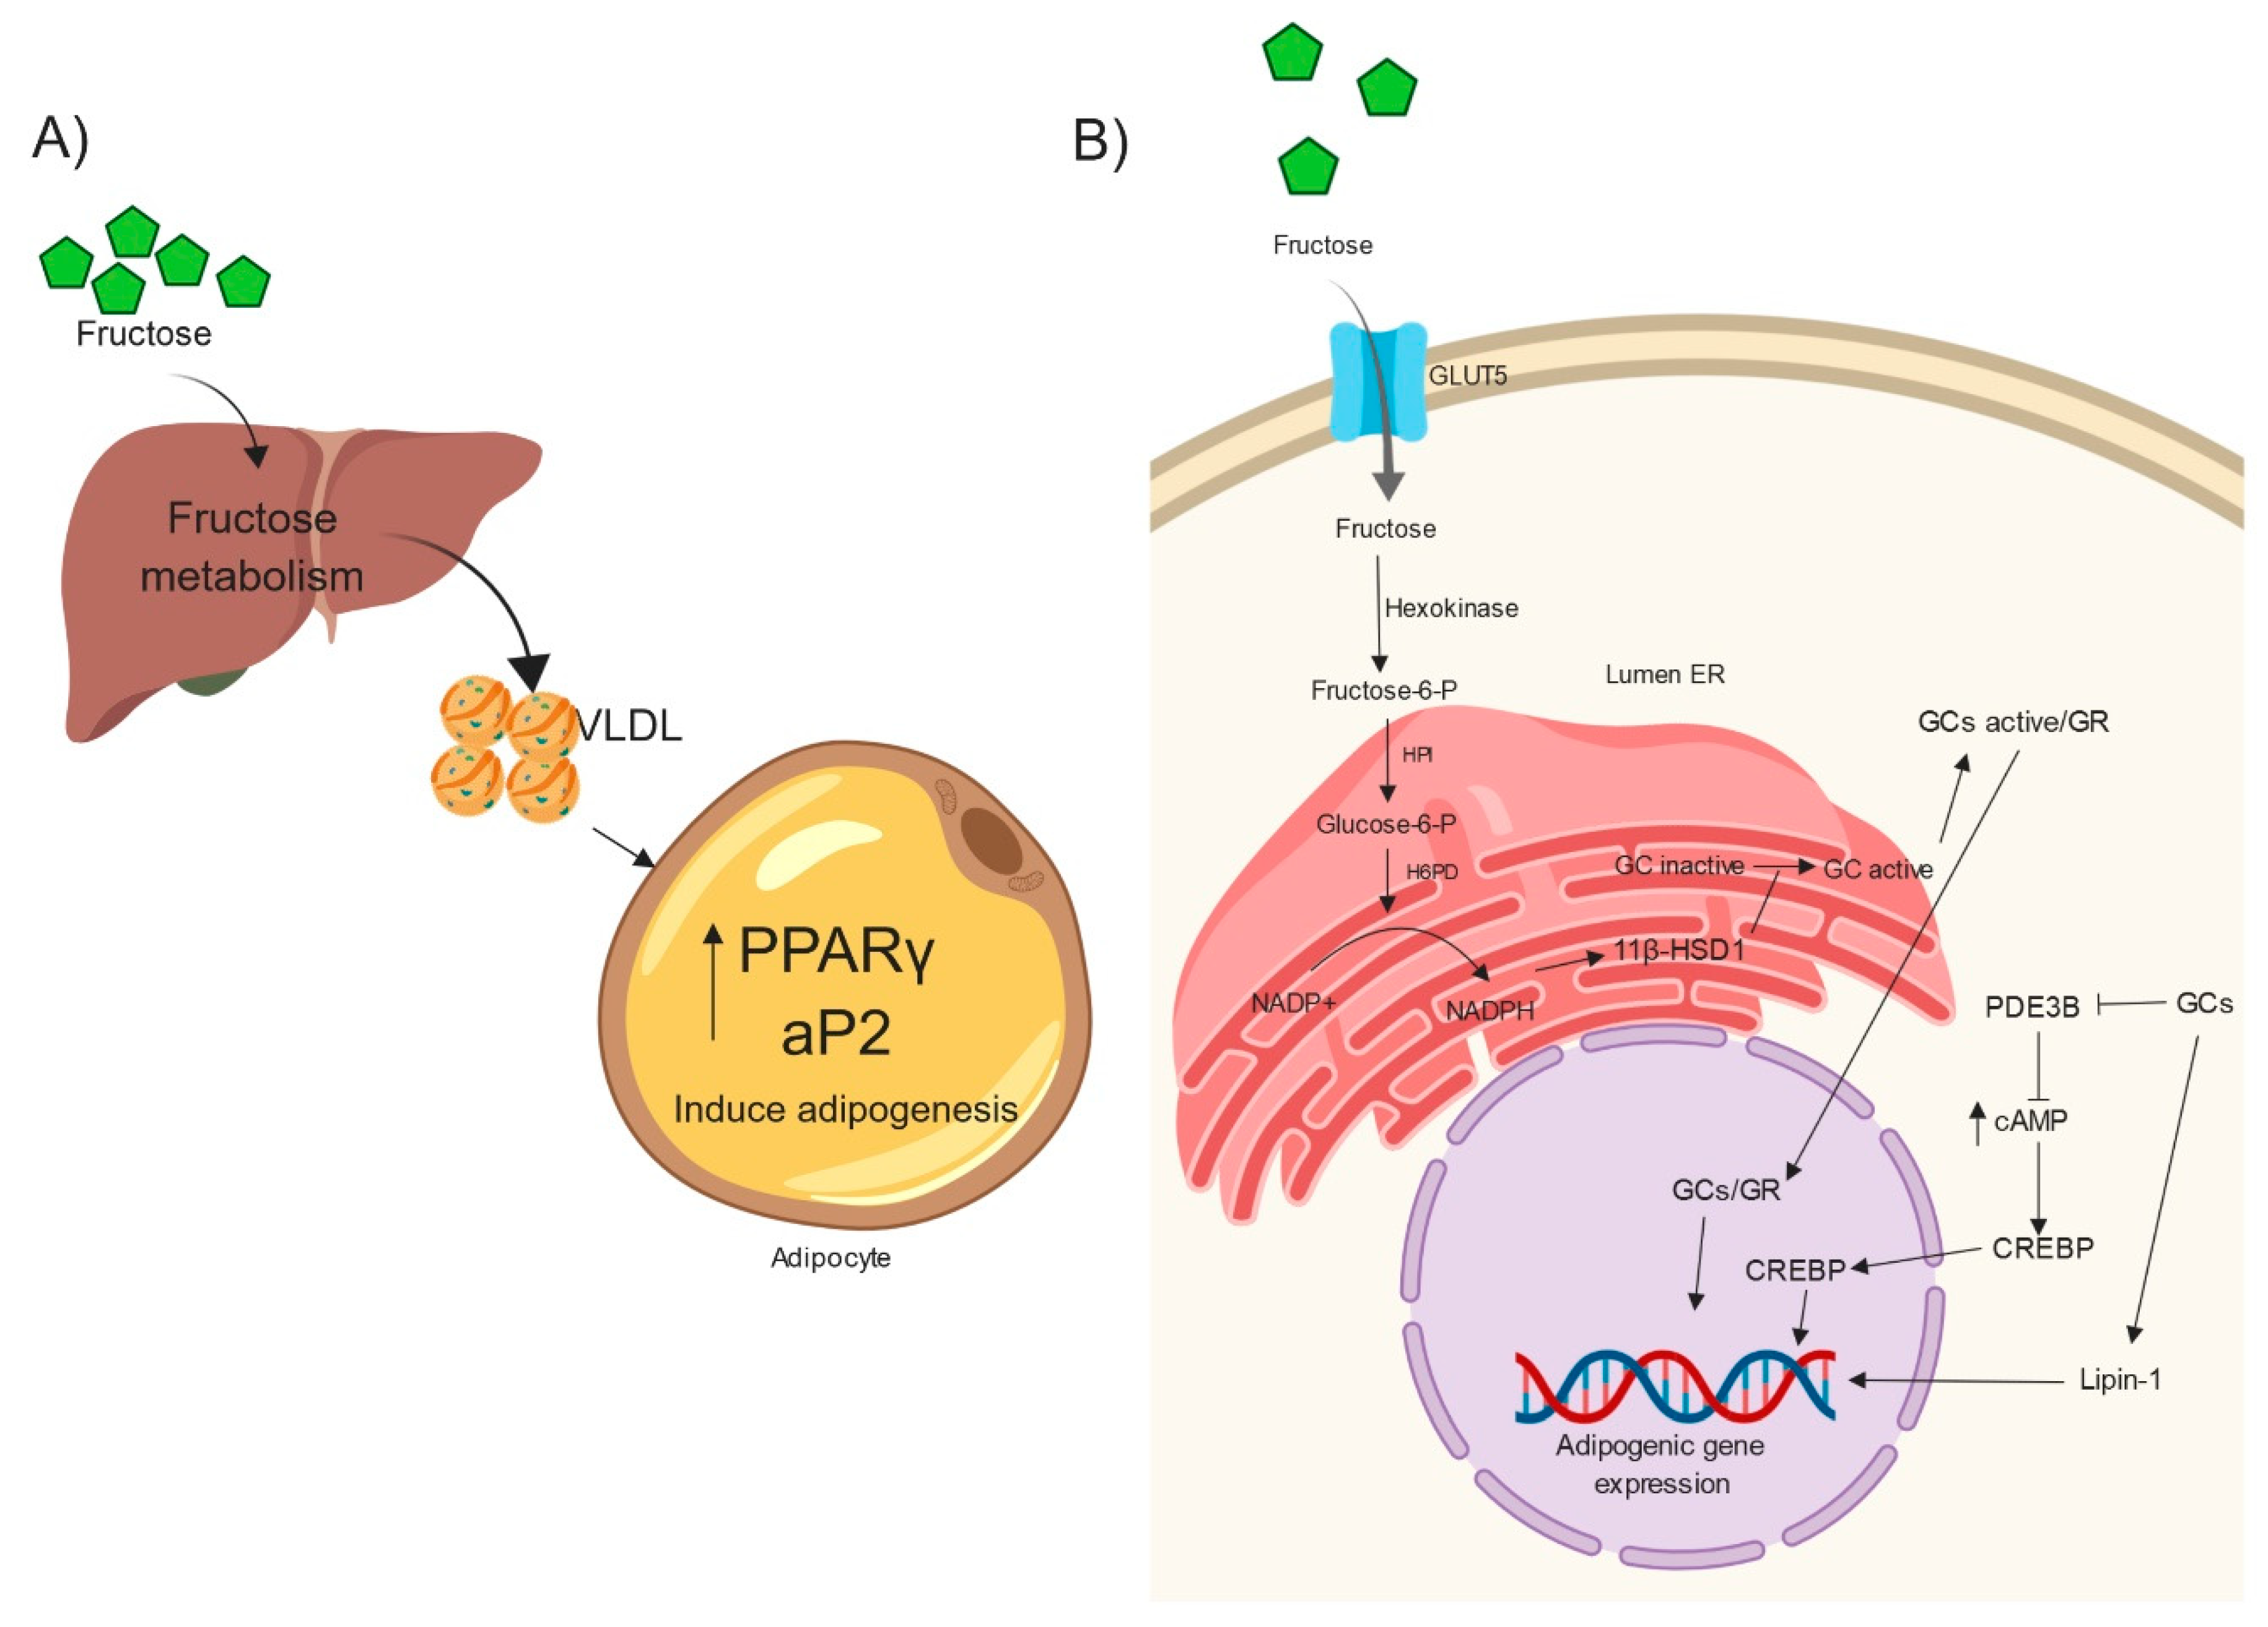
4. Fructose, Hypertriglyceridemia, Very-Low-Density Lipoproteins (VLDLs) and Adipogenesis
5. Fructose Induces Adipogenesis by GC Action
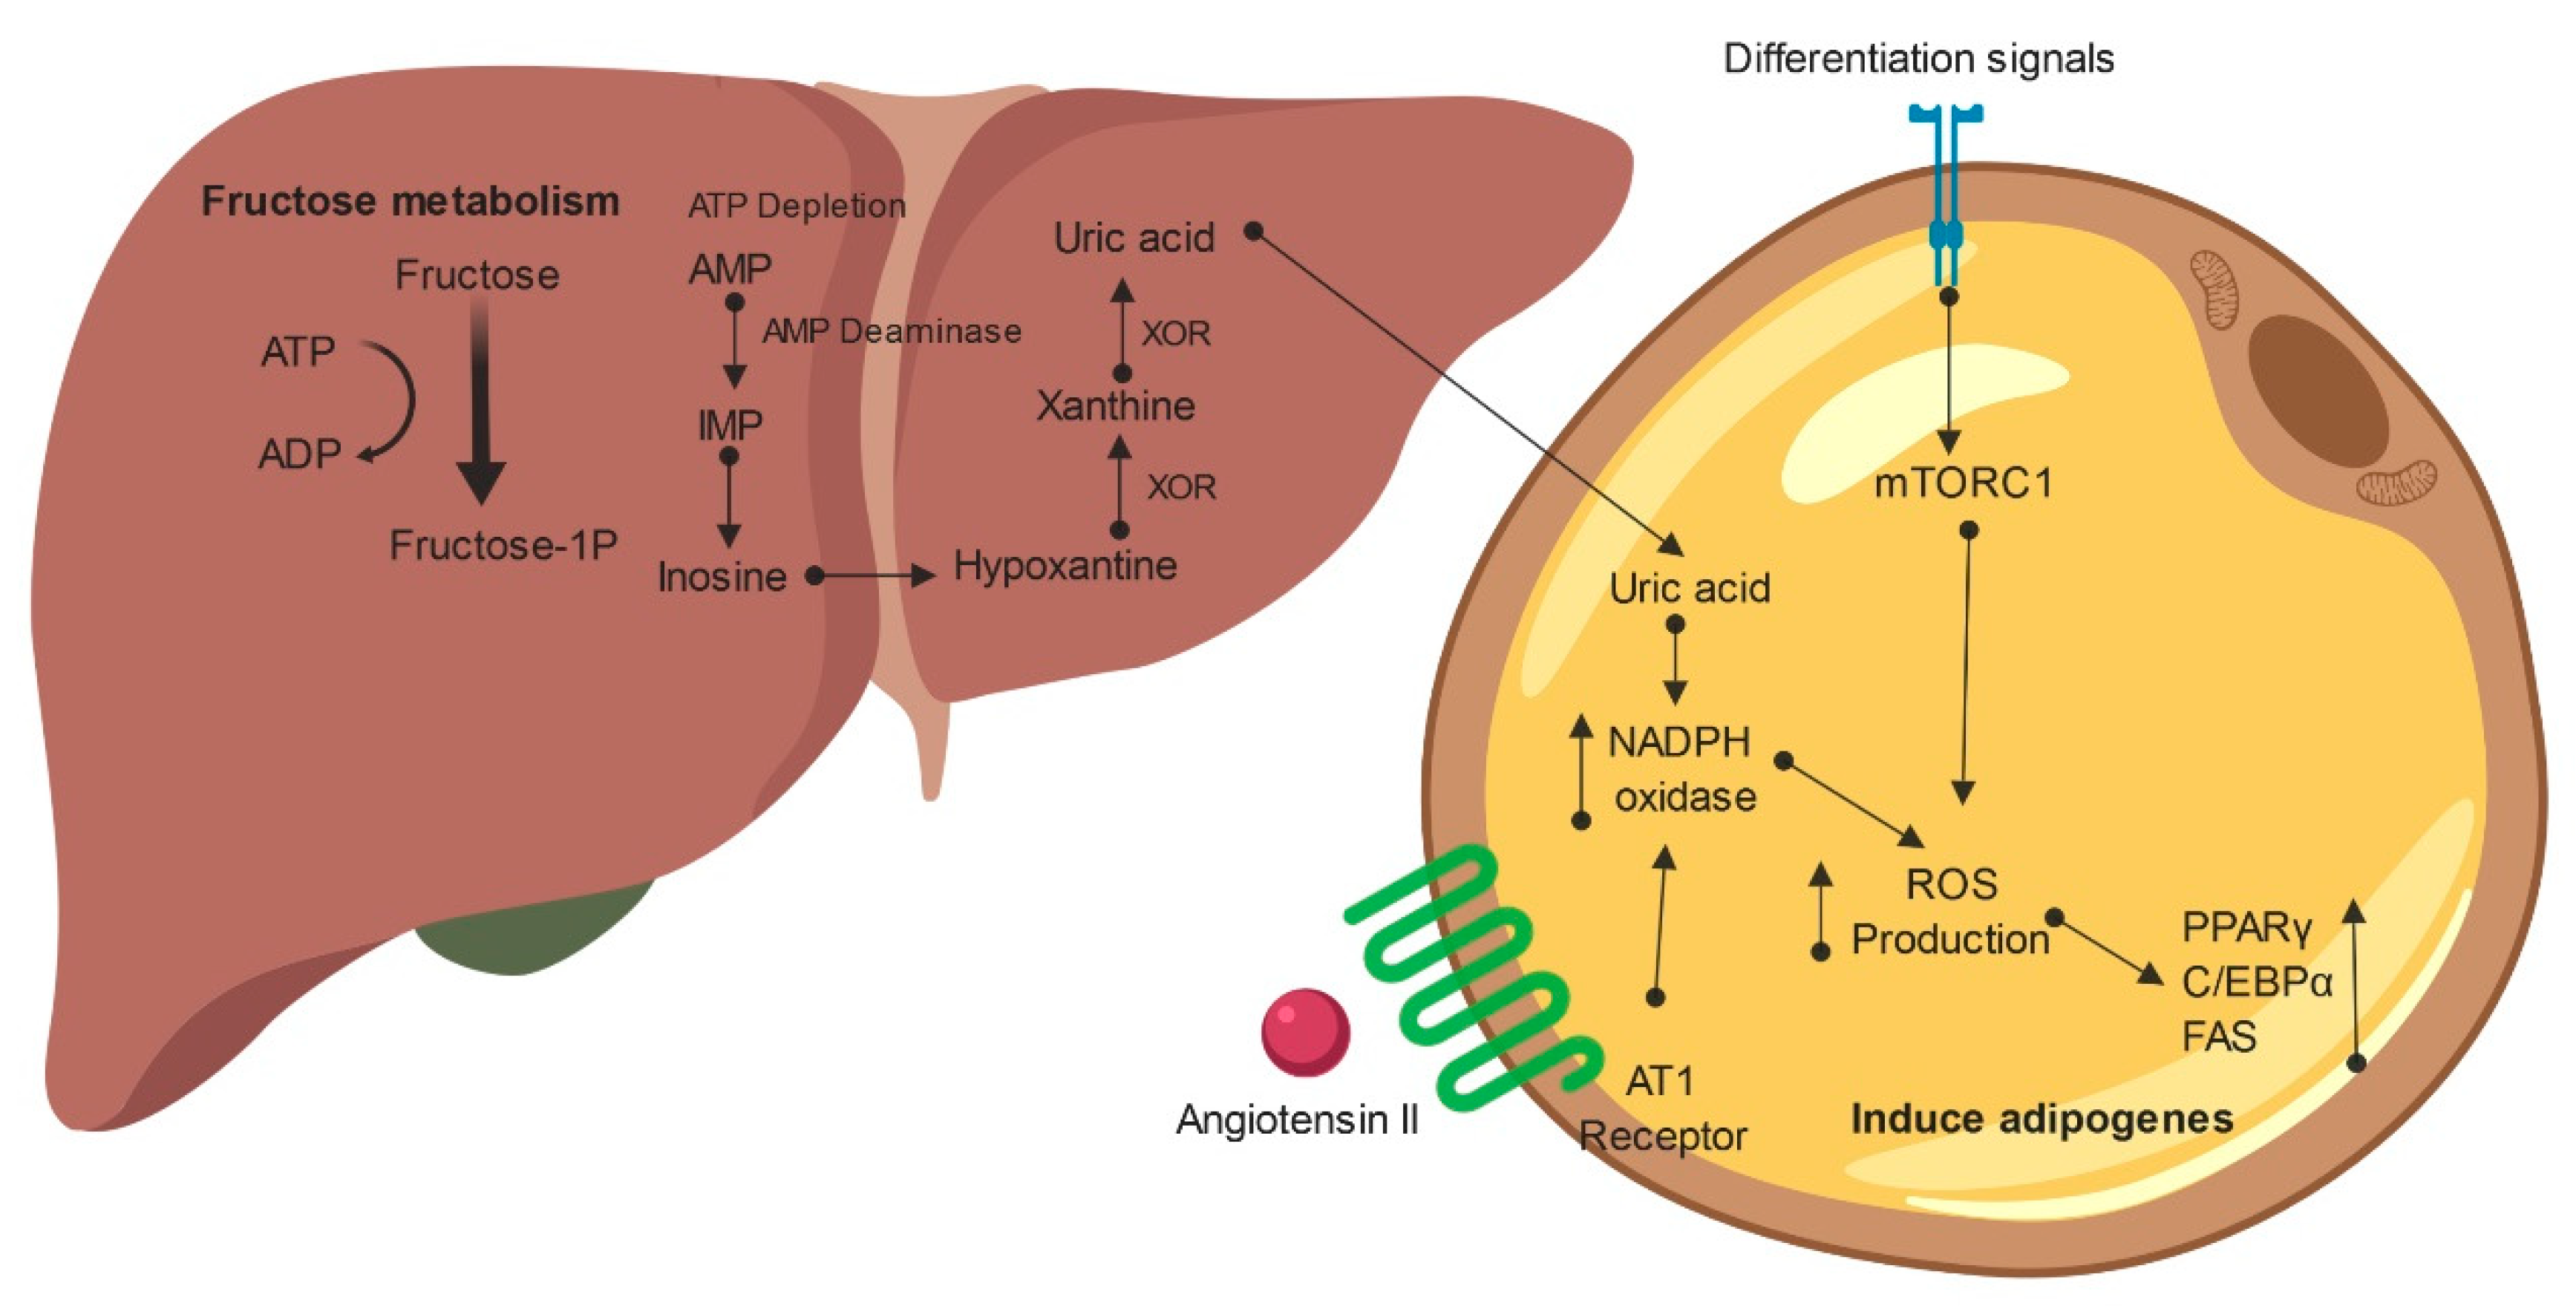
6. Reactive Oxygen Species and Fructose
7. Uric Acid Resulting from Fructose Metabolism as a Mediator of Adipogenesis
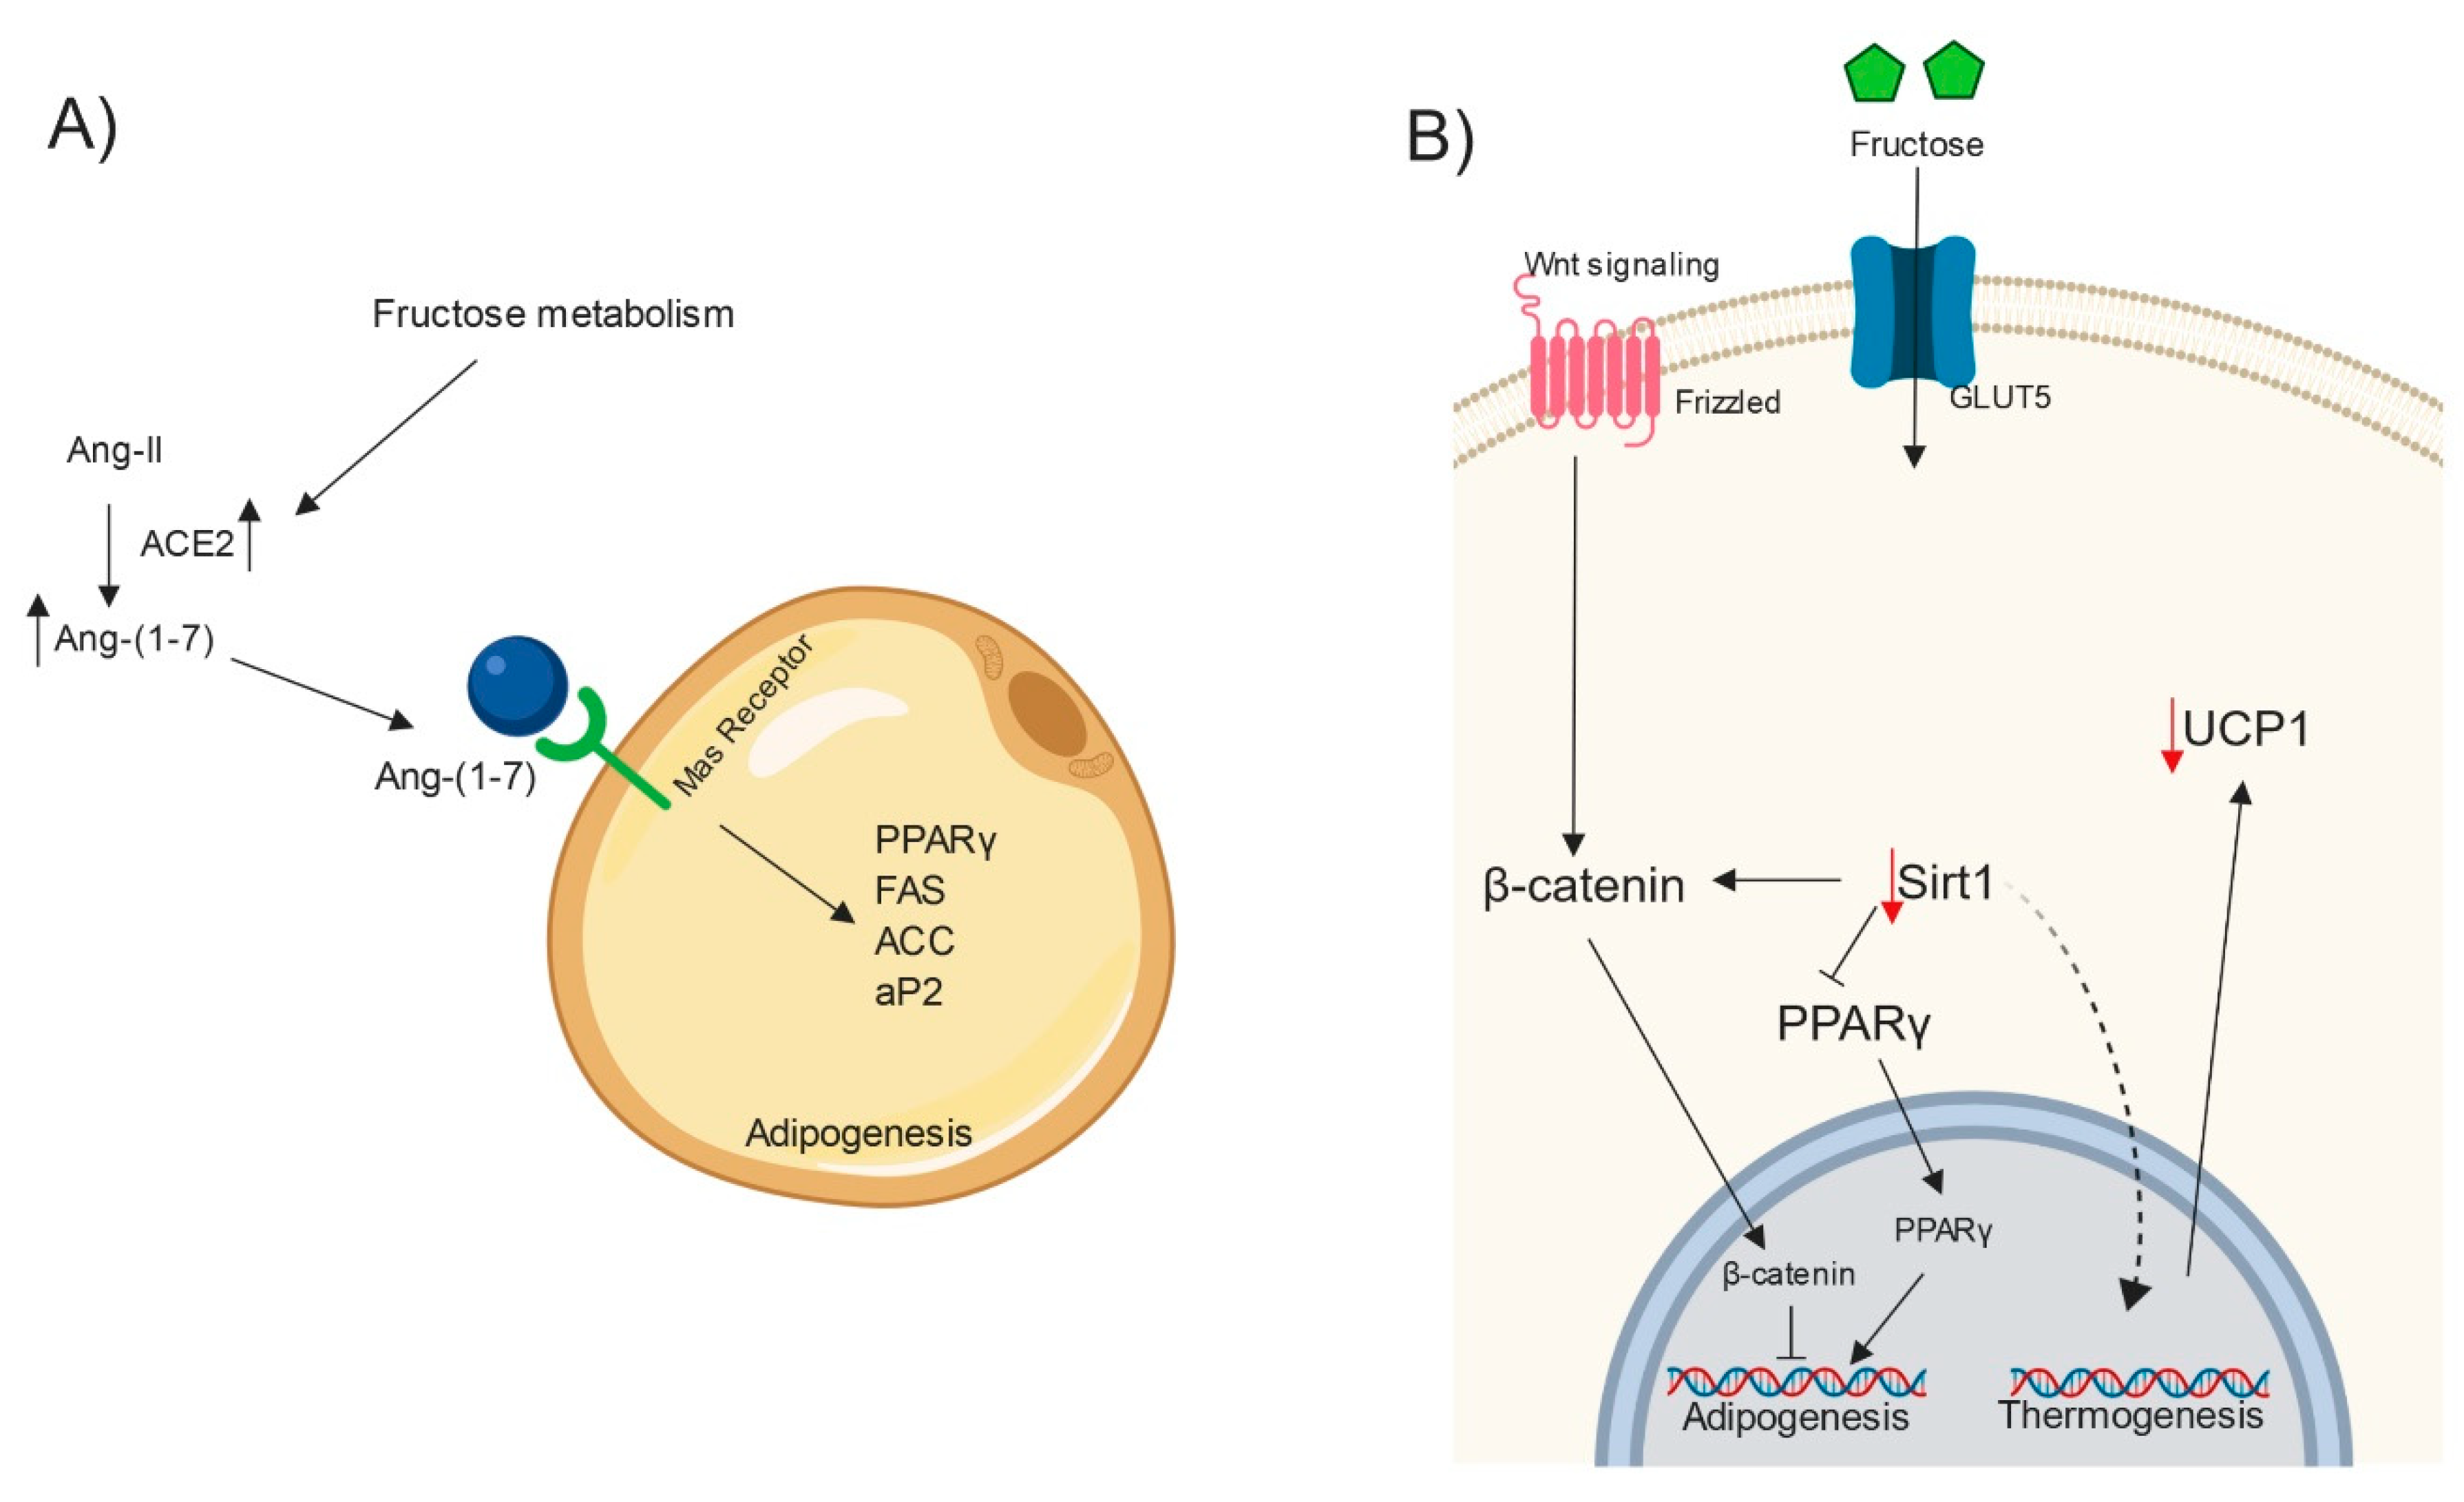
8. RAS, Fructose and Adipogenesis
9. Fructose, Sirtuin1, UCP1 and Thermogenesis
10. MicroRNAs Implication in Fructose-Induced Adipogenesis
11. Future Directions
- Studies that estimate the amount of fructose or its immediate metabolites that may enter into different types of WAT are needed.
- The acute metabolic and endocrine effects of high fructose intake on WAT from healthy and metabolically compromised individuals should be assessed.
- The role of fructose in the adipogenesis of newly discovered adipocyte subsets should be interesting to investigate.
- The reversibility of many high fructose intake-induced phenotypes should be studied.
- Studies with modest fructose intake, especially from sources other than processed food, such as fruits, are lacking.
12. Conclusions
Author Contributions
Funding
Acknowledgments
Conflicts of Interest
Abbreviations
| HFCS | High-fructose corn syrup |
| WAT | White adipose tissue |
| SSBs | Sugar-sweetened beverages |
| GCs | Glucocorticoids |
| ROS | Reactive oxygen species |
| RAS | Renin–angiotensin system |
| miRNA | microRNA |
| GLUT5 | Glucose transporter type 5 |
| GWAS | Genome-wide association studies |
| GLP-1R | Glucagon-like peptide-1 receptor |
| APCs | Adipocyte precursor cells |
| F6P | Fructose-6-phosphate |
| NADPH | Nicotinamide adenosine dinucleotide phosphate |
| 11β-HSD1 | 1β-Hydroxysteroid dehydrogenase type 1 |
| H6PDH | Hexose-6-phosphate dehydrogenase |
| HPI | Hexose phosphate isomerase |
| DEX | Dexamethasone |
| GR | Glucocorticoid receptor |
| C/EBPα | CCAAT-enhancer-binding protein α |
| KLF | Krüppel-like factor |
| PPARγ | Peroxisome proliferator-activated receptor γ |
| PDE3B | Phosphodiesterase 3B |
| cAMP | Cyclic adenosine monophosphate |
| PKA | Protein kinase A |
| CREBP | cAMP response element-binding protein |
| NOX | NADPH oxidase |
| XOR | Xanthine oxidase |
| MSC | Mesenchymal stem cell |
| HO-1 | Heme oxygenase-1 |
| WNT10b | Wnt family member 10b |
| HU | Hyperuricemia |
| UA | Uric acid |
| KHK | Ketohexokinase |
| MCP-1 | Monocyte chemotactic protein 1 |
| Ang-II | Angiotensin II |
| ACE | Angiotensin-converting enzyme |
| FAS | Fatty acid synthase |
| ACC | Acetyl-CoA carboxylase |
| aP2 | Adipocyte protein 2 |
| FGFR2 | Fibroblast growth factor receptor 2 |
| TGF-β | Transforming growth factor β |
| AP-1 | Activator protein 1 |
| VLDL | Very-low-density lipoprotein |
| Sirt1 | Sirtuin 1 |
| UCP1 | Uncoupling protein 1 |
| G3P | Delphinidin-3-O-β-glucoside |
| BAT | Brown adipose tissue |
| Wnt | Wingless e Int |
References
- Johnson, R.J.; Sánchez-Lozada, L.G.; Andrews, P.; Lanaspa, M.A. Perspective: A Historical and Scientific Perspective of Sugar and Its Relation with Obesity and Diabetes. Adv. Nutr. 2017, 8, 412–422. [Google Scholar] [CrossRef] [PubMed]
- Malik, V.S.; Pan, A.; Willett, W.C.; Hu, F.B. Sugar-sweetened beverages and weight gain in children and adults: A systematic review and meta-analysis. Am. J. Clin. Nutr. 2013, 98, 1084–1102. [Google Scholar] [CrossRef] [PubMed]
- Yang, Q.; Zhang, Z.; Gregg, E.W.; Flanders, W.D.; Merritt, R.; Hu, F.B. Added Sugar Intake and Cardiovascular Diseases Mortality Among US Adults. JAMA Intern Med. 2014, 174, 516–524. [Google Scholar] [CrossRef] [PubMed] [Green Version]
- Chung, M.; Ma, J.; Patel, K.; Berger, S.; Lau, J.; Lichtenstein, A.H. Fructose, high-fructose corn syrup, sucrose, and nonalcoholic fatty liver disease or indexes of liver health: A systematic review and meta-analysis. Am. J. Clin. Nutr. 2014, 100, 833–849. [Google Scholar] [CrossRef] [PubMed]
- Jegatheesan, P.; De Bandt, J.P. Fructose and NAFLD: The multifaceted aspects of fructose metabolism. Nutrients 2017, 9, 230. [Google Scholar] [CrossRef] [PubMed]
- Jensen, T.; Abdelmalek, M.F.; Sullivan, S.; Nadeau, K.J.; Green, M.; Roncal, C.; Nakagawa, T.; Kuwabara, M.; Sato, Y.; Kang, D.-H.; et al. Fructose and sugar: A major mediator of non-alcoholic fatty liver disease. J. Hepatol. 2018, 68, 1063–1075. [Google Scholar] [CrossRef] [PubMed] [Green Version]
- Shapiro, A.; Mu, W.; Roncal, C.; Cheng, K.-Y.; Johnson, R.J.; Scarpace, P.J. Fructose-induced leptin resistance exacerbates weight gain in response to subsequent high-fat feeding. Am. J. Physiol. Integr. Comp. Physiol. 2008, 295, R1370–R1375. [Google Scholar] [CrossRef] [PubMed] [Green Version]
- Stanhope, K.L.; Schwarz, J.M.; Keim, N.L.; Griffen, S.C.; Bremer, A.A.; Graham, J.L.; Hatcher, B.; Cox, C.L.; Dyachenko, A.; Zhang, W.; et al. Consuming fructose-sweetened, not glucose-sweetened, beverages increases visceral adiposity and lipids and decreases insulin sensitivity in overweight/obese humans. J. Clin. Investig. 2009, 119, 1322–1334. [Google Scholar] [CrossRef] [PubMed] [Green Version]
- Ma, J.; McKeown, N.M.; Hwang, S.-J.; Hoffmann, U.; Jacques, P.F.; Fox, C.S. Sugar-Sweetened Beverage Consumption Is Associated With Change of Visceral Adipose Tissue Over 6 Years of Follow-Up. Circulation 2016, 133, 370–377. [Google Scholar] [CrossRef] [PubMed] [Green Version]
- Litherland, G.J.; Hajduch, E.; Gould, G.W.; Hundal, H.S. Fructose transport and metabolism in adipose tissue of Zucker rats: Diminished GLUT5 activity during obesity and insulin resistance. Mol. Cell. Biochem. 2004, 261, 23–33. [Google Scholar] [CrossRef] [PubMed]
- Froesch, E.R.; Ginsberg, J.L. Fructose metabolism of adipose tissue. I. Comparison of fructose and glucose metabolism in epididymal adipose tissue of normal rats. J. Biol. Chem. 1962, 237, 3317–3324. [Google Scholar] [PubMed]
- Legeza, B.; Balázs, Z.; Odermatt, A. Fructose promotes the differentiation of 3T3-L1 adipocytes and accelerates lipid metabolism. FEBS Lett. 2014, 588, 490–496. [Google Scholar] [CrossRef] [PubMed]
- Del Mar Romero, M.; Sabater, D.; Fernández-López, J.A.; Remesar, X.; Alemany, M. Glycerol production from glucose and fructose by 3T3-L1 Cells: A mechanism of Adipocyte defense from excess substrate. PLoS ONE 2015, 10, 1–18. [Google Scholar]
- Zubiría, M.; Alzamendi, A.; Moreno, G.; Rey, M.; Spinedi, E.; Giovambattista, A. Long-Term Fructose Intake Increases Adipogenic Potential: Evidence of Direct Effects of Fructose on Adipocyte Precursor Cells. Nutrients 2016, 8, 198. [Google Scholar] [CrossRef] [PubMed]
- Du, L.; Heaney, A.P. Regulation of adipose differentiation by fructose and GluT5. Mol. Endocrinol. 2012, 26, 1773–1782. [Google Scholar] [CrossRef] [PubMed]
- Gericke, B.; Schecker, N.; Amiri, M.; Naim, H.Y. Structure-function analysis of human sucrase-isomaltase identifies key residues required for catalytic activity. J. Biol. Chem. 2017, 292, 11070–11078. [Google Scholar] [CrossRef] [Green Version]
- Jones, H.F.; Butler, R.N.; Brooks, D.A. Intestinal fructose transport and malabsorption in humans. AJP Gastrointest. Liver Physiol. 2011, 300, G202–G206. [Google Scholar] [CrossRef] [Green Version]
- Jang, C.; Hui, S.; Lu, W.; Cowan, A.J.; Morscher, R.J.; Lee, G.; Liu, W.; Tesz, G.J.; Birnbaum, M.J.; Rabinowitz, J.D. The Small Intestine Converts Dietary Fructose into Glucose and Organic Acids. Cell. Metab. 2018, 27, 351–361. [Google Scholar] [CrossRef]
- Francey, C.; Cros, J.; Rosset, R.; Crézé, C.; Rey, V.; Stefanoni, N.; Schneiter, P.; Tappy, L.; Seyssel, K. The extra-splanchnic fructose escape after ingestion of a fructose–glucose drink: An exploratory study in healthy humans using a dual fructose isotope method. Clin. Nutr. ESPEN 2019, 29, 125–132. [Google Scholar] [CrossRef]
- Ferraris, R.P.; Choe, J.; Patel, C.R. Intestinal Absorption of Fructose. Annu. Rev. Nutr. 2018, 38, 41–67. [Google Scholar] [CrossRef]
- Le, M.T.; Frye, R.F.; Rivard, C.J.; Cheng, J.; McFann, K.K.; Segal, M.S.; Johnson, R.J.; Johnson, J.A. Effects of high-fructose corn syrup and sucrose on the pharmacokinetics of fructose and acute metabolic and hemodynamic responses in healthy subjects. Metabolism 2012, 61, 641–651. [Google Scholar] [CrossRef] [PubMed] [Green Version]
- Sugimoto, K.; Hosotani, T.; Kawasaki, T.; Nakagawa, K.; Hayashi, S.; Nakano, Y.; Inui, H.; Yamanouchi, T. Eucalyptus leaf extract suppresses the postprandial elevation of portal, cardiac and peripheral fructose concentrations after sucrose ingestion in rats. J. Clin. Biochem. Nutr. 2010, 46, 205–211. [Google Scholar] [CrossRef] [PubMed]
- Intemann, T.; Pigeot, I.; De Henauw, S.; Eiben, G.; Lissner, L.; Krogh, V.; Dereń, K.; Molnár, D.; Moreno, L.A.; Russo, P.; et al. Urinary sucrose and fructose to validate self-reported sugar intake in children and adolescents: Results from the I.Family study. Eur. J. Nutr. 2018, 58, 1247–1258. [Google Scholar] [CrossRef] [PubMed]
- Campbell, R.; Tasevska, N.; Jackson, K.G.; Sagi-Kiss, V.; di Paolo, N.; Mindell, J.S.; Lister, S.J.; Khaw, K.-T.; Kuhnle, G.G.C. Association between urinary biomarkers of total sugars and sucrose intake and BMI in a cross-sectional study. BioRxiv 2017, 12, e0179508. [Google Scholar]
- Gonzalez-Vicente, A.; Cabral, P.D.; Hong, N.J.; Asirwatham, J.; Saez, F.; Garvin, J.L. Fructose Reabsorption By Rat Proximal Tubules: Role of Sodium-Linked Cotransporters and the Effect of Dietary Fructose. Am. J. Physiol. Ren. Physiol. 2018, 316, F473–F480. [Google Scholar] [CrossRef] [PubMed]
- Lin, W.T.; Chan, T.F.; Huang, H.L.; Lee, C.Y.; Tsai, S.; Wu, P.W.; Yang, Y.C.; Wang, T.N.; Lee, C.H. Fructose-Rich Beverage Intake and Central Adiposity, Uric Acid, and Pediatric Insulin Resistance. J. Pediatr. 2016, 171, 90–96. [Google Scholar] [CrossRef]
- Taskinen, M.-R.; Söderlund, S.; Bogl, L.H.; Hakkarainen, A.; Matikainen, N.; Pietiläinen, K.H.; Räsänen, S.; Lundbom, N.; Björnson, E.; Eliasson, B.; et al. Adverse effects of fructose on cardiometabolic risk factors and hepatic lipid metabolism in subjects with abdominal obesity. J. Intern. Med. 2017, 282, 187–201. [Google Scholar] [CrossRef]
- Schwarz, J.-M.; Noworolski, S.M.; Erkin-Cakmak, A.; Korn, N.J.; Wen, M.J.; Tai, V.W.; Jones, G.M.; Palii, S.P.; Velasco-Alin, M.; Pan, K.; et al. Effects of Dietary Fructose Restriction on Liver Fat, De Novo Lipogenesis, and Insulin Kinetics in Children With Obesity. Gastroenterology 2017, 153, 743–752. [Google Scholar] [CrossRef] [Green Version]
- Bursać, B.N.; Vasiljević, A.D.; Nestorović, N.M.; Veličković, N.A.; Vojnović Milutinović, D.D.; Matić, G.M.; Djordjevic, A.D. High-fructose diet leads to visceral adiposity and hypothalamic leptin resistance in male rats—Do glucocorticoids play a role? J. Nutr. Biochem. 2014, 25, 446–455. [Google Scholar] [CrossRef]
- Kovačević, S.; Nestorov, J.; Matić, G.; Elaković, I. Dietary fructose-related adiposity and glucocorticoid receptor function in visceral adipose tissue of female rats. Eur. J. Nutr. 2014, 53, 1409–1420. [Google Scholar] [CrossRef]
- Qi, Q.; Chu, A.Y.; Kang, J.H.; Jensen, M.K.; Curhan, G.C.; Pasquale, L.R.; Ridker, P.M.; Hunter, D.J.; Willett, W.C.; Rimm, E.B.; et al. Sugar-Sweetened Beverages and Genetic Risk of Obesity. New Engl. J. Med. 2012, 367, 1387–1396. [Google Scholar] [CrossRef] [PubMed]
- Brunkwall, L.; Chen, Y.; Hindy, G.; Rukh, G.; Ericson, U.; Barroso, I.; Johansson, I.; Franks, P.W.; Orho-Melander, M.; Renström, F. Sugar-sweetened beverage consumption and genetic predisposition to obesity in 2 Swedish cohorts. Am. J. Clin. Nutr. 2016, 104, 809–815. [Google Scholar] [CrossRef] [PubMed]
- Olsen, N.J.; Ängquist, L.; Larsen, S.C.; Linneberg, A.; Skaaby, T.; Husemoen, L.L.N.; Toft, U.; Tjønneland, A.; Halkjær, J.; Hansen, T.; et al. Interactions between genetic variants associated with adiposity traits and soft drinks in relation to longitudinal changes in body weight and waist circumference. Am. J. Clin. Nutr. 2016, 104, 816–826. [Google Scholar] [CrossRef] [PubMed]
- Burmeister, M.A.; Ayala, J.; Drucker, D.J.; Ayala, J.E. Central glucagon-like peptide 1 receptor-induced anorexia requires glucose metabolism-mediated suppression of AMPK and is impaired by central fructose. Am. J. Physiol. Endocrinol. Metab. 2013, 304, E677–E685. [Google Scholar] [CrossRef] [PubMed] [Green Version]
- Marek, G.; Pannu, V.; Shanmugham, P.; Pancione, B.; Mascia, D.; Crosson, S.; Ishimoto, T.; Sautin, Y.Y. Adiponectin resistance and proinflammatory changes in the visceral adipose tissue induced by fructose consumption via ketohexokinase-dependent pathway. Diabetes 2015, 64, 508–518. [Google Scholar] [CrossRef] [PubMed]
- Pinnick, K.; Cornfield, T.; Green, C.; Hodson, L. Fructose is metabolised by human subcutaneous adipocytes and can be used as a substrate for de novo lipogenesis. Endocr. Abstr. 2018, 59, 173. [Google Scholar] [CrossRef]
- Robubi, A.; Huber, K.R.; Krugluger, W. Extra fructose in the growth medium fuels lipogenesis of adipocytes. J. Obes. 2014, 2014, 6. [Google Scholar] [CrossRef]
- Low, W.; Cornfield, T.; Charlton, C.; Tomlinson, J.; Hodson, L.; Low, W.S. Sex Differences in Hepatic De Novo Lipogenesis with Acute Fructose Feeding. Nutrients 2018, 10, 1263. [Google Scholar] [CrossRef]
- Pinnick, K.E.; Hodson, L. Challenging metabolic tissues with fructose: Tissue-specific and sex-specific responses. J. Physiol. 2019. [Google Scholar] [CrossRef]
- Sanchez-Lozada, L.G.; Andres-Hernando, A.; Garcia-Arroyo, F.E.; Cicerchi, C.; Li, N.; Kuwabara, M.; Roncal-Jimenez, C.A.; Johnson, R.J.; Lanaspa, M.A. Uric acid activates aldose reductase and the polyol pathway for endogenous fructose and fat production causing development of fatty liver in rats. J. Biol. Chem. 2019, 294, 4272–4281. [Google Scholar] [CrossRef]
- Karagianni, P.; Talianidis, I. Transcription factor networks regulating hepatic fatty acid metabolism. Biochim. Biophys. Acta Mol. Cell Biol. Lipids 2015, 1851, 2–8. [Google Scholar] [CrossRef] [PubMed]
- Gonzales, A.M.; Orlando, R.A. Role of adipocyte-derived lipoprotein lipase in adipocyte hypertrophy. Nutr. Metab. 2007, 4, 22. [Google Scholar] [CrossRef] [PubMed]
- Maithilikarpagaselvi, N.; Sridhar, M.G.; Swaminathan, R.P.; Sripradha, R.; Badhe, B. Curcumin inhibits hyperlipidemia and hepatic fat accumulation in high-fructose-fed male Wistar rats. Pharm. Biol. 2016, 54, 2857–2863. [Google Scholar] [CrossRef] [PubMed] [Green Version]
- Chiba, T.; Nakazawa, T.; Yui, K.; Kaneko, E.; Shimokado, K. VLDL induces adipocyte differentiation in ApoE-dependent manner. Arterioscler. Thromb. Vasc. Biol. 2003, 23, 1423–1429. [Google Scholar] [CrossRef] [PubMed]
- Zhang, M.; Li, Y.; Wei, X.; Tian, F.; Ouyang, F.; Zhao, S.; Liu, L. Indispensable role of lipoprotein bound-ApoE in adipogenesis and endocytosis induced by postprandial TRL. Biochem. Biophys. Res. Commun. 2017, 493, 298–305. [Google Scholar] [CrossRef] [PubMed]
- Ferraù, F.; Korbonits, M. Metabolic comorbidities in Cushing’s syndrome. Eur. J. Endocrinol. 2015, 173, M133–M157. [Google Scholar] [CrossRef] [PubMed]
- Delivanis, D.A.; Iñiguez-Ariza, N.M.; Zeb, M.H.; Moynagh, M.R.; Takahashi, N.; McKenzie, T.J.; Thomas, M.A.; Gogos, C.; Young, W.F.; Bancos, I.; et al. Impact of hypercortisolism on skeletal muscle mass and adipose tissue mass in patients with adrenal adenomas. Clin. Endocrinol. 2018, 88, 209–216. [Google Scholar] [CrossRef]
- Do, T.T.H.; Marie, G.; Héloïse, D.; Guillaume, D.; Marthe, M.; Bruno, F.; Buyse, M. Glucocorticoid-induced insulin resistance is related to macrophage visceral adipose tissue infiltration. J. Steroid Biochem. Mol. Biol. 2019, 185, 150–162. [Google Scholar] [CrossRef]
- DiNicolantonio, J.J.; Mehta, V.; Onkaramurthy, N.; O’Keefe, J.H. Fructose-induced inflammation and increased cortisol: A new mechanism for how sugar induces visceral adiposity. Prog. Cardiovasc. Dis. 2018, 61, 3–9. [Google Scholar] [CrossRef]
- Senesi, S.; Legeza, B.; Balázs, Z.; Csala, M.; Marcolongo, P.; Kereszturi, É.; Szelényi, P.; Egger, C.; Fulceri, R.; Mandl, J.; et al. Contribution of Fructose-6-Phosphate to Glucocorticoid Activation in the Endoplasmic Reticulum: Possible Implication in the Metabolic Syndrome. Endocrinology 2010, 151, 4830–4839. [Google Scholar] [CrossRef] [Green Version]
- Walker, B.R.; Andrew, R. Tissue Production of Cortisol by 11β-Hydroxysteroid Dehydrogenase Type 1 and Metabolic Disease. Ann. NY Acad. Sci. 2006, 1083, 165–184. [Google Scholar] [CrossRef]
- London, E.; Castonguay, T.W. High Fructose Diets Increase 11β-Hydroxysteroid Dehydrogenase Type 1 in Liver and Visceral Adipose in Rats Within 24-h Exposure. Obesity 2011, 19, 925–932. [Google Scholar] [CrossRef]
- Prince, P.D.; Santander, Y.A.; Gerez, E.M.; Höcht, C.; Polizio, A.H.; Mayer, M.A.; Taira, C.A.; Fraga, C.G.; Galleano, M.; Carranza, A. Fructose increases corticosterone production in association with NADPH metabolism alterations in rat epididymal white adipose tissue. J. Nutr. Biochem. 2017, 46, 109–116. [Google Scholar] [CrossRef]
- Park, Y.-K.; Ge, K. Glucocorticoid Receptor Accelerates, but Is Dispensable for, Adipogenesis. Mol. Cell. Biol. 2017, 37. [Google Scholar] [CrossRef]
- Xu, C.; He, J.; Jiang, H.; Zu, L.; Zhai, W.; Pu, S.; Xu, G. Direct Effect of Glucocorticoids on Lipolysis in Adipocytes. Mol. Endocrinol. 2009, 23, 1161–1170. [Google Scholar] [CrossRef] [Green Version]
- Niehof, M.; Manns, M.P.; Trautwein, C. CREB controls LAP/C/EBP beta transcription. Mol. Cell. Biol. 1997, 17, 3600–3613. [Google Scholar] [CrossRef] [Green Version]
- Bursać, B.N.; Djordjevic, A.D.; Vasiljević, A.D.; Milutinović, D.D.V.; Veličković, N.A.; Nestorović, N.M.; Matic, G.M. Fructose consumption enhances glucocorticoid action in rat visceral adipose tissue. J. Nutr. Biochem. 2013, 24, 1166–1172. [Google Scholar] [CrossRef]
- Lefterova, M.I.; Haakonsson, A.K.; Lazar, M.A.; Mandrup, S. PPARγ and the global map of adipogenesis and beyond. Trends Endocrinol. Metab. 2014, 25, 293–302. [Google Scholar] [CrossRef]
- Donkor, J.; Sariahmetoglu, M.; Dewald, J.; Brindley, D.N.; Reue, K. Three Mammalian Lipins Act as Phosphatidate Phosphatases with Distinct Tissue Expression Patterns. J. Biol. Chem. 2006, 282, 3450–3457. [Google Scholar] [CrossRef]
- Zhang, P.; O’Loughlin, L.; Brindley, D.N.; Reue, K. Regulation of lipin-1 gene expression by glucocorticoids during adipogenesis. J. Lipid Res. 2008, 49, 1519–1528. [Google Scholar] [CrossRef]
- Hu, M.; Wang, F.; Li, X.; Rogers, C.Q.; Liang, X.; Finck, B.N.; Mitra, M.S.; Zhang, R.; Mitchell, D.A.; You, M. Regulation of hepatic lipin-1 by ethanol: Role of AMP-activated protein kinase/sterol regulatory element-binding protein 1 signaling in mice. Hepatology 2012, 55, 437–446. [Google Scholar] [CrossRef]
- Koh, Y.-K.; Lee, M.-Y.; Kim, J.-W.; Kim, M.; Moon, J.-S.; Lee, Y.-J.; Ahn, Y.-H.; Kim, K.-S. Lipin1 Is a Key Factor for the Maturation and Maintenance of Adipocytes in the Regulatory Network with CCAAT/Enhancer-binding Protein α and Peroxisome Proliferator-activated Receptor γ2. J. Biol. Chem. 2008, 283, 34896–34906. [Google Scholar] [CrossRef]
- Tang, L.Y.; Chen, Y.; Rui, B.B.; Hu, C.M. Resveratrol ameliorates lipid accumulation in HepG2 cells, associated with down-regulation of lipin1 expression. Can. J. Physiol. Pharmacol. 2016, 94, 185–189. [Google Scholar] [CrossRef]
- Csaki, L.S.; Reue, K. Lipins: Multifunctional Lipid Metabolism Proteins. Annu. Rev. Nutr. 2010, 30, 257–272. [Google Scholar] [CrossRef] [Green Version]
- Soberman, R.J. Series Introduction: The expanding network of redox signaling: New observations, complexities, and perspectives. J. Clin. Investig. 2003, 111, 571–574. [Google Scholar] [CrossRef]
- Braunersreuther, V.; Jaquet, V. Reactive Oxygen Species in Myocardial Reperfusion Injury: From Physiopathology to Therapeutic Approaches. Curr. Pharm. Biotechnol. 2012, 13, 97–114. [Google Scholar] [CrossRef]
- Coso, S.; Harrison, I.; Harrison, C.B.; Vinh, A.; Sobey, C.G.; Drummond, G.R.; Williams, E.D.; Selemidis, S. NADPH Oxidases as Regulators of Tumor Angiogenesis: Current and Emerging Concepts. Antioxid. Redox Signal. 2012, 16, 1229–1247. [Google Scholar] [CrossRef] [Green Version]
- Storz, P. Forkhead Homeobox Type O Transcription Factors in the Responses to Oxidative Stress. Antioxid. Redox Signal. 2011, 14, 593–605. [Google Scholar] [CrossRef] [Green Version]
- Imhoff, B.R.; Hansen, J.M. Extracellular redox environments regulate adipocyte differentiation. Differentiation 2010, 80, 31–39. [Google Scholar] [CrossRef]
- Tormos, K.V.; Anso, E.; Hamanaka, R.B.; Eisenbart, J.; Joseph, J.; Kalyanaraman, B.; Chandel, N.S. Mitochondrial Complex III ROS Regulate Adipocyte Differentiation. Cell Metab. 2011, 14, 537–544. [Google Scholar] [CrossRef] [Green Version]
- Han, J.; Choi, H.Y.; Dayem, A.A.; Kim, K.; Yang, G.; Won, J.; Do, S.H.; Kim, J.-H.; Jeong, K.-S.; Cho, S.-G. Regulation of Adipogenesis Through Differential Modulation of ROS and Kinase Signaling Pathways by 3,4’-Dihydroxyflavone Treatment. J. Cell. Biochem. 2017, 118, 1065–1077. [Google Scholar] [CrossRef]
- Lee, Y.-J.; Seo, M.-J.; Lee, O.-H.; Kim, K.-J.; Lee, B.-Y. Hesperetin inhibits lipid accumulation and ROS production during adipocyte differentiation in 3T3-L1 cells. J. Food Biochem. 2017, 41. [Google Scholar] [CrossRef]
- Delbosc, S.; Paizanis, E.; Magous, R.; Araiz, C.; Dimo, T.; Cristol, J.-P.; Cros, G.; Azay, J. Involvement of oxidative stress and NADPH oxidase activation in the development of cardiovascular complications in a model of insulin resistance, the fructose-fed rat. Atherosclerosis 2005, 179, 43–49. [Google Scholar] [CrossRef]
- Jaiswal, N.; Maurya, C.K.; Pandey, J.; Rai, A.K.; Tamrakar, A.K. Fructose-induced ROS generation impairs glucose utilization in L6 skeletal muscle cells. Free. Radic. Res. 2015, 49, 1055–1068. [Google Scholar] [CrossRef]
- Crescenzo, R.; Bianco, F.; Coppola, P.; Mazzoli, A.; Valiante, S.; Liverini, G.; Lossa, S. Adipose tissue remodeling in rats exhibiting fructose-induced obesity. Eur. J. Nutr. 2014, 53, 413–419. [Google Scholar] [CrossRef]
- Bratoeva, K.; Radanova, M.; Merdzhanova, A.; Donev, I. Protective role of S-Adenosylmethionine against fructose-induced oxidative damage in obesity. J. Mind Med. Sci. 2017, 4, 163–171. [Google Scholar] [CrossRef] [Green Version]
- Pektas, M.B.; Koca, H.B.; Sadi, G.; Akar, F. Dietary Fructose Activates Insulin Signaling and Inflammation in Adipose Tissue: Modulatory Role of Resveratrol. BioMed Res. Int. 2016, 2016, 1–10. [Google Scholar] [CrossRef] [Green Version]
- Crujeiras, A.B.; Díaz-Lagares, A.; Carreira, M.C.; Amil, M.; Casanueva, F.F. Oxidative stress associated to dysfunctional adipose tissue: A potential link between obesity, type 2 diabetes mellitus and breast cancer. Free Radic. Res. 2013, 47, 243–256. [Google Scholar] [CrossRef]
- Lafontan, M. Adipose tissue and adipocyte dysregulation. Diabetes Metab. 2014, 40, 16–28. [Google Scholar] [CrossRef]
- Zhang, X.; Zhang, J.-H.; Chen, X.-Y.; Hu, Q.-H.; Wang, M.-X.; Jin, R.; Zhang, Q.-Y.; Wang, W.; Wang, R.; Kang, L.-L.; et al. Reactive oxygen species-induced TXNIP drives fructose-mediated hepatic inflammation and lipid accumulation through NLRP3 inflammasome activation. Antioxid. Redox Signal. 2015, 22, 848–870. [Google Scholar] [CrossRef]
- Araoye, E.; Ckless, K. Effects of High Fructose/Glucose on Nlrp3/Il1β Inflammatory Pathway. J. Young Investig. 2016, 31, 25–30. [Google Scholar]
- Khitan, Z.; Harsh, M.; Sodhi, K.; Shapiro, J.I.; Abraham, N.G. HO-1 Upregulation Attenuates Adipocyte Dysfunction, Obesity, and Isoprostane Levels in Mice Fed High Fructose Diets. J. Nutr. Metab. 2014, 2014, 13. [Google Scholar] [CrossRef]
- Zhu, Y.; Pandya, B.J.; Choi, H.K. Comorbidities of Gout and Hyperuricemia in the US General Population: NHANES 2007–2008. Am. J. Med. 2012, 125, 679–687. [Google Scholar] [CrossRef]
- Matsuura, F.; Yamashita, S.; Nakamura, T.; Nishida, M.; Nozaki, S.; Funahashi, T.; Matsuzawa, Y. Effect of visceral fat accumulation on uric acid metabolism in male obese subjects: Visceral fat obesity is linked more closely to overproduction of uric acid than subcutaneous fat obesity. Metabolism 1998, 47, 929–933. [Google Scholar] [CrossRef]
- Gu, D.; Ding, Y.; Zhao, Y.; Miao, S.; Qu, Q. Positively increased visceral adiposity index in hyperuricemia free of metabolic syndrome. Lipids Health Dis. 2018, 17, 101. [Google Scholar] [CrossRef]
- Dong, H.; Xu, Y.; Zhang, X.; Tian, S. Visceral adiposity index is strongly associated with hyperuricemia independently of metabolic health and obesity phenotypes. Sci. Rep. 2017, 7, 8822. [Google Scholar] [CrossRef]
- Lanaspa, M.A.; Tapia, E.; Soto, V.; Sautin, Y.; Sánchez-Lozada, L.G. Uric Acid and Fructose: Potential Biological Mechanisms. Semin. Nephrol. 2011, 31, 426–432. [Google Scholar] [CrossRef]
- Sodhi, K.; Hilgefort, J.; Banks, G.; Gilliam, C.; Stevens, S.; Ansinelli, H.A.; Getty, M.; Abraham, N.G.; Shapiro, J.I.; Khitan, Z. Uric Acid-Induced Adipocyte Dysfunction Is Attenuated by HO-1 Upregulation: Potential Role of Antioxidant Therapy to Target Obesity. Stem Cells Int. 2016, 2016, 8197325. [Google Scholar] [CrossRef]
- Berry, C.E.; Hare, J.M. Xanthine oxidoreductase and cardiovascular disease: Molecular mechanisms and pathophysiological implications. J. Physiol. 2004, 555, 589–606. [Google Scholar] [CrossRef]
- Tsushima, Y.; Nishizawa, H.; Tochino, Y.; Nakatsuji, H.; Sekimoto, R.; Nagao, H.; Shirakura, T.; Kato, K.; Imaizumi, K.; Takahashi, H.; et al. Uric acid secretion from adipose tissue and its increase in obesity. J. Biol. Chem. 2013, 288, 27138–27149. [Google Scholar] [CrossRef]
- Sautin, Y.Y.; Nakagawa, T.; Zharikov, S.; Johnson, R.J. Adverse effects of the classic antioxidant uric acid in adipocytes: NADPH oxidase-mediated oxidative/nitrosative stress. Am. J. Physiol. Cell Physiol. 2007, 293, C584–C596. [Google Scholar] [CrossRef]
- Baldwin, W.; McRae, S.; Marek, G.; Wymer, D.; Pannu, V.; Baylis, C.; Johnson, R.J.; Sautin, Y.Y. Hyperuricemia as a Mediator of the Proinflammatory Endocrine Imbalance in the Adipose Tissue in a Murine Model of the Metabolic Syndrome. Diabetes 2011, 60, 1258–1269. [Google Scholar] [CrossRef] [Green Version]
- Henriksen, E.J.; Diamond-Stanic, M.K.; Marchionne, E.M. Oxidative stress and the etiology of insulin resistance and type 2 diabetes. Free Radic. Biol. Med. 2011, 51, 993–999. [Google Scholar] [CrossRef] [Green Version]
- Kanda, Y.; Hinata, T.; Kang, S.W.; Watanabe, Y. Reactive oxygen species mediate adipocyte differentiation in mesenchymal stem cells. Life Sci. 2011, 89, 250–258. [Google Scholar] [CrossRef]
- Giani, J.F.; Muñoz, M.C.; Mayer, M.A.; Veiras, L.C.; Arranz, C.; Taira, C.A.; Turyn, D.; Toblli, J.E.; Dominici, F.P. Angiotensin-(1–7) improves cardiac remodeling and inhibits growth-promoting pathways in the heart of fructose-fed rats. Am. J. Physiol. Heart Circ. Physiol. 2010, 298, H1003–H1013. [Google Scholar] [CrossRef]
- Tran, L.T.; Yuen, V.G.; McNeill, J.H. The fructose-fed rat: A review on the mechanisms of fructose-induced insulin resistance and hypertension. Mol. Cell. Biochem. 2009, 332, 145–159. [Google Scholar] [CrossRef]
- Chou, C.-L.; Lin, H.; Chen, J.-S.; Fang, T.-C. Renin inhibition improves metabolic syndrome, and reduces angiotensin II levels and oxidative stress in visceral fat tissues in fructose-fed rats. PLoS ONE 2017, 12. [Google Scholar] [CrossRef]
- Furuhashi, M.; Ura, N.; Takizawa, H.; Yoshida, D.; Moniwa, N.; Murakami, H.; Higashiura, K.; Shimamoto, K. Blockade of the renin-angiotensin system decreases adipocyte size with improvement in insulin sensitivity. J. Hypertens. 2004, 22, 1977–1982. [Google Scholar] [CrossRef]
- Muñoz, M.C.; Giani, J.F.; Dominici, F.P.; Turyn, D.; Toblli, J.E. Long-term treatment with an angiotensin II receptor blocker decreases adipocyte size and improves insulin signaling in obese Zucker rats. J. Hypertens. 2009, 27, 2409–2420. [Google Scholar] [CrossRef]
- Shinozaki, K.; Ayajiki, K.; Nishio, Y.; Sugaya, T.; Kashiwagi, A.; Okamura, T. Evidence for a Causal Role of the Renin-Angiotensin System in Vascular Dysfunction Associated With Insulin Resistance. Hypertension 2004, 43, 255–262. [Google Scholar] [CrossRef]
- Magliano, D.C.; Penna-de-Carvalho, A.; Vazquez-Carrera, M.; Mandarim-de-Lacerda, C.A.; Aguila, M.B. Short-term administration of GW501516 improves inflammatory state in white adipose tissue and liver damage in high-fructose-fed mice through modulation of the renin-angiotensin system. Endocrine 2015, 50, 355–367. [Google Scholar] [CrossRef]
- Harrison-Bernard, L.M. The renal renin-angiotensin system. Adv. Physiol. Educ. 2009, 33, 270–274. [Google Scholar] [CrossRef] [Green Version]
- Donoghue, M.; Hsieh, F.; Baronas, E.; Godbout, K.; Gosselin, M.; Stagliano, N.; Donovan, M.; Woolf, B.; Robison, K.; Jeyaseelan, R.; et al. A novel angiotensin-converting enzyme-related carboxypeptidase (ACE2) converts angiotensin I to angiotensin 1–9. Circ. Res. 2000, 87, E1–E9. [Google Scholar] [CrossRef]
- Santos, R.A.S.; Ferreira, A.J.; Simões e Silva, A.C. Recent advances in the angiotensin-converting enzyme 2—Angiotensin(1–7)—Mas axis. Exp. Physiol. 2008, 93, 519–527. [Google Scholar] [CrossRef]
- Coelho, M.S.; Lopes, K.L.; Freitas R de, A.; de Oliveira-Sales, E.B.; Bergasmaschi, C.T.; Campos, R.R.; Casarini, D.E.; Carmona, A.K.; da SilvaAraújo, M.; Heimann, J.C.; et al. High sucrose intake in rats is associated with increased ACE2 and angiotensin—(1–7) levels in the adipose tissue. Regul Pept. 2010, 162, 61–67. [Google Scholar] [CrossRef]
- Than, A.; Leow, M.K.-S.; Chen, P. Control of adipogenesis by the autocrine interplays between angiotensin 1–7/Mas receptor and angiotensin II/AT1 receptor signaling pathways. J. Biol. Chem. 2013, 288, 15520–15531. [Google Scholar] [CrossRef]
- Guarente, L.; Picard, F. Calorie restriction—The SIR2 connection. Cell 2005, 120, 473–482. [Google Scholar] [CrossRef]
- Bordone, L.; Cohen, D.; Robinson, A.; Motta, M.C.; Van Veen, E.; Czopik, A.; Steele, A.D.; Crowe, H.; Marmor, S.; Luo, J.; et al. SIRT1 transgenic mice show phenotypes resembling calorie restriction. Aging Cell 2007, 6, 759–767. [Google Scholar] [CrossRef]
- Haigis, M.C.; Guarente, L.P. Mammalian sirtuins—Emerging roles in physiology, aging, and calorie restriction. Genes Dev. 2006, 20, 2913–2921. [Google Scholar] [CrossRef]
- Zhou, Y.; Song, T.; Peng, J.; Zhou, Z.; Wei, H.; Zhou, R.; Jiang, S.; Peng, J. SIRT1 suppresses adipogenesis by activating Wnt/B-catenin signaling in vivo and in vitro. Oncotarget 2016, 7, 77707–77720. [Google Scholar] [CrossRef]
- Martínez-Jiménez, V.; Cortez-Espinosa, N.; Rodríguez-Varela, E.; Vega-Cárdenas, M.; Briones-Espinoza, M.; Ruíz-Rodríguez, V.M.; López-López, N.; Briseño-Medina, A.; Turiján-Espinoza, E.; Portales-Pérez, D.P. Altered levels of sirtuin genes (SIRT1, SIRT2, SIRT3 and SIRT6) and their target genes in adipose tissue from individual with obesity. Diabetes Metab. Syndr. Clin. Res. Rev. 2019, 13, 582–589. [Google Scholar] [CrossRef]
- Kurylowicz, A.; Owczarz, M.; Polosak, J.; Jonas, M.I.; Lisik, W.; Jonas, M.; Chmura, A.; Kuznicka, M.P. SIRT1 and SIRT7 expression in adipose tissues of obese and normal-weight individuals is regulated by microRNAs but not by methylation status. Int. J. Obes. 2016, 40, 1635–1642. [Google Scholar] [CrossRef]
- Gillum, M.P.; Kotas, M.E.; Erion, D.M.; Kursawe, R.; Chatterjee, P.; Nead, K.T.; Muise, E.S.; Hsiao, J.J.; Frederick, D.W.; Yonemitsu, S.; et al. SirT1 regulates adipose tissue inflammation. Diabetes 2011, 60, 3235–3245. [Google Scholar] [CrossRef]
- Picard, F.; Kurtev, M.; Chung, N.; Topark-Ngarm, A.; Senawong, T.; Machado de Oliveira, R.; Leid, M.; McBurney, M.W.; Guarente, L. SIRT1 promotes fat mobilization in white adipocytes by repressing PPAR-γ. Nature 2004, 429, 771–776. [Google Scholar] [CrossRef]
- Zhou, Y.; Zhou, Z.; Zhang, W.; Hu, X.; Wei, H.; Peng, J.; Liang, S. SIRT1 inhibits adipogenesis and promotes myogenic differentiation in C3H10T1/2 pluripotent cells by regulating Wnt signaling. Cell Biosci. 2015, 5, 61. [Google Scholar] [CrossRef]
- Park, M.; Sharma, A.; Lee, H.-J.; Park, M.; Sharma, A.; Lee, H.-J. Anti-Adipogenic Effects of Delphinidin-3-O-β-Glucoside in 3T3-L1 Preadipocytes and Primary White Adipocytes. Molecules 2019, 24, 1848. [Google Scholar] [CrossRef]
- Qiang, L.; Wang, L.; Kon, N.; Zhao, W.; Lee, S.; Zhang, Y.; Rosenbaum, M.; Zhao, Y.; Gu, W.; Farmer, S.R.; et al. Brown remodeling of white adipose tissue by SirT1-dependent deacetylation of Pparγ. Cell 2012, 150, 620–632. [Google Scholar] [CrossRef]
- Artsi, H.; Gurt, I.; El-Haj, M.; Müller, R.; Kuhn, G.A.; Ben Shalom, G.; Cohen-Kfir, E.; Abramowitz, E.; Kandel, L.; Safran, O.; et al. Sirt1 Promotes a Thermogenic Gene Program in Bone Marrow Adipocytes: From Mice to (Wo)Men. Front. Endocrinol. 2019, 10, 126. [Google Scholar] [CrossRef] [Green Version]
- Dobner, J.; Ress, C.; Rufinatscha, K.; Salzmann, K.; Salvenmoser, W.; Folie, S.; Wieser, V.; Moser, P.; Weiss, G.; Goebel, G.; et al. Fat-enriched rather than high-fructose diets promote whitening of adipose tissue in a sex-dependent manner. J. Nutr. Biochem. 2017, 49, 22–29. [Google Scholar] [CrossRef]
- Bargut, T.C.L.; Martins, F.F.; Santos, L.P.; Aguila, M.B.; Mandarim-de-Lacerda, C.A. Administration of eicosapentaenoic and docosahexaenoic acids may improve the remodeling and browning in subcutaneous white adipose tissue and thermogenic markers in brown adipose tissue in mice. Mol. Cell. Endocrinol. 2019, 482, 18–27. [Google Scholar] [CrossRef]
- Kanarek, R.B.; Orthen-Gambill, N. Differential Effects of Sucrose, Fructose and Glucose on Carbohydrate-Induced Obesity in Rats. J. Nutr. 1982, 112, 1546–1554. [Google Scholar] [CrossRef] [Green Version]
- Jatkar, A.; Kurland, I.J.; Judex, S. Diets High in Fat or Fructose Differentially Modulate Bone Health and Lipid Metabolism. Calcif. Tissue Int. 2017, 100, 20–28. [Google Scholar] [CrossRef]
- Machado, T.Q.; Pereira-Silva, D.C.; Gonçalves, L.F.; Fernandes-Santos, C. Brown Adipose Tissue Remodeling Precedes Cardiometabolic Abnormalities Independent of Overweight in Fructose-Feed Mice. BioRxiv 2019. [Google Scholar] [CrossRef]
- Liu, Z.; Qiao, Q.; Sun, Y.; Chen, Y.; Ren, B.; Liu, X. Sesamol ameliorates diet-induced obesity in C57BL/6J mice and suppresses adipogenesis in 3T3-L1 cells via regulating mitochondria-lipid metabolism. Mol. Nutr. Food Res. 2017, 61, 1–43. [Google Scholar] [CrossRef]
- Gebert, L.F.R.; MacRae, I.J. Regulation of microRNA function in animals. Nat. Rev. Mol. Cell Biol. 2019, 20, 21–37. [Google Scholar] [CrossRef]
- Shi, C.; Zhang, M.; Tong, M.; Yang, L.; Pang, L.; Chen, L.; Xu, G.; Chi, X.; Hong, Q.; Ni, Y.; et al. miR-148a is Associated with Obesity and Modulates Adipocyte Differentiation of Mesenchymal Stem Cells through Wnt Signaling. Sci. Rep. 2015, 5, 9930. [Google Scholar] [CrossRef]
- Arner, P.; Kulyté, A. MicroRNA regulatory networks in human adipose tissue and obesity. Nat. Rev. Endocrinol. 2015, 11, 276–288. [Google Scholar] [CrossRef]
- Sud, N.; Zhang, H.; Pan, K.; Cheng, X.; Cui, J.; Su, Q. Aberrant expression of microRNA induced by high-fructose diet: Implications in the pathogenesis of hyperlipidemia and hepatic insulin resistance. J. Nutr. Biochem. 2017, 43, 125–131. [Google Scholar] [CrossRef]
- Tang, R.; Ma, F.; Li, W.; Ouyang, S.; Liu, Z.; Wu, J. miR-206-3p Inhibits 3T3-L1 Cell Adipogenesis via the c-Met/PI3K/Akt Pathway. Int. J. Mol. Sci. 2017, 18, 1510. [Google Scholar] [CrossRef]
- Ding, X.Q.; Gu, T.T.; Wang, W.; Song, L.; Chen, T.Y.; Xue, Q.C.; Zhou, F.; Li, J.-M.; Kong, L.-D. Curcumin protects against fructose-induced podocyte insulin signaling impairment through upregulation of miR-206. Mol. Nutr. Food Res. 2015, 59, 2355–2370. [Google Scholar] [CrossRef]
- Price, N.L.; Singh, A.K.; Rotllan, N.; Goedeke, L.; Wing, A.; Canfrán-Duque, A.; Diaz-Ruiz, A.; Araldi, E.; Baldán, A.; Camporez, J.-P.; et al. Genetic Ablation of miR-33 Increases Food Intake, Enhances Adipose Tissue Expansion, and Promotes Obesity and Insulin Resistance. Cell Rep. 2018, 22, 2094–2106. [Google Scholar] [CrossRef]
- Alisi, A.; Da Sacco, L.; Bruscalupi, G.; Piemonte, F.; Panera, N.; De Vito, R.; Leoni, S.; Bottazzo, G.F.; Masotti, A.; Nobili, V. Mirnome analysis reveals novel molecular determinants in the pathogenesis of diet-induced nonalcoholic fatty liver disease. Lab. Investig. 2011, 91, 283–293. [Google Scholar] [CrossRef]
- Liao, C.H.; Wang, C.Y.; Liu, K.H.; Liu, Y.Y.; Wen, M.S.; Yeh, T.S. MiR-122 marks the differences between subcutaneous and visceral adipose tissues and associates with the outcome of bariatric surgery. Obes. Res. Clin. Pract. 2018, 12, 570–577. [Google Scholar] [CrossRef]
- Huang, N.; Wang, J.; Xie, W.; Lyu, Q.; Wu, J.; He, J.; Qiu, W.; Xu, N.; Zhang, Y. MiR-378a-3p enhances adipogenesis by targeting mitogen-activated protein kinase 1. Biochem. Biophys. Res. Commun. 2015, 457, 37–42. [Google Scholar] [CrossRef]
- Brianza-Padilla, M.; Carbó, R.; Arana, J.C.; Vázquez-Palacios, G.; Ballinas-Verdugo, M.A.; Cardoso-Saldaña, G.C.; Palacio, A.G.; Juárez-Vicuña, Y.; Sánchez, F.; Martínez-Martínez, E.; et al. Inflammation Related MicroRNAs Are Modulated in Total Plasma and in Extracellular Vesicles from Rats with Chronic Ingestion of Sucrose. BioMed Res. Int. 2016, 2016, 1–7. [Google Scholar] [CrossRef]
- Guan, X.; Gao, Y.; Zhou, J.; Wang, J.; Zheng, F.; Guo, F.; Guang, A.; Li, X.; Wang, B. miR-223 Regulates Adipogenic and Osteogenic Differentiation of Mesenchymal Stem Cells Through a C/EBPs/miR-223/FGFR2 Regulatory Feedback Loop. Stem Cells 2015, 33, 1589–1600. [Google Scholar] [CrossRef]
- Jeong Kim, Y.; Jin Hwang, S.; Chan Bae, Y.; Sup Jung, J. MiR-21 regulates adipogenic differentiation through the modulation of TGF-?? signaling in mesenchymal stem cells derived from human adipose tissue. Stem Cells 2009, 27, 3093–3102. [Google Scholar]
- Kang, M.; Yan, L.-M.; Zhang, W.-Y.; Li, Y.-M.; Tang, A.-Z.; Ou, H.-S. Role of microRNA-21 in regulating 3T3-L1 adipocyte differentiation and adiponectin expression. Mol. Biol. Rep. 2013, 40, 5027–5034. [Google Scholar] [CrossRef]


© 2019 by the authors. Licensee MDPI, Basel, Switzerland. This article is an open access article distributed under the terms and conditions of the Creative Commons Attribution (CC BY) license (http://creativecommons.org/licenses/by/4.0/).
Share and Cite
Hernández-Díazcouder, A.; Romero-Nava, R.; Carbó, R.; Sánchez-Lozada, L.G.; Sánchez-Muñoz, F. High Fructose Intake and Adipogenesis. Int. J. Mol. Sci. 2019, 20, 2787. https://0-doi-org.brum.beds.ac.uk/10.3390/ijms20112787
Hernández-Díazcouder A, Romero-Nava R, Carbó R, Sánchez-Lozada LG, Sánchez-Muñoz F. High Fructose Intake and Adipogenesis. International Journal of Molecular Sciences. 2019; 20(11):2787. https://0-doi-org.brum.beds.ac.uk/10.3390/ijms20112787
Chicago/Turabian StyleHernández-Díazcouder, Adrián, Rodrigo Romero-Nava, Roxana Carbó, L. Gabriela Sánchez-Lozada, and Fausto Sánchez-Muñoz. 2019. "High Fructose Intake and Adipogenesis" International Journal of Molecular Sciences 20, no. 11: 2787. https://0-doi-org.brum.beds.ac.uk/10.3390/ijms20112787