Article

Insulin Sensitivity Is Associated with Lipoprotein Lipase (LPL) and Catenin Delta 2 (CTNND2) DNA Methylation in Peripheral White Blood Cells in Non-Diabetic Young Women

by
Ana Arpón
1,†,
José L. Santos
2,*,†,
Fermín I. Milagro
1,3,4,
Luis Rodrigo Cataldo
2,
Carolina Bravo
2,
José-Ignacio Riezu-Boj
1,3,‡ and
J. Alfredo Martínez
1,3,4,5,‡
1
Department of Nutrition, Food Sciences and Physiology and Centre for Nutrition Research, University of Navarra, 31008 Pamplona, Spain
2
Department of Nutrition, Diabetes and Metabolism, School of Medicine, Pontificia Universidad Católica de Chile, Santiago 8331150, Chile
3
Navarra Institute for Health Research (IdiSNa), 31008 Pamplona, Spain
4
Centro de Investigación Biomédica en Red Fisiopatología de la Obesidad y Nutrición (CIBERobn), Instituto de Salud Carlos III, 28029 Madrid, Spain
5
Precision Nutrition and Cardiometabolic Health Program, Madrid Institute for Advanced Studies (IMDEA), IMDEA Food, 28049 Madrid, Spain
*
Author to whom correspondence should be addressed.
These authors contributed equally to this work.
These authors share senior authorship.
Int. J. Mol. Sci. 2019, 20(12), 2928; https://0-doi-org.brum.beds.ac.uk/10.3390/ijms20122928
Submission received: 10 May 2019 / Revised: 3 June 2019 / Accepted: 12 June 2019 / Published: 15 June 2019
(This article belongs to the Special Issue Epigenetics of Diabetes and Related Complications)

Abstract

:
Hyperglycaemia and type 2 diabetes (T2D) are associated with impaired insulin secretion and/or insulin action. Since few studies have addressed the relation between DNA methylation patterns with elaborated surrogates of insulin secretion/sensitivity based on the intravenous glucose tolerance test (IVGTT), the aim of this study was to evaluate the association between DNA methylation and an insulin sensitivity index based on IVGTT (calculated insulin sensitivity index (CSi)) in peripheral white blood cells from 57 non-diabetic female volunteers. The CSi and acute insulin response (AIR) indexes, as well as the disposition index (DI = CSi × AIR), were estimated from abbreviated IVGTT in 49 apparently healthy Chilean women. Methylation levels were assessed using the Illumina Infinium Human Methylation 450k BeadChip. After a statistical probe filtering, the two top CpGs whose methylation was associated with CSi were cg04615668 and cg07263235, located in the catenin delta 2 (CTNND2) and lipoprotein lipase (LPL) genes, respectively. Both CpGs conjointly predicted insulin sensitivity status with an area under the curve of 0.90. Additionally, cg04615668 correlated with homeostasis model assessment insulin-sensitivity (HOMA-S) and AIR, whereas cg07263235 was associated with plasma creatinine and DI. These results add further insights into the epigenetic regulation of insulin sensitivity and associated complications, pointing the CTNND2 and LPL genes as potential underlying epigenetic biomarkers for future risk of insulin-related diseases.

1. Introduction

Diabetes is defined as “a group of metabolic diseases characterized by hyperglycaemia resulting from defects in insulin secretion, insulin action, or both” [1]. Although the relative contribution of insulin secretion versus insulin action impairments in type 2 diabetes (T2D) depends on many factors, it has been extensively reported that obesity-related insulin resistance plays an important role in the onset and development of T2D [2]. Insulin resistance (or its inverse, insulin sensitivity) shows high inter-individual variability. Therefore, it is important to assess the performance of biomarkers of insulin sensitivity in the absence of hyperglycaemia, before inflammation and other obesity-related impairments of metabolism appear, in order to adequately evaluate the initial stages and directionality of the relation between the proposed biomarkers with insulin sensitivity. Epidemiologic studies have focused on simple measurements of insulin sensitivity based on glucose and insulin fasting plasma samples, such as the homeostasis model assessment insulin-sensitivity (HOMA-S) index, which is the inverse of the commonly used HOMA-insulin resistance (HOMA-IR) index [3]. Given that the main contributor of circulating glucose in fasting conditions is the liver, it is generally accepted that the HOMA-S index predominantly represents a measure of hepatic insulin sensitivity [4]. In contrast, other insulin sensitivity measurements, such as the M-value of the hyperinsulinemic-euglycaemic clamp, are obtained under conditions where a constant high level of circulating insulin is maintained and then, endogenous hepatic glucose production is inhibited [5]. Thus, the M-value can be considered mainly a measure of systemic and/or muscle/adipose insulin sensitivity. Alternatively, other general measures of insulin sensitivity have been derived from the oral glucose tolerance test (OGTT), that allows the calculation of the Matsuda-ISICOMP index and other insulin-related indexes, or from the intravenous glucose tolerance test (IVGTT) [6]. The IVGTT is a procedure that has the interesting operational advantage of allowing the simultaneous measurement of insulin secretion and insulin sensitivity in the same test [7,8]. The specific use of an abbreviated version of the IVGTT (1 hour test, instead of the extended 3 hour IVGTT test) provides gold-standard measurements of acute insulin release (AIR), using the area under the curve (AUC) of plasma insulin during the first 10 min of the IVGTT, and adequate estimations of insulin sensitivity through the calculated insulin sensitivity (CSi), using the plasma insulin and glucose measurements during the second part, 10 to 50 min of the abbreviated IVGTT [9]. Interestingly, a hyperbolic relation has been described for insulin secretion and sensitivity indexes derived from IVGTT in such a way that it is possible to calculate the disposition index (DI) as the product between insulin secretion and insulin sensitivity (DI = AIR × CSi) [7,10]. DI is considered a measure of insulin secretion adjusted by systemic insulin sensitivity representing a marker of glucose homeostasis dysregulation [11]. Additionally, it has been reported that both DI and the oral disposition index (ODI) based on OGTT are relevant predictors of future T2D development [12].
In the prediabetes status, the increased plasma glucose levels and the hyperinsulinemia are triggered by a failure in normal glucose homeostasis that have been related, among many other factors, with transcriptional variations in key metabolic organs that may be explained by epigenetic regulation [13]. Indeed, epigenome-wide association studies (EWASs) have revealed an influence of DNA methylation in genes related to T2D and glucose homeostasis [14,15,16,17,18,19,20]. These changes directly influence both insulin-producing pancreatic β-cells, as well as other organs involved in glucose homeostasis. Changes in methylation patterns related to T2D development are also accompanied by variations of methylation patterns in blood cells [21,22]. There are no studies in the literature analysing the relations between leukocyte DNA methylation across the genome and insulin sensitivity measured by IVGTT or studies specifically focused on the DI.
Since diabetes is not usually diagnosed until several years after the appearance of insulin and glucose deregulation, it is crucial to detect the early stages of the disease through the use of adequate biomarkers of reduced insulin sensitivity [23]. In this context, studies conducted in non-diabetic subjects are useful in evaluating novel biomarkers to identify the susceptibility to develop T2D through the evaluation of intermediate phenotypes such as the insulin sensitivity. Therefore, the aim of this study was to assess the association between DNA methylation patterns in peripheral white blood cells (PWBCs) with measures of insulin sensitivity based on the intravenous glucose tolerance tests in non-diabetic women.

2. Results

2.1. Anthropometric and Biochemical Characteristics of the Participants

Summary statistics for anthropometric and biochemical variables, as well as insulin sensitivity measurements, are reported in Table 1.

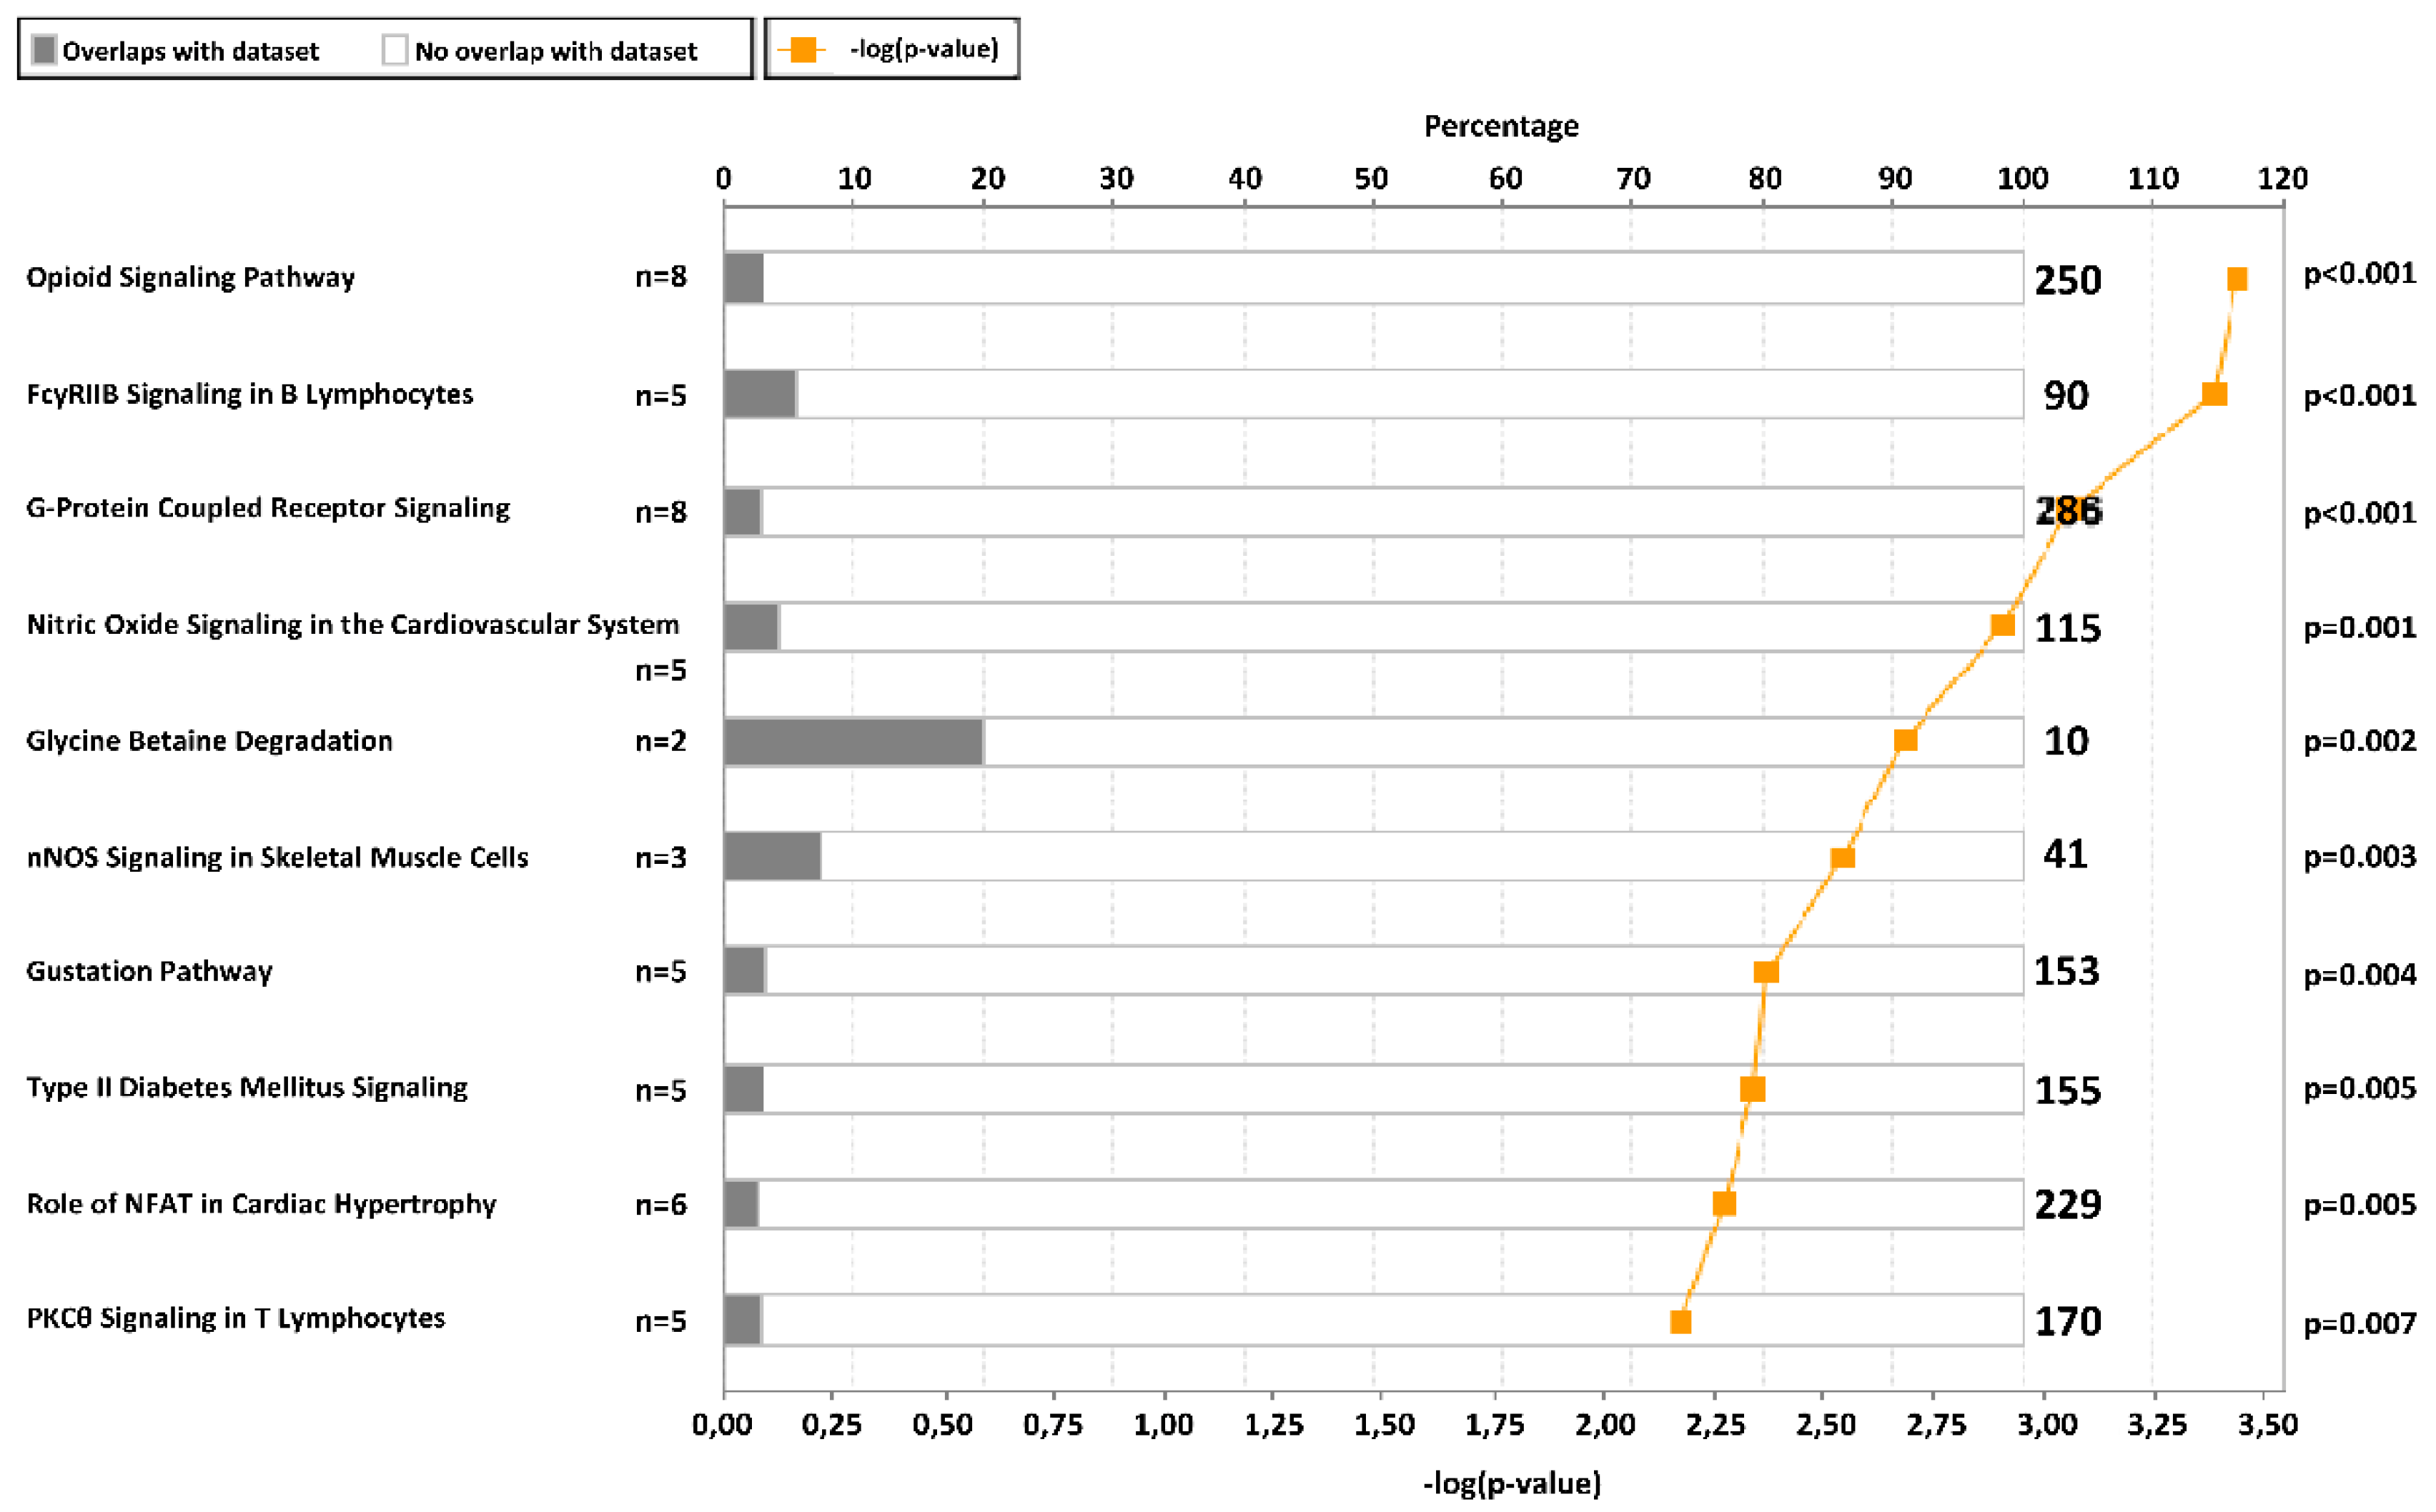
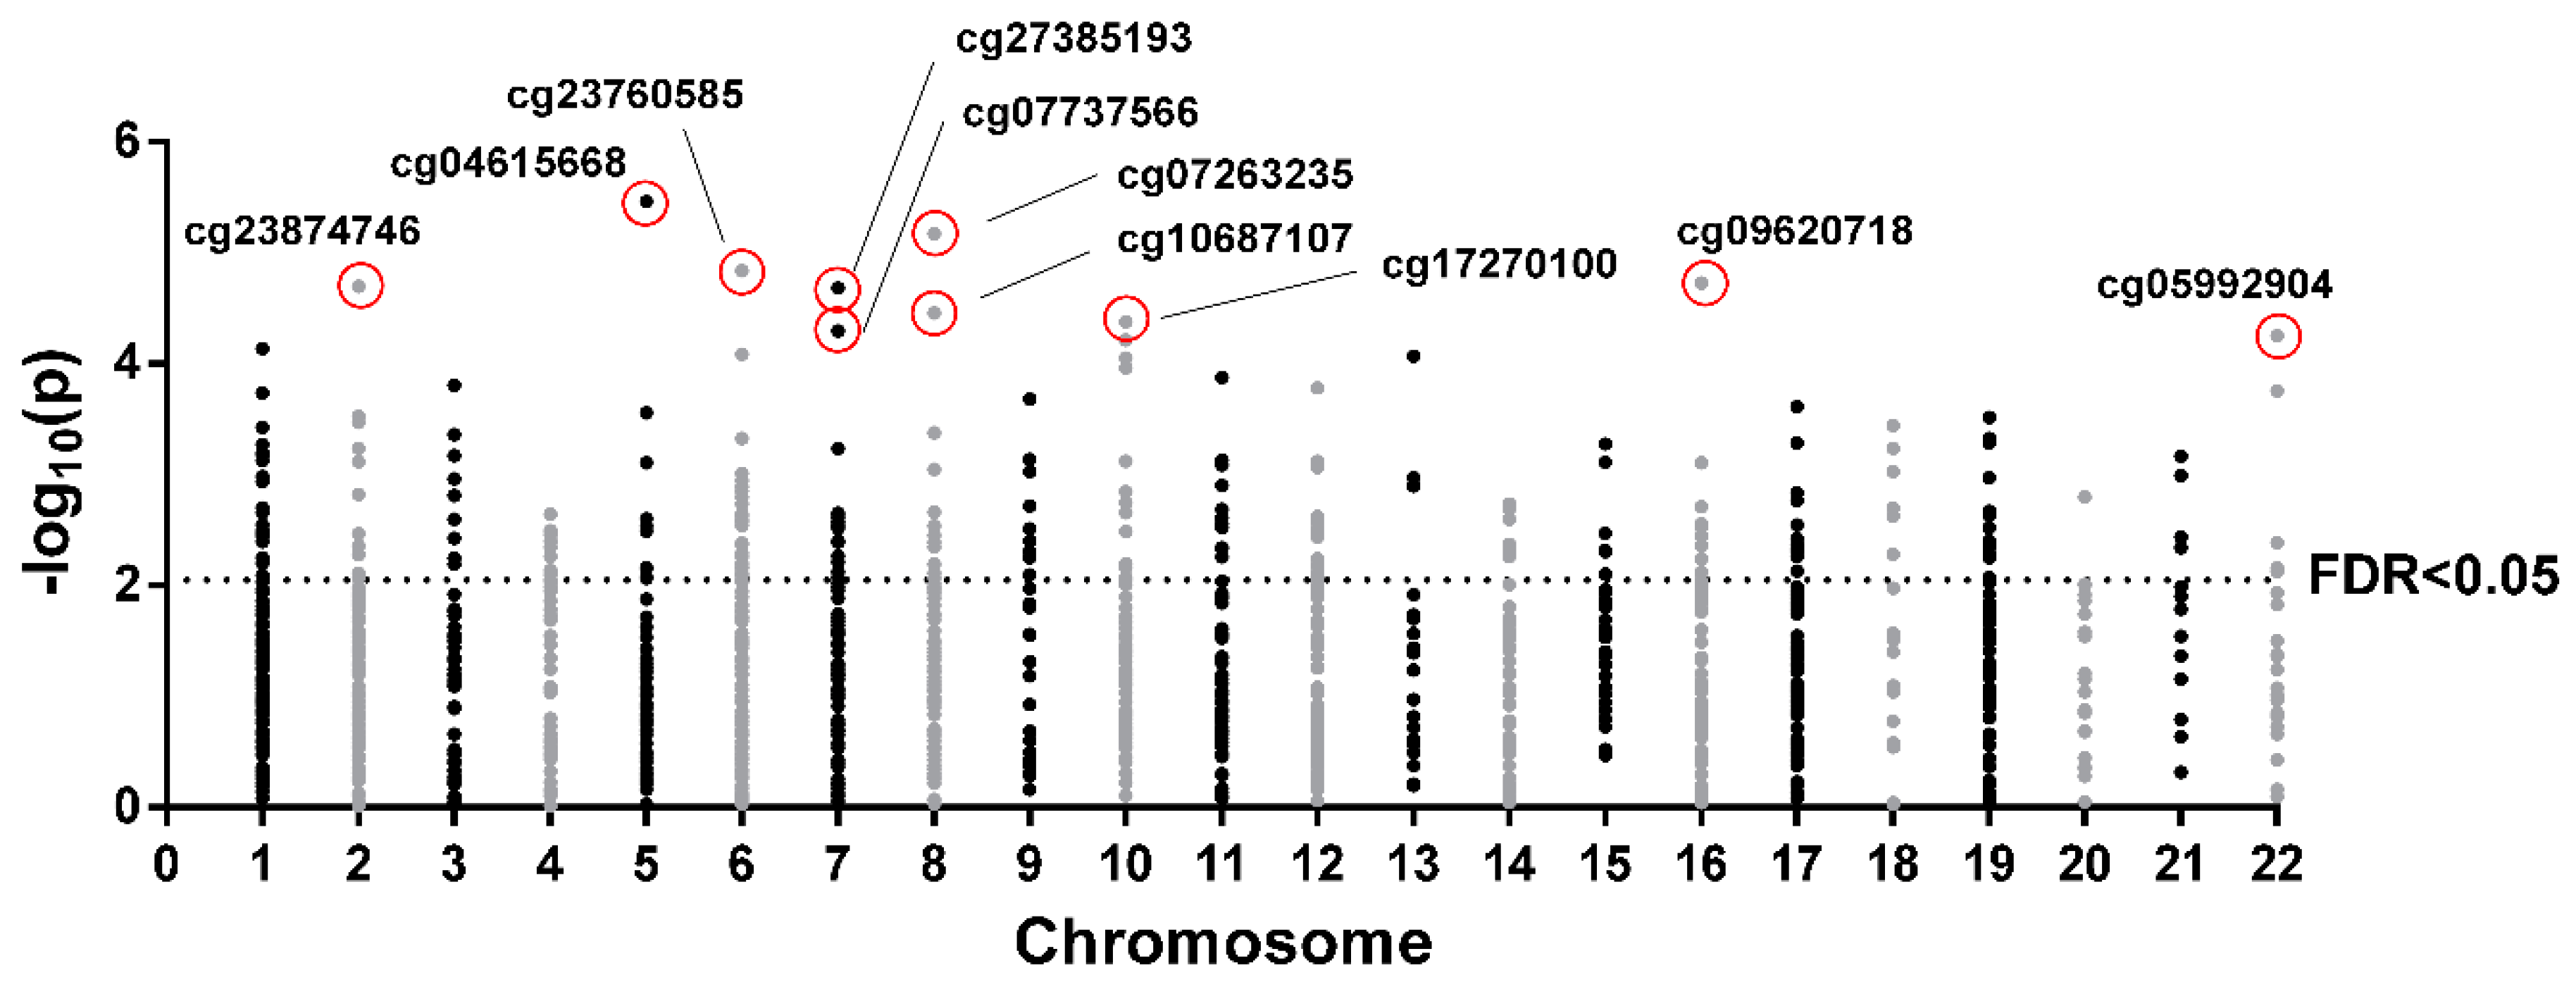
2.2. CpG Sites Selection and Ingenuity Pathway Analysis

In order to identify the CpG sites with the highest methylation variability that may have a biological implication, an initial selection by the slope between methylation and CSi was performed to discard multiple CpG sites showing lack of intrinsic variation. Then, 1416 CpGs with a slope >|0.005| were further analysed (Figure 1, Table S1) because of their correlation with CSi. The raw p-values from non-parametric correlational analysis were subsequently adjusted by the Benjamini–Hochberg method, resulting in 253 CpG sites significantly associated with CSi (false discovery rate (FDR) < 0.05) (Table S2). These 253 CpGs were analysed for canonical pathways from Ingenuity Pathway Analysis (IPA) (Table S3). Some of the obtained canonical pathways were related to insulin and glucose (Figure 2), such as opioid signalling pathway, G-protein coupled receptor, glycine betaine degradation, nitric oxide signalling in the cardiovascular system, gustation pathway or type 2 diabetes mellitus.
The 10 top most significant CpGs of the 253 CpGs selected by FDR < 0.05 were cg04615668-CTNND2 (corresponding gene according to the Illumina CG Database), cg07263235-LPL, cg09620718-ACSM1, cg23760585-FLJ22536, cg23874746-PDE1A, cg27385193-NA, cg10687107-NA, cg17270100-NA, cg07737566-GRB10, and cg05992904-FAM19A5 (Figure 3, Figure S1). Further analyses where performed with the two most significant CpGs, cg04615668 and cg07263235, which are located in the genes catenin delta 2 (CTNND2) and lipoprotein lipase (LPL), respectively. Correlations between DNA methylation and CSi for both CpGs are plotted (Figure 4A).

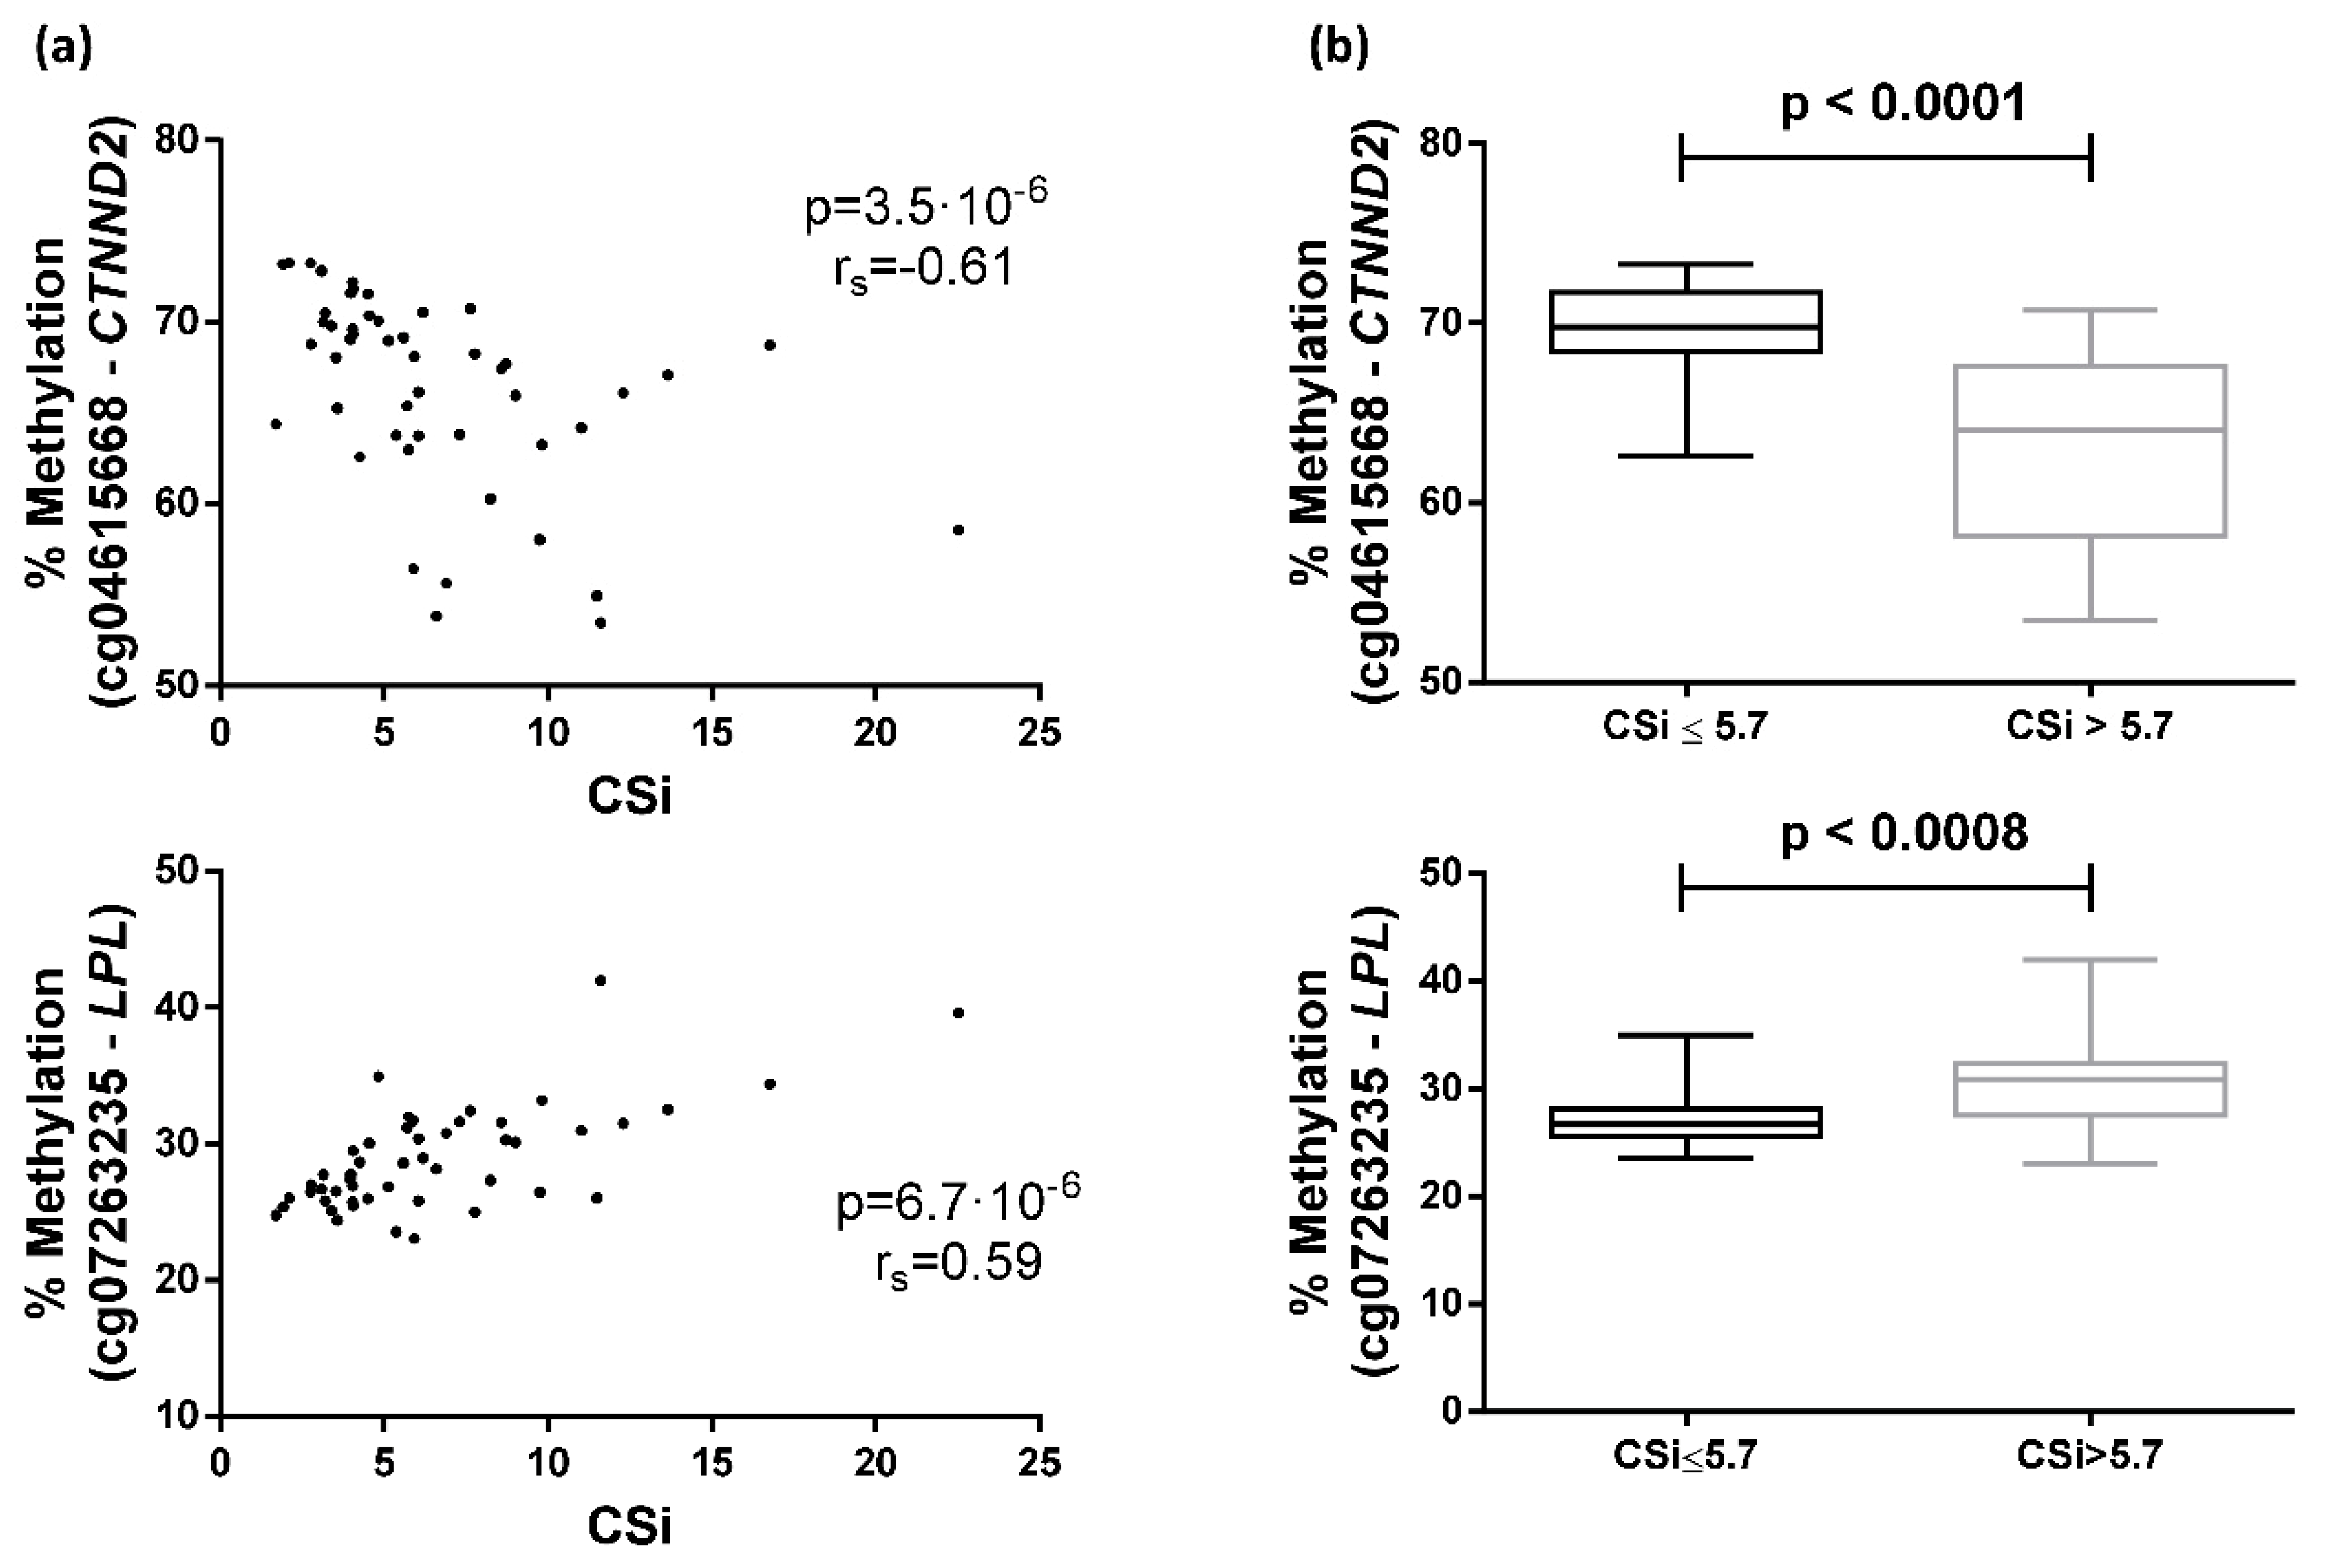
2.3. Differences between Groups Separated by the Median of CSi Values

Participants of the GEDYMET (genetics, dysglycemia and metabolism) study were also separated by the median CSi values (cut-off value = 5.7) to categorise the subjects into insulin-sensitive (higher CSi values, n = 24) and insulin-resistant (lower CSi values, n = 25) groups. The group with higher CSi showed a methylation mean and SD of 63.2(5.4) for cg04615668 and 30.7(4.2) for cg07263235, whereas the group with lower CSi presented a methylation mean and SD of 69.4(3.0) and 27.1(2.4) for cg04615668 and cg07263235, respectively. Significant differences in methylation percentage of cg04615668 and cg07263235 were found when comparing both groups (Figure 4B).
Additionally, logistic regressions and receiver operating characteristic (ROC) curves, both adjusted by age, were carried out to determine whether both CpG site methylation levels were able to predict the CSi group. Logistic regressions showed an odds ratio (OR) = 0.67 for cg04615668 (pseudo R2 = 0.34, p < 0.0001) and OR = 1.43 for cg07263235 (pseudo R2 = 0.21, p = 0.0009). The AUCs were estimated as 0.86 (95% confidence interval 0.75–0.96) for cg04615668 and 0.81 (95% confidence interval 0.68–0.94) for cg07263235. Interestingly, multiple logistic regression including both CpGs adjusted by age significantly improved the model (OR cg04615668 = 0.68, OR cg07263235 = 1.36, pseudo R2 = 0.44, p < 0.0001), reaching an AUC of 0.90 for predicting CSi (Figure 5).

2.4. Correlation with Other Variables

Furthermore, methylation values at the cg04615668 site significantly correlated with AIR (p = 0.0098) and HOMA-S (p = 0.0483) (Figure 6A), while methylation values at the cg07263235 site were significantly associated with plasma creatinine (p = 0.0314) and DI (p = 0.0120) (Figure 6B).

3. Discussion

The CpG sites cg04615668 and cg07263235, located in the CTNND2 and LPL genes, respectively, achieved the most significant signals of association between DNA methylation levels in PWBCs and IVGTT-based insulin sensitivity measurements (CSi). Methylation of these specific CpGs was clearly different in the two groups separated by the median CSi of the whole group. Furthermore, both CpGs together were able to predict CSi using ROC curve analysis. The CpG cg04615668 was also associated with the AIR and HOMA-S indexes, whereas cg07263235 was correlated with the DI (defined as the product between AIR × CSi) and plasma creatinine levels. To our knowledge, this study is the first to relate CSi with DNA methylation, adding further insights into the epigenetic regulation of systemic insulin sensitivity and related traits.
There is a need to develop biomarkers to detect early steps in the pathophysiologic progression of T2D, as well as to elucidate underlying mechanisms of the disease [24]. Genetics, epigenetics, as well as non-genetic factors (diet, lifestyle) are involved in the pathogenesis of dysglycaemia and T2D [25]. On the other hand, deregulations in insulin sensitivity and secretion might be associated with epigenetic modifications [13]. Previous EWAS showed an association between DNA methylation patterns in PWBCs and T2D and glucose homeostasis traits [14,15,16,17,18,19,20]. Additionally, different studies have proposed potential DNA methylation biomarkers in relation to plasma insulin levels, insulin secretion and insulin resistance such as those located in PPARGC1A, HTR2A, LY86, TFAM, GIPR, ADIPOQ, and IGFBP3 genes [21]. Our study has found a relation between the insulin sensitivity index CSi, based on IVGTT [9], and methylation of CpGs in several genes. According to IPA, some of these genes were related to insulin-related pathways and T2D signalling, such as type 2 diabetes mellitus signalling. In the case of the opiod signalling pathway, opioid µ-receptors may be activated by β-endorphin to improve insulin resistance [26] and opiates can inhibit insulin signalling through direct crosstalk between the downstream signalling pathways of the opioid receptor and the insulin receptor [27]. As for the G-protein coupled receptor signalling, insulin and glucagon secretion is affected by factors binding to G-protein coupled receptors on the surface of β- and α-cells [28]. Regarding the glycine betaine degradation pathway, glycine betaine improves glucose tolerance and has been associated with reduced incidence of diabetes [29]. Furthermore, the pathway nitric oxide signalling in the cardiovascular system involves nitric oxide, which represents a central regulator of energy metabolism and body composition [30], and it is also a component of the insulin-signalling cascade [31]. The gustation pathway may also be related since inhibition of sweet chemosensory receptors alters insulin responses during glucose ingestion [32]. Specifically, statistically significant CpGs (FDR < 0.05) from our study that were previously related to insulin were located in the genes LPL [33], GRB10 [34], WISP1 [35], PRDM16 [36], TMEM132C [37], ADAMTS9 [38], and NOX4 [39].
The CpG cg04615668 is located in the gene CTNND2 (according to Illumina CG database), which encodes an adhesive junction associated protein called catenin delta 2, δ-catenin, NPRAP or neurojungin. This protein functions in Wnt signalling to regulate gene expression [40] and has been reported to be involved in the pathogenesis of cancer, cortical cataract-linked Alzheimer’s disease, autism, schizophrenia, mental retardation, myopia, and infectious diseases [40]. For example, CTNND2 plays a critical role in neuronal development since it has been observed that it is likely rate-limiting for dendritic morphogenesis and maintenance, and its haploinsufficiency is common in autism [41]. However, little is known about the implication of CTNND2 in metabolic diseases. In this context, a polymorphism located at this gene (rs6873671) has been significantly associated with human type 2 diabetes in two independent genome-wide studies [42,43], suggesting that CTNND2 is involved in the regulation of glucose metabolism. Another polymorphism (rs10513097) has appeared in a genome-wide association study (GWAS) related to body mass index [44]. For this reason, it is necessary to highlight the importance of the present study, because it is the first time that methylation of this gene (in this case, DNA methylation in one CpG) has been linked with impairments in insulin sensitivity and glucose metabolism.
According to the current investigation, the association between cg04615668 methylation and CSi is negative, suggesting that hypomethylation of this site in PWBCs is related to higher insulin sensitivity. Moreover, methylation level in this CpG site is also correlated with two other insulin-related parameters such as the AIR index and HOMA-S, reflecting its involvement in insulin and glucose pathways.
On the other hand, the enzyme encoded by the LPL gene hydrolyses triglycerides in circulating chylomicrons, low density lipoproteins and very low density lipoproteins to render free unesterified fatty acids to the circulation [45]. LPL is synthesized in parenchymal cells such as skeletal muscle cells, adipocytes, macrophages and mammary gland cells, among other tissues and cell types [46]. After maturation in the rough endoplasmic reticulum (mainly driven by the lipase maturation factor-1 or LMF1), LPL is secreted and binds to heparan sulphate proteoglycans which are crucial in the translocation of the enzyme from its site of synthesis to the endothelium, also acting as cofactors in enzymatic reactions [47]. LPL activity is additionally regulated by apolipoproteins, angiopoietins, miRNAs and hormones. Insulin is considered a major regulator of adipose tissue LPL, through its effect on LPL transcription during adipocyte differentiation and through increasing LPL mRNA levels [48]. Initially, a tissue-specific regulation of LPL action by insulin was reported in such a way that LPL activity in adipose tissue was stimulated by acute infusions of insulin (leading to free fatty acids for storage) while LPL activity in skeletal muscle was decreased by this hormone [49]. However, nutritional studies involving 2 weeks of a high-carbohydrate diet or high-fat diet in human volunteers seemed to increase the LPL response to carbohydrate feeding in both adipose tissue and skeletal muscle [50]. Moreover, it is also important to remark that mice with muscle-specific LPL overexpression generated a muscle-selective insulin resistance [51]. In contrast, the disruption of LPL in skeletal muscle results in reductions in lipid storage and increased myocyte insulin signalling, together with marked insulin resistance in other tissues, leading finally to obesity and systemic insulin resistance. In support of a mediation role of LPL in systemic insulin sensitivity, Goodarzi et al. (2004) [52] and Goodarzi et al. (2007) [33] found that common LPL gene variation was involved in insulin resistance measured through hyperinsulinemic-euglycaemic clamps and intravenous glucose tolerance tests in Mexican Americans.
According to current research, the association between cg07263235 methylation and CSi is positive. Therefore, hypermethylation of this site in PWBCs might display higher insulin sensitivity. Methylation level in this CpG site is also positively correlated with the DI (CSi × AIR), showing that the hypomethylation in this site may indicate an impaired relative insulin secretion. Houde et al. described that LPL methylation in one specific CpG was lower in placentae of women with gestational diabetes mellitus [53]. However, there are other studies showing that an increase in LPL methylation was detrimental. Indeed, Castellano-Castillo et al. have described higher levels of LPL methylation in adipose tissue from patients with metabolic syndrome [54] and Drogan et al. showed an association between LPL methylation in adipose tissue and regional body fat distribution [55]. The disparity in the results from studies in the scientific literature is difficult to interpret given the multiple differential patterns of methylation in CpG sites of different cells and tissues.
Since the cg07263235 is located at the LPL promoter, a complementary analysis of putative transcription factors that bind on this CpG was performed using the software TRANSFAC (v2019.1) (GeneXplain, Wolfenbüttel, Germany). This software showed that cyclic AMP-responsive element-binding protein 1 (CREB1) may act in the regulation of LPL expression. Other investigators have demonstrated that glucose-dependent insulinotropic polypeptide (GIP), in the presence of insulin, upregulates adipocyte LPL gene transcription through CREB/cAMP-responsive CREB coactivator 2 (TORC2) activation [56]. Thus, we again speculate that the regulation of LPL by CREB might be mediated by cg07263235 methylation. Furthermore, it is worth noting that cg07263235 methylation also correlated with circulating creatinine in our study in a positive manner. Serum creatinine is a surrogate marker for muscle mass in healthy subjects [57]. Since skeletal muscle mass is inversely associated with T2D [58], low creatinine would represent a proxy of low muscle mass and possibly be linked to a higher risk of developing T2D [59].
Remarkably, both CpGs together allowed the distinction of individuals with low and high CSi with an AUC of 0.90. Since these CpGs are associated with different insulin-related parameters, it seems that although they are related to different glucose-related metabolic mechanisms, they complement each other to differentiate CSi groups. Therefore, we speculate on the hypothesis that the methylation at specific sites of the insulin-sensitive genes CTNND2 and LPL may act as biomarkers of whole body insulin resistance, given a possible effect of DNA methylation on gene expression, with subsequent consequences in insulin resistance-related diseases. It must be noted that our population is very specific (healthy non-diabetic young women) and that the CSi is not usually measured in other investigations. Hence, these CpGs are more likely to be biomarkers of early diagnosis of possible insulin-related problems in a healthy population and not in diabetic or metabolic-impaired subjects. Indeed, after an exhaustive search of methylation databases and in a subpopulation of the Methyl Epigenome Network Association (MENA) study (n = 417, females = 59%, T2D = 59, non-T2D = 358), we have not been able to validate our CpGs in insulin-resistant individuals or with T2D (data not shown).
Our study presents several methodological limitations. The sample size is relatively small, which is partially a consequence of the complex IVGTT procedure. As it happens in association studies involving massive measurements, type I and type II errors cannot be discarded, although data preprocessing and strict CpG selections have been carried out to avoid them. Although methylation is tissue-specific, and methylation patterns and the study of insulin-sensitive organs, such as muscle or adipose tissue, are more appropriate to find epigenetic biomarkers for insulin sensitivity, the measure of DNA methylation biomarkers in white blood cells has the advantage of accessibility to the biological sample. Other studies have demonstrated that blood cells can act as proxies for these tissues [21,60,61]. Gene expression analysis would have been helpful to reveal the relationship between methylation and gene function in this particular study, but unfortunately, there was no biological sample available for this purpose. However, the association between the level of methylation in the CpG site cg04615668 and CTNND2 gene expression is generally described as direct, whereas for cg07263235 methylation and LPL gene expression the relation was generally inverse, when assessed in the MEXPRESS online utility (https://mexpress.be/) based on multiple tissue gene expressions in several cancer types. Finally, causality cannot be established due to the transversal nature of the study. DNA methylation can either be a consequence, a cause, or a proxy of insulin action impairment.
In conclusion, this study reports for the first time an association between DNA methylation patterns with the insulin sensitivity index CSi measured through an intravenous glucose challenge. The most significant signals of association correspond to two CpGs located in the CTNND2 (cg04615668) and LPL (cg07263235) genes. These findings may contribute to identifying potential biomarkers and new regulatory mechanisms in insulin-related diseases.

4. Materials and Methods

A cross-sectional study was carried out on 57 non-diabetic nulliparous, non-pregnant women volunteers without parental family history of diabetes. They were recruited for a metabolic study to assess future gestational diabetes (Table 1) (The GEDYMET Chilean study) [11]. Exclusion criteria were previous or in situ diagnosis of diabetes, family history of diabetes, dyslipidaemia, anaemia or pregnancy. The volunteers visited the Centre of Clinical Research (School of Medicine, Pontificia Universidad Católica de Chile) to carry out an abbreviated version of minimal-model IVGTT after the administration of 0.3 grams of glucose per kg of body weight, as a 50% water solution infused for 60 s [9]. As part of the abbreviated IVGTT protocol, plasma glucose and insulin levels were measured at −15, −5, 2, 3, 4, 5, 6, 8 and 10 min to calculate the AIR index as the area under the curve of plasma insulin [62]. After AIR, additional plasma glucose and insulin levels were measured at 10, 15, 20, 30, 40 and 50 min to complete IVGTT and to estimate the CSi using the website http://webmet.pd.cnr.it/csi/ [9]. CSi is considered a surrogate of insulin sensitivity showing strong association with the hyperinsulinemic-euglycaemic clamp. The IVGTT-based DI, represents a measure of insulin secretion adjusted by systemic insulin sensitivity and was calculated as the product of AIR × CSi [63]. Plasma glucose and insulin levels measured at −15 and −5 min before IVGTT were used to calculate the HOMA-S index, which is the inverse of the HOMA-IR index (HOMA-S = 1/HOMA-IR = 1/(fasting insulin (µUI/mL) × fasting glucose (mg/dL)/405)). This research was approved by the Ethics Committee of the School of Medicine, Pontificia Universidad Católica de Chile (Santiago, Chile) in compliance with the Helsinki Declaration of ethical principles for medical research involving human subjects (code 14-281, date 4th June 2015). All participants provided written informed consent.

4.1. Anthropometry, Blood Pressure and Biochemical Determinations

Anthropometric measurements were carried out by trained personnel in light clothing and without shoes, using a calibrated set of stadiometers, scales and tapes. Weight (kg) and height (m) were used to calculate BMI (kg/m2). Systolic and diastolic blood pressure (mmHg) were measured with digital sphygmomanometer as an average of three measurements. Venous blood samples were drawn by venipuncture in EDTA tubes. Plasma was separated from whole blood by centrifugation at 3500 rpm at 5 °C for 15 min, and frozen immediately at −80 °C until assay. Plasma levels of insulin (µU/mL) and glucose (mg/dL) were measured in the central laboratory of the Pontificia Universidad Católica de Chile by standard electro-chemiluminescence and colorimetric methods (http://redsalud.uc.cl/ucchristus/laboratorio-clinico/).

4.2. DNA Methylation Analysis

Genomic DNA was extracted from PWBCs using the MasterPureTM DNA purification kit (Epicenter, Madison, WI, USA) and quantified with the Pico Green dsDNA Quantitation Reagent (Invitrogen, Carlsbad, CA, USA). In order to convert cytosine into uracil, high-quality DNA samples (500 ng) were treated with sodium bisulfite using the EZ-96 DNA Methylation Kit (Zymo Research Corporation, Irvine, CA, USA) according to the manufacturer’s protocol. Illumina Infinium Human Methylation 450k BeadChip (Illumina, San Diego, CA, USA) was employed to measure DNA methylation levels of CpG sites across the human genome. This analysis was conducted in the Unidad de Genotipado y Diagnóstico Genético from the Fundación de Investigación Clínico de Valencia, as detailed elsewhere [64].

4.3. Treatment of Methylation Raw Data

Signal measurement intensities were scanned in the 450k array using the Illumina iScanSQ platform. The intensity of the images was extracted with the GenomeStudio Methylation Software Module (v 1.9.0, Illumina). Methylation raw data are available in NCBI’s gene expression omnibus [65] as part of the MENA study through GEO series accession number GSE115278 (https://0-www-ncbi-nlm-nih-gov.brum.beds.ac.uk/geo/query/acc.cgi?acc=GSE115278).
β-Values were computed using the formula β-Value = M/(U + M) where M and U are the raw “methylated” and “unmethylated” signals, respectively. β-Values were corrected for type I and type II bias using the peak-based correction. Data were normalized in R using a categorical subset quantile normalization method (SQN) and probes associated with X and Y chromosomes were filtered out using the pipeline developed by Touleimat and Tost [66]. Probes with single nucleotide polymorphisms (SNPs) were also filtered out. Differences in methylation resulting from differences in cellular heterogeneity were corrected using estimateCellCounts function from minfi package for R statistical software [67], based on the Houseman method [68].

4.4. Statistical Analysis

After pre-processing, in order to select CpGs with a higher effect that may present biological noticeable implications, 1416 CpGs were selected with a slope >|0.005| calculated from the relationship between methylation and CSi. The methylation of the 1416 CpGs was correlated with CSi using Spearman’s correlation coefficients. p-values were adjusted for multiple testing through the Benjamini–Hochberg method. Afterwards, the top 10 significant CpGs were selected, and the first two (cg04615668 and cg07263235) were further analysed. The Mann–Whitney U test was employed for evaluating the differences between two groups of individuals generated using the median of CSi. Logistic regressions and ROC curve AUCs, both adjusted by age, were calculated to determine if the CpGs were able to predict the median group of each individual. Correlations and the volcano plot were performed using the R statistical software [67]. Other statistical calculations, as well as the ROC curve, were performed with STATA version 12.0 (Stata Corp, College Station, TX, USA). The Manhattan plot, correlation graphs and box plots were generated using GraphPad Prism 6 (Graph-Pad Software, San Diego, CA, USA).

4.5. Ingenuity Pathway Analysis

After the selection of 1416 CpGs (see above), an adequate number of CpGs were selected by having Spearman correlations’ FDR < 0.05 (253 CpGs) and then, analysed using IPA software (Qiagen, Redwood City, CA, USA, www.ingenuity.com). Associated pathways and gene regulatory networks were identified by predefined pathways and functional categories of the ingenuity knowledge base [69]. Canonical pathway analyses were performed with IPA’s core analysis module and selected if p < 0.05 after Fisher’s test for multiple comparison was statistically significant.

Supplementary Materials

Author Contributions

Conceptualization, A.A, J.L.S., F.I.M., J.-I.R.-B. and J.A.M.; formal analysis, A.A.; funding acquisition, J.L.S., F.I.M. and J.A.M.; Investigation, L.R.C. and C.B.; Methodology, A.A., J.L.S. and J.-I.R.-B.; project administration, J.L.S. and J.A.M.; resources, J.L.S., L.R.C. and C.B.; supervision, J.-I.R.-B. and J.A.M.; writing—original draft, A.A. and J.L.S.; writing—review & editing, F.I.M., J.-I.R.-B. and J.A.M.

Funding

This work was supported by the Centre for Nutrition Research (Universidad de Navarra) and grants from CIBERobn (CB12/03/30002), Ministerio de Economía y Competitividad (AGL2013-45554-R) and Chilean Fondo de Desarrollo de Ciencia y Tecnología (FONDECYT, 1150416). A.A. was supported by a “Formación de Profesorado Universitario” predoctoral fellowship from Ministerio de Educación, Cultura y Deporte (FPU15/02790).

Acknowledgments

Contributors from the Methyl Epigenome Network Association (MENA) are gratefully acknowledged.

Conflicts of Interest

The authors declare no conflict of interest.

Abbreviations

AIRAcute insulin response
AUCArea under the curve
CREB1Cyclic AMP-responsive element-binding protein 1
CSiCalculated insulin sensitivity index
DIDisposition index
EWASEpigenome-wide association study
FDRFalse discovery rate
GEDYMETGenetics, dysglycemia and metabolism
GIPGlucose-dependent insulinotropic polypeptide
GWASGenome-wide association study
HOMA-IRHomeostasis model assessment - insulin resistance index
HOMA-SHOMA-insulin sensitivity index
IPAIngenuity pathway analysis
IVGTTIntravenous glucose tolerance test
LPLLipoprotein lipase
MENAMethyl Epigenome Network Association
PWBCsPeripheral white blood cells
ROCReceiver operating characteristic
SNPSingle nucleotide polymorphism
T2DType 2 diabetes
TORC2CREB/cAMP-responsive CREB coactivator 2

References

  1. American Diabetes Association. Diagnosis and classification of diabetes mellitus. Diabetes Care 2014, 37, S81–S90. [Google Scholar] [CrossRef] [PubMed]
  2. Conn, V.S.; Koopman, R.J.; Ruppar, T.M.; Phillips, L.J.; Mehr, D.R.; Hafdahl, A.R. Insulin Sensitivity Following Exercise Interventions: Systematic Review and Meta-Analysis of Outcomes Among Healthy Adults. J. Prim. Care Community Health 2014, 5, 211–222. [Google Scholar] [CrossRef] [PubMed]
  3. Matthews, D.R.; Hosker, J.P.; Rudenski, A.S.; Naylor, B.A.; Treacher, D.F.; Turner, R.C. Homeostasis model assessment: Insulin resistance and beta-cell function from fasting plasma glucose and insulin concentrations in man. Diabetologia 1985, 28, 412–419. [Google Scholar] [CrossRef]
  4. Meier, J.J.; Veldhuis, J.D.; Butler, P.C. Pulsatile Insulin Secretion Dictates Systemic Insulin Delivery by Regulating Hepatic Insulin Extraction in Humans. Diabetes 2005, 54, 1649–1656. [Google Scholar] [CrossRef] [PubMed]
  5. DeFronzo, R.A.; Tobin, J.D.; Andres, R. Glucose clamp technique: A method for quantifying insulin secretion and resistance. Am. J. Physiol. 1979, 237, 214–223. [Google Scholar] [CrossRef] [PubMed]
  6. Cobelli, C.; Toffolo, G.M.; Dalla Man, C.; Campioni, M.; Denti, P.; Caumo, A.; Butler, P.; Rizza, R. Assessment of beta-cell function in humans, simultaneously with insulin sensitivity and hepatic extraction, from intravenous and oral glucose tests. Am. J. Physiol. Endocrinol. Metab. 2007, 293, E1–E15. [Google Scholar] [CrossRef] [PubMed]
  7. Kahn, S.E.; Prigeon, R.L.; McCulloch, D.K.; Boyko, E.J.; Bergman, R.N.; Schwartz, M.W.; Neifing, J.L.; Ward, W.K.; Beard, J.C.; Palmer, J.P.; et al. Quantification of the relationship between insulin sensitivity and beta-cell function in human subjects. Evidence for a hyperbolic function. Diabetes 1993, 42, 1663–1672. [Google Scholar] [CrossRef]
  8. Cersosimo, E.; Solis-Herrera, C.; Trautmann, M.E.; Malloy, J.; Triplitt, C.L. Assessment of Pancreatic beta-Cell Function: Review of Methods and Clinical Applications. Curr. Diabetes Rev. 2014, 10, 2–42. [Google Scholar] [CrossRef]
  9. Tura, A.; Sbrignadello, S.; Succurro, E.; Groop, L.; Sesti, G.; Pacini, G. An empirical index of insulin sensitivity from short IVGTT: Validation against the minimal model and glucose clamp indices in patients with different clinical characteristics. Diabetologia 2010, 53, 144–152. [Google Scholar] [CrossRef]
  10. Bergman, R.N.; Ader, M.; Huecking, K.; Van Citters, G. Accurate assessment of beta-cell function: The hyperbolic correction. Diabetes 2002, 51, S212–S220. [Google Scholar] [CrossRef]
  11. Santos, J.L.; Yevenes, I.; Cataldo, L.R.; Morales, M.; Galgani, J.; Arancibia, C.; Vega, J.; Olmos, P.; Flores, M.; Valderas, J.P.; et al. Development and assessment of the disposition index based on the oral glucose tolerance test in subjects with different glycaemic status. J. Physiol. Biochem. 2016, 72, 121–131. [Google Scholar] [CrossRef] [PubMed]
  12. Utzschneider, K.M.; Prigeon, R.L.; Faulenbach, M.V.; Tong, J.; Carr, D.B.; Boyko, E.J.; Leonetti, D.L.; McNeely, M.J.; Fujimoto, W.Y.; Kahn, S.E. Oral disposition index predicts the development of future diabetes above and beyond fasting and 2-h glucose levels. Diabetes Care 2009, 32, 335–341. [Google Scholar] [CrossRef] [PubMed]
  13. Sookoian, S.; Pirola, C.J. Epigenetics of Insulin Resistance: An Emerging Field in Translational Medicine. Curr. Diabetes Rep. 2013, 13, 229–237. [Google Scholar] [CrossRef] [PubMed]
  14. Hidalgo, B.; Irvin, M.R.; Sha, J.; Zhi, D.; Aslibekyan, S.; Absher, D.; Tiwari, H.K.; Kabagambe, E.K.; Ordovas, J.M.; Arnett, D.K. Epigenome-Wide Association Study of Fasting Measures of Glucose, Insulin, and HOMA-IR in the Genetics of Lipid Lowering Drugs and Diet Network Study. Diabetes 2014, 63, 801–807. [Google Scholar] [CrossRef] [PubMed] [Green Version]
  15. Kriebel, J.; Herder, C.; Rathmann, W.; Wahl, S.; Kunze, S.; Molnos, S.; Volkova, N.; Schramm, K.; Carstensen-Kirberg, M.; Waldenberger, M.; et al. Association between DNA Methylation in Whole Blood and Measures of Glucose Metabolism: KORA F4 Study. PLoS ONE 2016, 11, e0152314. [Google Scholar] [CrossRef] [PubMed]
  16. Chambers, J.C.; Loh, M.; Lehne, B.; Drong, A.; Kriebel, J.; Motta, V.; Wahl, S.; Elliott, H.R.; Rota, F.; Scott, W.R.; et al. Epigenome-wide association of DNA methylation markers in peripheral blood from Indian Asians and Europeans with incident type 2 diabetes: A nested case-control study. Lancet Diabetes Endocrinol. 2015, 3, 526–534. [Google Scholar] [CrossRef]
  17. Kulkarni, H.; Kos, M.Z.; Neary, J.; Dyer, T.D.; Kent, J.W.J.; Goring, H.H.; Cole, S.A.; Comuzzie, A.G.; Almasy, L.; Mahaney, M.C.; et al. Novel epigenetic determinants of type 2 diabetes in Mexican-American families. Hum. Mol. Genet. 2015, 24, 5330–5344. [Google Scholar] [CrossRef] [PubMed]
  18. Al Muftah, W.A.; Al-Shafai, M.; Zaghlool, S.B.; Visconti, A.; Tsai, P.C.; Kumar, P.; Spector, T.; Bell, J.; Falchi, M.; Suhre, K. Epigenetic associations of type 2 diabetes and BMI in an Arab population. Clin. Epigenetics 2016, 8. [Google Scholar] [CrossRef] [PubMed]
  19. Dayeh, T.; Tuomi, T.; Almgren, P.; Perfilyev, A.; Jansson, P.A.; De Mello, V.D.; Pihlajamaki, J.; Vaag, A.; Groop, L.; Nilsson, E.; et al. DNA methylation of loci withinABCG1andPHOSPHO1in blood DNA is associated with future type 2 diabetes risk. Epigenetics 2016, 11, 482–488. [Google Scholar] [CrossRef] [PubMed]
  20. Wahl, S.; Drong, A.; Lehne, B.; Loh, M.; Scott, W.R.; Kunze, S.; Tsai, P.C.; Ried, J.S.; Zhang, W.; Yang, Y.; et al. Epigenome-wide association study of body mass index, and the adverse outcomes of adiposity. Nature 2017, 541, 81–86. [Google Scholar] [CrossRef] [PubMed]
  21. Muka, T.; Nano, J.; Voortman, T.; Braun, K.V.E.; Ligthart, S.; Stranges, S.; Bramer, W.M.; Troup, J.; Chowdhury, R.; Dehghan, A.; et al. The role of global and regional DNA methylation and histone modifications in glycemic traits and type 2 diabetes: A systematic review. Nutr. Metab. Cardiovasc. Dis. 2016, 26, 553–566. [Google Scholar] [CrossRef] [PubMed]
  22. Zhou, Z.; Sun, B.; Li, X.; Zhu, C. DNA methylation landscapes in the pathogenesis of type 2 diabetes mellitus. Nutr. Metab. 2018, 14, 12–25. [Google Scholar] [CrossRef] [PubMed]
  23. Sagesaka, H.; Sato, Y.; Someya, Y.; Tamura, Y.; Shimodaira, M.; Miyakoshi, T.; Hirabayashi, K.; Koike, H.; Yamashita, K.; Watada, H.; et al. Type 2 Diabetes: When Does It Start? J. Endocr. Soc. 2018, 2, 476–484. [Google Scholar] [CrossRef] [PubMed]
  24. Szabo, M.; Mate, B.; Csep, K.; Benedek, T. Epigenetic Modifications Linked to T2D, the Heritability Gap, and Potential Therapeutic Targets. Biochem. Genet. 2018, 56, 553–574. [Google Scholar] [CrossRef] [PubMed]
  25. Davegardh, C.; Garcia-Calzon, S.; Bacos, K.; Ling, C. DNA methylation in the pathogenesis of type 2 diabetes in humans. Mol. Metab. 2018, 14, 12–25. [Google Scholar] [CrossRef] [PubMed]
  26. Su, C.F.; Chang, Y.Y.; Pai, H.H.; Liu, I.M.; Lo, C.Y.; Cheng, J.T. Infusion of beta-Endorphin Improves Insulin Resistance in Fructose-fed Rats. Horm. Metab. Res. 2004, 36, 571–577. [Google Scholar] [CrossRef]
  27. Li, Y.; Eitan, S.; Wu, J.; Evans, C.J.; Kieffer, B.; Sun, X.; Polakiewicz, R.D. Morphine induces desensitization of insulin receptor signaling. Mol. Cell Biol. 2003, 23, 6255–6266. [Google Scholar] [CrossRef]
  28. Layden, B.T.; Durai, V.; Lowe, J.W.L. G-Protein-Coupled Receptors, Pancreatic Islets, and Diabetes. Nat. Educ. 2010, 3, 13. [Google Scholar]
  29. Walford, G.A.; Ma, Y.; Clish, C.; Florez, J.C.; Wang, T.J.; Gerszten, R.E. Diabetes Prevention Program Research G Metabolite Profiles of Diabetes Incidence and Intervention Response in the Diabetes Prevention Program. Diabetes 2016, 65, 1424–1433. [Google Scholar] [CrossRef] [PubMed]
  30. Sansbury, B.E.; Hill, B.G. Regulation of obesity and insulin resistance by nitric oxide. Free Radic. Boil. Med. 2014, 73, 383–399. [Google Scholar] [CrossRef] [PubMed] [Green Version]
  31. Botker, H.E.; Moller, N. ON NO-the continuing story of nitric oxide, diabetes, and cardiovascular disease. Diabetes 2013, 62, 2645–2647. [Google Scholar] [CrossRef] [PubMed]
  32. Karimian Azari, E.; Smith, K.R.; Yi, F.; Osborne, T.F.; Bizzotto, R.; Mari, A.; Pratley, R.E.; Kyriazis, G.A. Inhibition of sweet chemosensory receptors alters insulin responses during glucose ingestion in healthy adults: A randomized crossover interventional study. Am. J. Clin. Nutr. 2017, 105, 1001–1009. [Google Scholar] [CrossRef] [PubMed]
  33. Goodarzi, M.O.; Taylor, K.D.; Guo, X.; Hokanson, J.E.; Haffner, S.M.; Cui, J.; Chen, Y.D.; Wagenknecht, L.E.; Bergman, R.N.; Rotter, J.I. Haplotypes in the lipoprotein lipase gene influence fasting insulin and discovery of a new risk haplotype. J. Clin. Endocrinol. Metab. 2007, 92, 293–296. [Google Scholar] [CrossRef] [PubMed]
  34. Ramos, F.J.; Langlais, P.R.; Hu, D.; Dong, L.Q.; Liu, F. Grb10 mediates insulin-stimulated degradation of the insulin receptor: A mechanism of negative regulation. Am. J. Physiol. Endocrinol. Metab. 2006, 290, E1262–E1266. [Google Scholar] [CrossRef] [PubMed]
  35. Horbelt, T.; Tacke, C.; Markova, M.; Herzfeld de Wiza, D.; Van de Velde, F.; Bekaert, M.; Van Nieuwenhove, Y.; Hornemann, S.; Rodiger, M.; Seebeck, N.; et al. The novel adipokine WISP1 associates with insulin resistance and impairs insulin action in human myotubes and mouse hepatocytes. Diabetologia 2018, 61, 2054–2065. [Google Scholar] [CrossRef] [Green Version]
  36. Moreno-Navarrete, J.M.; Ortega, F.; Moreno, M.; Xifra, G.; Ricart, W.; Fernandez-Real, J.M. PRDM16 sustains white fat gene expression profile in human adipocytes in direct relation with insulin action. Mol. Cell Endocrinol. 2015, 405, 84–93. [Google Scholar] [CrossRef] [PubMed]
  37. Ottosson Laakso, E.; Krus, U.; Storm, P.; Prasad, R.B.; Oskolkov, N.; Ahlqvist, E.; Fadista, J.; Hansson, O.; Groop, L.; Vikman, P. Glucose-Induced Changes in Gene Expression in Human Pancreatic Islets: Causes or Consequences of Chronic Hyperglycemia. Diabetes 2017, 66, 3013–3028. [Google Scholar] [CrossRef] [Green Version]
  38. Graae, A.S.; Grarup, N.; Ribel Madsen, R.; Lystbaek, S.H.; Boesgaard, T.; Staiger, H.; Fritsche, A.; Wellner, N.; Sulek, K.; Kjolby, M.; et al. ADAMTS9 Regulates Skeletal Muscle Insulin Sensitivity Through Extracellular Matrix Alterations. Diabetes 2019, 68, 502–514. [Google Scholar] [CrossRef] [Green Version]
  39. Wu, X.; Williams, K.J. NOX4 pathway as a source of selective insulin resistance and responsiveness. Arterioscler. Thromb. Vasc. Biol. 2012, 32, 1236–1245. [Google Scholar] [CrossRef]
  40. Lu, Q.; Aguilar, B.J.; Li, M.; Jiang, Y.; Chen, Y.H. Genetic alterations of delta-catenin/NPRAP/Neurojungin (CTNND2): Functional implications in complex human diseases. Hum. Genet. 2016, 135, 1107–1116. [Google Scholar] [CrossRef]
  41. Turner, T.N.; Sharma, K.; Oh, E.C.; Liu, Y.P.; Collins, R.L.; Sosa, M.X.; Auer, D.R.; Brand, H.; Sanders, S.J.; Moreno De Luca, D.; et al. Loss of delta-catenin function in severe autism. Nature 2015, 520, 51–56. [Google Scholar] [CrossRef] [PubMed]
  42. Diabetes Genetics Initiative of Broad Institute of Harvard and MIT, Lund University, and Novartis Institutes of BioMedical Research; Saxena, R.; Voight, B.F.; Lyssenko, V.; Burtt, N.P.; de Bakker, P.I.; Chen, H.; Roix, J.J.; Kathiresan, S.; Hirschhorn, J.N.; et al. Genome-wide association analysis identifies loci for type 2 diabetes and triglyceride levels. Science 2007, 316, 1331–1336. [Google Scholar] [CrossRef] [PubMed]
  43. Zeggini, E.; Weedon, M.N.; Lindgren, C.M.; Frayling, T.M.; Elliott, K.S.; Lango, H.; Timpson, N.J.; Perry, J.R.; Rayner, N.W.; Freathy, R.M.; et al. Replication of genome-wide association signals in UK samples reveals risk loci for type 2 diabetes. Science 2007, 316, 1336–1341. [Google Scholar] [CrossRef] [PubMed]
  44. Fox, C.S.; Heard Costa, N.; Cupples, L.A.; Dupuis, J.; Vasan, R.S.; Atwood, L.D. Genome-wide association to body mass index and waist circumference: The Framingham Heart Study 100K project. BMC Med. Genet. 2007, 8, S18. [Google Scholar] [CrossRef] [PubMed]
  45. Pingitore, P.; Lepore, S.M.; Pirazzi, C.; Mancina, R.M.; Motta, B.M.; Valenti, L.; Berge, K.E.; Retterstol, K.; Leren, T.P.; Wiklund, O.; et al. Identification and characterization of two novel mutations in the LPL gene causing type I hyperlipoproteinemia. J. Clin. Lipidol. 2016, 10, 816–823. [Google Scholar] [CrossRef] [PubMed] [Green Version]
  46. Kersten, S. Physiological regulation of lipoprotein lipase. Biochim. Biophys. Acta 2014, 1841, 919–933. [Google Scholar] [CrossRef] [PubMed]
  47. He, P.P.; Jiang, T.; Ouyang, X.P.; Liang, Y.Q.; Zou, J.Q.; Wang, Y.; Shen, Q.Q.; Liao, L.; Zheng, X.L. Lipoprotein lipase: Biosynthesis, regulatory factors, and its role in atherosclerosis and other diseases. Clin. Chim. Acta 2018, 480, 126–137. [Google Scholar] [CrossRef] [PubMed]
  48. Goldberg, I.J.; Eckel, R.H.; Abumrad, N.A. Regulation of fatty acid uptake into tissues: Lipoprotein lipase- and CD36-mediated pathways. J. Lipid Res. 2009, 50, S86–S90. [Google Scholar] [CrossRef]
  49. Farese, R.V., Jr.; Yost, T.J.; Eckel, R.H. Tissue-specific regulation of lipoprotein lipase activity by insulin/glucose in normal-weight humans. Metabolism 1991, 40, 214–216. [Google Scholar] [CrossRef]
  50. Yost, T.J.; Jensen, D.R.; Haugen, B.R.; Eckel, R.H. Effect of dietary macronutrient composition on tissue-specific lipoprotein lipase activity and insulin action in normal-weight subjects. Am. J. Clin. Nutr. 1998, 68, 296–302. [Google Scholar] [CrossRef]
  51. Kim, J.K.; Fillmore, J.J.; Chen, Y.; Yu, C.; Moore, I.K.; Pypaert, M.; Lutz, E.P.; Kako, Y.; Velez-Carrasco, W.; Goldberg, I.J.; et al. Tissue-specific overexpression of lipoprotein lipase causes tissue-specific insulin resistance. Proc. Natl. Acad. Sci. USA 2001, 98, 7522–7527. [Google Scholar] [CrossRef] [PubMed] [Green Version]
  52. Goodarzi, M.O.; Guo, X.; Taylor, K.D.; Quinones, M.J.; Saad, M.F.; Yang, H.; Hsueh, W.A.; Rotter, J.I. Lipoprotein lipase is a gene for insulin resistance in Mexican Americans. Diabetes 2004, 53, 214–220. [Google Scholar] [CrossRef] [PubMed]
  53. Houde, A.A.; St Pierre, J.; Hivert, M.F.; Baillargeon, J.P.; Perron, P.; Gaudet, D.; Brisson, D.; Bouchard, L. Placental lipoprotein lipase DNA methylation levels are associated with gestational diabetes mellitus and maternal and cord blood lipid profiles. J. Dev. Orig. Health Dis. 2014, 5, 132–141. [Google Scholar] [CrossRef] [PubMed]
  54. Castellano Castillo, D.; Moreno Indias, I.; Fernandez Garcia, J.C.; Alcaide Torres, J.; Moreno Santos, I.; Ocana, L.; Gluckman, E.; Tinahones, F.; Queipo Ortuno, M.I.; Cardona, F. Adipose Tissue LPL Methylation is Associated with Triglyceride Concentrations in the Metabolic Syndrome. Clin. Chem. 2018, 64, 210–218. [Google Scholar] [CrossRef] [PubMed] [Green Version]
  55. Drogan, D.; Boeing, H.; Janke, J.; Schmitt, B.; Zhou, Y.; Walter, J.; Pischon, T.; Tierling, S. Regional distribution of body fat in relation to DNA methylation within the LPL, ADIPOQ and PPARgamma promoters in subcutaneous adipose tissue. Nutr. Diabetes 2015, 5, e168. [Google Scholar] [CrossRef] [PubMed]
  56. Kim, S.J.; Nian, C.; McIntosh, C.H. GIP increases human adipocyte LPL expression through CREB and TORC2-mediated trans-activation of the LPL gene. J. Lipid Res. 2010, 51, 3145–3157. [Google Scholar] [CrossRef] [Green Version]
  57. Sinkeler, S.J.; Kwakernaak, A.J.; Bakker, S.J.; Shahinfar, S.; Esmatjes, E.; de Zeeuw, D.; Navis, G.; Lambers Heerspink, H.J. Creatinine excretion rate and mortality in type 2 diabetes and nephropathy. Diabetes Care 2013, 36, 1489–1494. [Google Scholar] [CrossRef]
  58. Bao, X.; Gu, Y.; Zhang, Q.; Liu, L.; Meng, G.; Wu, H.; Xia, Y.; Shi, H.; Wang, H.; Sun, S.; et al. Low serum creatinine predicts risk for type 2 diabetes. Diabetes Metab. Res. Rev. 2018, 34, e3011. [Google Scholar] [CrossRef]
  59. Takeuchi, M.; Imano, H.; Muraki, I.; Shimizu, Y.; Hayama Terada, M.; Kitamura, A.; Okada, T.; Kiyama, M.; Iso, H. Serum creatinine levels and risk of incident type 2 diabetes mellitus or dysglycemia in middle-aged Japanese men: A retrospective cohort study. Vet. Rec. 2018, 6, e000492. [Google Scholar] [CrossRef]
  60. Bacos, K.; Gillberg, L.; Volkov, P.; Olsson, A.H.; Hansen, T.; Pedersen, O.; Gjesing, A.P.; Eiberg, H.; Tuomi, T.; Almgren, P.; et al. Blood-based biomarkers of age-associated epigenetic changes in human islets associate with insulin secretion and diabetes. Nat. Commun. 2016, 7, 11089. [Google Scholar] [CrossRef] [Green Version]
  61. Crujeiras, A.B.; Diaz Lagares, A.; Sandoval, J.; Milagro, F.I.; Navas Carretero, S.; Carreira, M.C.; Gomez, A.; Hervas, D.; Monteiro, M.P.; Casanueva, F.F.; et al. DNA methylation map in circulating leukocytes mirrors subcutaneous adipose tissue methylation pattern: A genome-wide analysis from non-obese and obese patients. Sci. Rep. 2017, 7, 41903. [Google Scholar] [CrossRef] [PubMed]
  62. Marcelli Tourvieille, S.; Hubert, T.; Pattou, F.; Vantyghem, M.C. Acute insulin response (AIR): Review of protocols and clinical interest in islet transplantation. Diabetes Metab. 2006, 32, 295–303. [Google Scholar] [CrossRef]
  63. Kahn, S.E. The relative contributions of insulin resistance and beta-cell dysfunction to the pathophysiology of Type 2 diabetes. Diabetologia 2003, 46, 3–19. [Google Scholar] [CrossRef] [PubMed] [Green Version]
  64. Arpón, A.; Riezu Boj, J.I.; Milagro, F.I.; Razquin, C.; Martinez Gonzalez, M.A.; Corella, D.; Estruch, R.; Casas, R.; Fito, M.; Ros, E.; et al. Adherence to Mediterranean diet is associated with methylation changes in inflammation-related genes in peripheral blood cells. J. Physiol. Biochem. 2017, 73, 445–455. [Google Scholar] [CrossRef] [PubMed]
  65. Edgar, R.; Domrachev, M.; Lash, A.E. Gene Expression Omnibus: NCBI gene expression and hybridization array data repository. Nucleic Acids Res. 2002, 30, 207–210. [Google Scholar] [CrossRef] [PubMed] [Green Version]
  66. Touleimat, N.; Tost, J. Complete pipeline for Infinium® Human Methylation 450K BeadChip data processing using subset quantile normalization for accurate DNA methylation estimation. Epigenomics 2012, 4, 325–341. [Google Scholar] [CrossRef]
  67. Team, R. RStudio: Integrated Development for R. Available online: http://www.rstudio.com/ (accessed on 5 June 2018).
  68. Houseman, E.A.; Accomando, W.P.; Koestler, D.C.; Christensen, B.C.; Marsit, C.J.; Nelson, H.H.; Wiencke, J.K.; Kelsey, K.T. DNA methylation arrays as surrogate measures of cell mixture distribution. BMC Bioinform. 2012, 13, 86. [Google Scholar] [CrossRef]
  69. Volkmar, M.; Dedeurwaerder, S.; Cunha, D.A.; Ndlovu, M.N.; Defrance, M.; Deplus, R.; Calonne, E.; Volkmar, U.; Igoillo Esteve, M.; Naamane, N.; et al. DNA methylation profiling identifies epigenetic dysregulation in pancreatic islets from type 2 diabetic patients. EMBO J. 2012, 31, 1405–1426. [Google Scholar] [CrossRef] [Green Version]
Figure 1. Volcano plot representing 1416 CpGs selected by slope >|0.005| according to the logarithm of the p-value obtained from Spearman correlation with calculated insulin sensitivity index (CSi).
Ijms 20 02928 g001
Figure 2. Top 10 canonical pathways from ingenuity pathway analysis of 253 CpGs selected by Spearman false discovery rate (FDR) < 0.05. The graph presents the canonical pathways ordered by −log(p-value) and the percentage of genes from our list that are in one specific pathway (total number of genes in the pathway at the right part of the graph). The p-value adjusted by Fisher’s test is also indicated at the right side.
Ijms 20 02928 g002
Figure 3. Manhattan plot of 1416 CpGs selected by slope >|0.005| in each chromosome. Points above the horizontal line are false discovery rate (FDR) < 0.05. The top 10 CpGs are indicated.
Ijms 20 02928 g003
Figure 4. Associations between the calculated insulin sensitivity index (CSi) and DNA methylation in peripheral white blood cells. (a) Spearman correlation between CSi and cg04615668-CTNND2 or cg07263235-LPL methylation; (b) Differential methylation of cg04615668-CTNND2 or cg07263235-LPL between individuals separated by the median of CSi.
Ijms 20 02928 g004
Figure 5. Receiver operating characteristic (ROC) curve of the logistic regression of cg04615668-CTNND2 and cg07263235-LPL adjusted by sex allows the discrimination of subjects with the calculated insulin sensitivity index (CSi) ≤5.7 (insulin-resistant) versus >5.7 (insulin-sensitive).
Ijms 20 02928 g005
Figure 6. Spearman correlations of cg04615668 and cg07263235 methylation. (a) Correlation between cg04615668-CTNND2 methylation and acute insulin response (AIR) index or homeostasis model assessment insulin-sensitivity (HOMA-S) index; (b) Correlation between cg07263235-LPL methylation and disposition index (DI) or plasma creatinine.
Ijms 20 02928 g006
Table 1. Anthropometric and biochemical measurements, and insulin sensitivity indexes of n = 57 participants of this study.
VariableNMedian (IQR)
Age (y)5725 (22–30)
Weight (kg)5759.5 (56.0–64.2)
Height (m)571.59 (1.56–1.63)
Body mass index (kg/m2)5723.4 (21.8–25.4)
Plasma total cholesterol (mg/dL)56167.5 (148.0–196.5)
Plasma HDL cholesterol (mg/dL)5663.0 (51.5–71.5)
Plasma LDL cholesterol (mg/dL)5684.0 (67.5–103.5)
Plasma triglycerides (mg/dL)5692.5 (68.0–131.0)
Systolic blood pressure (mmHg)57113 (104–119)
Diastolic blood pressure (mmHg)5770 (65–75)
Fasting glucose (mg/dL)4978 (74–82)
Fasting insulin (IU/µmL)497.0 (5.8–9.1)
HOMA-S4871.5 (55.5–88.5)
Calculated insulin sensitivity (CSi)495.7 (4.0–8.2)
Acute insulin release (AIR)49538.7 (398.5–718.6)
IVGTT-based disposition index (DI)492792.6 (2023.4–4136.4)
HDL: High density lipoprotein; HOMA-S: Homeostasis model assessment-insulin sensitivity; IQR: Interquartile range; IVGTT: Intravenous glucose tolerance test; LDL: Low density lipoprotein.

