High-Fat Feeding in Time-Dependent Manner Affects Metabolic Routes Leading to Nervonic Acid Synthesis in NAFLD

 , , and
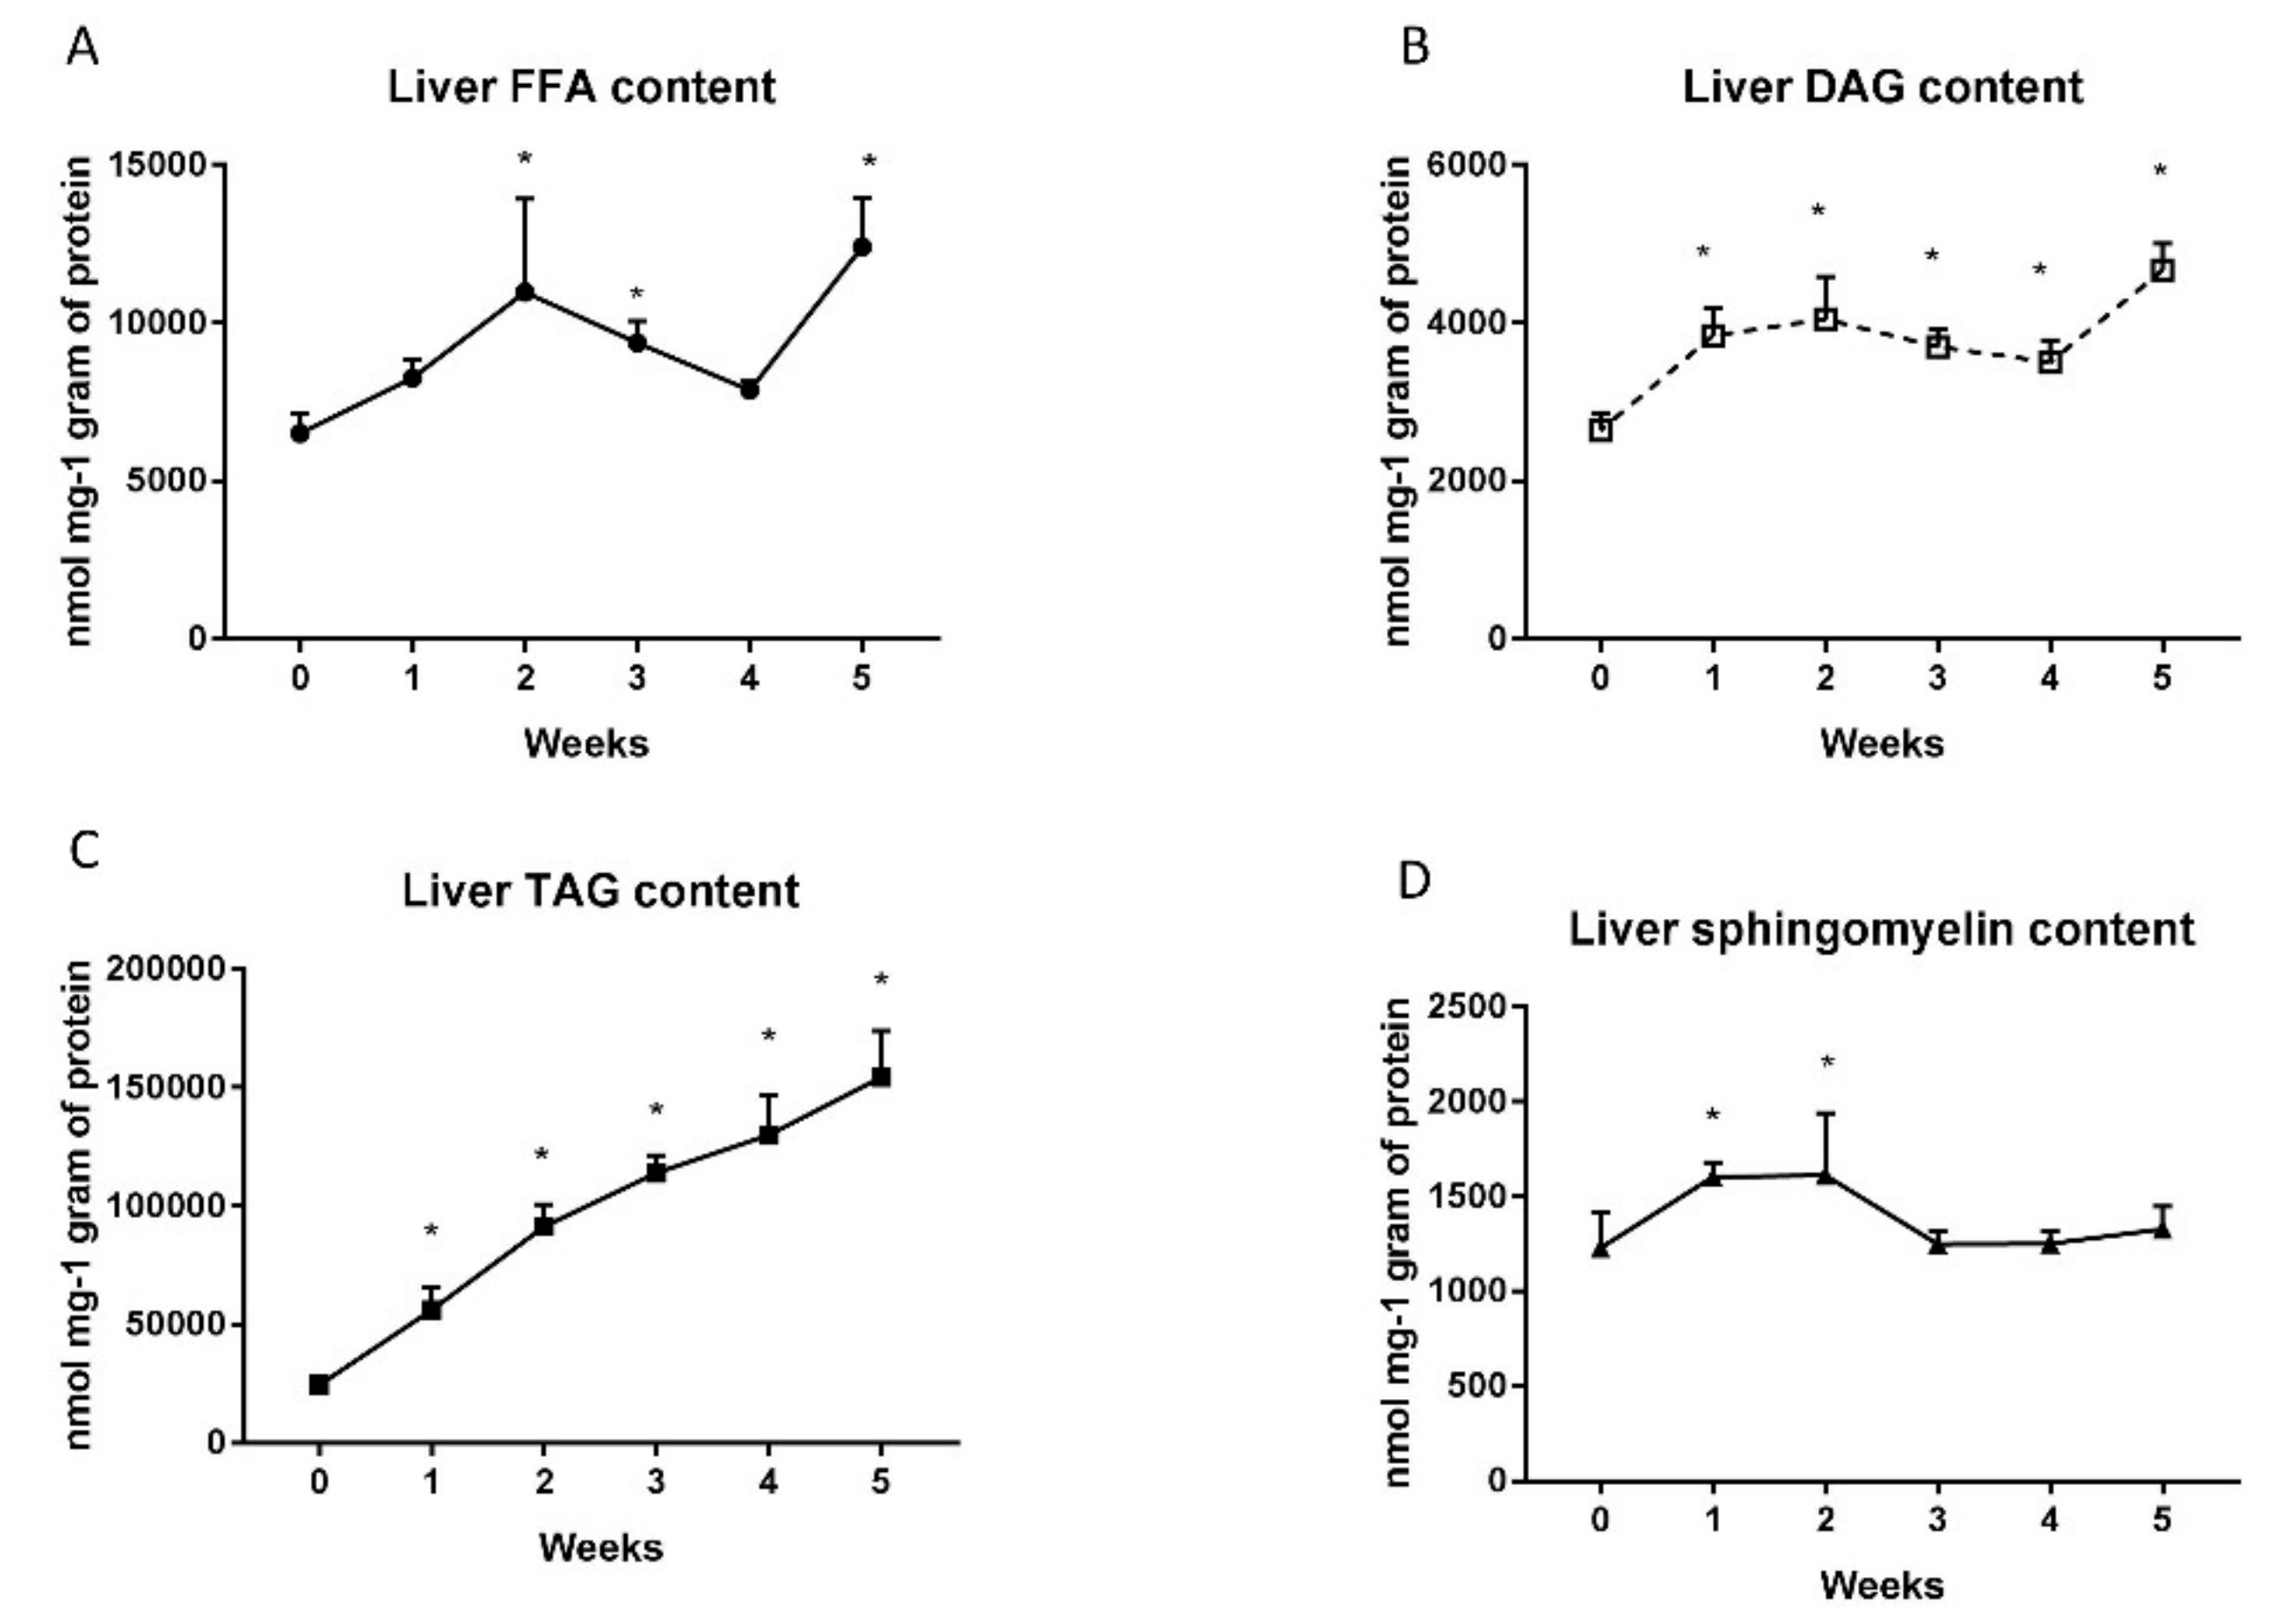
Abstract
:1. Introduction
2. Results
2.1. Changes in Liver Lipid Concentration
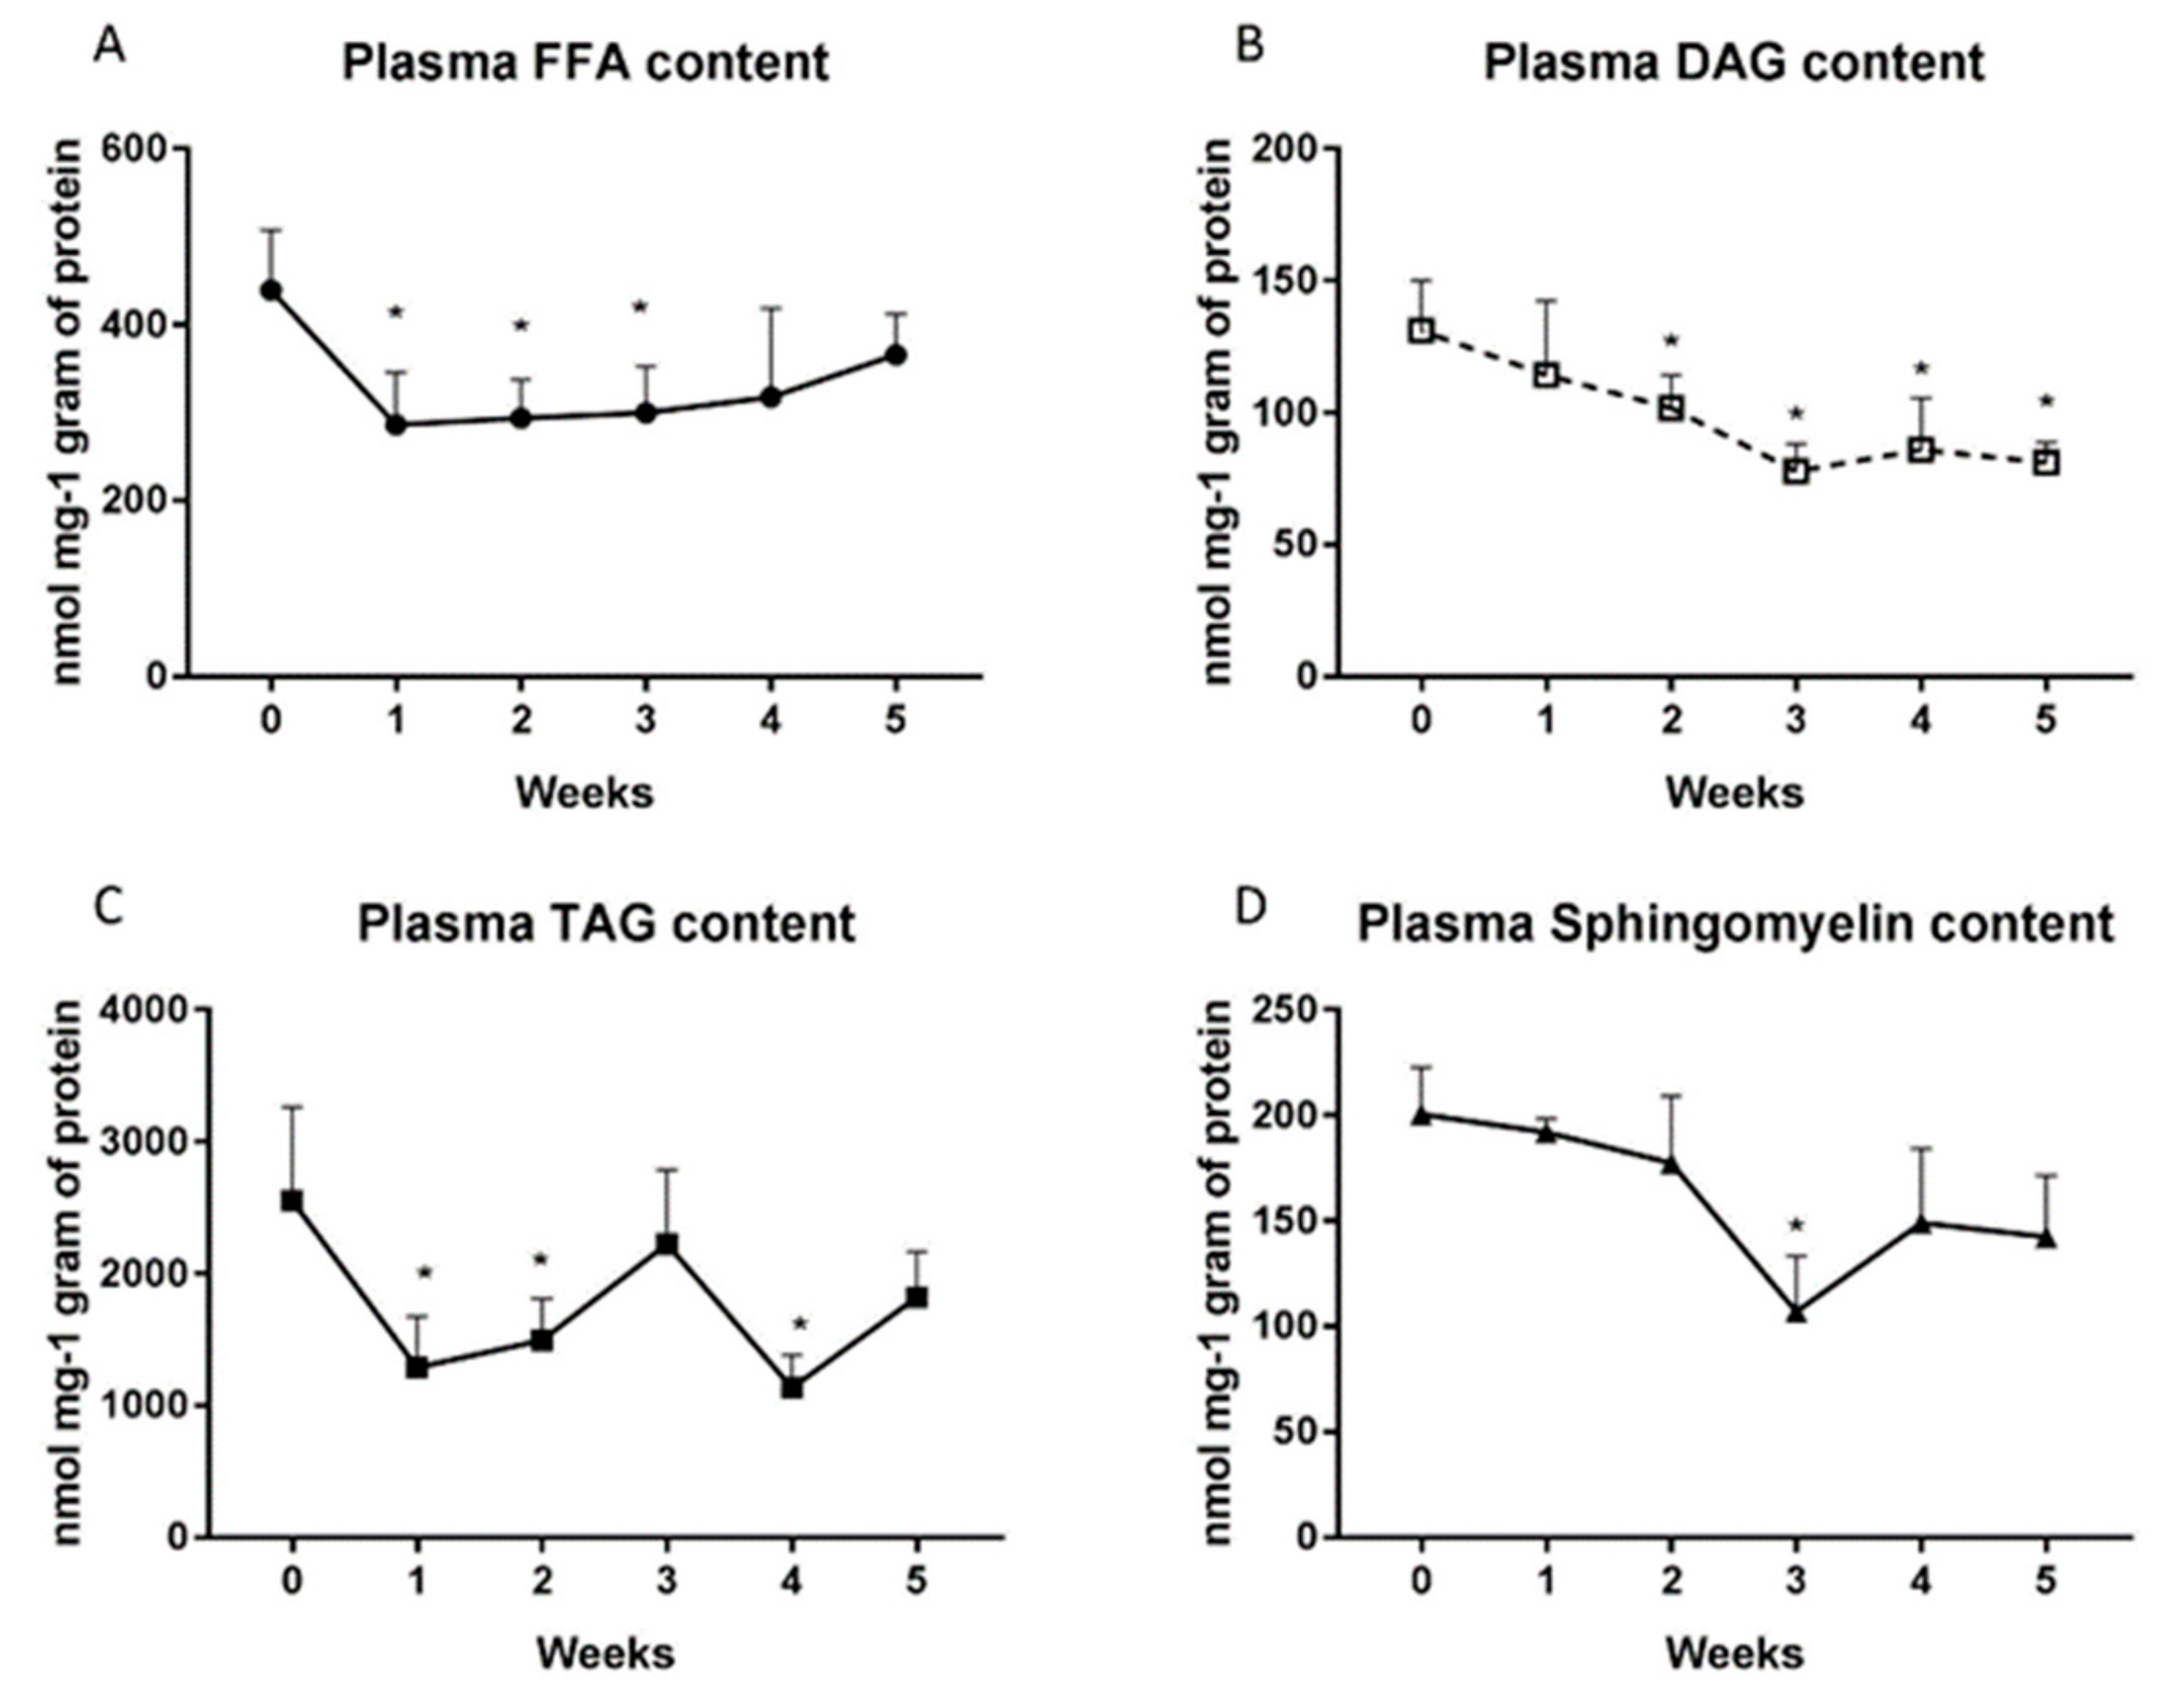
2.2. Changes in the Plasma Lipid Concentrations
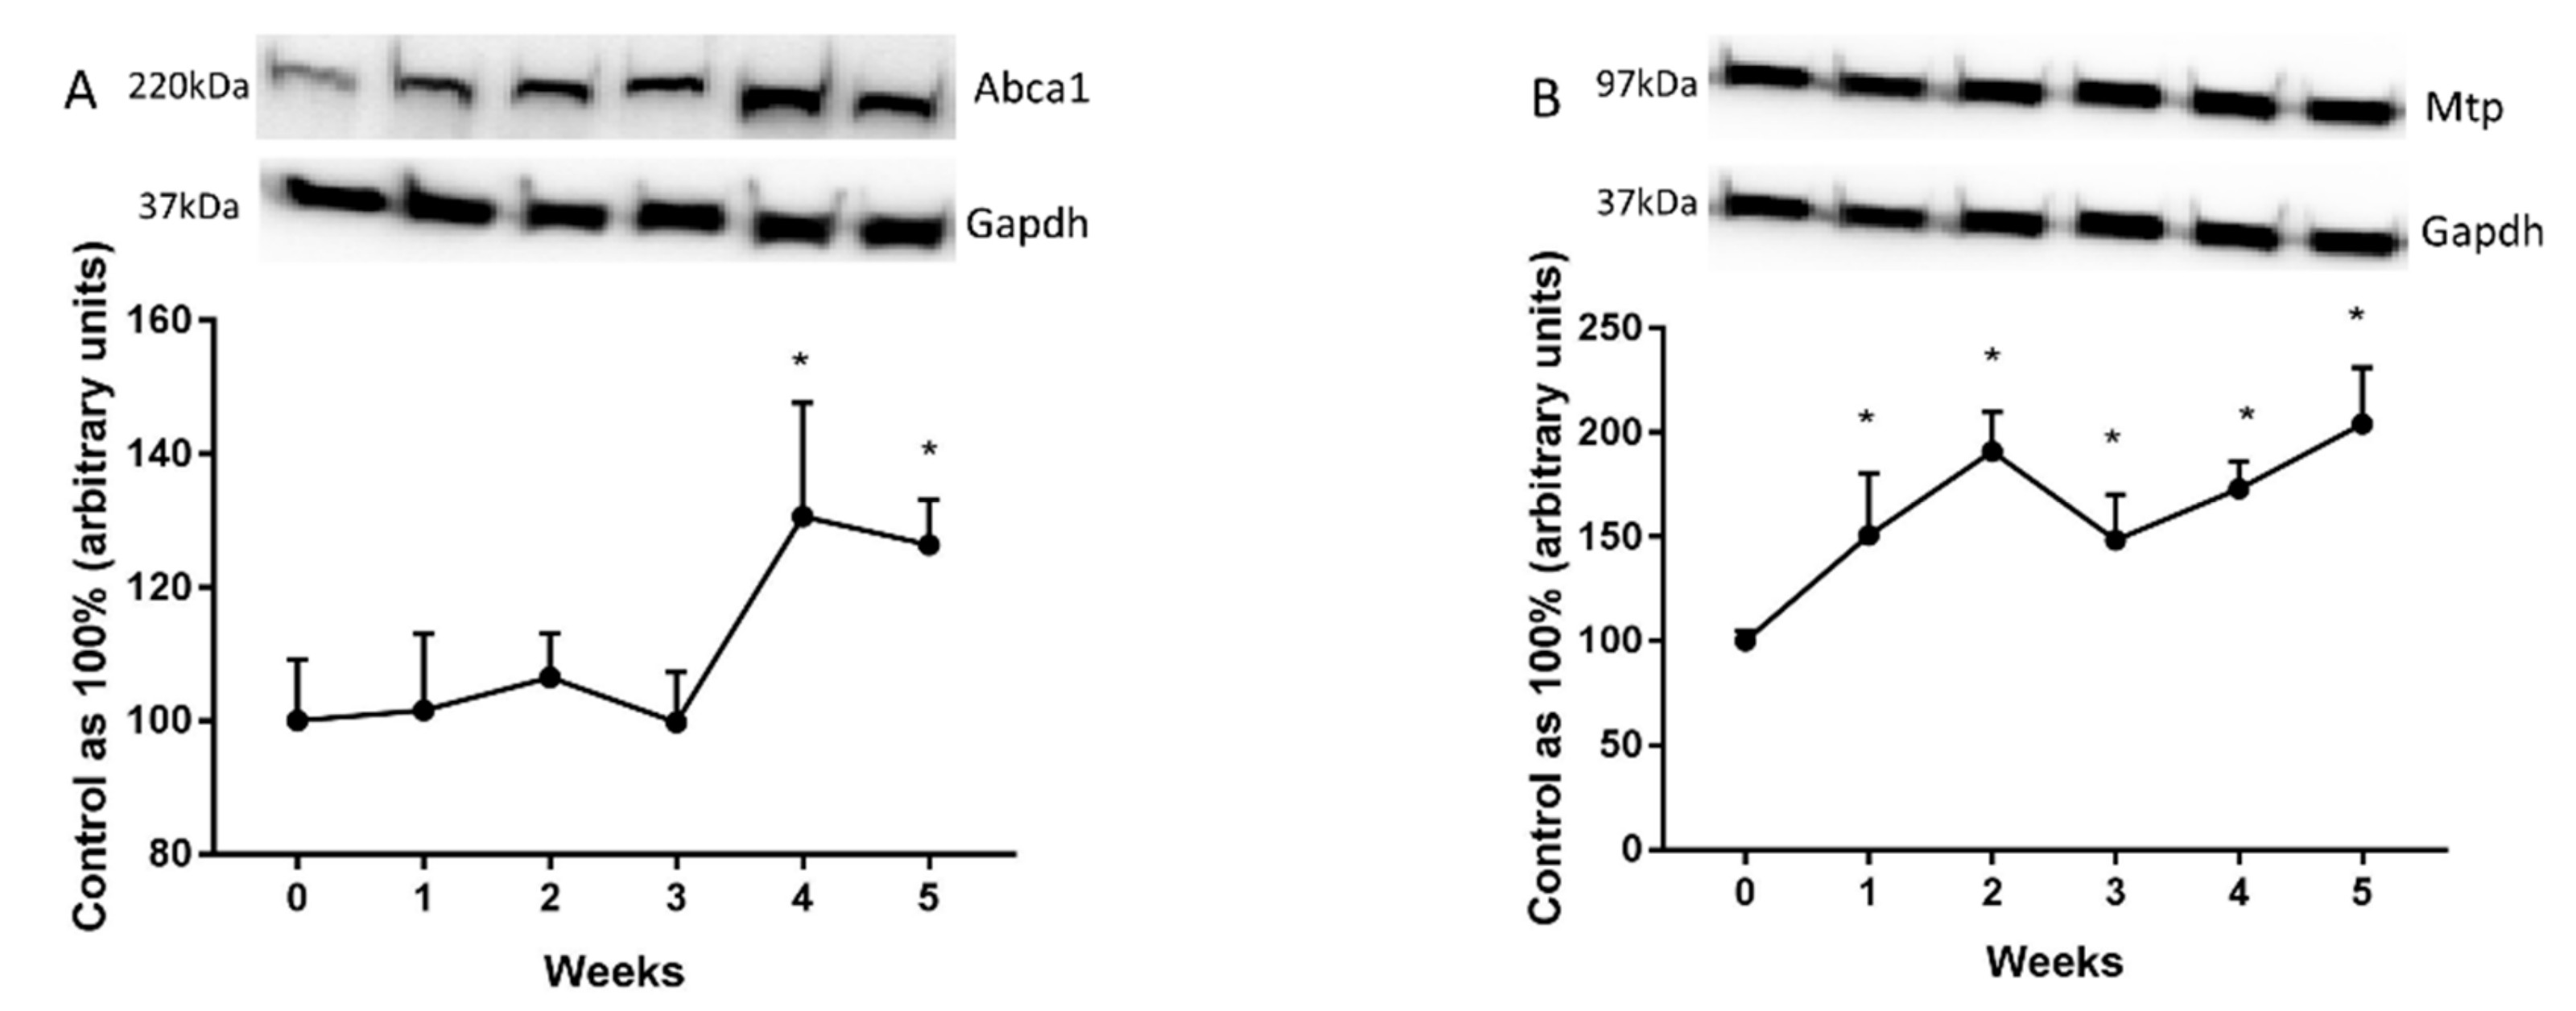
2.3. Changes in the Expression of Fatty Acid Transporters
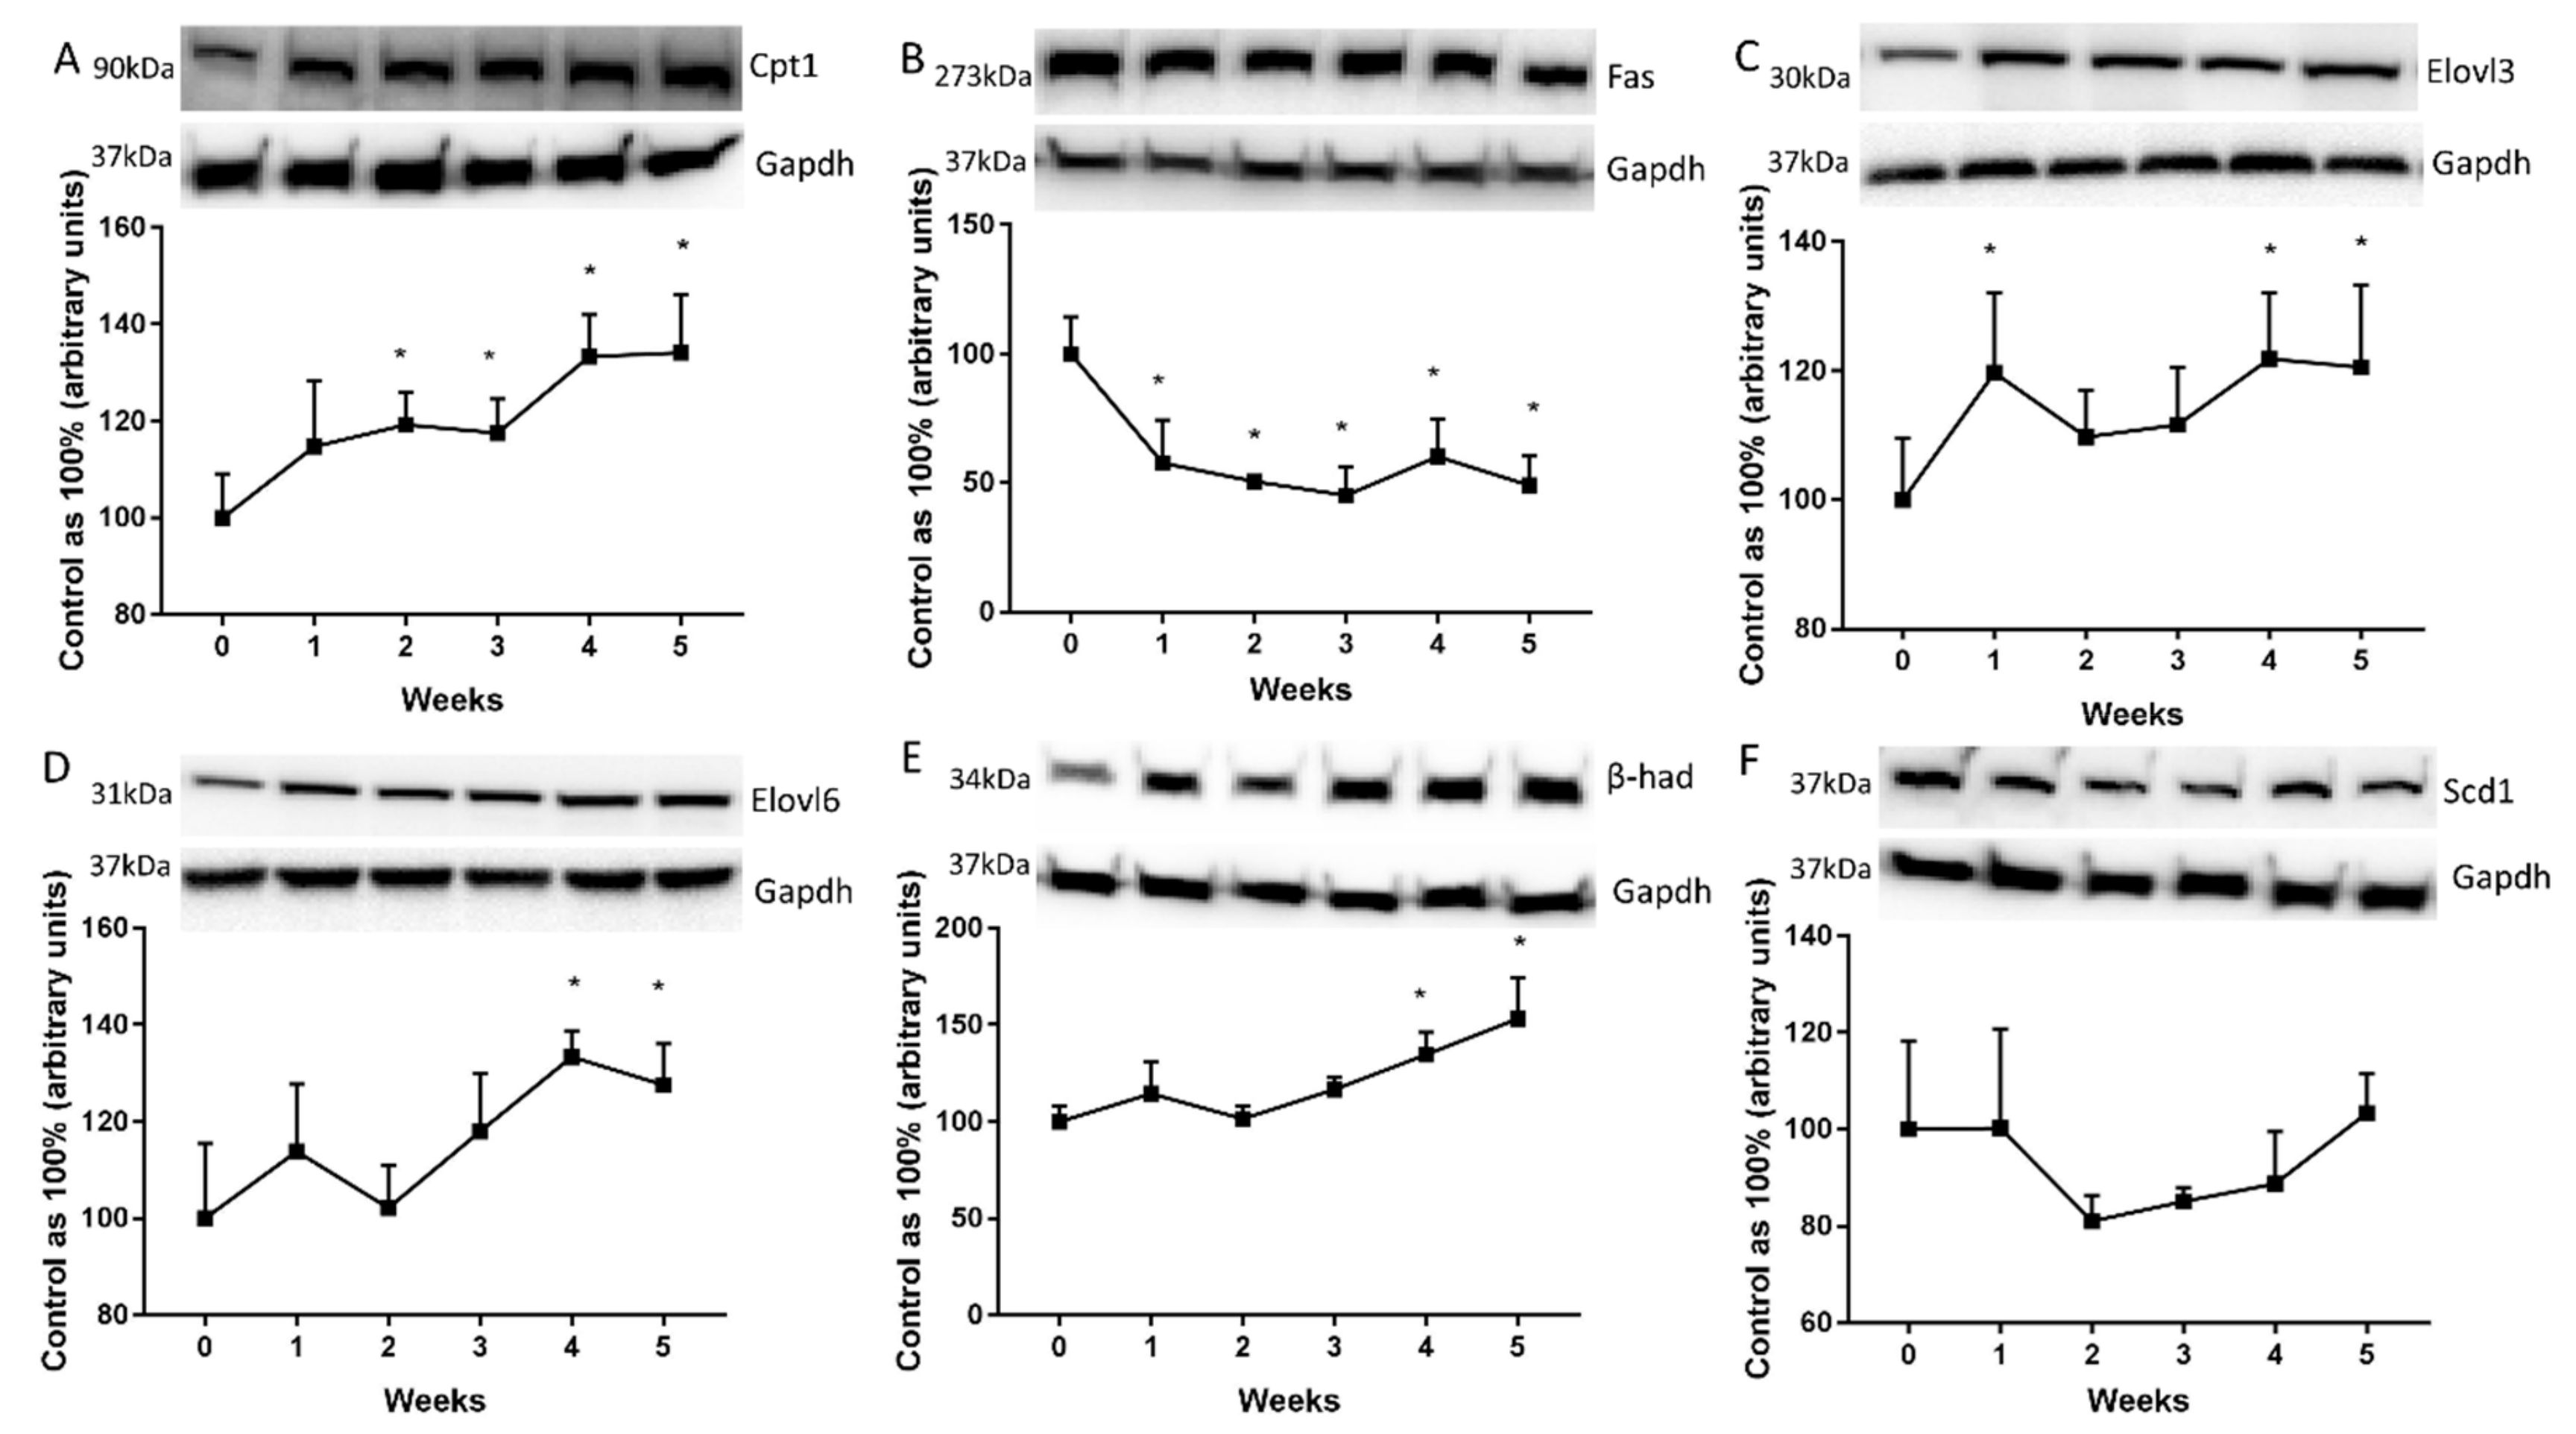
2.4. Changes in the Expression of Proteins Directly Involved in Lipid Metabolism
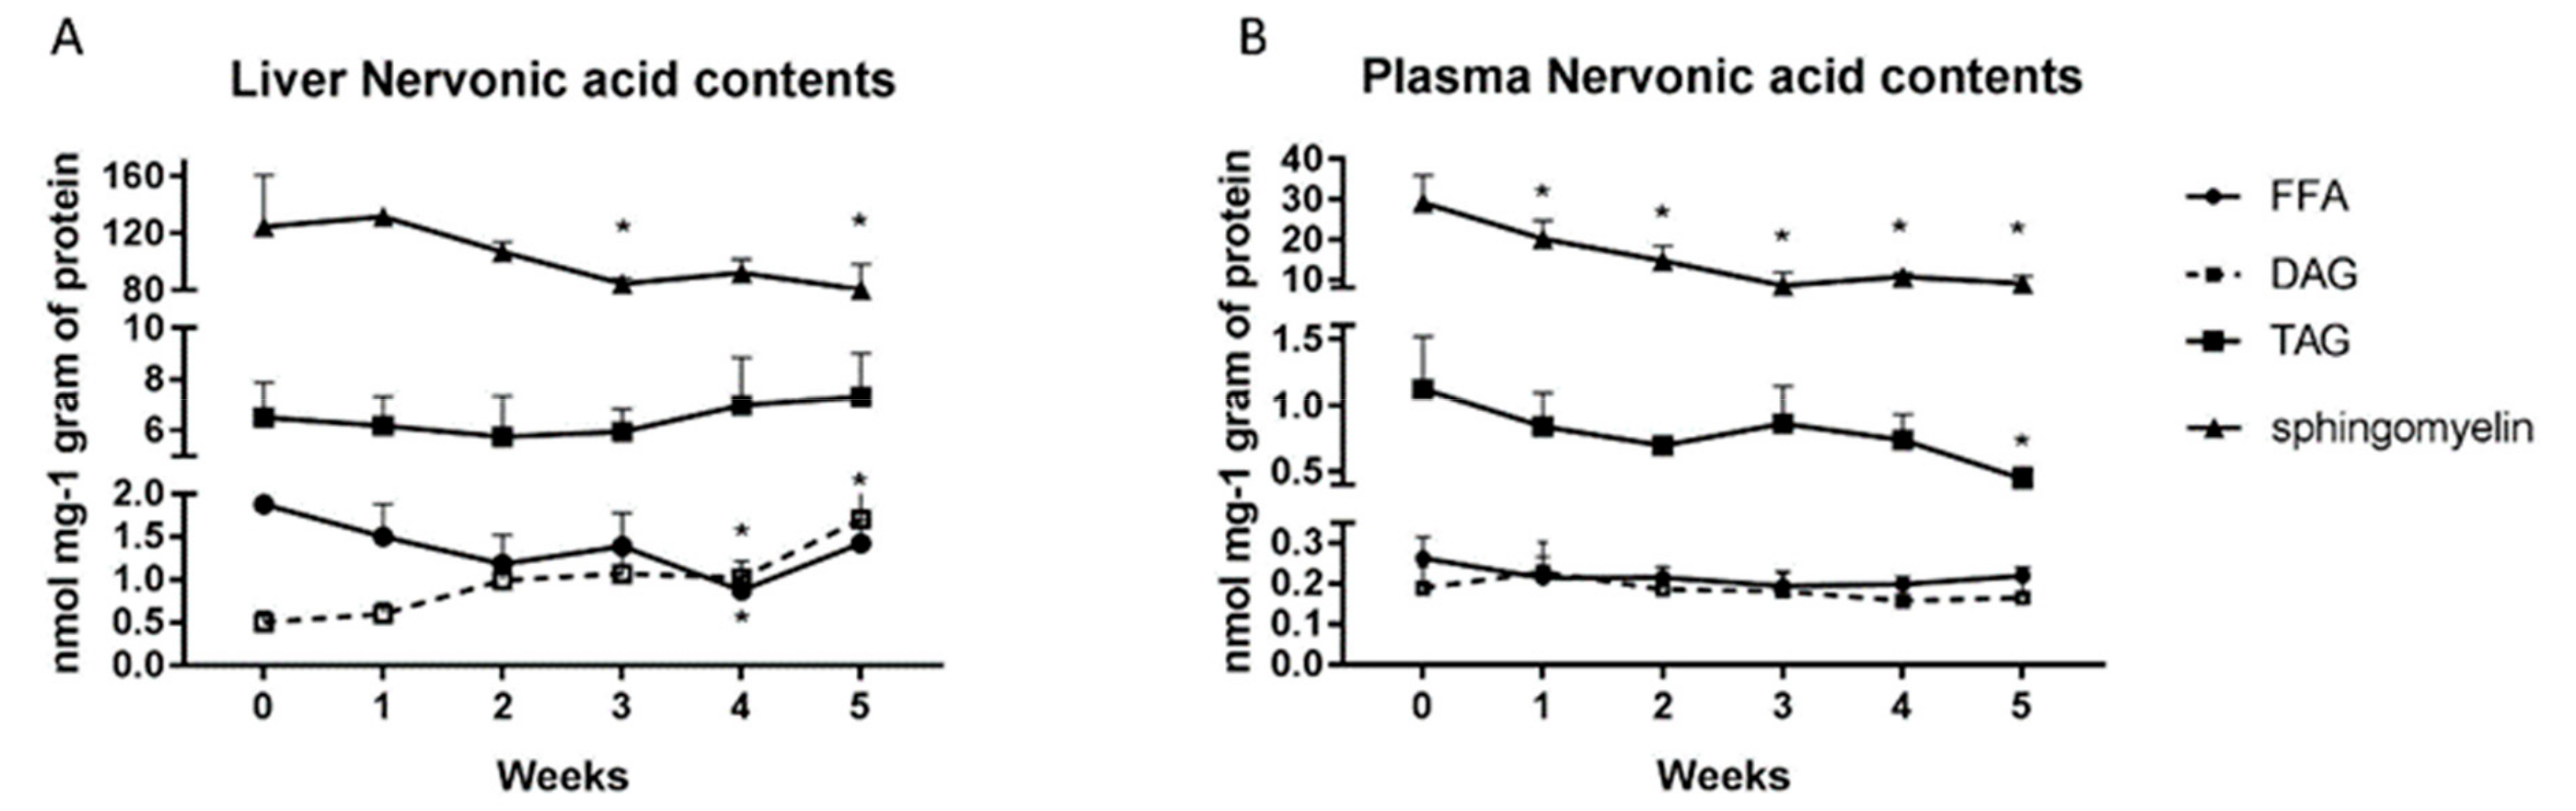
2.5. Changes in the Nervonic Acid Concentration in the Liver and Plasma
2.6. Changes in the Elongation and Desaturation Ratio
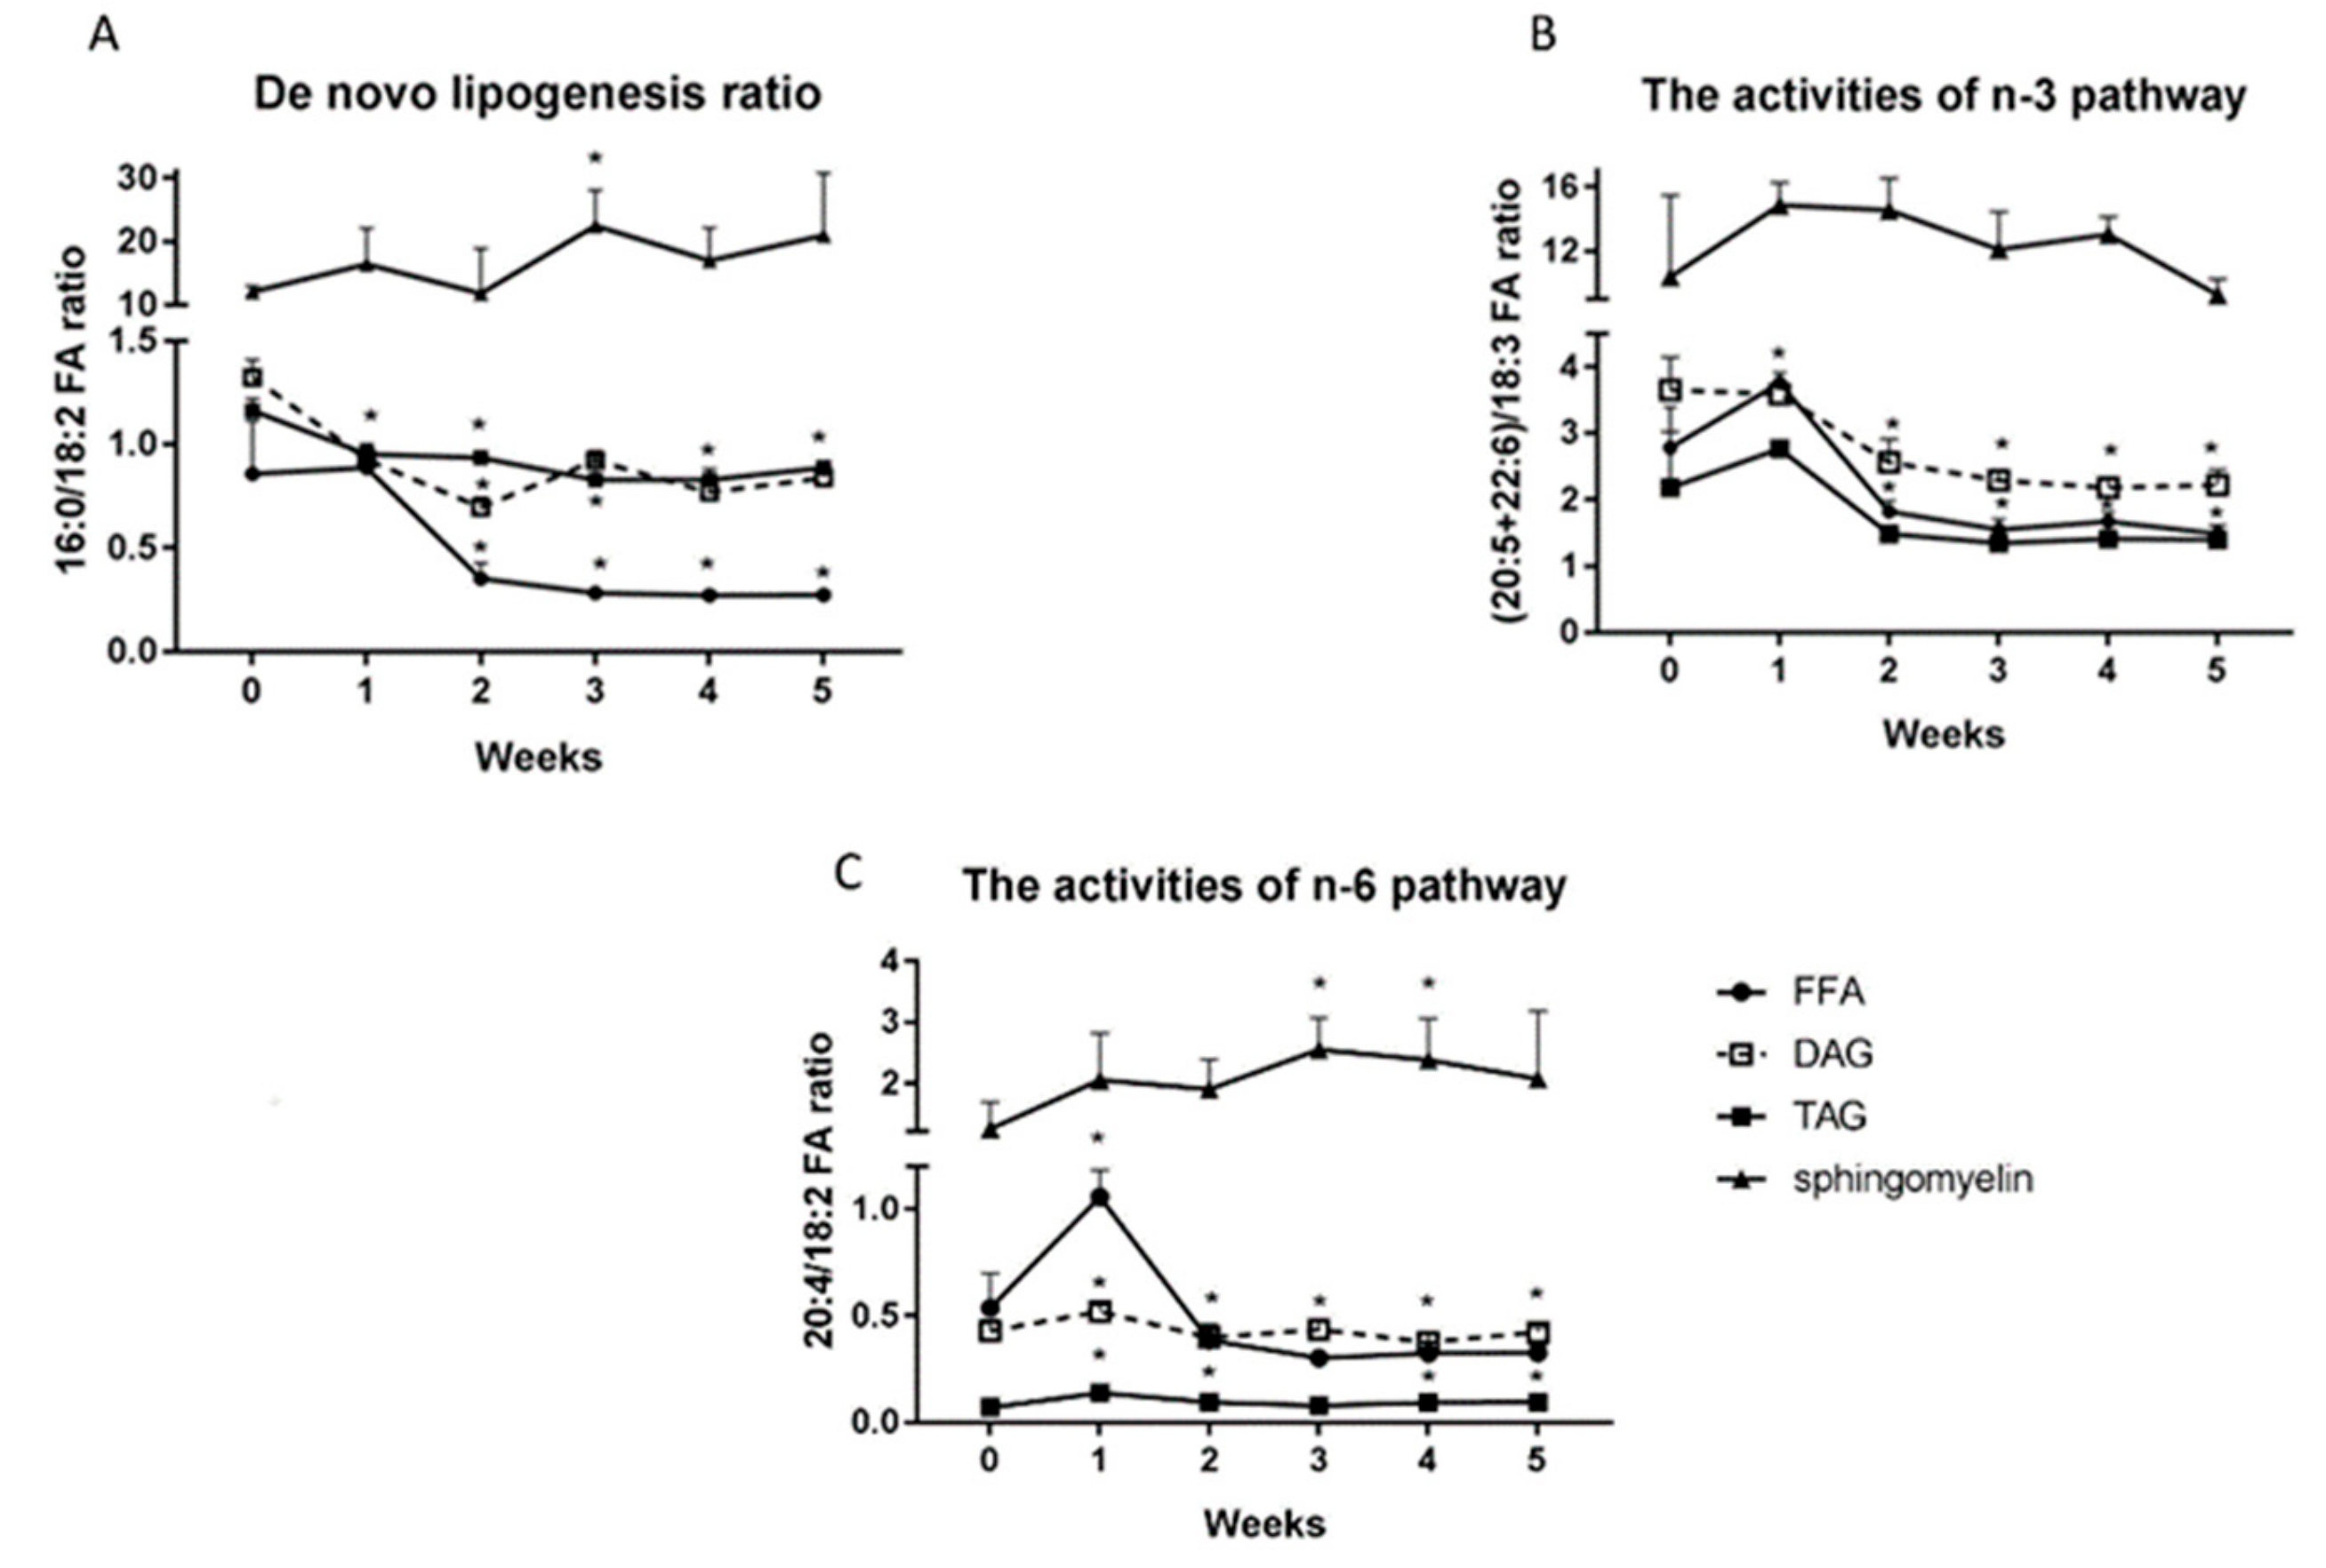
2.7. Changes in the De Novo Lipogenesis Ratio (16:0/18:2 n-3 Ratio), the Activities of n-3 (20:5+22:6)/18:3) and n-6 Pathways (20:4/18:2 n-6).
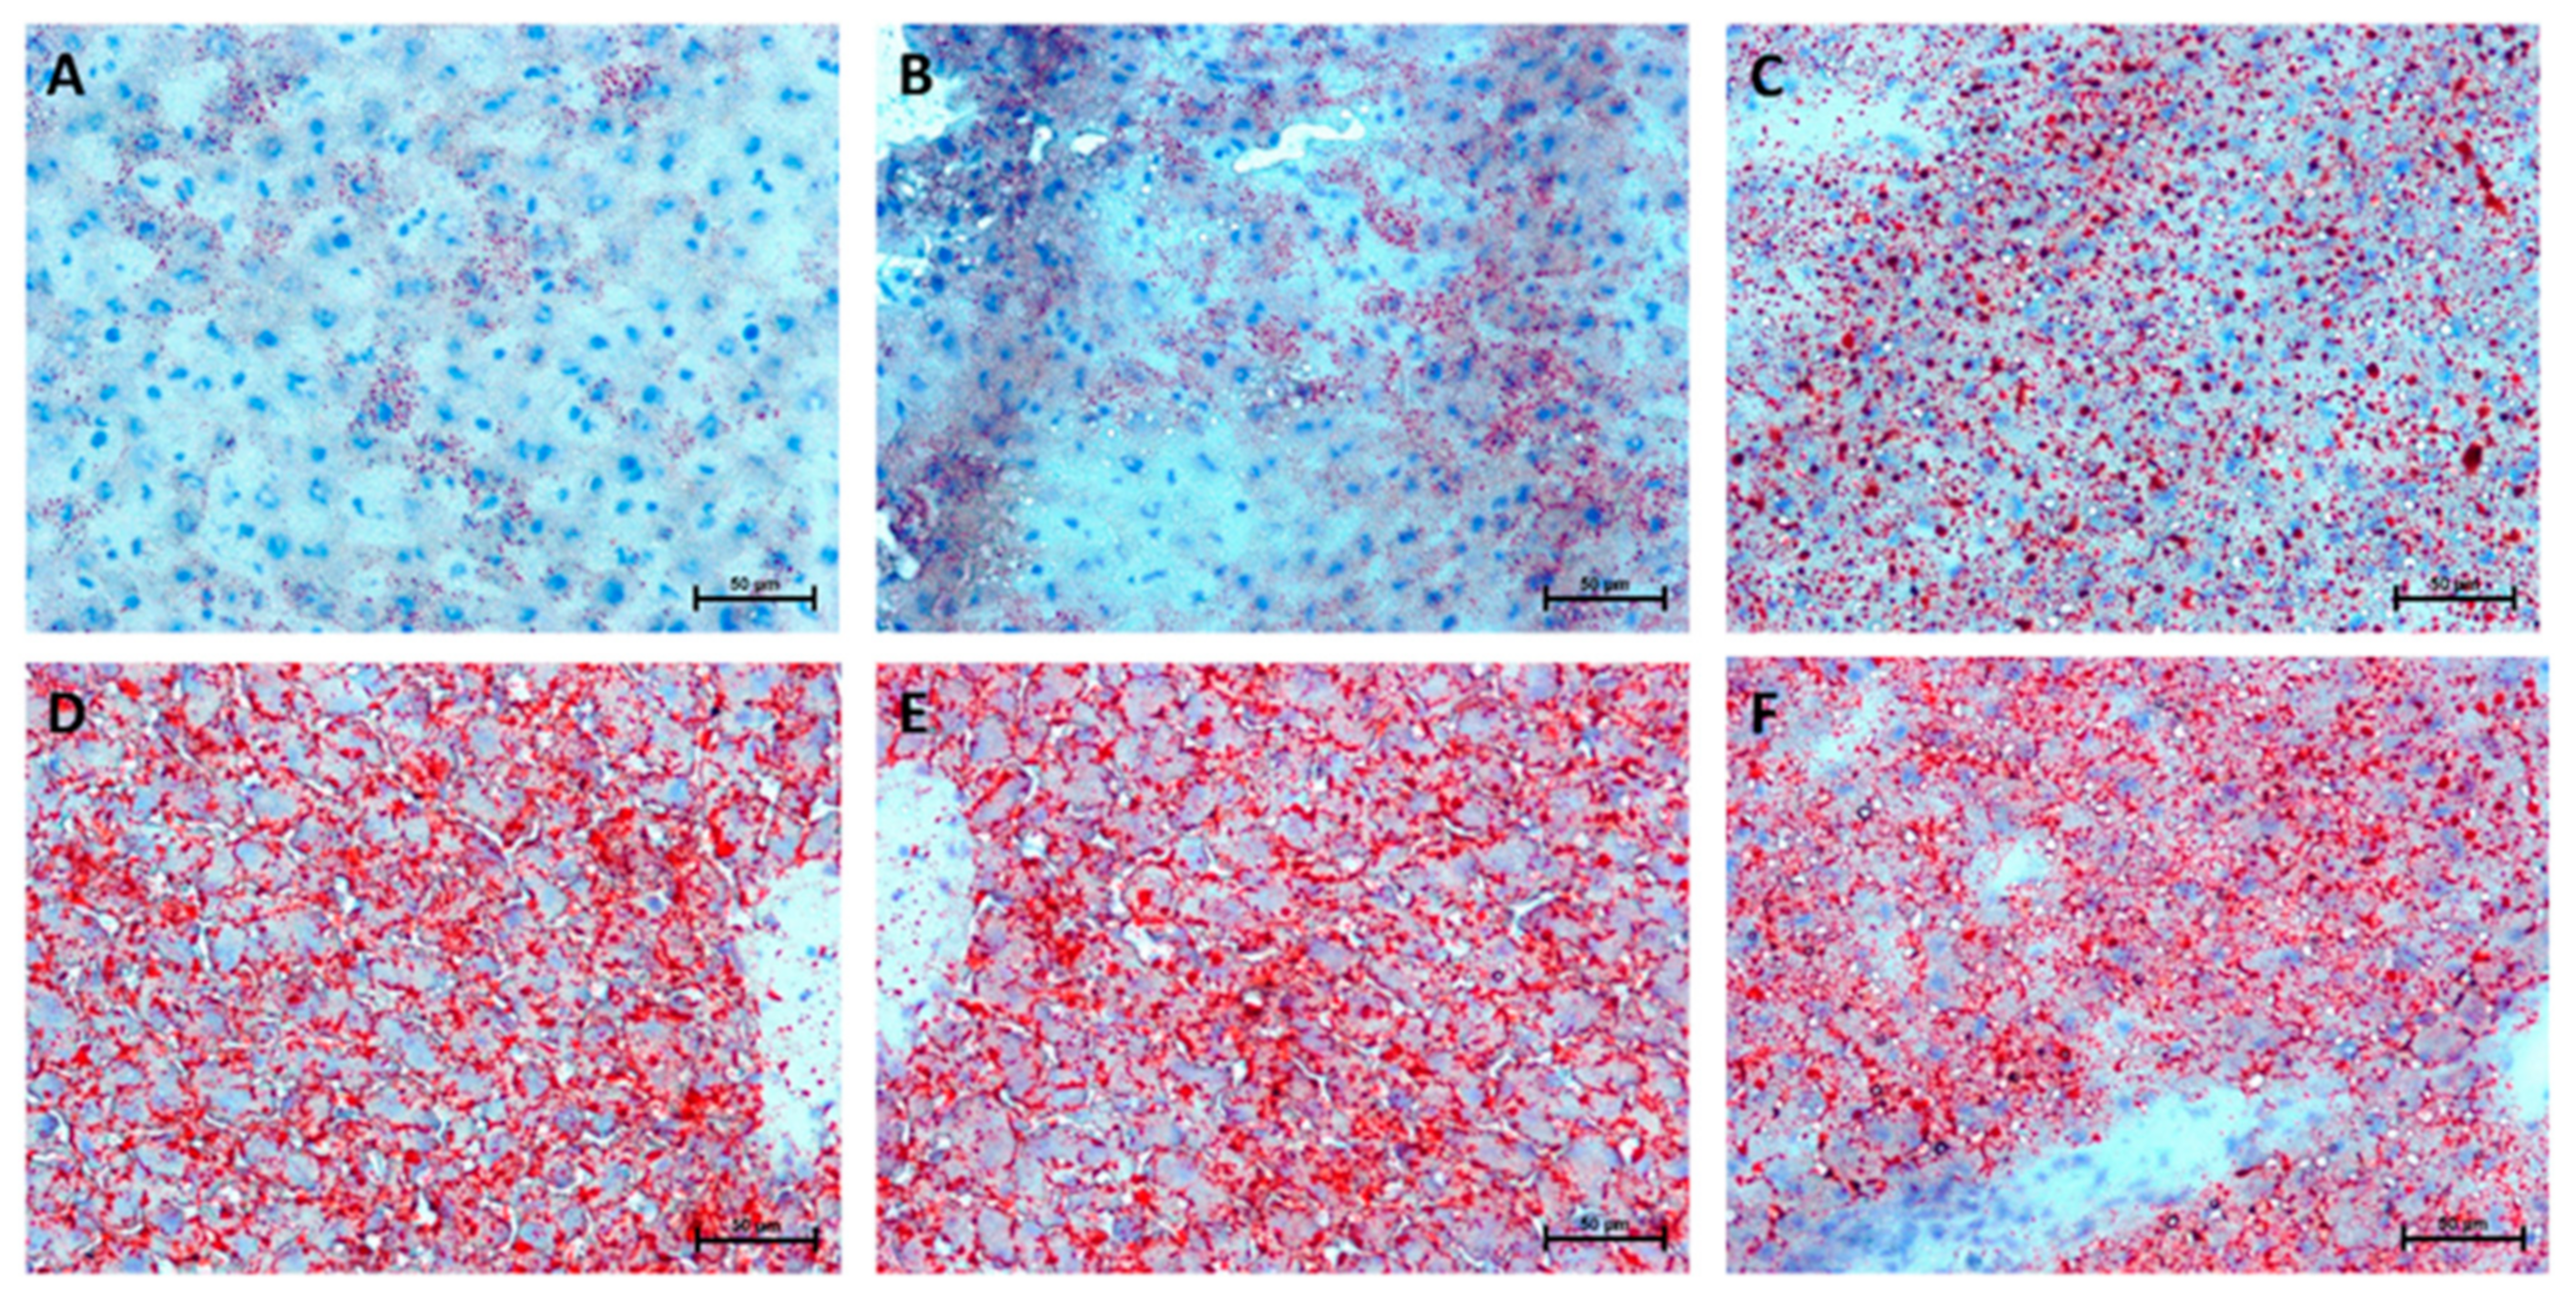
2.8. Hepatic Histological Changes
3. Discussion
4. Materials and Methods
4.1. Animals and Study Design
4.2. Serum and Liver Lipid Analysis
4.3. Immunoblotting
4.4. Liver Histopathology
4.5. Data Analyses
Author Contributions
Funding
Conflicts of Interest
References
- Onyekwere, C.A.; Ogbera, A.O.; Samaila, A.A.; Balogun, B.O.; Abdulkareem, F.B. Nonalcoholic fatty liver disease: Synopsis of current developments. Niger. J. Clin. Pract. 2015, 18, 703–712. [Google Scholar] [CrossRef] [PubMed]
- Dassanayake, A.S.; Kasturiratne, A.; Rajindrajith, S.; Kalubowila, U.; Chakrawarthi, S.; De Silva, A.P.; Makaya, M.; Mizoue, T.; Kato, N.; Wickremasinghe, A.R.; et al. Prevalence and risk factors for non-alcoholic fatty liver disease among adults in an urban Sri Lankan population. J. Gastroenterol. Hepatol. 2009, 24, 1284–1288. [Google Scholar] [CrossRef] [PubMed]
- Fabbrini, E.; Magkos, F. Hepatic Steatosis as a Marker of Metabolic Dysfunction. Nutrients 2015, 7, 4995–5019. [Google Scholar] [CrossRef] [PubMed] [Green Version]
- Cusi, K. Role of obesity and lipotoxicity in the development of nonalcoholic steatohepatitis: Pathophysiology and clinical implications. Gastroenterology 2012, 142, 711–725.e716. [Google Scholar] [CrossRef] [PubMed]
- Birkenfeld, A.L.; Shulman, G.I. Nonalcoholic fatty liver disease, hepatic insulin resistance, and type 2 diabetes. Hepatology 2014, 59, 713–723. [Google Scholar] [CrossRef] [PubMed]
- Di Minno, M.N.; Russolillo, A.; Lupoli, R.; Ambrosino, P.; Di Minno, A.; Tarantino, G. Omega-3 fatty acids for the treatment of non-alcoholic fatty liver disease. World. J. Gastroenterol. 2012, 18, 5839–5847. [Google Scholar] [CrossRef]
- Leamy, A.K.; Egnatchik, R.A.; Young, J.D. Molecular mechanisms and the role of saturated fatty acids in the progression of non-alcoholic fatty liver disease. Prog. Lipid Res. 2013, 52, 165–174. [Google Scholar] [CrossRef] [PubMed]
- Listenberger, L.L.; Han, X.; Lewis, S.E.; Cases, S.; Farese, R.V.; Ory, D.S.; Schaffer, J.E. Triglyceride accumulation protects against fatty acid-induced lipotoxicity. Proc. Natl. Acad. Sci. USA 2003, 100, 3077–3082. [Google Scholar] [CrossRef] [Green Version]
- Browning, J.D.; Szczepaniak, L.S.; Dobbins, R.; Nuremberg, P.; Horton, J.D.; Cohen, J.C.; Grundy, S.M.; Hobbs, H.H. Prevalence of hepatic steatosis in an urban population in the United States: Impact of ethnicity. Hepatology 2004, 40, 1387–1395. [Google Scholar] [CrossRef]
- Neuschwander-Tetri, B.A.; Ford, D.A.; Acharya, S.; Gilkey, G.; Basaranoglu, M.; Tetri, L.H.; Brunt, E.M. Dietary trans-fatty acid induced NASH is normalized following loss of trans-fatty acids from hepatic lipid pools. Lipids 2012, 47, 941–950. [Google Scholar] [CrossRef]
- Malaisse, W.J.; Portois, L.; Sener, A.; Carpentier, Y.A. Perturbation of 11-eicosenoate metabolism in female diabetic rats. Int. J. Mol. Med. 2008, 22, 133–137. [Google Scholar] [CrossRef] [PubMed]
- Oda, E.; Hatada, K.; Kimura, J.; Aizawa, Y.; Thanikachalam, P.V.; Watanabe, K. Relationships between serum unsaturated fatty acids and coronary risk factors: Negative relations between nervonic acid and obesity-related risk factors. Int. Heart J. 2005, 46, 975–985. [Google Scholar] [CrossRef] [PubMed]
- Sandhir, R.; Khan, M.; Chahal, A.; Singh, I. Localization of nervonic acid beta-oxidation in human and rodent peroxisomes: Impaired oxidation in Zellweger syndrome and X-linked adrenoleukodystrophy. J. Lipid Res. 1998, 39, 2161–2171. [Google Scholar] [PubMed]
- Seigneur, M.; Freyburger, G.; Gin, H.; Claverie, M.; Lardeau, D.; Lacape, G.; Le Moigne, F.; Crockett, R.; Boisseau, M.R. Serum fatty acid profiles in type I and type II diabetes: Metabolic alterations of fatty acids of the main serum lipids. Diabetes Res. Clin. Pract. 1994, 23, 169–177. [Google Scholar] [CrossRef]
- Yeh, Y.Y. Long chain fatty acid deficits in brain myelin sphingolipids of undernourished rat pups. Lipids. 1988, 23, 1114–1118. [Google Scholar] [CrossRef] [PubMed]
- Gorden, D.L.; Myers, D.S.; Ivanova, P.T.; Fahy, E.; Maurya, M.R.; Gupta, S.; Min, J.; Spann, N.J.; McDonald, J.G.; Kelly, S.L.; et al. Biomarkers of NAFLD progression: A lipidomics approach to an epidemic. J. Lipid Res. 2015, 56, 722–736. [Google Scholar] [CrossRef]
- Yuan, F.; Wang, H.; Tian, Y.; Li, Q.; He, L.; Li, N.; Liu, Z. Fish oil alleviated high-fat diet-induced non-alcoholic fatty liver disease via regulating hepatic lipids metabolism and metaflammation: A transcriptomic study. Lipids Health Dis. 2016, 15, 20. [Google Scholar] [CrossRef]
- Ipsen, D.H.; Tveden-Nyborg, P.; Rolin, B.; Rakipovski, G.; Beck, M.; Mortensen, L.W.; Færk, L.; Heegaard, P.M.; Møller, P.; Lykkesfeldt, J. High-fat but not sucrose intake is essential for induction of dyslipidemia and non-alcoholic steatohepatitis in guinea pigs. Nutr. Metab. (Lond) 2016, 13, 51. [Google Scholar] [CrossRef] [Green Version]
- Ipsen, D.H.; Tveden-Nyborg, P.; Lykkesfeldt, J. Dyslipidemia: Obese or Not Obese-That Is Not the Question. Curr. Obes. Rep. 2016, 5, 405–412. [Google Scholar] [CrossRef]
- Liu, J.; Han, L.; Zhu, L.; Yu, Y. Free fatty acids, not triglycerides, are associated with non-alcoholic liver injury progression in high fat diet induced obese rats. Lipids Health Dis. 2016, 15, 27. [Google Scholar] [CrossRef]
- Yamazaki, Y.; Kondo, K.; Maeba, R.; Nishimukai, M.; Nezu, T.; Hara, H. Proportion of nervonic acid in serum lipids is associated with serum plasmalogen levels and metabolic syndrome. J. Oleo. Sci. 2014, 63, 527–537. [Google Scholar] [CrossRef] [PubMed]
- Pickens, C.A.; Sordillo, L.M.; Comstock, S.S.; Harris, W.S.; Hortos, K.; Kovan, B.; Fenton, J.I. Plasma phospholipids, non-esterified plasma polyunsaturated fatty acids and oxylipids are associated with BMI. Prostaglandins Leukot Essent Fatty Acids 2015, 95, 31–40. [Google Scholar] [CrossRef] [PubMed]
- Softic, S.; Cohen, D.E.; Kahn, C.R. Role of Dietary Fructose and Hepatic De Novo Lipogenesis in Fatty Liver Disease. Dig. Di.s Sci. 2016, 61, 1282–1293. [Google Scholar] [CrossRef] [PubMed] [Green Version]
- Da Silva-Santi, L.G.; Antunes, M.M.; Caparroz-Assef, S.M.; Carbonera, F.; Masi, L.N.; Curi, R.; Visentainer, J.V.; Bazotte, R.B. Liver Fatty Acid Composition and Inflammation in Mice Fed with High-Carbohydrate Diet or High-Fat Diet. Nutrients 2016, 8, 682. [Google Scholar] [CrossRef] [PubMed]
- Wang, X.H.; Li, C.Y.; Muhammad, I.; Zhang, X.Y. Fatty acid composition in serum correlates with that in the liver and non-alcoholic fatty liver disease activity scores in mice fed a high-fat diet. Environ. Toxicol. Pharmacol. 2016, 44, 140–150. [Google Scholar] [CrossRef] [PubMed]
- Folch, J.; Lees, M.; Sloane Stanley, G.H. A simple method for the isolation and purification of total lipides from animal tissues. J. Biol. Chem. 1957, 226, 497–509. [Google Scholar] [PubMed]
- Chabowski, A.; Żendzian-Piotrowska, M.; Konstantynowicz, K.; Pankiewicz, W.; Mikłosz, A.; Łukaszuk, B.; Górski, J. Fatty acid transporters involved in the palmitate and oleate induced insulin resistance in primary rat hepatocytes. Acta. Physiol. (Oxf) 2013, 207, 346–357. [Google Scholar] [CrossRef]
- Konstantynowicz-Nowicka, K.; Harasim, E.; Baranowski, M.; Chabowski, A. New evidence for the role of ceramide in the development of hepatic insulin resistance. PLoS. ONE 2015, 10, e0116858. [Google Scholar] [CrossRef]
- Kleiner, D.E.; Brunt, E.M.; Van Natta, M.; Behling, C.; Contos, M.J.; Cummings, O.W.; Ferrell, L.D.; Liu, Y.C.; Torbenson, M.S.; Unalp-Arida, A.; et al. Design and validation of a histological scoring system for nonalcoholic fatty liver disease. Hepatology 2005, 41, 1313–1321. [Google Scholar] [CrossRef]


© 2019 by the authors. Licensee MDPI, Basel, Switzerland. This article is an open access article distributed under the terms and conditions of the Creative Commons Attribution (CC BY) license (http://creativecommons.org/licenses/by/4.0/).
Share and Cite
Konstantynowicz-Nowicka, K.; Berk, K.; Chabowski, A.; Kasacka, I.; Bielawiec, P.; Łukaszuk, B.; Harasim-Symbor, E. High-Fat Feeding in Time-Dependent Manner Affects Metabolic Routes Leading to Nervonic Acid Synthesis in NAFLD. Int. J. Mol. Sci. 2019, 20, 3829. https://0-doi-org.brum.beds.ac.uk/10.3390/ijms20153829
Konstantynowicz-Nowicka K, Berk K, Chabowski A, Kasacka I, Bielawiec P, Łukaszuk B, Harasim-Symbor E. High-Fat Feeding in Time-Dependent Manner Affects Metabolic Routes Leading to Nervonic Acid Synthesis in NAFLD. International Journal of Molecular Sciences. 2019; 20(15):3829. https://0-doi-org.brum.beds.ac.uk/10.3390/ijms20153829
Chicago/Turabian StyleKonstantynowicz-Nowicka, Karolina, Klaudia Berk, Adrian Chabowski, Irena Kasacka, Patrycja Bielawiec, Bartłomiej Łukaszuk, and Ewa Harasim-Symbor. 2019. "High-Fat Feeding in Time-Dependent Manner Affects Metabolic Routes Leading to Nervonic Acid Synthesis in NAFLD" International Journal of Molecular Sciences 20, no. 15: 3829. https://0-doi-org.brum.beds.ac.uk/10.3390/ijms20153829