Glucose Restriction Plus Refeeding in Vitro Induce Changes of the Human Adipocyte Secretome with an Impact on Complement Factors and Cathepsins


Abstract
:1. Introduction
2. Results
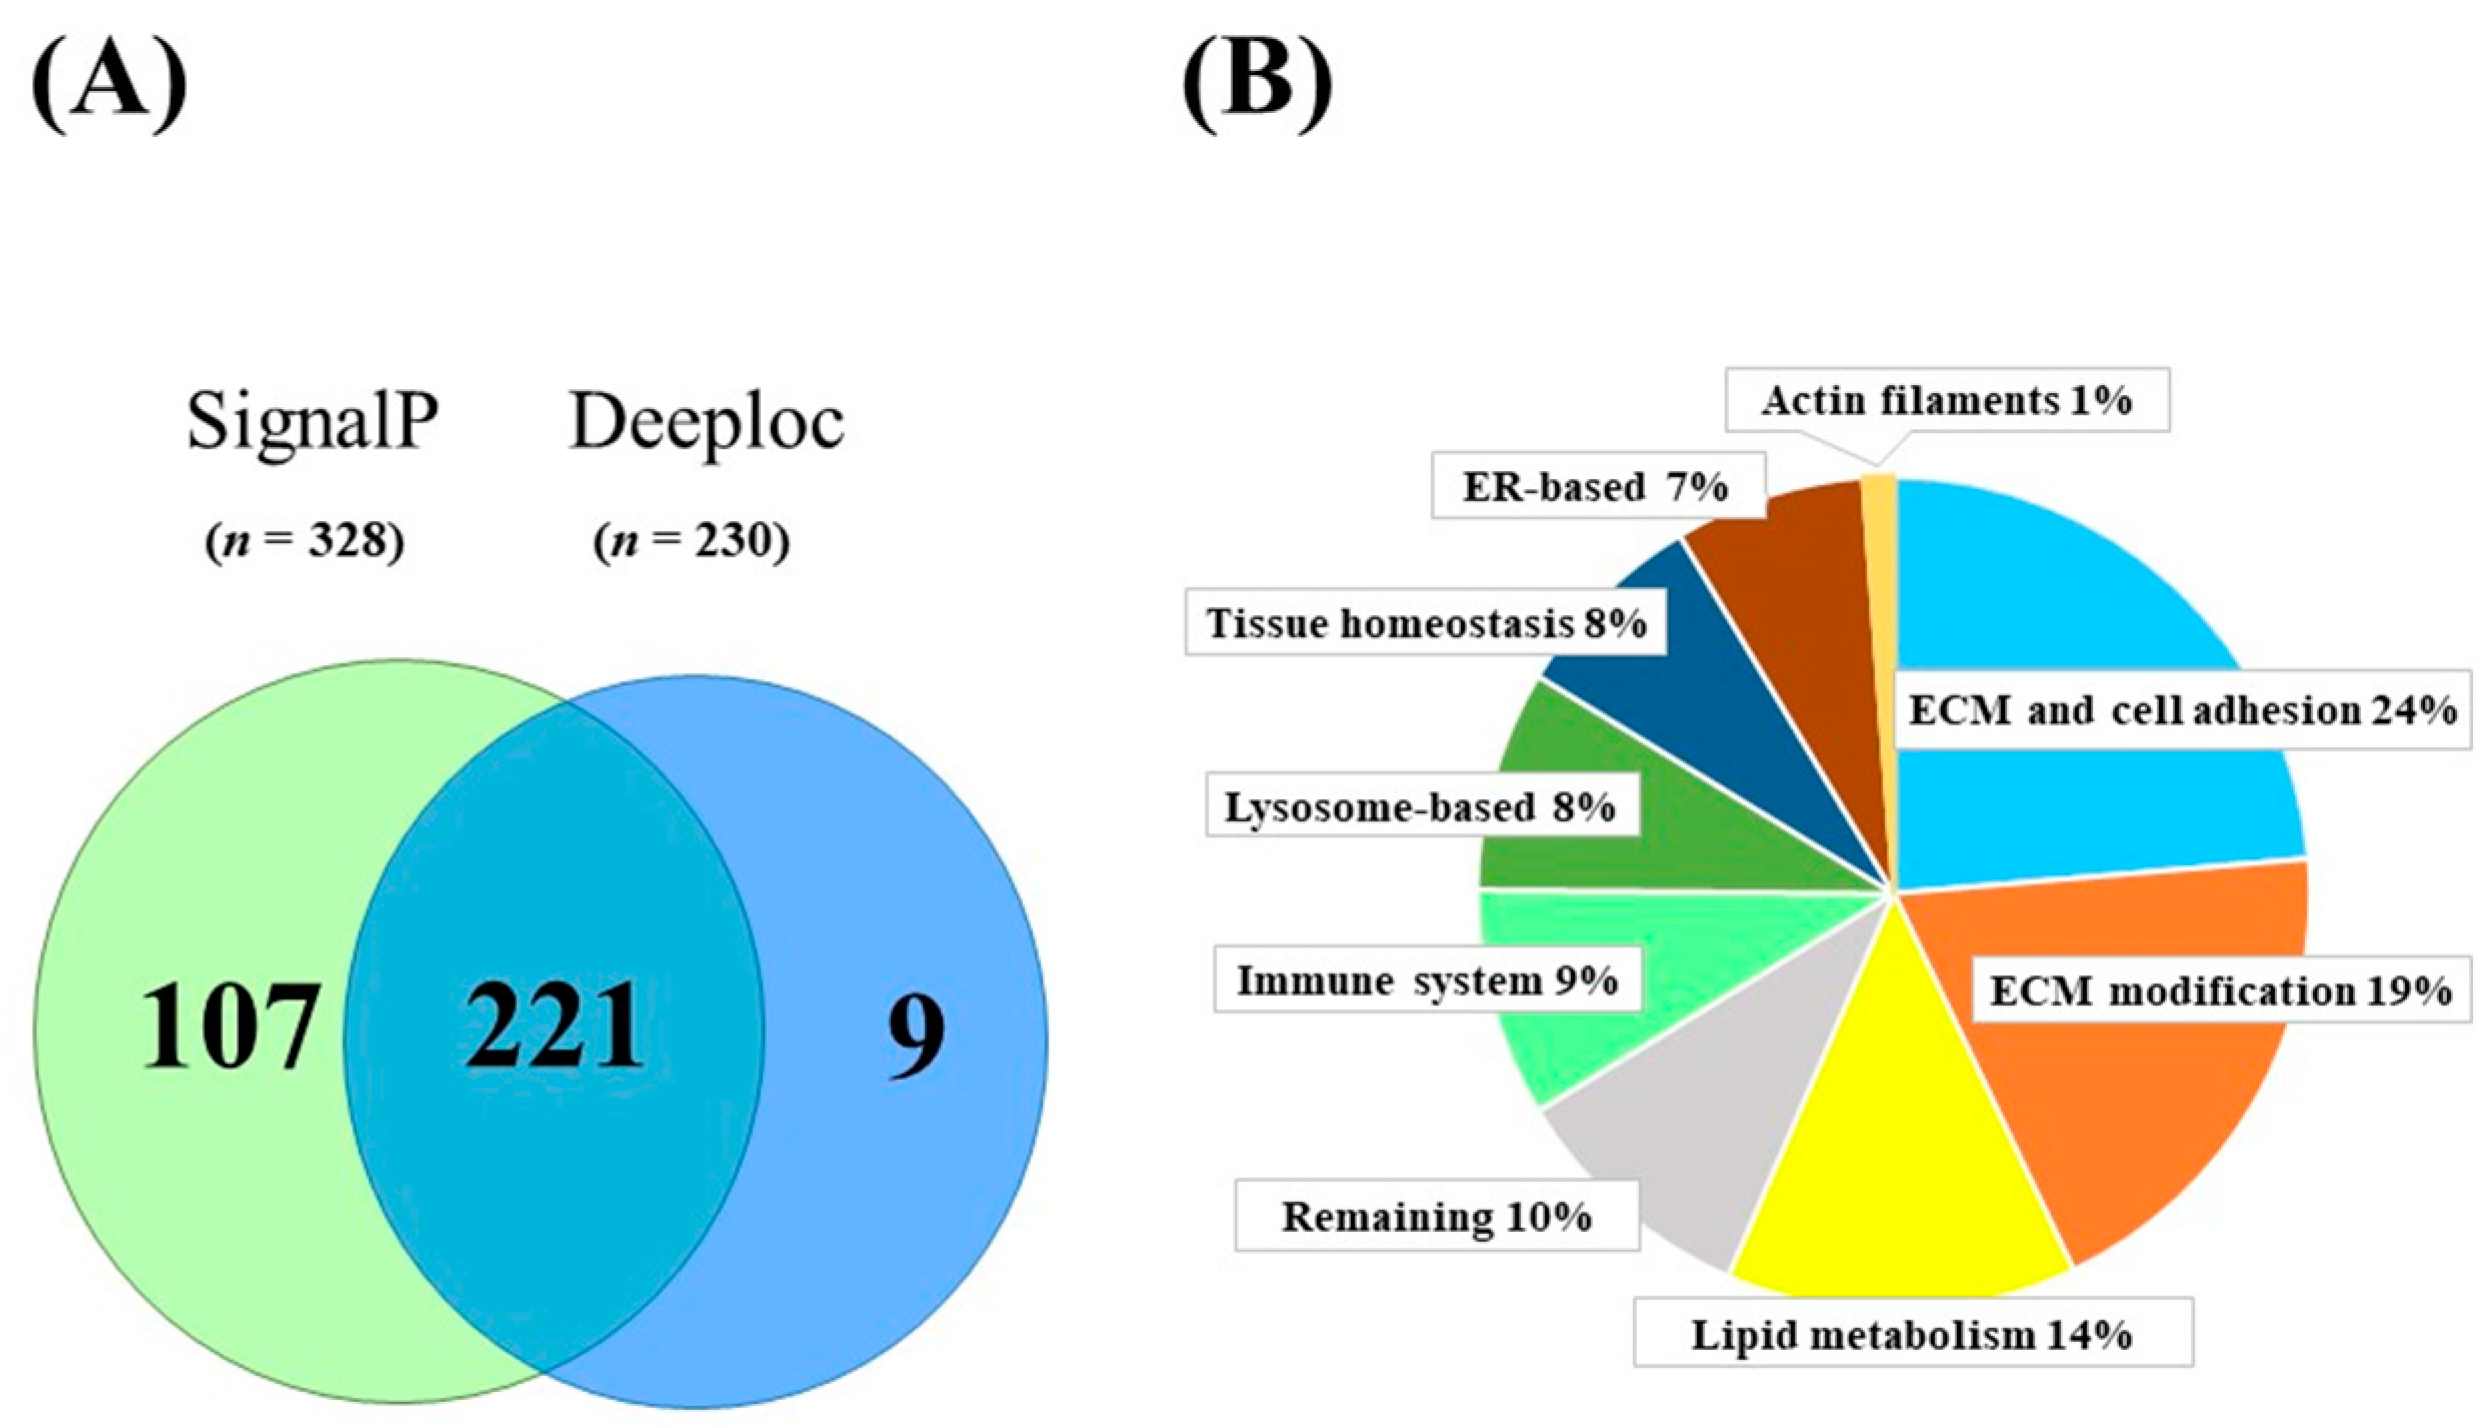
2.1. Proteins Secreted from Human SGBS Adipocytes
2.2. Newly Identified Secreted Proteins of Human SGBS Adipocytes
2.3. Functional Categories of Identified Proteins
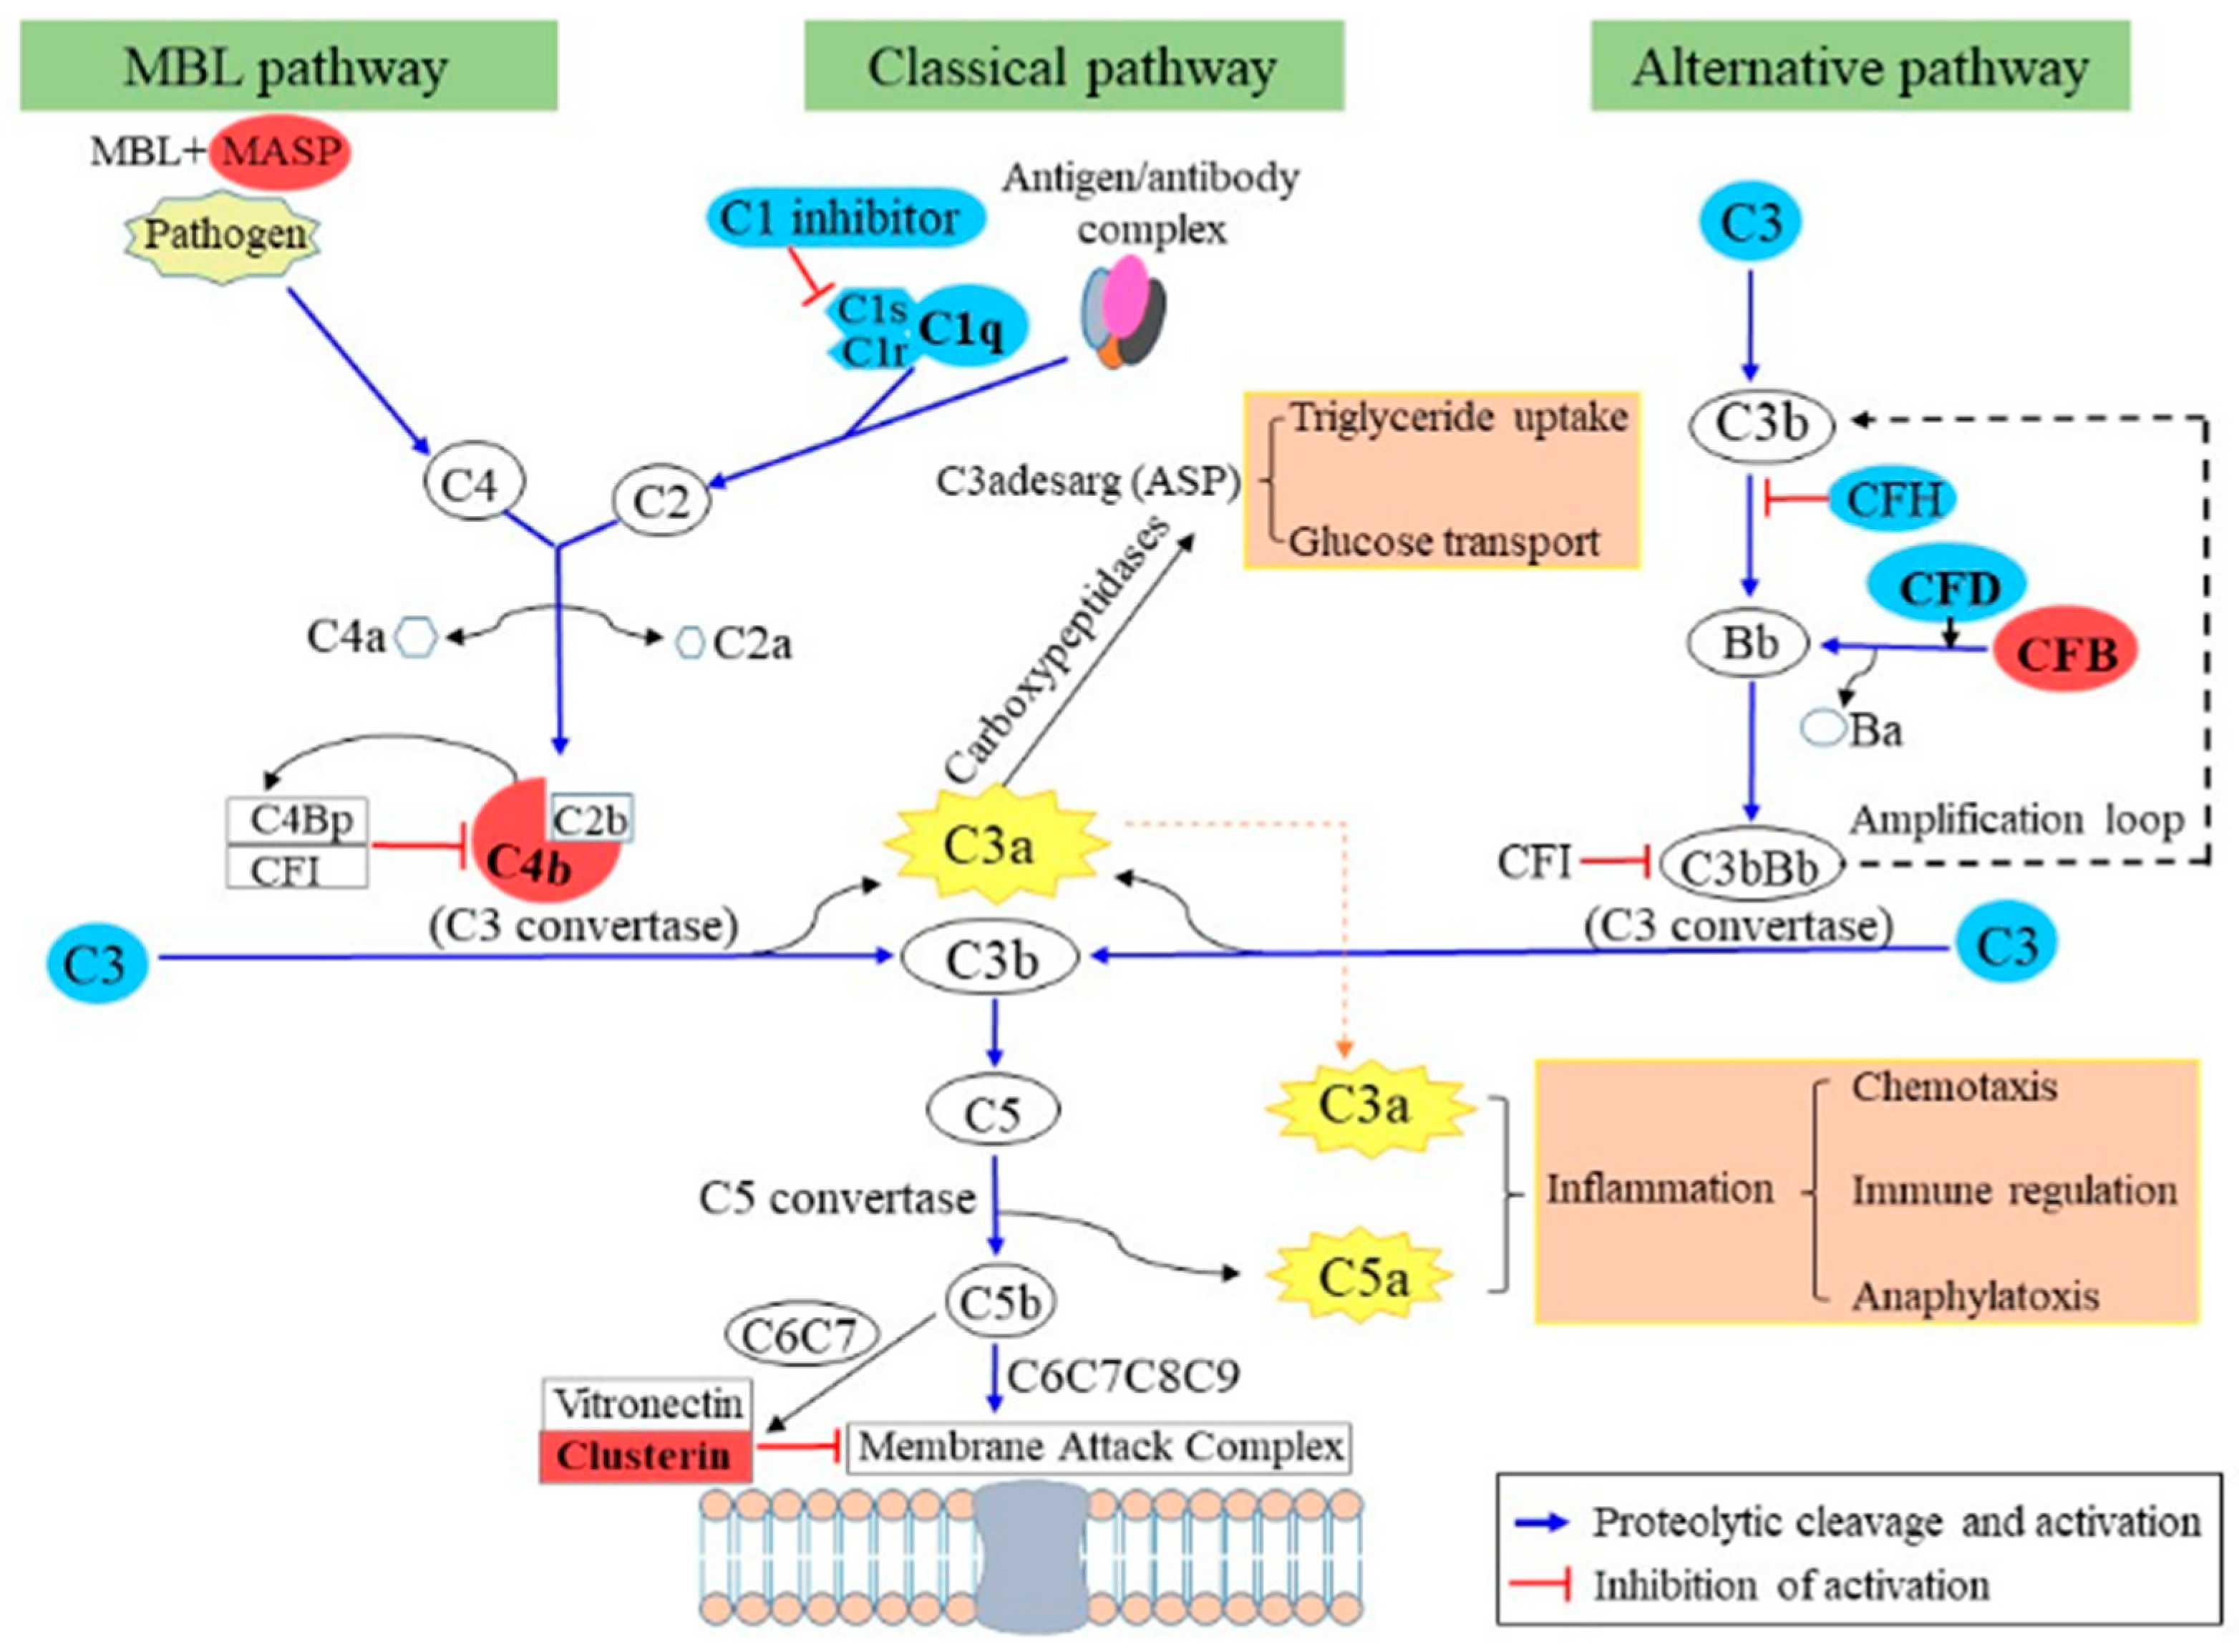
2.4. Adipocyte Secretome Changes after GR Plus RF as Compared with NF
3. Discussion
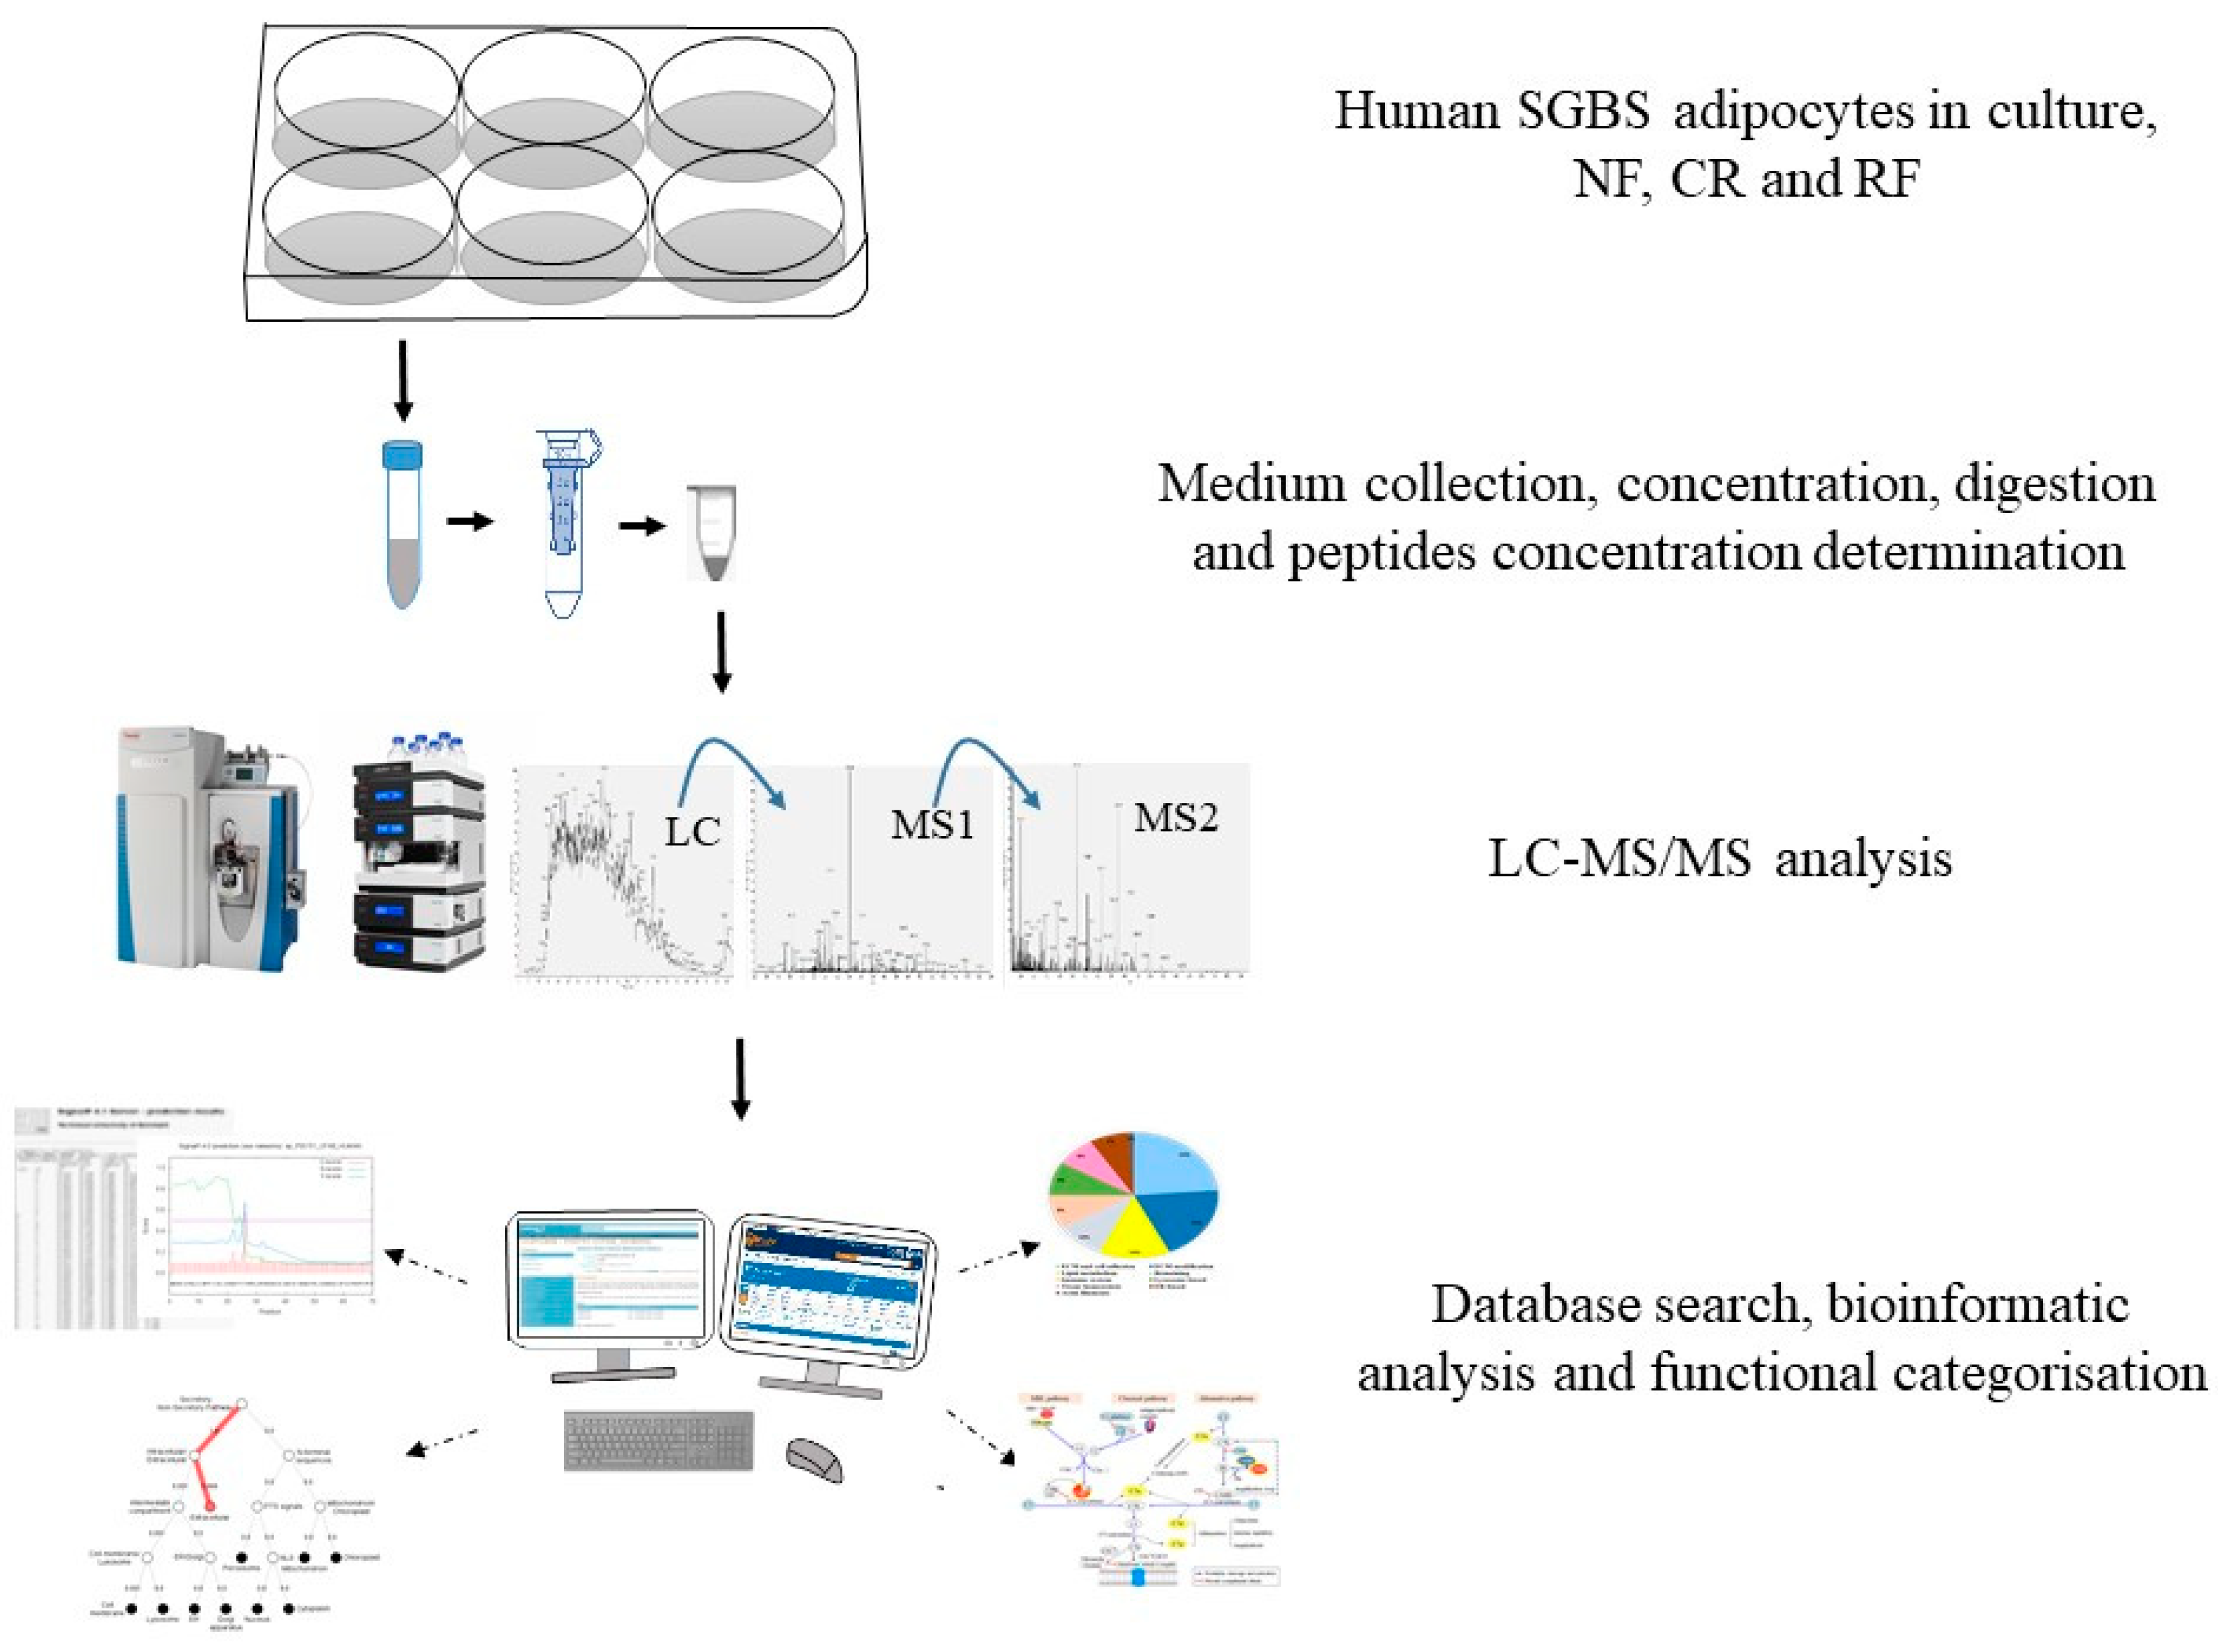
4. Materials and Methods
4.1. Cell Culture
4.2. Collection of Secretion Medium
4.3. Sample Preparation
4.4. Label-Free Protein Identification and Quantification
4.5. Database Search and Quantification
4.6. Data Normalization
4.7. Validation of Secreted Proteins and Imputation of Missing Values
4.8. Statistical Analysis
5. Conclusions
Supplementary Materials
Author Contributions
Funding
Acknowledgments
Conflicts of Interest
Abbreviations
| CR | calorie restriction |
| SGBS | Simpson Golabi Behmel Syndrome |
| GR | glucose restriction |
| RF | refeeding |
| NF | normal feeding |
| DMEM/F12 | Dulbecco’s Modified Eagle Medium: Nutrient Mixture F-12 |
| FC | fold change |
| C1q | complement factor 1Q |
| AOC3 | membrane primary amine oxidase |
| CSRP1 | cysteine and glycine-rich protein 1 |
| LGALS1 | galectin-1 |
| DDT | D-dopachrome decarboxylase |
| PRSS3 | trypsin-3 |
| MT1G | metallothionein-1G |
| PSMF1 | proteasome inhibitor subunit 1 |
| SPRR2G | small proline-rich protein 2G |
| ENPP2 | ectonucleotide pyrophosphatase/phosphodiesterase family member 2 |
| ECM | extracellular matrix |
| LC-MS/MS | liquid chromatography tandem mass spectrometry |
| CFB | complement factor B |
| ADAMTSL1 | ADAMTS-like protein 1 |
| ABI3BP | target of Nesh-SH3 |
| CES1 | liver carboxylesterase 1 |
| SORT1 | sortilin |
| DMKN | dermokine |
| PTGDS | prostaglandin-H2 D-isomerase |
| C4-B | complement factor 4B |
| CFD | complement factor D |
| ASP | acylation-stimulating protein |
| CTSA | cathepsin A |
| CTSB | cathepsin B |
| CTSL | cathepsin L |
| CTSS | cathepsin S |
| APP | amyloid-beta A4 protein |
| CHI3L2 | chitinase-3-like protein 2 |
| MASP | mannan-binding lectin serine protease |
References
- Fruh, S.M. Obesity: Risk factors, complications, and strategies for sustainable long-term weight management. J. Am. Assoc. Nurse Pract. 2017, 29, S3–S14. [Google Scholar] [CrossRef] [PubMed]
- Lehr, S.; Hartwig, S.; Sell, H. Adipokines: A treasure trove for the discovery of biomarkers for metabolic disorders. Proteom. Clin. Appl. 2012, 6, 91–101. [Google Scholar] [CrossRef] [PubMed]
- Rosenow, A.; Arrey, T.N.; Bouwman, F.G.; Noben, J.P.; Wabitsch, M.; Mariman, E.C.; Karas, M.; Renes, J. Identification of novel human adipocyte secreted proteins by using SGBS cells. J. Proteome Res. 2010, 9, 5389–5401. [Google Scholar] [CrossRef] [PubMed]
- Mohamed-Ali, V.; Pinkney, J.H.; Coppack, S.W. Adipose tissue as an endocrine and paracrine organ. Int. J. Obes. 1998, 22, 1145–1158. [Google Scholar] [CrossRef] [Green Version]
- Ouchi, N.; Parker, J.L.; Lugus, J.J.; Walsh, K. Adipokines in inflammation and metabolic disease. Nat. Rev. Immunol. 2011, 11, 85–97. [Google Scholar] [CrossRef] [PubMed]
- de las Fuentes, L.; Waggoner, A.D.; Mohammed, B.S.; Stein, R.I.; Miller, B.V., 3rd; Foster, G.D.; Wyatt, H.R.; Klein, S.; Davila-Roman, V.G. Effect of moderate diet-induced weight loss and weight regain on cardiovascular structure and function. J. Am. Coll. Cardiol. 2009, 54, 2376–2381. [Google Scholar] [CrossRef] [PubMed]
- Horton, E.S. Effects of Lifestyle Changes to Reduce Risks of Diabetes and Associated Cardiovascular Risks: Results from Large Scale Efficacy Trials. Obesity 2009, 17, S43–S48. [Google Scholar] [CrossRef] [PubMed]
- Renes, J.; Rosenow, A.; Roumans, N.; Noben, J.P.; Mariman, E.C. Calorie restriction-induced changes in the secretome of human adipocytes, comparison with resveratrol-induced secretome effects. Biochim. Biophys. Acta 2014, 1844, 1511–1522. [Google Scholar] [CrossRef] [PubMed]
- Barte, J.C.M.; ter Bogt, N.C.W.; Bogers, R.P.; Teixeira, P.J.; Blissmer, B.; Mori, T.A.; Bemelmans, W.J.E. Maintenance of weight loss after lifestyle interventions for overweight and obesity, a systematic review. Obes. Rev. 2010, 11, 899–906. [Google Scholar] [CrossRef]
- Delahanty, L.M.; Pan, Q.; Jablonski, K.A.; Aroda, V.R.; Watson, K.E.; Bray, G.A.; Kahn, S.E.; Florez, J.C.; Perreault, L.; Franks, P.W.; et al. Effects of weight loss, weight cycling, and weight loss maintenance on diabetes incidence and change in cardiometabolic traits in the Diabetes Prevention Program. Diabetes Care 2014, 37, 2738–2745. [Google Scholar] [CrossRef]
- Van Baak, M.A.; Mariman, E.C.M. Mechanisms of weight regain after weight loss - the role of adipose tissue. Nat. Rev. Endocrinol. 2019, 15, 274–287. [Google Scholar] [CrossRef] [PubMed]
- Wabitsch, M.; Brenner, R.E.; Melzner, I.; Braun, M.; Moller, P.; Heinze, E.; Debatin, K.M.; Hauner, H. Characterization of a human preadipocyte cell strain with high capacity for adipose differentiation. Int. J. Obes. 2001, 25, 8–15. [Google Scholar] [CrossRef] [Green Version]
- Fischer-Posovszky, P.; Newell, F.S.; Wabitsch, M.; Tornqvist, H.E. Human SGBS Cells-a Unique Tool for Studies of Human Fat Cell Biology. Obes. Facts 2008, 1, 184–189. [Google Scholar] [CrossRef] [PubMed]
- Buttner, P.; Bluher, M.; Wabitsch, M.; Kiess, W.; Korner, A. Expression profiles of human adipocyte differentiation using the SGBS cell model. Horm. Res. 2008, 70, 68. [Google Scholar]
- Allott, E.H.; Oliver, E.; Lysaght, J.; Gray, S.G.; Reynolds, J.V.; Roche, H.M.; Pidgeon, G.P. The SGBS cell strain as a model for the in vitro study of obesity and cancer. Clin. Transl. Oncol. 2012, 14, 774–782. [Google Scholar] [CrossRef] [PubMed]
- Rosenow, A.; Noben, J.P.; Jocken, J.; Kallendrusch, S.; Fischer-Posovszky, P.; Mariman, E.C.; Renes, J. Resveratrol-induced changes of the human adipocyte secretion profile. J. Proteome Res. 2012, 11, 4733–4743. [Google Scholar] [CrossRef] [PubMed]
- Qiao, Q.; Bouwman, F.G.; van Baak, M.A.; Roumans, N.J.T.; Vink, R.G.; Coort, S.L.M.; Renes, J.W.; Mariman, E.C.M. Adipocyte abundances of CES1, CRYAB, ENO1 and GANAB are modified in-vitro by glucose restriction and are associated with cellular remodelling during weight regain. Adipocyte 2019, 8, 190–200. [Google Scholar] [CrossRef] [Green Version]
- Wang, P.; Mariman, E.; Keijer, J.; Bouwman, F.; Noben, J.P.; Robben, J.; Renes, J. Profiling of the secreted proteins during 3T3-L1 adipocyte differentiation leads to the identification of novel adipokines. Cell Mol. Life Sci. 2004, 61, 2405–2417. [Google Scholar] [CrossRef]
- Chen, X.L.; Cushman, S.W.; Pannell, L.K.; Hess, S. Quantitative proteomic analysis of the secretory proteins from rat adipose cells using a 2D liquid chromatography-MS/MS approach. J. Proteome Res. 2005, 4, 570–577. [Google Scholar] [CrossRef]
- Molina, H.; Yang, Y.; Ruch, T.; Kim, J.W.; Mortensen, P.; Otto, T.; Nalli, A.; Tang, Q.Q.; Lane, M.D.; Chaerkady, R.; et al. Temporal Profiling of the Adipocyte Proteome during Differentiation Using a Five-Plex SILAC Based Strategy. J. Proteome Res. 2009, 8, 48–58. [Google Scholar] [CrossRef]
- Celis, J.E.; Moreira, J.M.A.; Cabezon, T.; Gromov, P.; Friis, E.; Rank, F.; Gromova, I. Identification of extracellular and intracellular signaling components of the mammary adipose tissue and its interstitial fluid in high risk breast cancer patients—Toward dissecting the molecular circuitry of epithelial-adipocyte stromal cell interactions. Mol. Cell Proteom. 2005, 4, 492–522. [Google Scholar] [CrossRef]
- Mutch, D.M.; Rouault, C.; Keophiphath, M.; Lacasa, D.; Clement, K. Using gene expression to predict the secretome of differentiating human preadipocytes. Int. J. Obes. 2009, 33, 354–363. [Google Scholar] [CrossRef] [PubMed] [Green Version]
- Alvarez-Llamas, G.; Szalowska, E.; de Vries, M.P.; Weening, D.; Landman, K.; Hoek, A.; Wolffenbuttel, B.H.R.; Roelofsen, H.; Vonk, R.J. Characterization of the human visceral adipose tissue secretome. Mol. Cell Proteom. 2007, 6, 589–600. [Google Scholar] [CrossRef] [PubMed]
- Zvonic, S.; Lefevre, M.; Kilroy, G.; Floyd, Z.E.; DeLany, J.P.; Kheterpal, I.; Gravois, A.; Dow, R.; White, A.; Wu, X.Y.; et al. Secretome of primary cultures of human adipose-derived stem cells—Modulation of serpins by adipogenesis. Mol. Cell Proteom. 2007, 6, 18–28. [Google Scholar] [CrossRef] [PubMed]
- Kim, J.; Choi, Y.S.; Lim, S.; Yea, K.; Yoon, J.H.; Jun, D.J.; Ha, S.H.; Kim, J.W.; Kim, J.H.; Suh, P.G.; et al. Comparative analysis of the secretory proteome of human adipose stromal vascular fraction cells during adipogenesis. Proteomics 2010, 10, 394–405. [Google Scholar] [CrossRef] [PubMed]
- Zhong, J.; Krawczyk, S.A.; Chaerkady, R.; Huang, H.L.; Goel, R.; Bader, J.S.; Wong, G.W.; Corkey, B.E.; Pandey, A. Temporal Profiling of the Secretome during Adipogenesis in Humans. J. Proteome Res. 2010, 9, 5228–5238. [Google Scholar] [CrossRef] [PubMed]
- Lee, M.J.; Kim, J.; Kim, M.Y.; Bae, Y.S.; Ryu, S.H.; Lee, T.G.; Kim, J.H. Proteomic Analysis of Tumor Necrosis Factor-alpha-Induced Secretome of Human Adipose Tissue-Derived Mesenchymal Stem Cells. J. Proteome Res. 2010, 9, 1754–1762. [Google Scholar] [CrossRef] [PubMed]
- Lehr, S.; Hartwig, S.; Lamers, D.; Famulla, S.; Muller, S.; Hanisch, F.G.; Cuvelier, C.; Ruige, J.; Eckardt, K.; Ouwens, D.M.; et al. Identification and Validation of Novel Adipokines Released from Primary Human Adipocytes. Mol. Cell Proteom. 2012, 11. [Google Scholar] [CrossRef] [PubMed] [Green Version]
- Li, Z.Y.; Zheng, S.L.; Wang, P.; Xu, T.Y.; Guan, Y.F.; Zhang, Y.J.; Miao, C.Y. Subfatin is a Novel Adipokine and Unlike Meteorin in Adipose and Brain Expression. CNS Neurosci. 2014, 20, 344–354. [Google Scholar] [CrossRef] [PubMed]
- Ali Khan, A.; Hansson, J.; Weber, P.; Foehr, S.; Krijgsveld, J.; Herzig, S.; Scheideler, M. Comparative Secretome Analyses of Primary Murine White and Brown Adipocytes Reveal Novel Adipokines. Mol. Cell Proteom. 2018, 17, 2358–2370. [Google Scholar] [CrossRef] [Green Version]
- Lim, J.M.; Sherling, D.; Teo, C.F.; Hausman, D.B.; Lin, D.W.; Wells, L. Defining the regulated secreted proteome of rodent adipocytes upon the induction of insulin resistance. J. Proteome Res. 2008, 7, 1251–1263. [Google Scholar] [CrossRef]
- Roelofsen, H.; Dijkstra, M.; Weening, D.; de Vries, M.P.; Hoek, A.; Vonk, R.J. Comparison of Isotope-labeled Amino Acid Incorporation Rates (CILAIR) Provides a Quantitative Method to Study Tissue Secretomes. Mol. Cell Proteom. 2009, 8, 316–324. [Google Scholar] [CrossRef] [PubMed] [Green Version]
- Mariman, E.C.; Wang, P. Adipocyte extracellular matrix composition, dynamics and role in obesity. Cell Mol. Life Sci. 2010, 67, 1277–1292. [Google Scholar] [CrossRef] [PubMed] [Green Version]
- Ojima, K.; Oe, M.; Nakajima, I.; Muroya, S.; Nishimura, T. Dynamics of protein secretion during adipocyte differentiation. FEBS Open Bio 2016, 6, 816–826. [Google Scholar] [CrossRef] [PubMed]
- Renes, J.; Mariman, E. Application of proteomics technology in adipocyte biology. Mol. Biosyst. 2013, 9, 1076–1091. [Google Scholar] [CrossRef] [PubMed]
- Hartwig, S.; De Filippo, E.; Goddeke, S.; Knebel, B.; Kotzka, J.; Al-Hasani, H.; Roden, M.; Lehr, S.; Sell, H. Exosomal proteins constitute an essential part of the human adipose tissue secretome. Biochim. Biophys. Acta Proteins Proteom. 2018. [Google Scholar] [CrossRef]
- Laria, A.E.; Messineo, S.; Arcidiacono, B.; Varano, M.; Chiefari, E.; Semple, R.K.; Rocha, N.; Russo, D.; Cuda, G.; Gaspari, M.; et al. Secretome Analysis of Hypoxia- Induced 3T3-L1 Adipocytes Uncovers Novel Proteins Potentially Involved in Obesity. Proteomics 2018, 18. [Google Scholar] [CrossRef]
- Roca-Rivada, A.; Bravo, S.B.; Perez-Sotelo, D.; Alonso, J.; Castro, A.I.; Baamonde, I.; Baltar, J.; Casanueva, F.F.; Pardo, M. CILAIR-Based Secretome Analysis of Obese Visceral and Subcutaneous Adipose Tissues Reveals Distinctive ECM Remodeling and Inflammation Mediators. Sci. Rep. 2015, 5, 12214. [Google Scholar] [CrossRef] [Green Version]
- Pardo, M.; Roca-Rivada, A.; Seoane, L.M.; Casanueva, F.F. Obesidomics: Contribution of adipose tissue secretome analysis to obesity research. Endocrine 2012, 41, 374–383. [Google Scholar] [CrossRef]
- Roca-Rivada, A.; Alonso, J.; Al-Massadi, O.; Castelao, C.; Peinado, J.R.; Seoane, L.M.; Casanueva, F.F.; Pardo, M. Secretome analysis of rat adipose tissues shows location-specific roles for each depot type. J. Proteom. 2011, 74, 1068–1079. [Google Scholar] [CrossRef]
- Sano, S.; Izumi, Y.; Yamaguchi, T.; Yamazaki, T.; Tanaka, M.; Shiota, M.; Osada-Oka, M.; Nakamura, Y.; Wei, M.; Wanibuchi, H.; et al. Lipid synthesis is promoted by hypoxic adipocyte-derived exosomes in 3T3-L1 cells. Biochem. Biophys. Res. Commun. 2014, 445, 327–333. [Google Scholar] [CrossRef] [PubMed]
- Lee, M.W.; Lee, M.; Oh, K.J. Adipose Tissue-Derived Signatures for Obesity and Type 2 Diabetes: Adipokines, Batokines and MicroRNAs. J. Clin. Med. 2019, 8, 854. [Google Scholar] [CrossRef] [PubMed]
- GeneCards. Available online: https://www.genecards.org/ (accessed on 19 August 2019).
- UniProt. Available online: https://www.uniprot.org/ (accessed on 19 August 2019).
- PubMed. Available online: https://0-www-ncbi-nlm-nih-gov.brum.beds.ac.uk/pubmed/ (accessed on 19 August 2019).
- Nielsen, H. Predicting Secretory Proteins with SignalP. Methods Mol. Biol. 2017, 1611, 59–73. [Google Scholar] [CrossRef] [Green Version]
- Bendtsen, J.D.; Jensen, L.J.; Blom, N.; Von Heijne, G.; Brunak, S. Feature-based prediction of non-classical and leaderless protein secretion. Protein Eng. Des. Sel. 2004, 17, 349–356. [Google Scholar] [CrossRef] [PubMed] [Green Version]
- Nielsen, H.; Petsalaki, E.I.; Zhao, L.; Stuhler, K. Predicting eukaryotic protein secretion without signals. Biochim. Biophys. Acta Proteins Proteom. 2018. [Google Scholar] [CrossRef] [PubMed]
- Armenteros, J.J.A.; Sonderby, C.K.; Sonderby, S.K.; Nielsen, H.; Winther, O. DeepLoc: Prediction of protein subcellular localization using deep learning. Bioinformatics 2017, 33, 3387–3395. [Google Scholar] [CrossRef] [PubMed]
- Rodriguez-Manzaneque, J.C.; Westling, J.; Thai, S.N.M.; Luque, A.; Knauper, V.; Murphy, G.; Sandy, J.D.; Iruela-Arispe, M. ADAMTS1 cleaves aggrecan at multiple sites and is differentially inhibited by metalloproteinase inhibitors. Biochem. Biophys. Res. Commun. 2002, 293, 501–508. [Google Scholar] [CrossRef]
- Roumans, N.J.T.; Wang, P.; Vink, R.G.; van Baak, M.A.; Mariman, E.C.M. Combined Analysis of Stress- and ECM-Related Genes in Their Effect on Weight Regain. Obesity 2018, 26, 492–498. [Google Scholar] [CrossRef] [PubMed] [Green Version]
- Moreno-Navarrete, J.M.; Fernandez-Real, J.M. The complement system is dysfunctional in metabolic disease: Evidences in plasma and adipose tissue from obese and insulin resistant subjects. Semin. Cell Dev. Biol. 2019, 85, 164–172. [Google Scholar] [CrossRef]
- Kaye, S.; Lokki, A.I.; Hanttu, A.; Nissila, E.; Heinonen, S.; Hakkarainen, A.; Lundbom, J.; Lundbom, N.; Saarinen, L.; Tynninen, O.; et al. Upregulation of Early and Downregulation of Terminal Pathway Complement Genes in Subcutaneous Adipose Tissue and Adipocytes in Acquired Obesity. Front. Immunol. 2017, 8, 545. [Google Scholar] [CrossRef] [Green Version]
- Van Greevenbroek, M.M.J.; Ghosh, S.; van der Kallen, C.J.H.; Brouwers, M.C.G.J.; Schalkwijk, C.G.; Stehouwer, C.D.A. Up-Regulation of the Complement System in Subcutaneous Adipocytes from Nonobese, Hypertriglyceridemic Subjects Is Associated with Adipocyte Insulin Resistance. J. Clin. Endocr. Metab. 2012, 97, 4742–4752. [Google Scholar] [CrossRef] [PubMed] [Green Version]
- Nilsson, B.; Hamad, O.A.; Ahlstrom, H.; Kullberg, J.; Johansson, L.; Lindhagen, L.; Haenni, A.; Ekdahl, K.N.; Lind, L. C3 and C4 are strongly related to adipose tissue variables and cardiovascular risk factors. Eur. J. Clin. Investig. 2014, 44, 587–596. [Google Scholar] [CrossRef] [PubMed]
- Cianflone, K.; Xia, Z.N.; Chen, L.Y. Critical review of acylation-stimulating protein physiology in humans and rodents. BBA-Biomembr. 2003, 1609, 127–143. [Google Scholar] [CrossRef]
- Cui, W.; Paglialunga, S.; Kalant, D.; Lu, H.; Roy, C.; Laplante, M.; Deshaies, Y.; Cianflone, K. Acylation-stimulating protein/C5L2-neutralizing antibodies alter triglyceride metabolism in vitro and in vivo. Am. J. Physiol.-Endoc. Metab. 2007, 293, E1482–E1491. [Google Scholar] [CrossRef] [PubMed]
- Matsunaga, H.; Iwashita, M.; Shinjo, T.; Yamashita, A.; Tsuruta, M.; Nagasaka, S.; Taniguchi, A.; Fukushima, M.; Watanabe, N.; Nishimura, F. Adipose tissue complement factor B promotes adipocyte maturation. Biochem. Biophys. Res. Commun. 2018, 495, 740–748. [Google Scholar] [CrossRef] [PubMed]
- Coulthard, L.G.; Woodruff, T.M. Is the Complement Activation Product C3a a Proinflammatory Molecule? Re-evaluating the Evidence and the Myth. J. Immunol. 2015, 194, 3542–3548. [Google Scholar] [CrossRef] [PubMed] [Green Version]
- Tschopp, J.; Chonn, A.; Hertig, S.; French, L.E. Clusterin, the Human Apolipoprotein and Complement Inhibitor, Binds to Complement-C7, C8-Beta, and the B-Domain of C9. J. Immunol. 1993, 151, 2159–2165. [Google Scholar] [PubMed]
- Roumans, N.J.; Vink, R.G.; Fazelzadeh, P.; van Baak, M.A.; Mariman, E.C. A role for leukocyte integrins and extracellular matrix remodeling of adipose tissue in the risk of weight regain after weight loss. Am. J. Clin. Nutr. 2017, 105, 1054–1062. [Google Scholar] [CrossRef] [PubMed] [Green Version]
- Fonovic, M.; Turk, B. Cysteine cathepsins and extracellular matrix degradation. BBA-Gen. Subj. 2014, 1840, 2560–2570. [Google Scholar] [CrossRef] [PubMed]
- Vidak, E.; Javorsek, U.; Vizovisek, M.; Turk, B. Cysteine Cathepsins and Their Extracellular Roles: Shaping the Microenvironment. Cells 2019, 8. [Google Scholar] [CrossRef]
- Vizovisek, M.; Fonovic, M.; Turk, B. Cysteine cathepsins in extracellular matrix remodeling: Extracellular matrix degradation and beyond. Matrix Biol. 2019, 75–76, 141–159. [Google Scholar] [CrossRef] [PubMed]
- Kramer, L.; Turk, D.; Turk, B. The Future of Cysteine Cathepsins in Disease Management. Trends Pharm. Sci. 2017, 38, 873–898. [Google Scholar] [CrossRef] [PubMed]
- Chen, L.L.; Bin, L.; Yang, Y.H.; Zhang, W.W.; Wang, X.C.; Zhou, H.G.; Wen, J.; Yang, Z.; Hu, R.M. Elevated circulating cathepsin S levels are associated with metabolic syndrome in overweight and obese individuals. Diabetes-Metab. Res. 2019, 35. [Google Scholar] [CrossRef] [PubMed]
- Hinek, A.; Pshezhetsky, A.V.; von Itzstein, M.; Starcher, B. Lysosomal sialidase (neuraminidase-1) is targeted to the cell surface in a multiprotein complex that facilitates elastic fiber assembly. J. Biol. Chem. 2006, 281, 3698–3710. [Google Scholar] [CrossRef] [PubMed]
- Pshezhetsky, A.V.; Hinek, A. Serine Carboxypeptidases in Regulation of Vasoconstriction and Elastogenesis. Trends Cardiovas. Med. 2009, 19, 11–17. [Google Scholar] [CrossRef]
- Yang, M.; Zhang, Y.; Pan, J.; Sun, J.; Liu, J.; Libby, P.; Sukhova, G.K.; Doria, A.; Katunuma, N.; Peroni, O.D.; et al. Cathepsin L activity controls adipogenesis and glucose tolerance. Nat. Cell Biol. 2007, 9, 970–977. [Google Scholar] [CrossRef]
- Lafarge, J.C.; Naour, N.; Clement, K.; Guerre-Millo, M. Cathepsins and cystatin C in atherosclerosis and obesity. Biochimie 2010, 92, 1580–1586. [Google Scholar] [CrossRef]
- Naour, N.; Rouault, C.; Fellahi, S.; Lavoie, M.E.; Poitou, C.; Keophiphath, M.; Eberle, D.; Shoelson, S.; Rizkalla, S.; Bastard, J.P.; et al. Cathepsins in Human Obesity: Changes in Energy Balance Predominantly Affect Cathepsin S in Adipose Tissue and in Circulation. J. Clin. Endocr. Metab. 2010, 95, 1861–1868. [Google Scholar] [CrossRef] [Green Version]
- Larsson, A.; Svensson, M.B.; Ronquist, G.; Akerfeldt, T. Life Style Intervention in Moderately Overweight Individuals Is Associated with Decreased Levels of Cathepsins L and S in Plasma. Ann. Clin. Lab. Sci. 2014, 44, 283–285. [Google Scholar]
- O’Brien, R.J.; Wong, P.C. Amyloid Precursor Protein Processing and Alzheimer’s Disease. Annu. Rev. Neurosci. 2011, 34, 185–204. [Google Scholar] [CrossRef]
- Xu, S.Y.; Jiang, J.; Pan, A.; Yan, C.; Yan, X.X. Sortilin: A new player in dementia and Alzheimer-type neuropathology. Biochem. Cell Biol. 2018, 96, 491–497. [Google Scholar] [CrossRef] [PubMed]
- Unno, K.; Konishi, T. Preventive Effect of Soybean on Brain Aging and Amyloid-beta Accumulation: Comprehensive Analysis of Brain Gene Expression. Recent Pat. Food Nutr. Agric. 2015, 7, 83–91. [Google Scholar] [CrossRef] [PubMed]
- Sanfilippo, C.; Malaguarnera, L.; Di Rosa, M. Chitinase expression in Alzheimer’s disease and non-demented brains regions. J. Neurol. Sci. 2016, 369, 242–249. [Google Scholar] [CrossRef] [PubMed]
- Yeo, C.R.; Agrawal, M.; Hoon, S.; Shabbir, A.; Shrivastava, M.K.; Huang, S.; Khoo, C.M.; Chhay, V.; Yassin, M.S.; Tai, E.S.; et al. SGBS cells as a model of human adipocyte browning: A comprehensive comparative study with primary human white subcutaneous adipocytes. Sci. Rep. 2017, 7, 4031. [Google Scholar] [CrossRef] [PubMed]
- Aebersold, R.; Burlingame, A.L.; Bradshaw, R.A. Western blots versus selected reaction monitoring assays: Time to turn the tables? Mol. Cell Proteom. 2013, 12, 2381–2382. [Google Scholar] [CrossRef] [PubMed]
- Bults, P.; van de Merbel, N.C.; Bischoff, R. Quantification of biopharmaceuticals and biomarkers in complex biological matrices: A comparison of liquid chromatography coupled to tandem mass spectrometry and ligand binding assays. Expert Rev. Proteom. 2015, 12, 355–374. [Google Scholar] [CrossRef] [PubMed]
- Wisniewski, J.R.; Zougman, A.; Nagaraj, N.; Mann, M. Universal sample preparation method for proteome analysis. Nat. Methods 2009, 6, 359–362. [Google Scholar] [CrossRef] [PubMed]
- UniProt Human Database. Available online: https://www.uniprotKB.org/uniprot/Swiss-Prot/Homo sapiens(Human)/ (accessed on 19 August 2019).
- Petersen, T.N.; Brunak, S.; von Heijne, G.; Nielsen, H. SignalP 4.0: Discriminating signal peptides from transmembrane regions. Nat. Methods 2011, 8, 785–786. [Google Scholar] [CrossRef] [PubMed]
- Karpievitch, Y.V.; Dabney, A.R.; Smith, R.D. Normalization and missing value imputation for label-free LC-MS analysis. BMC Bioinform. 2012, 13, S5. [Google Scholar] [CrossRef] [PubMed]


| Order | Reference | Refs | Source | Secreted | Novel |
|---|---|---|---|---|---|
| 1 | Wang et al. (2004) | [18] | Mice (3T3L1 cells) | 26 | 15 |
| 2 | Chen et al. (2005) | [19] | Rat fat pad | 84 | 53 |
| 3 | Molina et al. (2009) | [20] | Mice (3T3L1 cells) | 147 | NA |
| 4 | Celis et al. (2005) | [21] | Human adipocytes | 359 | NA |
| 5 | Mutch et al. (2009) | [22] | Human primary preadipocytes | 213 | NA |
| 6 | Alvarez-Llamas et al. (2007) | [23] | Human visceral fat tissue | 108 | 68 |
| 7 | Zvonic et al. (2007) | [24] | Human adipose-derived stem cells | 101 | NA |
| 8 | Lim J.M. et al. (2008) | [31] | 3T3L1 cell line; primary rat adipocytes | 97; 203 | 54; 132 |
| 9 | Roelofsen H et al. (2009) | [32] | Human omental tissue (control; test) | 155; 141 | NA |
| 10 | Kim et al. (2010) | [25] | Human subcutaneous adipose tissue | 307 | NA |
| 11 | Rosenow et al. (2010) | [3] | Human SGBS cells | 80 | 6 |
| 12 | Zhong et al. (2010) | [26] | Human adipocytes | 420 | 107 |
| 13 | Lee M.J. et al. (2010) | [27] | Human adipose tissue derived stem cells | 142 | NA |
| 14 | Rosenow A. et al. (2012) | [16] | Human SGBS cells | 40 | 2 |
| 15 | Lehr S. et al. (2012) | [28] | Human primary adipocytes | 263 | 44 |
| 16 | Roca-Rivada A. et al. (2011) | [40] | Rats (visceral; subcutaneous; gonadal fat) | 188; 85; 91 | NA |
| 17 | Sano S. et al. (2014) | [41] | Mice (3T3L1 cells) | 231 | NA |
| 18 | Roca-Rivada A. et al. (2015) | [38] | Human adipose tissue (visceral; subcutaneous) | 136; 64 | NA |
| 19 | Hartwig S. et al. (2018) | [36] | Human adipocytes | 884 | 67 |
| 20 | Laria A.E. et al. (2018) | [37] | Mice (3T3L1 cells) | 839 | 80 |
| 21 | Renes J. et al. (2014) | [8] | Human SGBS cells | 57 | 6 |
| 22 | Li Z.Y. et al. (2014) | [29] | Human SAT/ VAT | NA | 1 |
| 23 | Ojima K et al. (2016) | [34] | Mice (3T3L1 cells) | 74 | NA |
| 24 | Ali Khan et al. (2018) | [30] | Mice primary adipocytes | 499 | NA |
| 25 | Mariman et al. (2010) | [33] | (Review)_Human and rodent adipocytes | NA | NA |
| 26 | Lehr S; et al. (2012) | [2] | (Review)_Human adipocytes | 928 | NA |
| 27 | Renes J. et al. (2013) | [35] | (Review)_Human and rodent adipocytes | NA | NA |
| 28 | Pardo M. et al. (2012) | [39] | (Review)_Human and rat adipocytes | NA | NA |
| 29 | Lee M.W. et al. (2019) | [42] | (Review)_Human and rat adipocytes | NA | NA |
| Order | S or D | UniProt | Gene Symbol | Protein Name |
|---|---|---|---|---|
| 1 | S | O00763 | ACACB | Acetyl-CoA carboxylase 2 |
| 2 | S + D | P04745 | AMY1A | Amylase, Alpha 1A (Salivary) |
| 3 | S | O43570 | CA12 | Carbonic anhydrase 12 |
| 4 | S | P55287 | CDH11 | Cadherin-11 |
| 5 | S | P19022 | CDH2 | Cadherin-2 |
| 6 | S + D | Q9BWS9 | CHID1 | Chitinase domain-containing protein 1 |
| 7 | S | P26992 | CNTFR | Ciliary neurotrophic factor receptor subunit alpha |
| 8 | S + D | Q9UI42 | CPA4 | Carboxypeptidase A4 |
| 9 | S + D | O75629 | CREG1 | Protein CREG1 |
| 10 | S + D | O00602 | FCN1 | Ficolin-1 |
| 11 | S | Q10471 | GALNT2 | Polypeptide N-acetylgalactosaminyltransferase 2 |
| 12 | S | P23434 | GCSH | Glycine cleavage system H protein, mitochondrial |
| 13 | S + D | P06280 | GLA | Alpha-galactosidase A |
| 14 | S + D | Q9UJJ9 | GNPTG | N-acetylglucosamine-1-phosphotransferase subunit gamma |
| 15 | S | O75487 | GPC4 | Glypican-4 |
| 16 | S + D | P35475 | IDUA | Alpha-L-iduronidase |
| 17 | S + D | P08476 | INHBA | Inhibin beta A chain |
| 18 | S + D | Q96I82 | KAZALD1 | Kazal-type serine protease inhibitor domain-containing protein 1 |
| 19 | S | Q6GTX8 | LAIR1 | Leukocyte-associated immunoglobulin-like receptor 1 |
| 20 | S | P38571 | LIPA | Lysosomal acid lipase/cholesteryl ester hydrolase |
| 21 | S | O75197 | LRP5 | Low-density lipoprotein receptor-related protein 5 |
| 22 | S | Q8ND94 | LRRN4CL | LRRN4 C-terminal-like protein |
| 23 | S | Q5JRA6 | MIA3 | Transport and Golgi organization protein 1 homolog |
| 24 | S + D | P22894 | MMP8 | Neutrophil collagenase |
| 25 | D | P13640 | MT1G | Metallothionein-1G |
| 26 | S + D | P41271 | NBL1 | Neuroblastoma suppressor of tumorigenicity 1 |
| 27 | S | Q04721 | NOTCH2 | Neurogenic locus notch homolog protein 2 |
| 28 | S + D | P48745 | NOV | Protein NOV homolog |
| 29 | S + D | O95897 | OLFM2 | Noelin-2 |
| 30 | S + D | Q8NBP7 | PCSK9 | Proprotein convertase subtilisin/kexin type 9 |
| 31 | S | P50897 | PPT1 | Palmitoyl-protein thioesterase 1 |
| 32 | S + D | P42785 | PRCP | Lysosomal Pro-X carboxypeptidase |
| 33 | S + D | P07477 | PRSS1 | Trypsin-1 |
| 34 | D | Q92530 | PSMF1 | Proteasome inhibitor subunit 1 |
| 35 | S | P10586 | PTPRF | Receptor-type tyrosine-protein phosphatase F |
| 36 | S | Q15274 | QPRT | Nicotinate-nucleotide pyrophosphorylase [carboxylating] |
| 37 | S | Q6NUM9 | RETSAT | All-trans-retinol 13,14-reductase |
| 38 | S + D | O00584 | RNASET2 | Ribonuclease T2 |
| 39 | S | Q9H173 | SIL1 | Nucleotide exchange factor SIL1 |
| 40 | S | Q99523 | SORT1 | Sortilin |
| 41 | D | Q9BYE4 | SPRR2G | Small proline-rich protein 2G |
| 42 | S + D | P10124 | SRGN | Serglycin |
| 43 | S + D | A1L4H1 | SSC5D | Soluble scavenger receptor cysteine-rich domain-containing protein SSC5D |
| 44 | S | Q8NBK3 | SUMF1 | Sulfatase-modifying factor 1 |
| 45 | S | Q8NBJ7 | SUMF2 | Sulfatase-modifying factor 2 |
| 46 | S | Q5HYA8 | TMEM67 | Meckelin |
| 47 | S + D | Q8WUA8 | TSKU | Tsukushin |
| 48 | S | Q06418 | TYRO3 | Tyrosine-protein kinase receptor TYRO3 |
| 49 | S | P98155 | VLDLR | Very low-density lipoprotein receptor |
| Order | Category | Gene Symbol | Accession | Description | T18-T22RF | |
|---|---|---|---|---|---|---|
| FC_(GR+RF)/NF | p Value | |||||
| 1 | Actin filaments | GSN | P06396 | Gelsolin | −1.73 | 0.007 |
| 2 | Complement factors | C1Q | Q07021 | Complement 1q subcomponent | −2.94 | 0.030 |
| 3 | C4B | P0C0L5 | Complement C4-B | 2.85 | 0.002 | |
| 4 | CFB | P00751 | Complement factor B | 4.06 | 0.018 | |
| 5 | CFD | P00746 | Complement factor D | −1.93 | 0.002 | |
| 6 | ECM and cell adhesion | CDH13 | P55290 | Cadherin-13 | −2.06 | 0.044 |
| 7 | COL15A1 | P39059 | Collagen alpha-1(XV) chain | 1.83 | 0.012 | |
| 8 | COL5A3 | P25940 | Collagen alpha-3(V) chain | −1.69 | 0.047 | |
| 9 | LUM | P51884 | Lumican | −1.48 | 0.025 | |
| 10 | MCAM | P43121 | Cell surface glycoprotein MUC18 | −1.91 | 0.028 | |
| 11 | NRCAM | Q92823 | Neuronal cell adhesion molecule | −2.39 | 0.046 | |
| 12 | SERPINE2 | P07093 | Glia-derived nexin | 1.58 | 0.020 | |
| 13 | ECM modification | ADAMTSL1 | Q8N6G6 | ADAMTS-like protein 1 | 9.57 | 0.006 |
| 14 | MMP2 | P08253 | 72 kDa type IV collagenase | 1.48 | 0.010 | |
| 15 | MMP8 | P22894 | Neutrophil collagenase | 3.72 | 0.001 | |
| 16 | P4HA1 | P13674 | Prolyl 4-hydroxylase subunit alpha-1 | −1.80 | 0.004 | |
| 17 | PPIC | P45877 | Peptidyl-prolyl cis-trans isomerase C | −1.47 | 0.012 | |
| 18 | SERPINH1 | P50454 | Serpin H1 | −2.19 | 0.001 | |
| 19 | ER-based | CALU | O43852 | Calumenin | −2.36 | 0.002 |
| 20 | HYOU1 | Q9Y4L1 | Hypoxia up-regulated protein 1 | 1.78 | 0.009 | |
| 21 | RCN1 | Q15293 | Reticulocalbin-1 | −2.23 | 0.002 | |
| 22 | TXNDC5 | Q8NBS9 | Thioredoxin domain-containing protein 5 | −1.39 | 0.024 | |
| 23 | Lipid metabolism | ACACB | O00763 | Acetyl-CoA carboxylase 2 | −1.90 | 0.044 |
| 24 | AZGP1 | P25311 | Zinc-alpha-2-glycoprotein | 1.59 | 0.041 | |
| 25 | PCSK9 | Q8NBP7 | Proprotein convertase subtilisin/kexin type 9 | −1.90 | 0.003 | |
| 26 | PTGDS | P41222 | Prostaglandin-H2 D-isomerase | 3.67 | 0.000 | |
| 27 | Lysosome-based | CTSA | P10619 | Lysosomal protective protein | 2.75 | 0.009 |
| 28 | CTSL | P07711 | Cathepsin L1 | 1.24 | 0.029 | |
| 29 | DNASE2 | O00115 | Deoxyribonuclease-2-alpha | 2.97 | 0.033 | |
| 30 | SORT1 | Q99523 | Sortilin | −5.13 | 0.005 | |
| 31 | Tissue homeostasis | ABI3BP | Q7Z7G0 | Target of Nesh-SH3 | 5.71 | 0.008 |
| 32 | GRN | P28799 | Granulins | 1.73 | 0.008 | |
| 33 | MYDGF | Q969H8 | Myeloid-derived growth factor | −1.93 | 0.046 | |
| 34 | NRP1 | O14786 | Neuropilin-1 | 1.74 | 0.029 | |
| 35 | RBP4 | P02753 | Retinol-binding protein 4 | −1.91 | 0.011 | |
| 36 | Remaining | APP | P05067 | Amyloid-beta A4 protein | −1.44 | 0.033 |
| 37 | CES1 | P23141 | Liver carboxylesterase 1 | 4.05 | 0.008 | |
| 38 | CHI3L2 | Q15782 | Chitinase-3-like protein 2 | 3.43 | 0.005 | |
| 39 | DMKN | Q6E0U4 | Dermokine | −5.40 | 0.000 | |
| Order | UniProt | Gene Symbol | Description | Category | FC | p Value |
|---|---|---|---|---|---|---|
| 1 | P00736 | C1R | Complement C1r subcomponent | Complement factor | −1.00 | 0.716 |
| 2 | Q07021 | C1Q | Complement C1q subcomponent | Complement factor | −2.96 | 0.011 |
| 3 | P09871 | C1S | Complement C1s subcomponent | Complement factor | −1.53 | 0.131 |
| 4 | P01024 | C3 | Complement C3 | Complement factor | −1.03 | 0.840 |
| 5 | P0C0L5 | C4B | Complement C4-B | Complement factor | 2.85 | 0.002 |
| 6 | P00751 | CFB | Complement factor B | Complement factor | 4.06 | 0.018 |
| 7 | P00746 | CFD | Complement factor D | Complement factor | −1.93 | 0.002 |
| 8 | P08603 | CFH | Complement factor H | Complement factor | −1.15 | 0.277 |
| 9 | P13987 | CD59 | CD59 glycoprotein | Complement factor | 1.10 | 0.634 |
| 10 | O00602 | FCN1 | Ficolin-1 | Complement factor | −4.42 | 0.578 |
| 11 | P05155 | SERPING1 | Plasma protease C1 inhibitor | Complement factor | −1.83 | 0.190 |
| 12 | P48740 | MASP1 | Mannan-binding lectin serine protease 1 | Complement factor | 2.33 | 0.196 |
| 1 | P10619 | CTSA | Cathepsin A | Lysosome-based | 2.75 | 0.009 |
| 2 | P07858 | CTSB | Cathepsin B | Lysosome-based | 1.19 | 0.097 |
| 3 | P07339 | CTSD | Cathepsin D | Lysosome-based | 1.16 | 0.309 |
| 4 | Q9UBX1 | CTSF | Cathepsin F | Lysosome-based | 1.33 | 0.239 |
| 5 | P43235 | CTSK | Cathepsin K | Lysosome-based | 1.45 | NA |
| 6 | P07711 | CTSL | Cathepsin L1 | Lysosome-based | 1.24 | 0.029 |
| 7 | Q9UBR2 | CTSZ | Cathepsin Z | Lysosome-based | 1.08 | 0.466 |
© 2019 by the authors. Licensee MDPI, Basel, Switzerland. This article is an open access article distributed under the terms and conditions of the Creative Commons Attribution (CC BY) license (http://creativecommons.org/licenses/by/4.0/).
Share and Cite
Qiao, Q.; Bouwman, F.G.; Baak, M.A.v.; Renes, J.; Mariman, E.C.M. Glucose Restriction Plus Refeeding in Vitro Induce Changes of the Human Adipocyte Secretome with an Impact on Complement Factors and Cathepsins. Int. J. Mol. Sci. 2019, 20, 4055. https://0-doi-org.brum.beds.ac.uk/10.3390/ijms20164055
Qiao Q, Bouwman FG, Baak MAv, Renes J, Mariman ECM. Glucose Restriction Plus Refeeding in Vitro Induce Changes of the Human Adipocyte Secretome with an Impact on Complement Factors and Cathepsins. International Journal of Molecular Sciences. 2019; 20(16):4055. https://0-doi-org.brum.beds.ac.uk/10.3390/ijms20164055
Chicago/Turabian StyleQiao, Qi, Freek G. Bouwman, Marleen A. van Baak, Johan Renes, and Edwin C.M. Mariman. 2019. "Glucose Restriction Plus Refeeding in Vitro Induce Changes of the Human Adipocyte Secretome with an Impact on Complement Factors and Cathepsins" International Journal of Molecular Sciences 20, no. 16: 4055. https://0-doi-org.brum.beds.ac.uk/10.3390/ijms20164055