MicroRNA Assisted Gene Regulation in Colorectal Cancer


Department of Biotechnology, Faculty of Natural Sciences, University of the Western Cape, Private Bag X17, Bellville, 7535 Cape Town, South Africa
*
Author to whom correspondence should be addressed.
Int. J. Mol. Sci. 2019, 20(19), 4899; https://0-doi-org.brum.beds.ac.uk/10.3390/ijms20194899
Submission received: 3 August 2019
/
Revised: 25 August 2019
/
Accepted: 29 August 2019
/
Published: 3 October 2019
(This article belongs to the Special Issue Noncoding RNAs in Cancer: From Cancer Stem Cells to Invasion and Metastases)
Abstract
:Colorectal cancer (CRC) is the second-leading cause of cancer death and a major public health problem. Nearly 80% CRC cases are diagnosed after the disease have metastasized and are often too advanced for treatment. Small non-coding RNA guides argonaute protein to their specific target for regulation as the sole of RNA induced silencing complex for gene silencing. These non-coding RNA for example microRNA, are thought to play a key role in affecting the efficiency of gene regulation in cancer, especially CRC. Understanding the mechanism at the molecular level could lead to improved diagnosis, treatment, and management decisions for CRC. The study aimed to predict the molecular mechanism of gene regulation based microRNA-mRNA duplex as a lead in the silencing mechanism. Five candidate microRNAs were identified through the in silico approach. The MicroRNA target prediction and subsequent correlation, and prioritization were performed using miRTarBase, gbCRC and CoReCG, and DAVID databases respectively. Protein selection and preparation were carried out using PDB and Schrödinger suits. The molecular docking analysis was performed using PATCHDOCK webserver and visualized by discovery studio visualizer. The results of the study reveal that the candidate microRNAs have strong binding affinity towards their targets suggesting a crucial factor in the silencing mechanism. Furthermore, the molecular docking of the receptor to both the microRNA and microRNA-mRNA duplex were analyzed computationally to understand their interaction at the molecular level. Conclusively, the study provides an explanation for understanding the microRNAs-based gene regulation (silencing mechanism) in CRC.
1. Introduction
Colorectal cancer (CRC) is considered as one of the most threatening diseases due to its incidence and mortality rate worldwide [1], and the most frequent cancers in western world [2]. Over 1.2 million individuals are diagnosed with this disease yearly, and over 600,000 mortalities are recorded [3]. Although the activation and inactivation of oncogenes and tumor suppressor genes respectively are known to be involved in CRC development at molecular level [4], the molecular mechanisms that lead to the development and progression of CRC remain unclear.
Despite the advances in the diagnosis, treatment, and management of patients with CRC, it is still a major public health problem globally [5]. Therefore, it is imperative to elucidate the mechanism of gene silencing in the tumorigenesis of CRC for better understanding.
The interactions between protein and nucleic acids play essential roles in various cellular and biological processes, including DNA replication, RNA transcription, the translation of polypeptides, RNA splicing, and the degradation of nucleic acids [6,7]. The errors in receptor-nucleic acid interactions are implicated in a number of diseases, ranging from neurological disorders to cancer [8]. RNA binding proteins are mediators of RNA silencing processes, such as pathways in microRNA and RNA interference. Argonaute, a unique member of this family [9], forms the functional core of the RNA induced silencing complex (RISC) in humans [10]. The RISC complexed with AGO employs small molecules, such as microRNA, as a guide for target recognition and silencing through translational repression and/or degradation [11].
MicroRNAs are small non-coding RNAs with 18–22 nucleotide sequences possessing regulatory roles in both plants and animals. These non-coding RNAs are involved in different cellular processes [12,13,14,15,16] including human diseases [17], such as colorectal carcinogenesis [18]. Additionally, experiments revealed that these RNAs can act as oncomiR [19,20] and/or tumor suppressor microRNAs [21] and their differential expression between normal and abnormal tissue have been exploited in the diagnosis, treatment, and management of CRC [22]. The epigenetic regulation of gene expression at a transcriptional or post-transcriptional level is important as a mechanism of gene silencing.
Various experimental approaches [23] have been put forward to study the mechanism by which cancer genes are repressed, inactivated or silenced to prevent carcinogenesis, progression or metastasis of the involved gene. Recently, the microRNA binding proteins became a focal point in cancer research due to their involvement in microRNAs deregulation [24,25]. Argonaute utilizes microRNAs and RNA interference as sequence-specific guides in both transcriptional and posttranscriptional silencing mechanisms [26]. Several roles of AGO have been observed in translational regulation and RNA interference but their functions in human disease remain a top priority. Li, Yu, Gao and Li [23] studied the expression on AGO protein in colon cancer as a potential biomarker, Sun, et al. [27] reported the prognostic expression status of PIWIL1 in CRC and Völler, et al. [28] also studied their expression in cancer entitles. The information for the understanding of these processes is likely to improve as new structures of protein-nucleic acid complexes are solved and the structural details of the interactions are analyzed. However, experimental determination by high-resolution methods is a tedious and difficult process.
Molecular simulation has emerged as an efficient and cost-effective tool in binding analysis from lead identification to optimization and beyond [29]. The process of molecular interaction through a non-covalent bond with high affinity and specificity to form a specific complex is crucial to all processes in living organisms [30]. Protein functions are majorly determined based on their binding interaction with other molecules or ligands [31]. Therefore, understanding protein-ligand interactions are central to understanding molecular biology. Additionally, information regarding the mechanisms of target interaction of protein-ligand binding is also likely to promote the discovery of drugs, a better understanding of gene silencing, the treatment and management efficacy in various diseases, most especially in cancer and the CRC subtype. This study, therefore, insights into an improved understanding at the molecular level the microRNA-assisted target recognition and regulation of argonaute as a therapeutic modality against CRC. Molecular docking approaches of microRNA conformations adopted within the binding pocket of the Argonaute protein could also assist to estimate the residual amino acids, hydrogen bond interactions and binding free energy to provide information crucial to the intermolecular recognition mechanism.
2. Results
2.1. Identification of Candidate MicroRNA and Target Genes
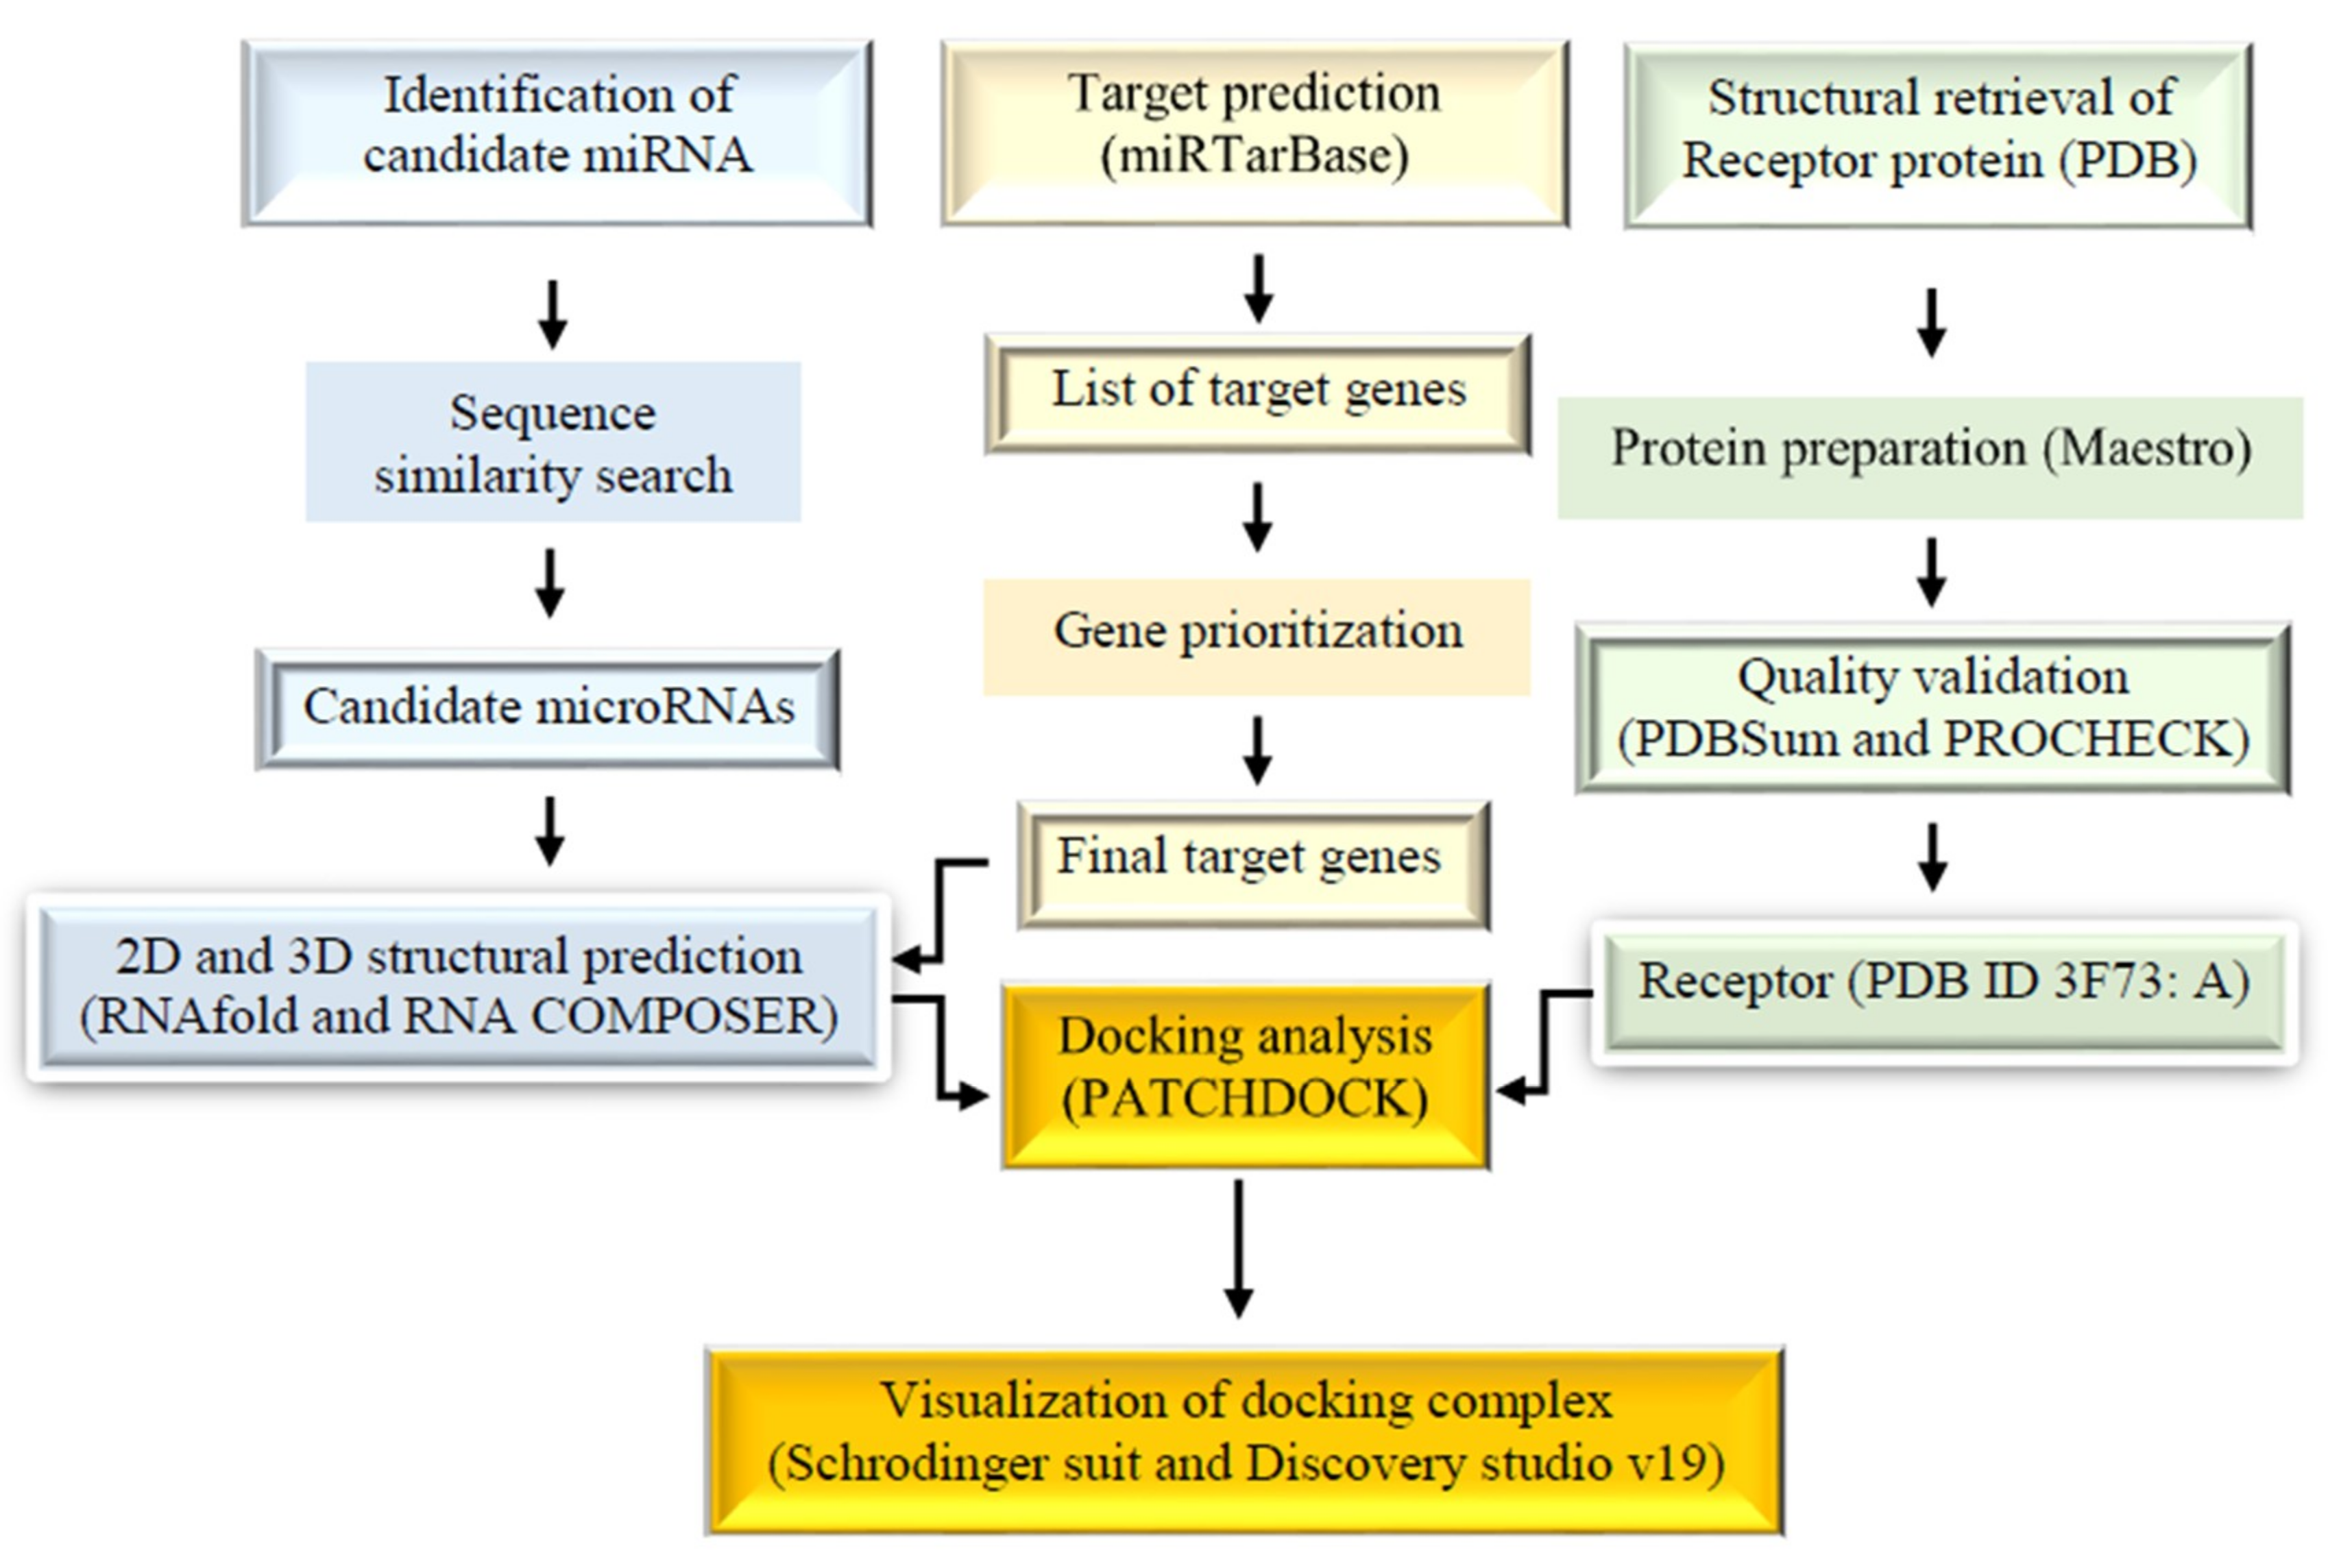
Figure 1 represents the overall methodology employed in this study. The sequence similarity search was employed through the basic local alignment search tool for nucleic acids (BLASTN) and the Homology Detection and Clustering Database at High Identity with Tolerance (CH-HIT-EST-2D) between the total microRNAs from miRBase as reference microRNAs and microRNAs experimentally validated in 4 databases (DbDEMC at http://www.picb.ac.cn/dbDEMC/, miR2Disease at http://www.mir2disease.org/, HMDD at http://www.cuilab.cn/hmdd, and miRCancer at http://mircancer.ecu.edu/) as the query set. With a similarity threshold of 0.90, the result was text-mined to obtain the final list of 5 candidate microRNAs together with their clusters associated with CRC (Table 1). MiRTarBase was used to predict the target genes of these microRNAs. Collectively, 44 genes alongside their minimum free energies (MFE) were identified to target candidate microRNAs after their intersection analysis with two CRC gene databases (CoReCG and gbCRC) (Table 2). The miR-1 targeted 12 genes, miR-2 targeted 10, miR-3 targeted 8, miR-4 targeted 6, and finally, miR-5 was associated with 8 genes. The combined targets were used as inputs in DAVID for the functional annotation as the first phase of gene prioritization. The result showed that 18 target genes were involved in cancer (GAD_DISEASE_CLASS) as shown in Table 3 with the p-value of 1.8E-3 and a Benjamini score of 1.6E-2. To further strengthen the involvement of the microRNAs in CRC and to further prioritize them for the candidate microRNAs, only genes that were enriched in CRC were considered. To finally select the genes of interest for the 5 microRNAs, the biological processes (Figure 2; Table 3), expression profile (Figure 3), MFE, and the number of experimentally validation methods were considered. The final list of microRNAs together with their target genes used for the docking analysis were shown in Table 4.
2.2. MicroRNA Target Genes Associated with CRC and Their MFE (miRTarBase)
The table above (Table 2) showed the target genes of the five microRNAs discovered through a sequence similarity search implicated in CRC. The miRTarBase prediction tool was used to verify the target genes. These target genes have been experimentally validated by one or more of the following validation methods: Reporter assay, western blot, qPCR, microarray, NGS and pSILAC. Each of the genes was also confirmed by their minimum free energy (MFE) in kcal/mol.
2.3. Biological Processes of the MicroRNA Target Genes
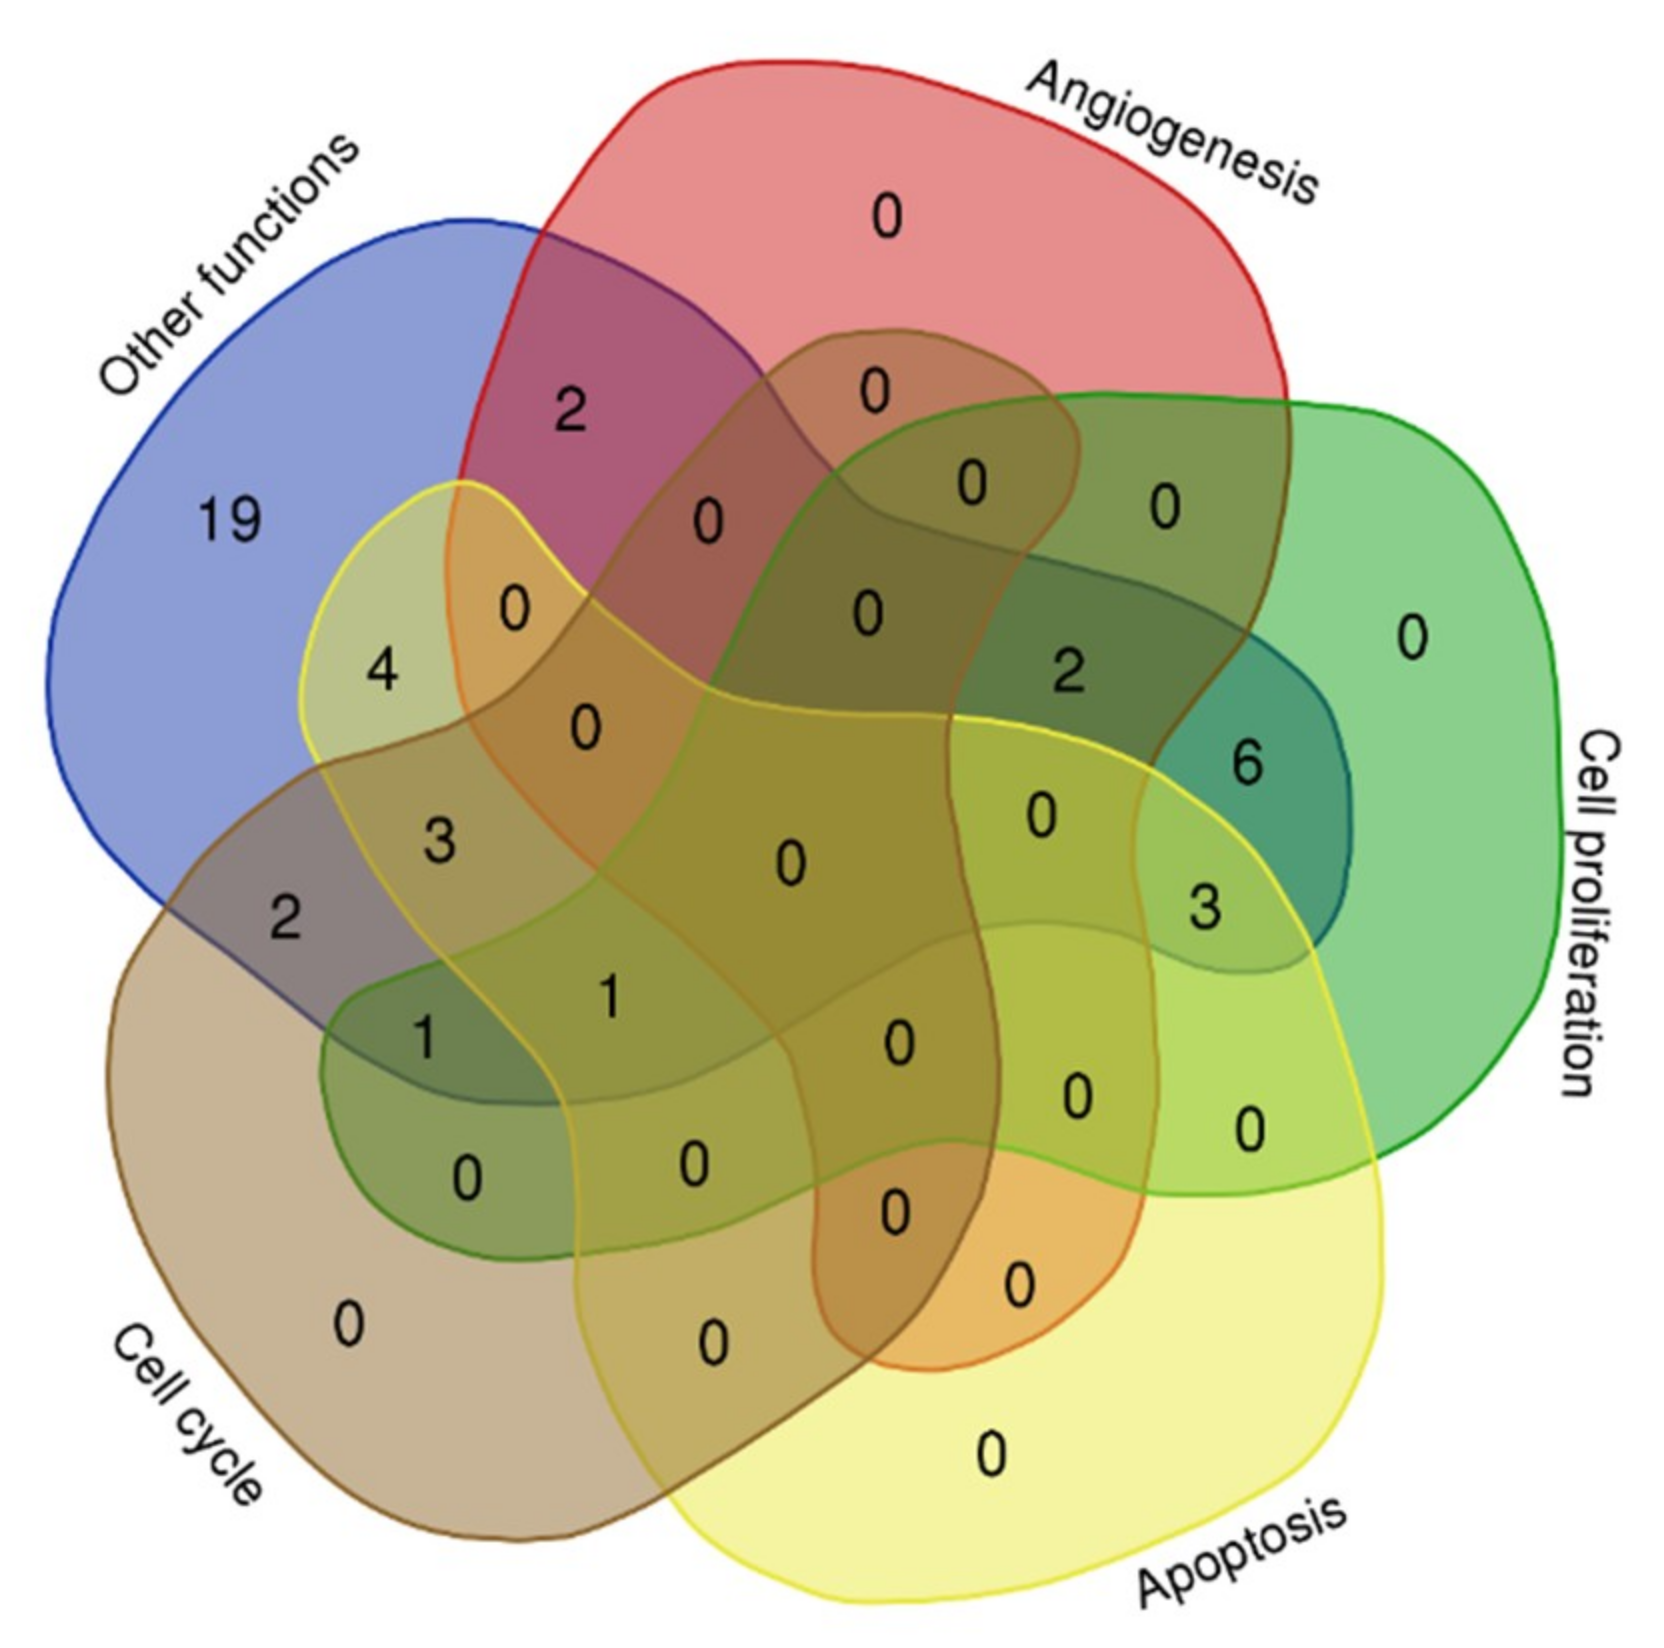
The target genes and their involvement in different biological process plotted using a Venn diagram (http://bioinformatics.psb.ugent.be/webtools/Venn/). The numbers denoted in the plot indicated the number of target genes involved in each of the different biological process (Figure 2).
2.4. Gene Enrichment in Cancer and Their Biological Functions
The involvement of 18 genes from the 44 target genes after gene prioritization through the DAVID database are presented in Table 3 alongside their involvement in different biological functions as reported from UniProt (http://www.uniprot.org/) web server (Table 3).
2.5. Expressions MicroRNA Target Genes Involved in Several Cancer Subtypes
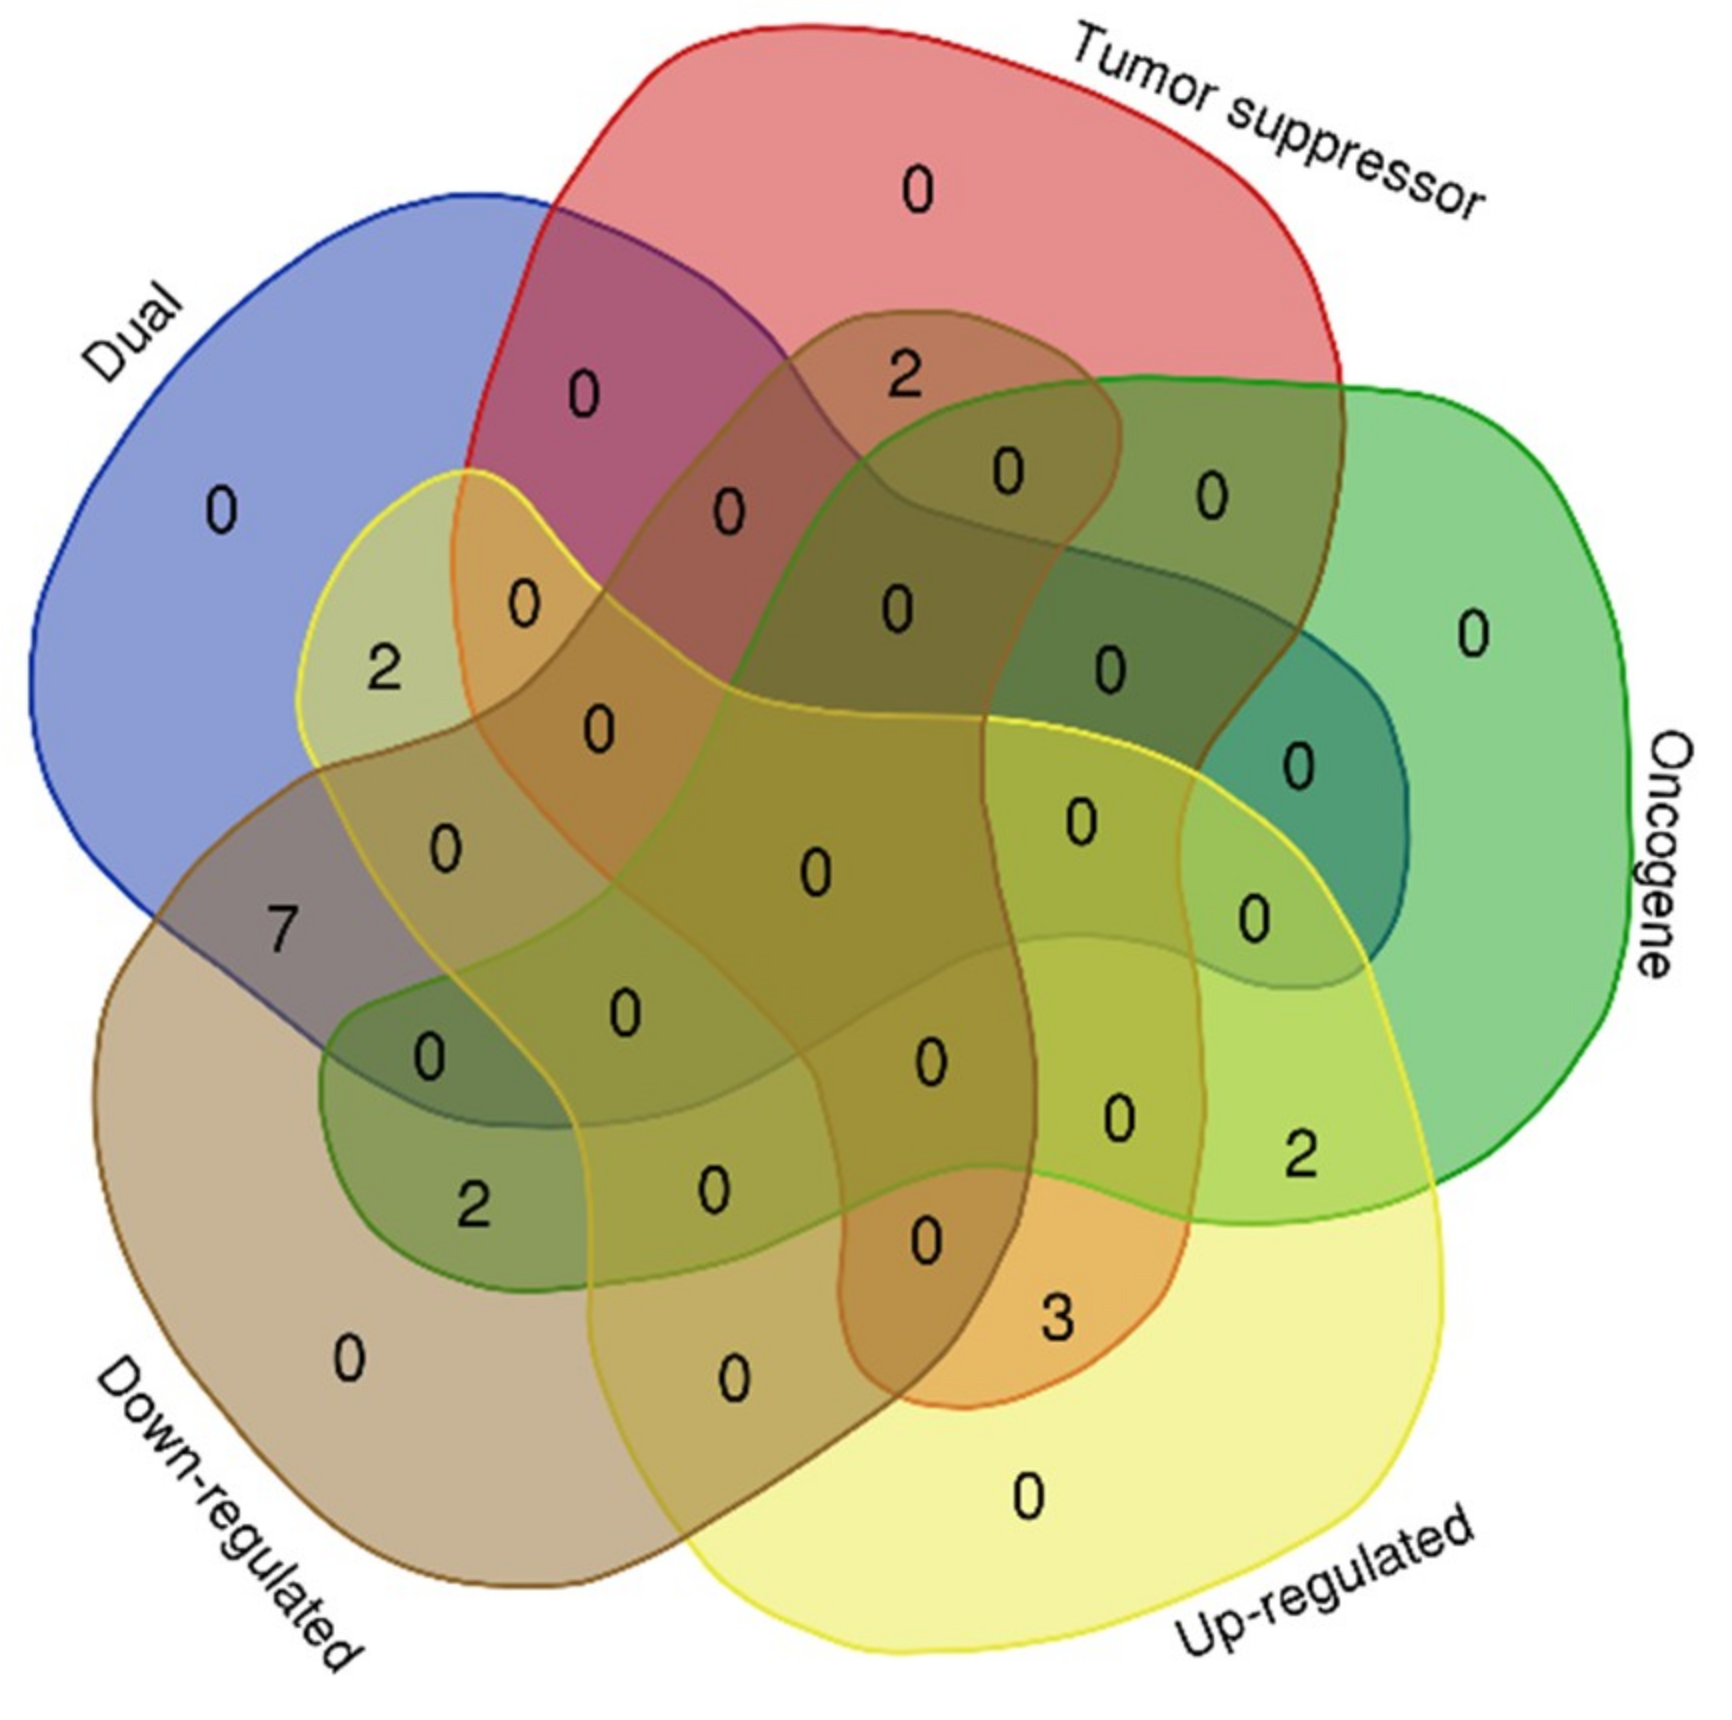
The expression profiles of the 18 genes (Table 3) were considered through an extensive literature search. The result of the search concluded that nine (FGF2, CHEK1, WT1, MDM2, BARD1, BMP2, CHEK4, BAMBI, and SOD2) of the genes have a dual role as oncogene and tumor suppressor genes. FGF2 [32,33] and CHEK4 [34] are up-regulated while the expression of CHEK1 [35,36], WT1 [37], MDM2 [38,39,40,41], BARD1 [42,43,44], BMP2 [45], BAMBI [46], and SOD2 [47,48,49], have been reported to be down-regulated in several cancer subtypes, including CRC. Furthermore, four (BUB1, RAN, REL, and RPS19) of the target genes were strictly oncogenic in nature showing that BUB1 [50,51] and RPS19 [52] were up-regulated and RAN [53], and REL [54] were down-regulated in solid tumors including CRC (Figure 3). The remaining five target genes are tumor suppressive in nature. This shows that XIAP [55] and KMT2A [56,57] were up-regulated while TP53 [58], HOXB13 [59,60], and VHL [61,62] were reportedly downregulated in cancers, including CRC.
2.6. Binding Affinity and Structural Determination of MicroRNA and Duplex
The binding energy (BE in Kcal/mol) and minimum folding energy (MFE in kcal/mol) of the microRNA target genes were exploited with two web-based tools namely, miRTarBase and RNAfold respectively. The secondary structures of the duplexes (microRNA-mRNA) were also revealed through the latter webserver (Table 5). The minimum folding energy of all the duplexes is high enough to be regarded as a good binding affinity between the candidate microRNAs and their targets. Therefore, the target genes have strong binding affinity for their respective microRNAs (miR-1 and HOXB13, miR-2 and mRNA, miR-3 and SOD2, miR-4 and BARD1, miR-5 and TP53). These duplexes were finally subjected to the molecular docking interaction.
2.7. Structural Model of MicroRNA-mRNA Duplexes
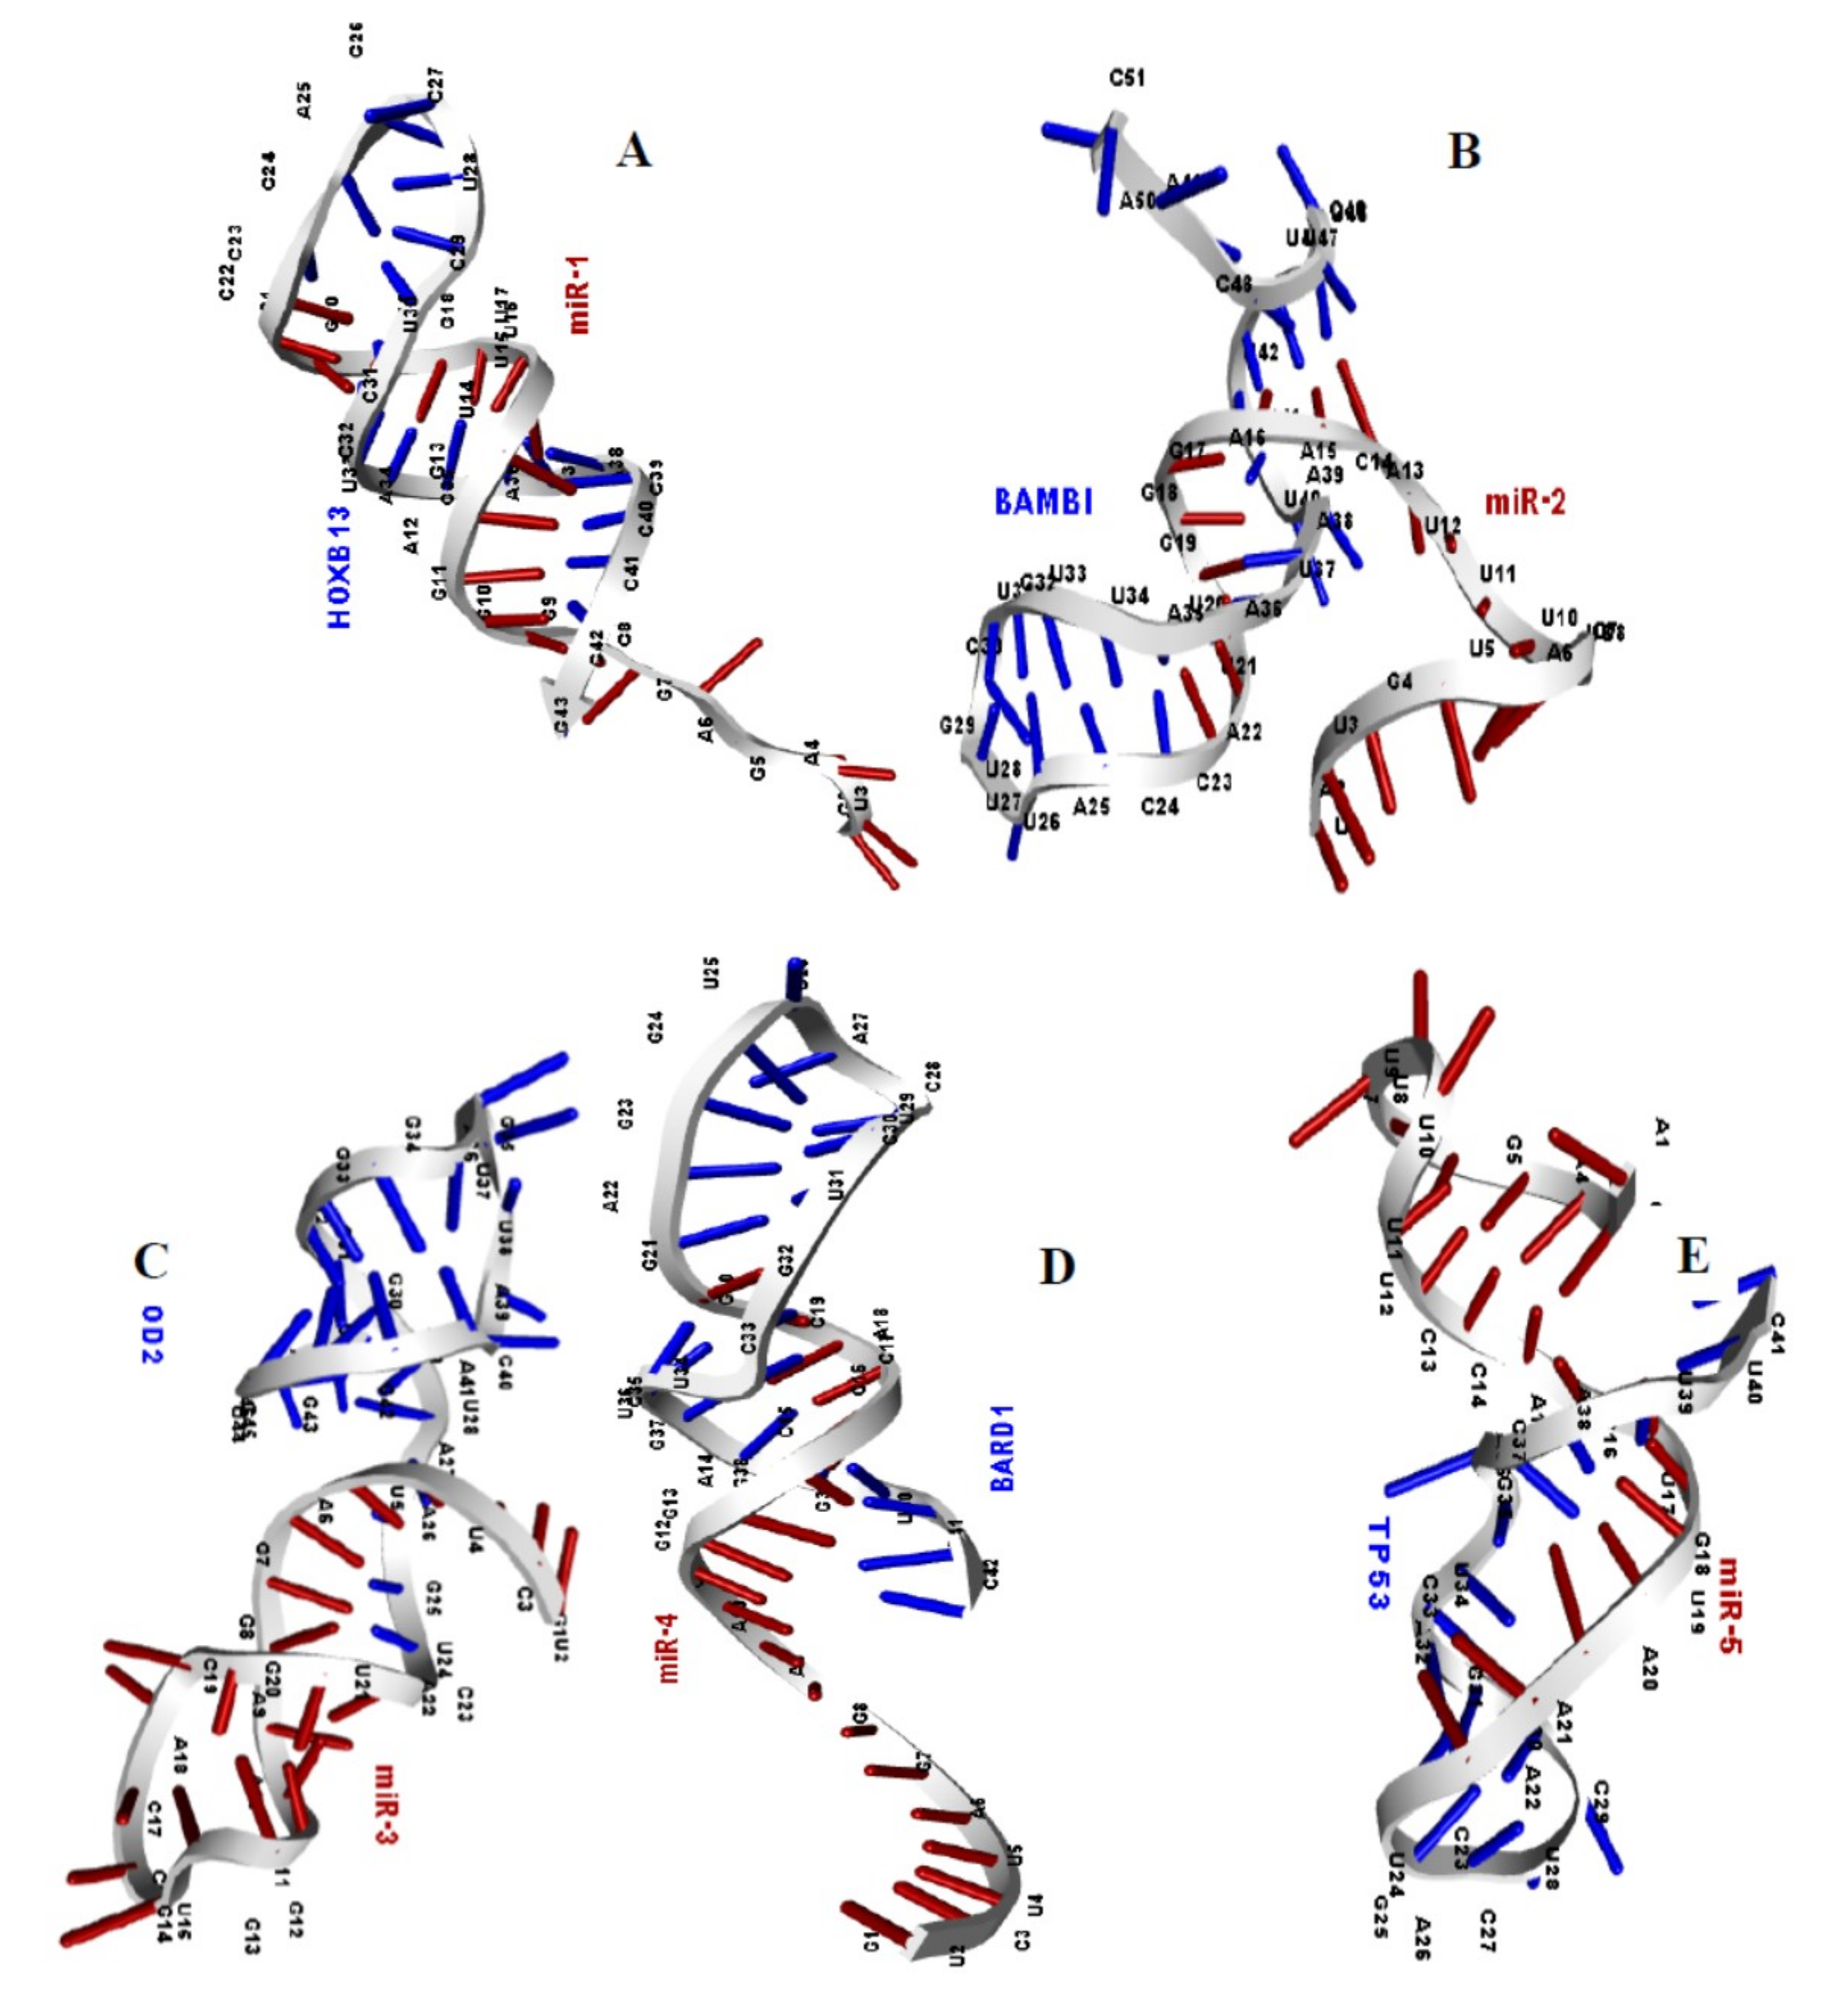
To reveal the three-dimensional structure of the microRNA-mRNA duplexes for the molecular ducking analysis, their binding sequences from the miRTarBase database were used as inputs in the RNAfold web server for a secondary folding pattern and dot-bracket. The secondary structure of the duplexes, their binding energy and the minimum folding energy in kcal/mol are reported in Table 5. The dot-bracket notation generated was also used as inputs in the prediction of the tertiary structure prediction [63] in RNA COMPOSER (Figure 4). The results of Table 5 (binding energies of the duplexes) and Figure 4 (the 3-D structure of the five microRNA-mRNA duplexes) suggested high binding affinity and strong molecular interaction between them.
2.8. Extraction and Preparation of AGO Protein Structure
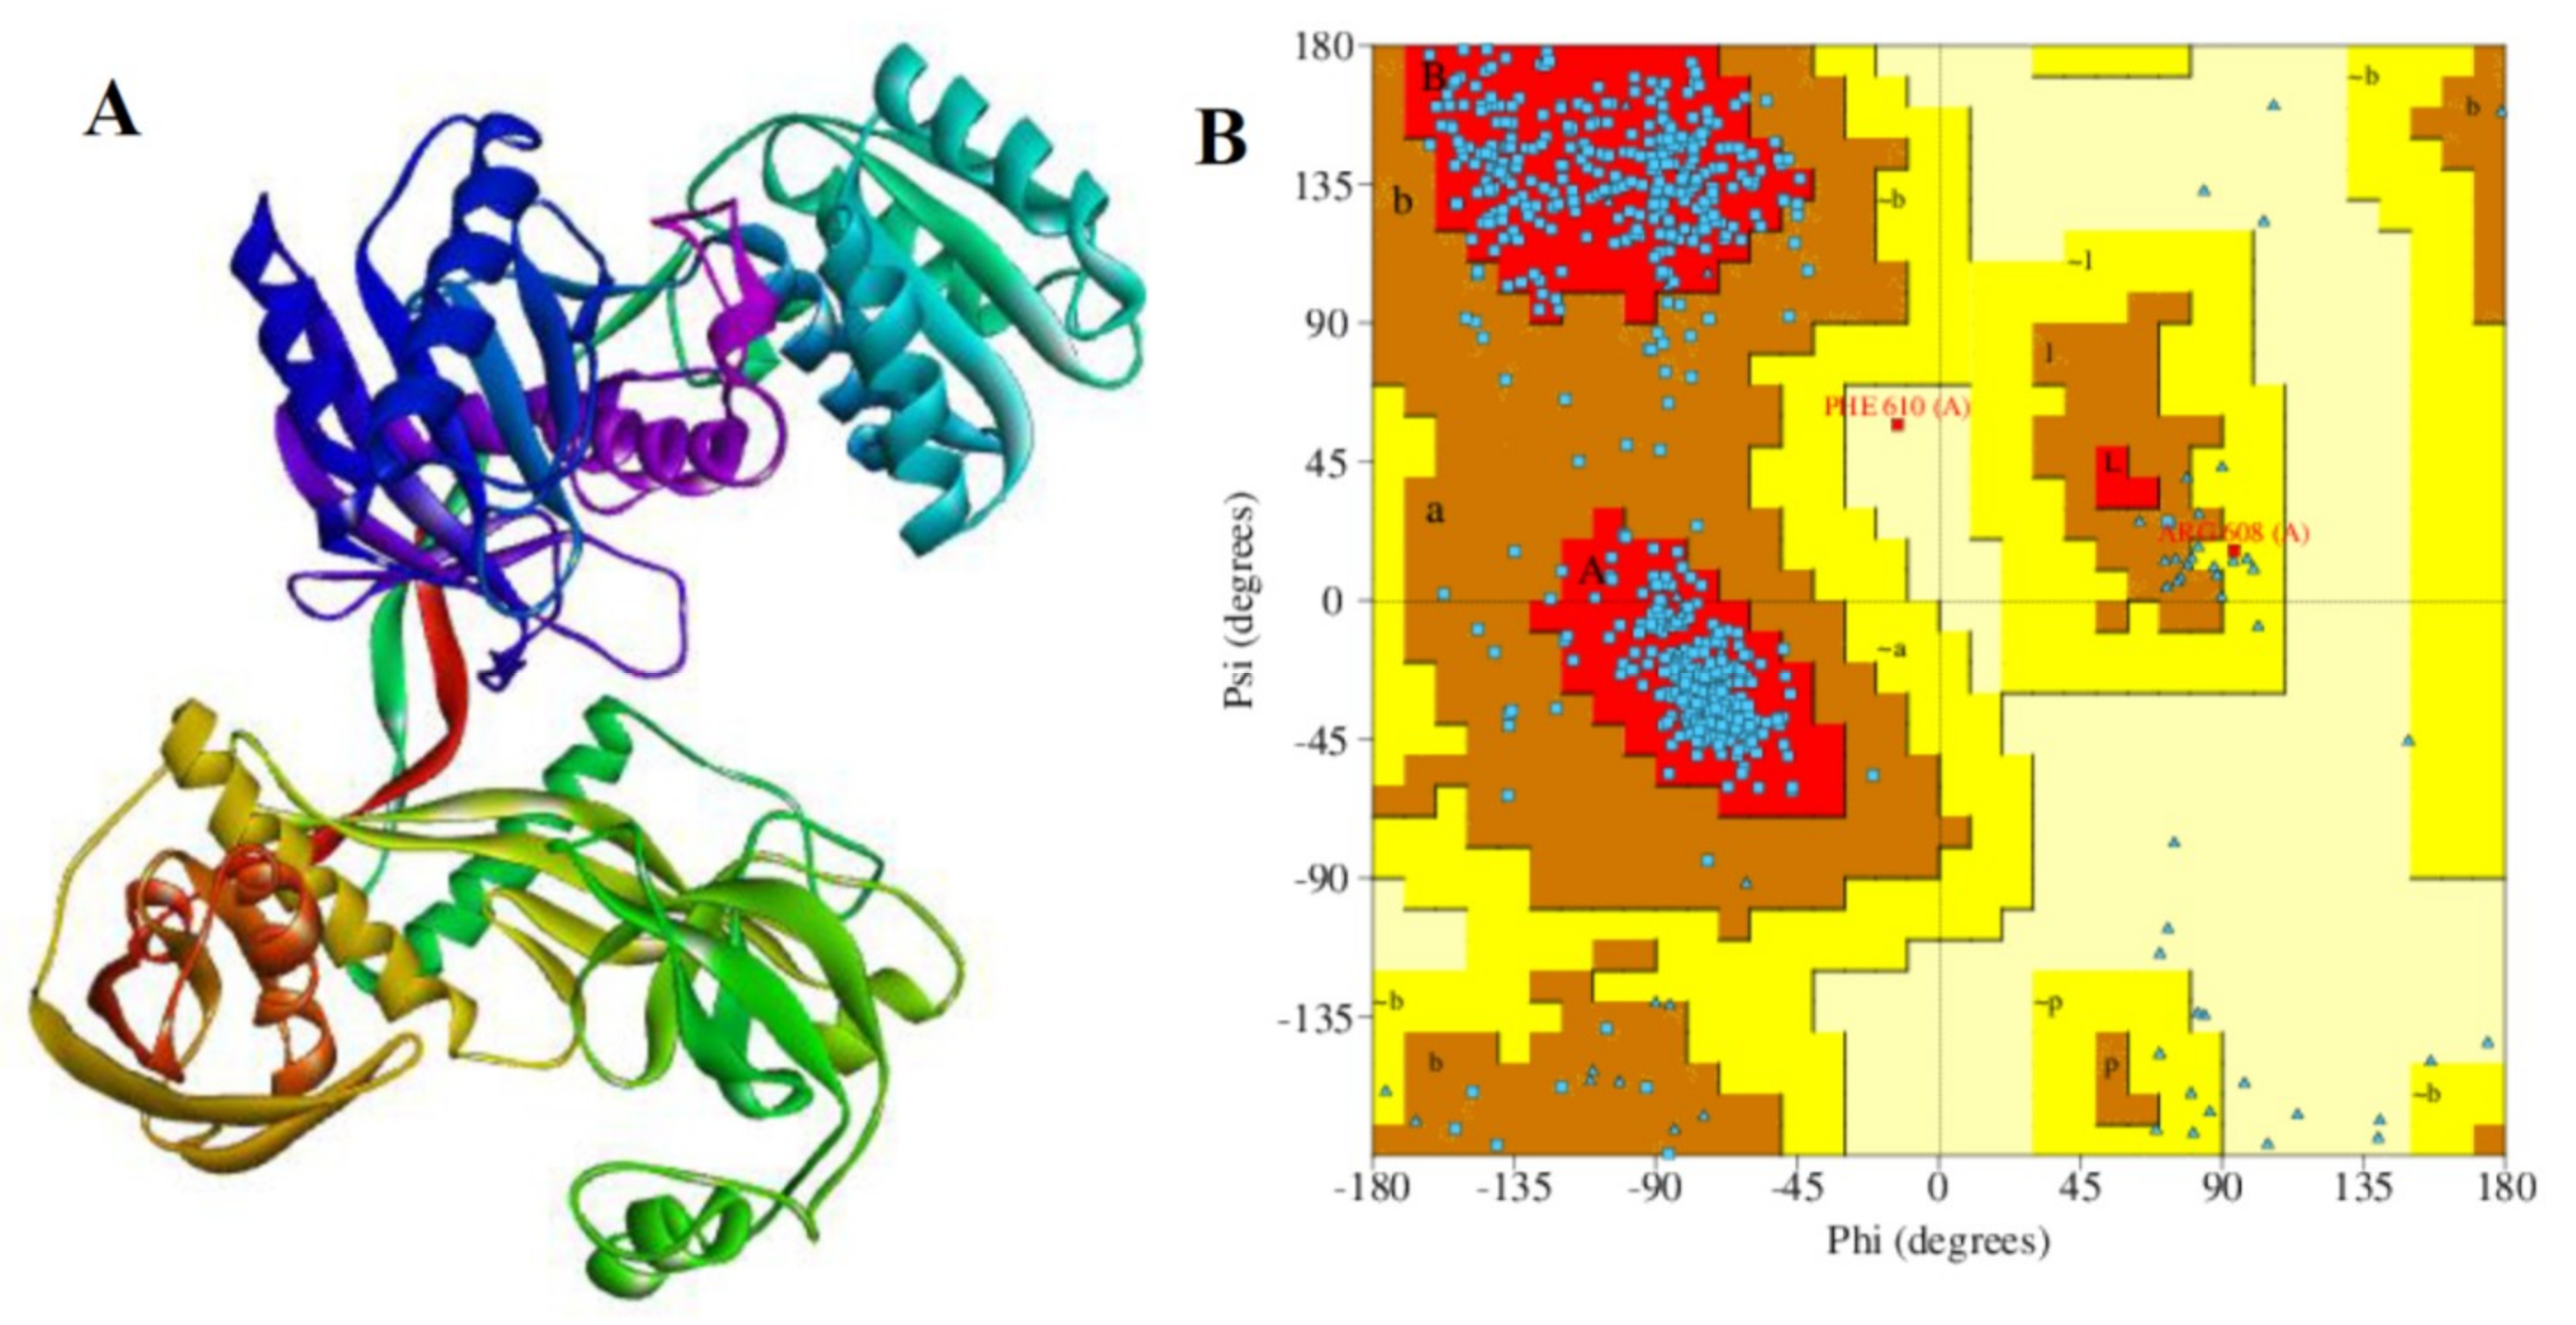
The 3D structure of the Argonaute protein was retrieved from the protein data bank (PDB ID: 3F73). In its raw state, AGO is a homodimer with two protein chains A and B, two nucleic acid groups, two molecules of co-factors Mg2+, a molecule of phosphate group and 16 water molecules (chain A, B, C, H, X, and Y). The structural preparation and necessary corrections were carried out using the Maestro Molecular Modelling tool (2019-2), a product of Schrödinger, and discovery Studio v19.1.0. The AGO protein files from PDB were not suitable for immediate use in the molecular modeling calculation due to the fact that they contain heavy atoms which include co-crystallized ligands, water molecule, metal ions, and co-factors. Further, the structure is a homo-dimer with missing atoms and connectivity information. Therefore, protein preparation wizard in Maestro, Schrodinger was used for the preparation and finally, it was reduced to a single chain (A). For the optimization of the H-bond network, PROPKA was employed to re-orientate hydroxyl and thiol groups, water molecules, amide groups of Asparagine and glutamine, and the imidazole ring of Histidine, as well as the prediction of the protonation states of histidine, aspartate, glutamate, and also the tautomeric states of histidine. The restrained minimization was finally performed to alleviate steric clashes and to relax side-chains (RMSD = 0.030 Å) and water molecules important to the binding receptor, was also maintained at 3. The AGO protein structure (raw and refined chain A) are depicted in Figure 5 and Figure 6 respectively.
2.9. Validation of Chain A of Argonaute Protein
The quality of the processed chain A was evaluated and validated using PROCHECK, a program that relies on Ramachandran plot for structure verification [64]. As shown in Figure 6A,B, the results from the PROCHECK ascertained that the prepared chain A has 91.5% residues in the most favored regions and 8.1% residues in the additional allowed regions. Further, 0.2% residues were found in the generously allowed regions and disallowed regions in each case. Therefore, the prepared protein is considered to be of high quality based on the percentage distribution of the amino acid residues. Furthermore, a G-factor that provides a measure of how unusual or conversely, how usual a given stereochemical property is [65], was also determined using this program. A G-factor of less than −0.5 is unusual and less than −1.0 indicates highly unusual. However, the generate G-factor for the prepared chain A of the receptor protein was −0.34 for dihedral angels, −0.04 for main chain covalent forces and −0.20 overall.
2.10. Docking Analysis Between Receptor Protein and MicroRNA
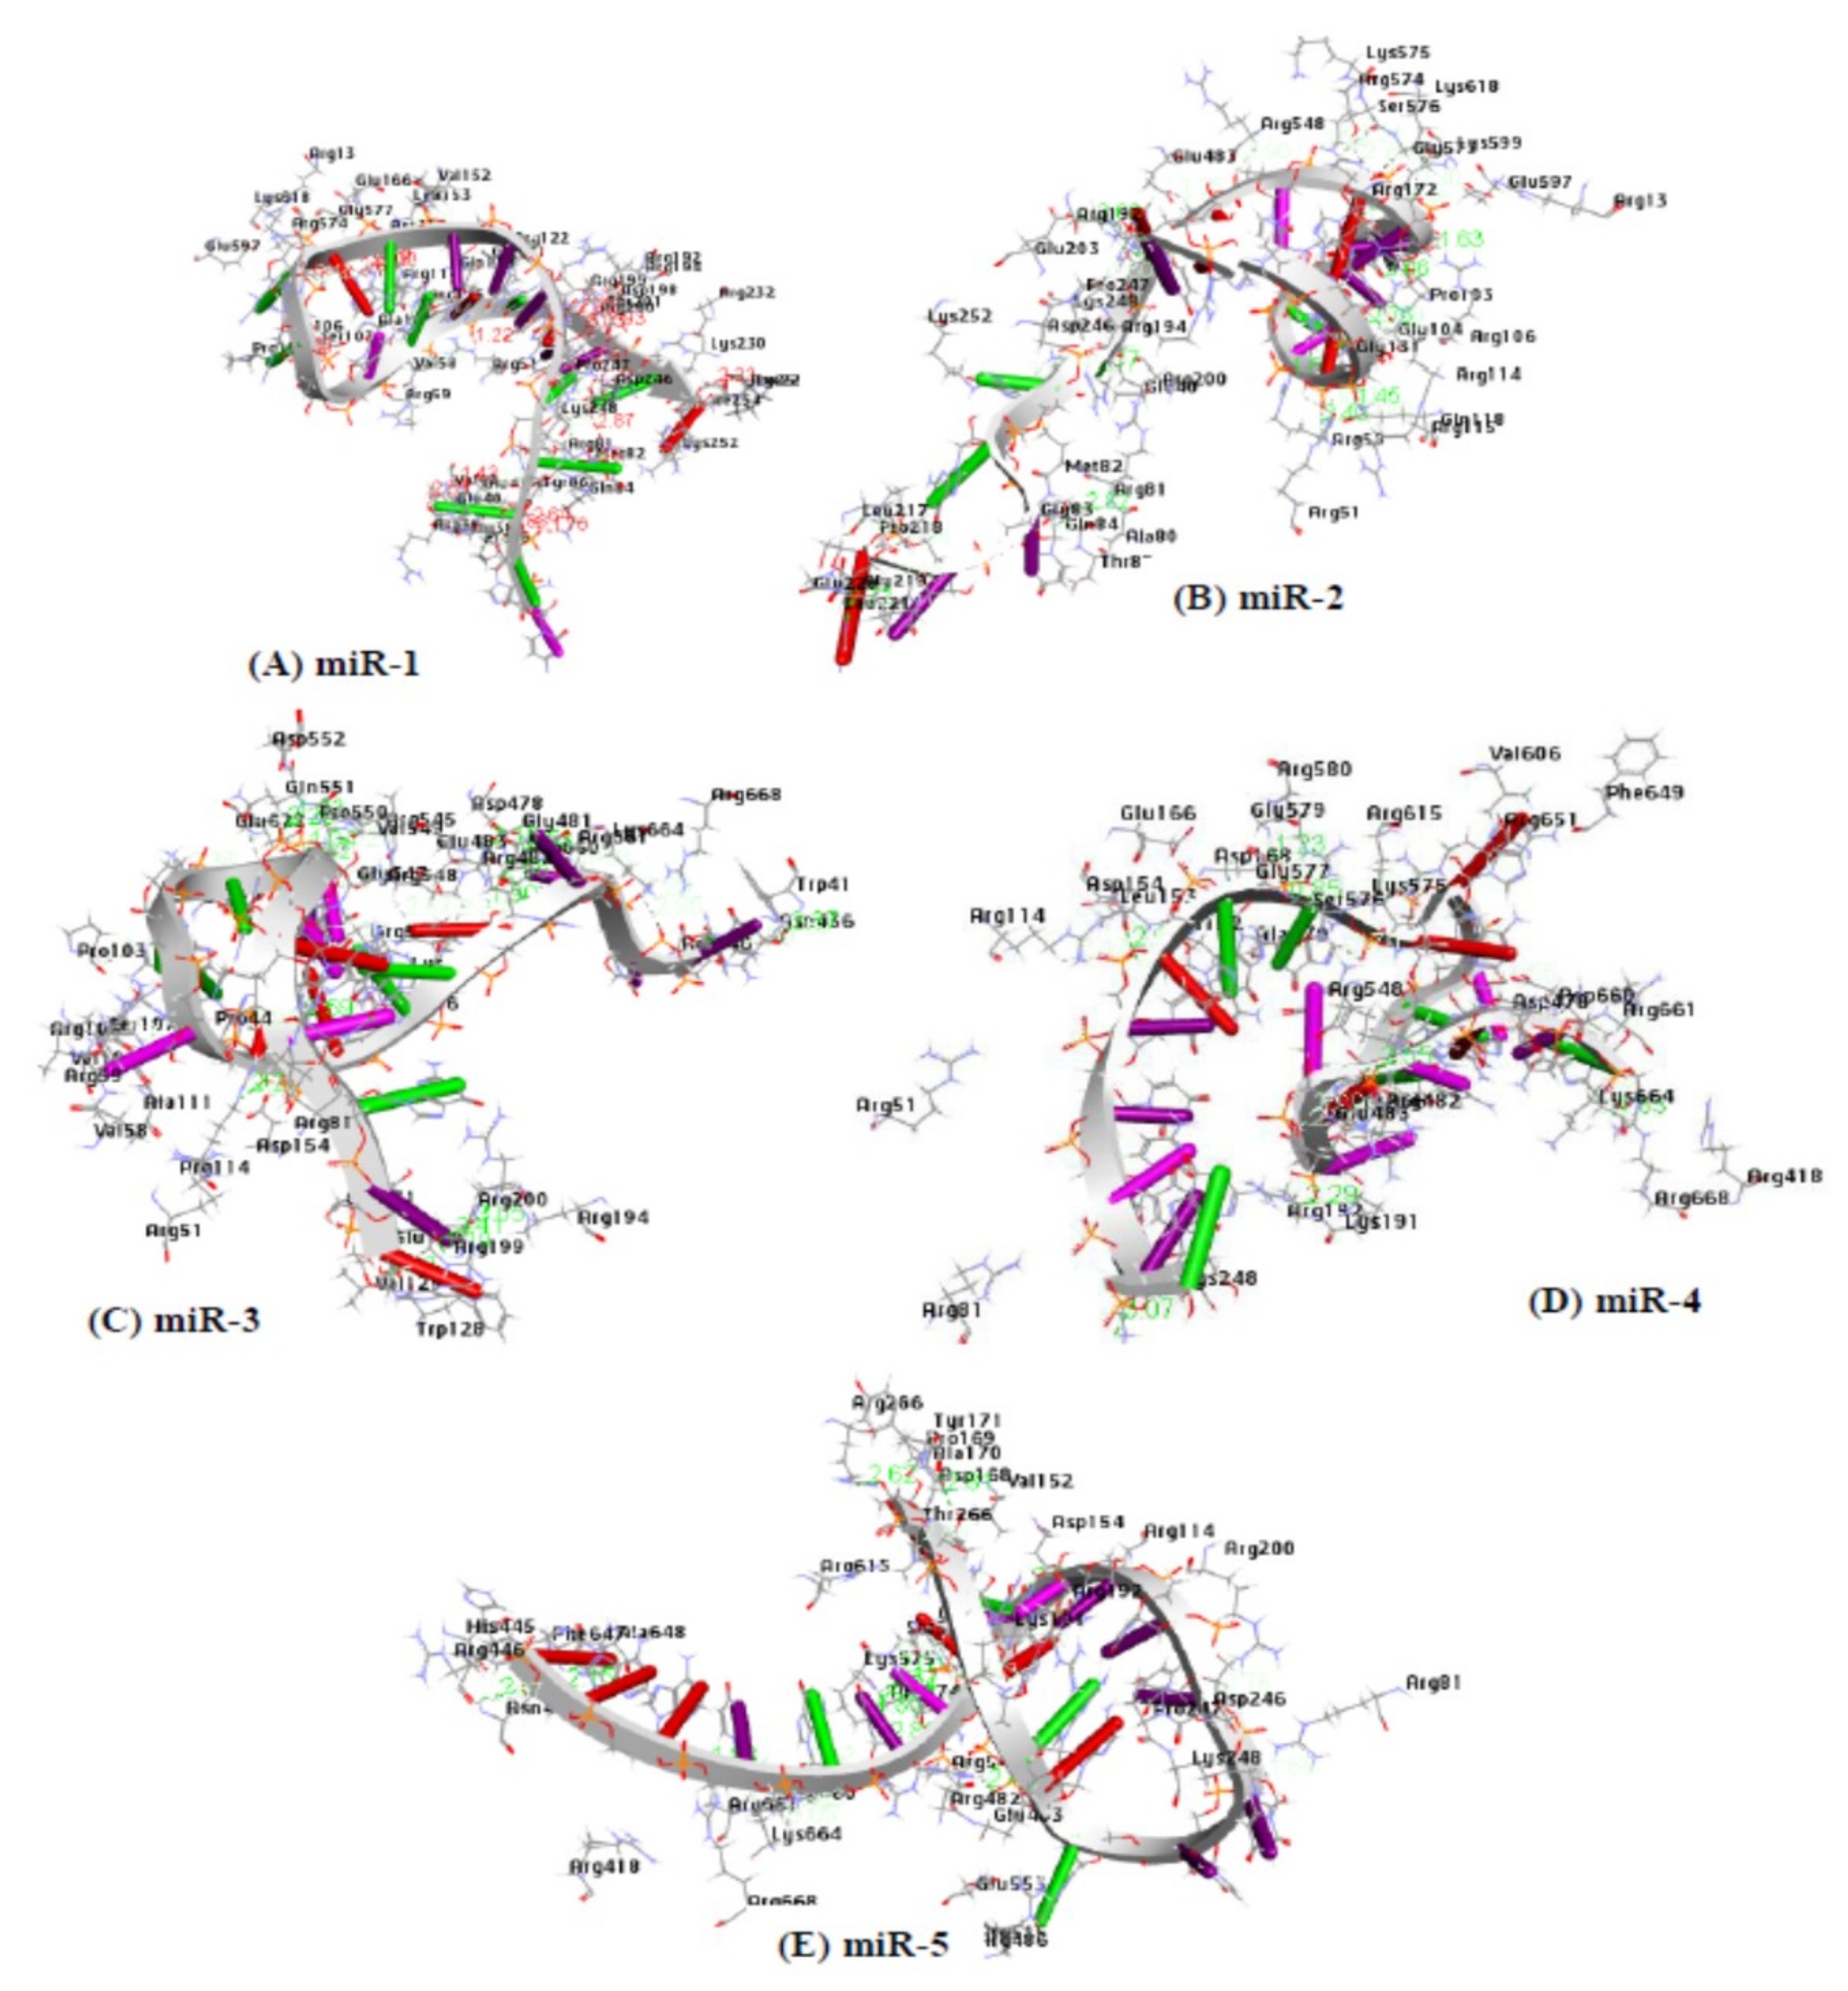
PatchDock as molecular docking method was used for the docking interaction between the microRNAs and the AGO protein. The PDB file of the AGO protein and each of the candidate microRNAs was used as inputs. The root mean square deviation (RMSD) is often used to measure the quality of reproduction of the correct pose and to validate the docking protocol. For a true binding pose to be good, the RMSD must be low, therefore, the clustering RMSD was adjusted to 1.5 Å. The method of PatchDock relies on the shape complementarity theory [66]. A previous study also reported the reliability and usability of the Patch dock tool in molecular docking analysis [67]. The result files generated for each of the microRNAs were ranked according to their geometric shape complementarity score. For the first round of docking, the result with the highest score (geometric shape complementary) was chosen as the best microRNA-AGO complex [67] for each of the five candidate microRNAs (Table 6). The strong binding affinity of these results was observed through their scores and the amino acid residues involved in the interaction between the microRNAs and the AGO protein. As evident, the presence of strong hydrophobic amino acids (mir-1: 21; mir-2: 20; mir-3: 27; mir-4: 22; and mir-5: 27) and amino acids with aromatic side chains (miR-1: 7; mir-2: 3; mir-3: 6; mir-4: 4; and mir-5: 7) within the distance of 3.5 Å (Figure 7; Table 7), and the hydrogen bond within the distance of 2.0 Å are supportive that gene regulation through the argonaute protein are driving by microRNA (Table 8).
2.11. Hydrogen Bond Interaction
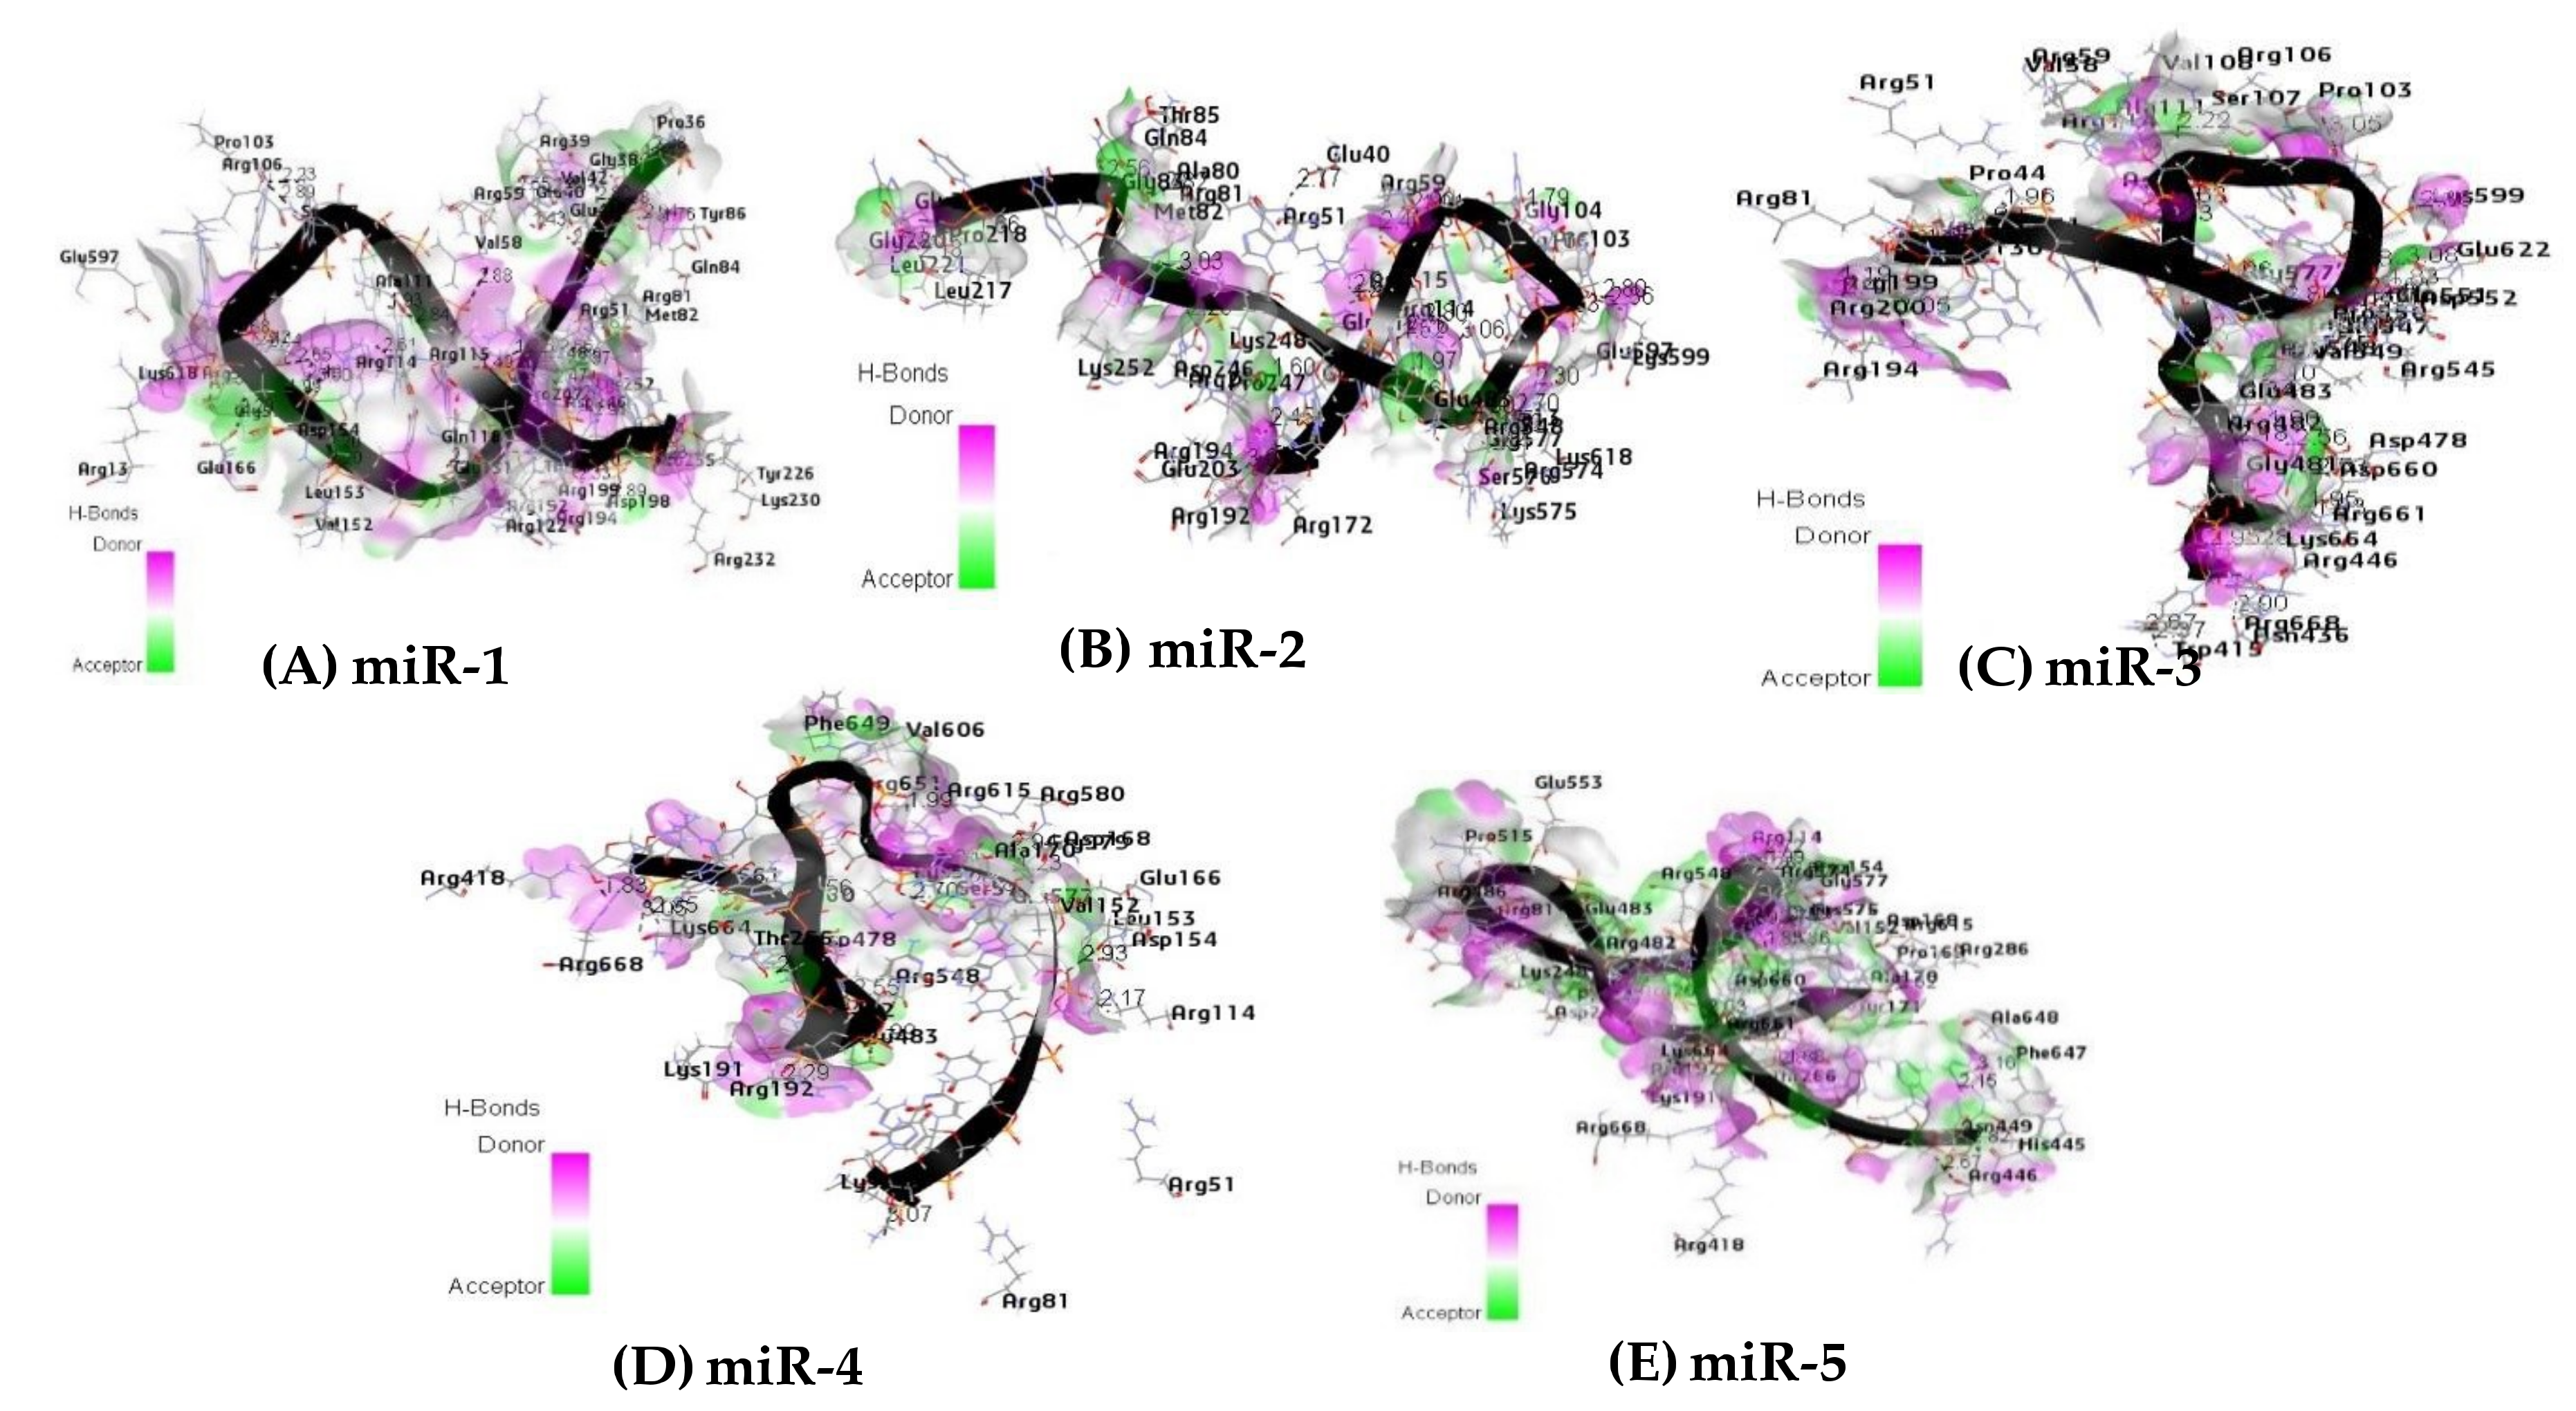
Hydrogen-bonds (H-bond) are an important interaction which dictate the specificity of ligand binding. Their important contribution is explicitly incorporated into the molecular simulation to enhance the binding of molecules to their receptors in an energetically favorable manner [68]. For protein-ligand interactions, hydrogen bonds have been thought to play some significant roles. These roles include the orientation of the binding molecule, ligand recognition, and binding affinity. The latter is one of the most important issues to be considered in protein-ligand interaction. The highest number of hydrogen bond interactions were found among the interacting atoms of miR-1, miR-3 and the residual amino acid of the receptor protein binding pocket with 45 H-bond and 35 H-bond respectively (Figure 8A,C). For miR-2, miR-5 and receptor protein, a total of 28 H-bonds were involved (Figure 9B,E), while the lowest number of hydrogen bonds (18 H-bonds) was observed among the interacting atoms of miR-4 and the receptor protein (Figure 8D). All the hydrogen bonds observed in Figure 8 are within the distance of 3.5 Å. Table 7 shows the residues of the amino acids involved in hydrogen bonding between the Argonaute protein and the microRNAs within the distance of ≤ 2.0 Å. The hydrogen bonds are key to the determination of the interaction (protein-ligand) therefore, they are fundamental to the biological process [69]. The results revealed that the higher the number of favorable interactions, the more the hydrogen bonds. This result may, therefore, support the mechanism by with microRNAs regulates gene expression through RISC.
2.12. Docking Analysis between Argonaute Protein and MicroRNA-mRNA Complex
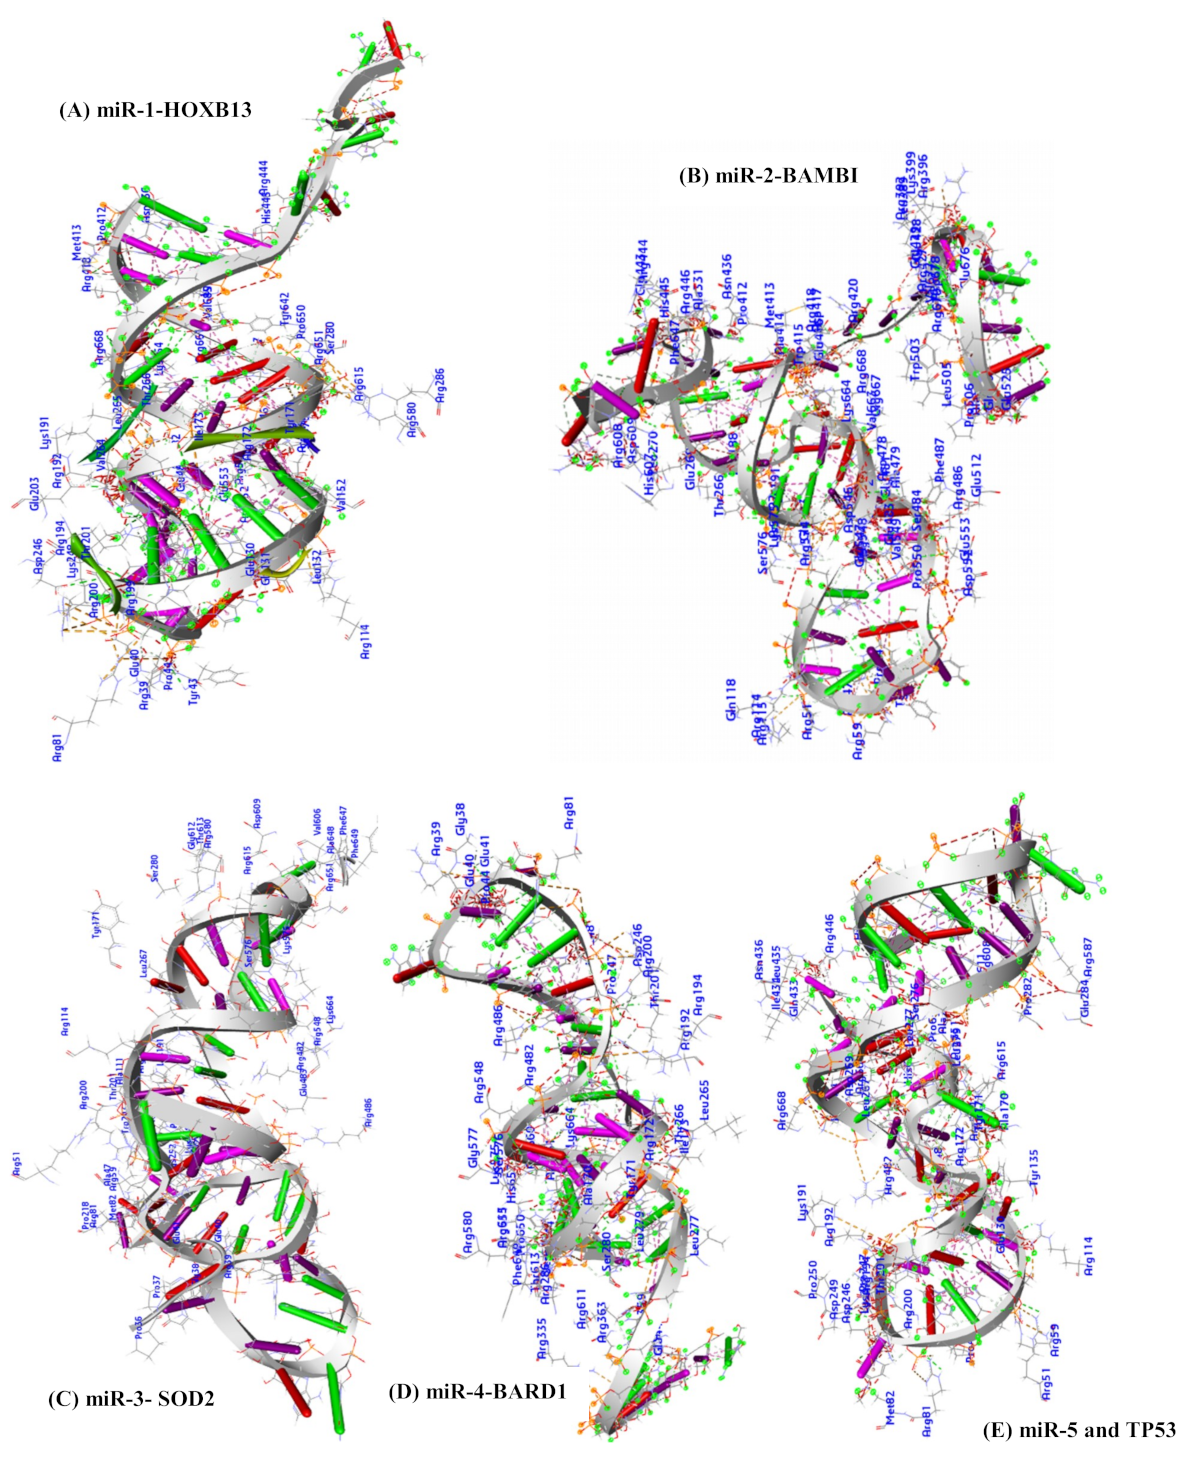
Similar to the docking analysis of microRNAs to the argonaute protein, the microRNA-mRNAs complexes between the candidate microRNAs and their target genes were further docked against the argonaute protein and possible binding interaction in terms of hydrophobicity, aromatic residual amino acids, and hydrogen bonding was analyzed. The docking was carried out on the argonaute protein (chain A) and miR-1-HOXB13; miR-2-BAMBI; miR-3-SOD2; miR-4-BARD1; and miR-5-TP53 separately in PATCHDOCK. Based on the geometric scoring analysis, the highest score for each of the complexes were reported in Table 9.
In nature, strong hydrophobic amino acids together with amino acids with aromatic side chains are important to binding interactions in terms of stability between the receptor and the ligand. Therefore, the binding interaction between the 5 complexes (miR-1-HOXB13, miR-2-BAMBI, miR-3-SOD2, miR-4-BARD1, and miR-5-TP53) and argonaute protein (chain A) was investigated by examining the residual amino acids in the binding pocket of the argonaute protein within the distance of 3.5 Å. The residual strong amino acids of the receptor (argonaute protein) VAL42, LEU45, VAL129, LEU132, ALA133, VAL147, ALA151, VAL152, LEU153, TRP156, ALA170, TYR171, ILE173, LEU174, VAL193, VAL264, LEU265, LEU267, LEU277, LEU279, LEU281, ALA331, ALA414, ILE434, ALA479, VAL549, VAL573, VAL606, LEU617, ALA644, LEU652, LEU658, VAL663, and VAL685 in miR-1 and HOXB13 complex; VAL42, LEU45, LEU46, ALA47, ALA50, VAL58, ALA111, LEU132, LEU189, LEU204, LEU205, VAL264 LEU265, LEU267, LEU270, LEU277, ALA331, LEU389, LEU395, ALA414, LEU421, ALA423, LEU424, LEU435 LEU439, ALA479, LEU505, ALA508, LEU522, VAL549, ALA648, ALA659, LEU662, VAL663, VAL666, ILE671, LEU674, and VAL677 in miR-2 and BAMBI complex; VAL42, LEU45, LEU46, ALA47, VAL58, VAL108, ALA111, LEU112, LEU132, ALA133, VAL152, ALA170, ILE173, LEU215, LEU217, ILE254, LEU265, LEU267, LEU279, LEU281, VAL606, LEU617, ALA648, and LEU652 in miR-3 and SOD2 complex; VAL42, LEU45, VAL147, VAL152, ALA170, ILE173, VAL264, LEU265, LEU267, LEU277, ALA278, LEU279, LEU281, ILE434, LEU435, ALA450, LEU452, VAL573, VAL606, ALA644, ALA648, LEU652, and VAL685 in miR-4 and BARD1 complex; VAL42, LEU45, VAL147, VAL152, ALA170, ILE173, VAL264, LEU265, LEU267, LEU277, ALA278, LEU279, LEU281, ILE434, LEU435, ALA450, LEU452, VAL573, VAL606, ALA644, ALA648, LEU652, and VAL685 in miR-5 and TP53 complex (3.5 Å). Similarly, amino acids such as TYR43, TYR135, TRP202, TRP415, TYR642, PHE647, PHE649, and PHE684 in miR-1 and HOXB13 complex; TYR43, TRP182, TRP202, TRP415, TRP447, PHE485 PHE487, TRP503, PHE610, PHE647, PHE649, and PHE683 in miR-2 and BAMBI complex; TYR43, TYR86, TYR171, TRP202, TRP243, TRP415, PHE487, PHE647, and PHE649 in miR-3 and SOD2 complex; TYR43, TYR135, TYR171, TRP202, PHE360, TRP447, PHE487, PHE610, TYR642, and PHE649 in miR-4 and BARD1 complex; and TYR43, TYR135, TYR171, TRP202, TRP283, TRP447, PHE610, TYR642, PHE647, and PHE649 in miR-5 and TP53 with aromatic ring are also found as participating in the interaction within the binding pocket of the receptor protein (3.5 Å) (Table 8 and Figure 9).
3. Discussion
The study aimed to predict the mechanism of gene regulation mediated through microRNAs involved in CRC using the in silico approach. Since the discovery of microRNA, several studies have reported their involvement in a variety of physiological and pathological processes and mutations affecting their normal expression which may be critical to their role in the development of human diseases [70,71,72], such as cardiovascular diseases [73,74], neurodegenerative diseases [75,76,77], and several cancer subtypes [21,72,78,79]. Additionally, many studies have investigated the diagnostic [80,81] and therapeutic roles [82] of this non-coding RNAs in human diseases. These microRNAs are able to control gene expression in a sequence-specific manner, most especially in the mechanism of gene silencing by forming RISC comprising the argonaute protein [83]. Experimental approaches have been used to study the RNA induced silencing complex at both the molecular and atomic levels [84,85,86].
In light of this, the molecular interaction between chain A of the argonaute protein, microRNAs and the target genes were investigated in CRC with the in silico approach.
In this study, the results of BLASTN and CD-HIT-EST-2D were obtained from 125 validated query sequences and 2226 total microRNA sequences as the reference microRNAs. The microRNAs obtained from BLASTN were based on the parameters: (1) The expected value of 1e-2, (2) the word size of 7 and (3) a similarity index between 90%–99%. The result of the CD-HIT-EST-2D obtained was based on a threshold of 0.90 and word size of 7.
Five microRNAs (Table 1) were finally retained after a sequence similarity search based on their uniqueness after text-mining to show their non-involvement in CRC. These microRNAs targeted 44 genes (Table 2) which were further reduced to five based on the set criteria (involvement in CRC, expression pattern, MFE, biological processes, and their validation methods). The minimum free energy (kcal/mol) of the binding affinity of both the target genes and their microRNAs were further studied in other to verify their interaction strength. After studying the biological processes of these genes, their enrichment in cancer and CRC were also identified through the DAVID database.
The aberrant expression of HOXB13 is associated with CRC [87]. The expression of this gene in the early embryonic development of the intestine represents embryogenic phases in an important tissue-specific marker [88]. Therefore, it strongly correlates with lymph nodes metastasis (TNM) [89]. The over-expression of BAMBI has also been detected in colorectal cancer [90]. This gene has further been linked with late-stage (M) in CRC [91,92]. The expression of SOD2 is increased in pre-malignant (T and N) stages during colorectal carcinogenesis whereas SOD1 is expressed only in colorectal tumors [93]. The aberrant expression of BARD1 is associated with the drivers of various types of cancer [94]. TP53 is correlated with overall survival in stage II and III CRC patients [95].
The selected microRNA target genes were involved (HOXB13, BAMBI, SOD2, BARD1, and TP53) in various biological processes which are crucial to carcinogenesis in CRC. The minimum free energies of −23.9 kcal/mol for HOXB, −13, 9.6 kcal/mol for BAMBI, −16.2 kcal/mol for SOD2, −21.3 kcal/mol for BARD1, and −10.7 kcal/mol for TP53 confirmed that that the binding interaction between the candidate microRNAs and their target genes were energetically favorable, which can be confirmed by the binding energies of each duplex (Table 5). Additionally, to investigate the mechanism by which the candidate microRNAs miR-1, miR-2, miR-3, miR-4, and miR-5 bind argonaute protein in RNA induced silencing complex to target specific genes namely, HOXB13, BAMBI, SOD2, BARD1, and TP53, their molecular interactions were studied.
Prior to the molecular study, microRNAs and microRNA-mRNA duplexes were converted to PDB format. The argonaute protein (receptor) was also downloaded alongside from the protein data bank. As the raw structure is a homodimer consisting of heavy atoms (co-factors, water molecules, metal ions, and co-crystallized ligands) and is of limited resolution due to the x-ray crystallography experiment, the structure was checked (Figure 5).
Specifically, the protein preparation wizard in MAESTRO was used to optimize the hydrogen bond network (PropKa), and alleviate the steric clashes (restrained minimization) by force field: OPLS_2005, Epik was used to generate the het states and finally, missing atoms were fixed using PRIME. The prepared protein was validated using PROCHECK and PDBSum (Figure 6).
The docking algorithm (PATCHDOCK) was employed to computationally study the miRNA-protein and microRNA-mRNA-protein interactions. In order to estimate the strength of the interactions between the receptor and microRNAs, the molecular docking results (argonaute and microRNA and microRNA-mRNA) were estimated by examining the structural components and binding affinity [96].
The general interactions between the receptors and ligand include hydrophobic, hydrogen, pi stacking, weak hydrogen bond, salt bridge, amide stacking, and cation pi. The molecular docking results of the receptor-microRNA interaction and receptor-(microRNA-mRNA) interaction indicated that the non-covalent interactions include hydrophobic interactions between the residual amino acids of the protein and specific atoms of the microRNA and or mRNAs. The hydrogen bonds and the pi stacking bonds, which are the most common interactions, are also observed in the binding analysis to prove that microRNA is crucial to gene regulation.
Rath et al. [97] reported that the presence of aliphatic amino acids such as, isoleucine, leucine, valine, and alanine, which are strong hydrophobic in nature, confer stability during molecular interaction in protein-ligand binding. Further, amino acid residues which are relatively hydrophobic with aromatic side chains such as tryptophan, tyrosine, and phenylalanine provide steadiness towards the binding stability within the binding pocket of a protein.
From the docking analysis of the receptor and the candidate microRNAs, the presence of strong and relatively strong hydrophobic residual amino acid and aromatic rings observed between the candidate microRNAs and the receptor protein (chain A of argonaute protein) together with hydrogen bond interactions within the distance of 3.5Å (Table 7, Figure 7) are proofs that the molecular interaction involved are favorable and stable at the atomic level respectively.
The amino acid residues of the receptor participating in the hydrogen bonding interaction with the candidate microRNAs at the molecular level within the distance of 2.0 Å are also reported in Table 8. This H-bonding interaction strongly assists in receptor stability through the candidate microRNAs during gene regulation (Figure 8). Previous studies have reported that hydrogen bonding between the interaction of two molecules, such as protein and ligand, are important interactions driving potent binding and selectivity [98] and stabilizing ligand conformation [99]. Furthermore, the presence of strong hydrophobic amino acids namely; LEU 45, LEU 265, and LEU 267 and aromatic rings of amino acids TYR 43, TRP 202 and PHE 649 (relatively strong hydrophobic) during molecular interaction of the receptor with miR-1 and HOXB13, miR-2 and BAMBI, miR-3 and SOD2 miR-4 and BARD1, and miR-5- TP53 complex (Table 9, Figure 9 and Table 10) are observed to be commonly participating in all the microRNAs together with their targets in the receptor-binding pocket within the distance of 3.5Å. The hydrophobic contacts are the most common interactions in protein-ligand complexes. The most common hydrophobic interaction is the one formed by an aliphatic carbon in the receptor and an aromatic carbon in the ligand. Leucine, followed by valine, isoleucine and alanine side-chains are the most frequently engaged in hydrophobic interactions [100].
4. Materials and Methods
4.1. MicroRNA Identification
A sequence similarity search was employed to identify candidate microRNAs between the total microRNA sequences (obtained from miRBase) at http://www.mirbase.org/ and microRNAs associated with CRC obtained from four different experimentally validated CRC microRNA databases (dbDEMC, HMDD, miR2Disease, and miRCancer). The parameters for the command line include a sequence identity threshold of 0.90; an E-value of 1e-3; a word size of 7.
4.2. Target Prediction and Correlation to CRC
The miRTarBase is an experimentally validated microRNA-target interactions database at http://mirtarbase.mbc.nctu.edu.tw/php/index.php. Generally, this database is composed of targets experimentally validated through reporter assay, western blot, microarray, and next-generation sequencing experiments [101,102]. The gene browser for CRC (gbCRC) at http://gbcrc.bioinfo-minzhao.org/ and CRC for the gene database (CoReCG) at http://lms.snu.edu.in/corecg/gene are databases containing only validated CRC genes.
The miRTarBase, gbCRC, and CoReCG were used to identify and correlate the targets of the microRNAs.
Furthermore, the targets prioritization was carried out using the Database for Annotation, Visualization and Integrated Discovery (DAVID) at https://david.ncifcrf.gov/ for functional enrichment in CRC [103,104]. To finally select the genes of interest, the expression profile, the biological processes, the minimum free energy score based binding affinity between the targets and the microRNAs (MFE), and the number of experimentally validation methods were considered.
An intersection analysis tool accessed at http://bioinformatics.psb.ugent.be/webtools/Venn/ was used to create Venn diagrams of the involvements of the target genes in the cancer subtypes and their functions.
4.3. Structural Prediction of Candidate MicroRNA and Target Complexes
To determine the secondary structure and the dot-bracket notation of both the microRNAs and their targets, the RNAfold web server was employed. This software at http://rna.tbi.univie.ac.at//cgi-bin/RNAWebSuite/RNAfold.cgi is used to predict the secondary structure of single-stranded RNA or DNA sequences, including their folding energy. The dot-bracket annotations generated were therefore used as inputs in the RNA-COMPOSER (http://rnacomposer.cs.put.poznan.pl/) to generate the 3-dimensional structures of their duplex.
4.4. Protein Selection and Preparation
The sole component of the RNA induced silencing complex (RISC) (AGO protein) was retrieved in PDB format from the protein data bank with the ID: 3F73 (DOI: 10.2210/pdb3F73/pdb) at https://www.rcsb.org/structure/3f73. The molecule was further prepared and visualized using Schrödinger, 2019 suit and discovery studio v19. The protein preparation wizard in Maestro was to optimize the hydrogen bond network (PropKa), alleviation of steric clashes (restrained minimization) by force field: OPLS_2005, Epik was used to generate the het states and finally, missing atoms were fixed using PRIME. The prepared protein was validated using PROCHECK and PDB Sum.
4.5. Molecular Docking
In silico protein-ligand docking was performed using the webserver PATCHDOCK at https://bioinfo3d.cs.tau.ac.il/PatchDock/php.php. The molecular docking between the receptor protein (chain A of the AGO protein) and the microRNA and the microRNA-mRNA complex with chain A of the AGO protein was carried out. The PATCHDOCK software is based on the shape complementarity of the interactions to generate the best candidate solution [67]. The clustering root-mean-square deviation (RMSD) was chosen to be 2.0 Å with the complex type protein-small ligand. The microRNAs, microRNA-mRNA, and AGO were all converted to PDB file formate and were used as inputs into the PATCHDOCK webserver. The results generated were presented in PDB based on the geometric shape complementary score, the approximate interface area (AI area), and the atomic contact energy with their transformation files. The pose with the highest score was considered as the best complex [67].
Finally, the interactions (including receptor surface (hydrogen bond and charge) and binding observed in the docked conformations in the PDB format were analyzed and inspected with Maestro and PDB sun and visualized using the discovery studio v19 software.
4.6. Statistical Analysis
For microRNA selection, the BlastN parameters were set at 1e-2 for expected value, 7.0 for word size, and 90–99% for similarity index. The CD-HIT-EST-2D parameters were set at 0.90 for threshold and 7.0 for word size. The genes considered in DAVID were regarded statistically significant at p-value of 1.8E-3 with the Benjamini score of 1.6E-2. The root-mean-square deviation (RMSD) was set at 0.030 Å for the protein preparation in Schrödinger (restrained minimization). The protein quality check at PROCHECK was also considered significant at 90% and above for residues in the most favored regions. In PatchDock, RMSD was adjusted to 1.5 Å. In discovery studio, the amino acid residues were considered within the distance of 3.5 Å, while hydrogen bonding was considered between 2–3.5 Å. A value of p < 0.05 was considered to indicate a statistically significant difference.
5. Conclusions
The study identified 5 microRNAs involved in CRC along with 5 target genes prioritized with some set criteria. The molecular docking analysis confirmed that these microRNAs could assist the RNA induced silencing complex (Argonaute protein as the sole) in targeting these genes for regulation. This was confirmed by the predominant hydrophobic interaction within the receptor pocket which made a substantial contribution in stability with microRNA-mRNA duplexes while hydrogen bonding and polar interactions assisted in the proper orientation of the binding interaction. These interactions at the molecular level are important in protein folding and structural stability and also in mediating the binding of the protein to their targets. This result may further serve as a lead to the experimental approach in understanding the molecular mechanism of action of gene regulation in CRC.
Author Contributions
All authors have made significant contributions to the submission of this manuscript. A.O.F. conceived the concept and the design of the manuscript, A.K. and A.P. provided the necessary software required to carry out the analysis. The analysis and data interpretations were done by both A.O.F. and A.P. while A.K. drafted the rough draft and also substantively revised the manuscript. Also, all authors also read and approved the submitted of the final version for publication. Finally, authors agreed to be personally accountable for their personal contributions and ensured that questions related to the accuracy or integrity of any part of the study, even ones in which the author was not personally involved, are appropriately investigated, resolved, and the resolution documented in the literature.
Funding
Not applicable.
Acknowledgments
Authors are thankful to the Center for High-Performance Computing (CHPC), Department of Science and Technology, Republic of South Africa, for the access to their server. Also, to the National Agricultural Proteomics Research and Service Unit (NAPRSU), Plant Omics Laboratory, and the entire Bioinformatics Research Group, Department of Biotechnology, University of the Western Cape, South Africa, for the provision of work-station. During this study. Many thanks to Taiwo Akinsoji (MBBS, M.PH), The University of Illinois at Springfield for provision of materials related to the study.
Conflicts of Interest
The authors declare no conflicts of interest.
Data Availability
The datasets and the clinical data were obtained from specific databases as described in the methodology.
Abbreviations
| AGO | Argonaute (Receptor) |
| miRNA | microRNA |
| mRNA | Target genes |
| AA | Amino acid |
| H-bond | Hydrogen bond |
| PDB | protein data bank |
| RISC | RNA induced silencing complex |
| NA | Nucleic acid |
| BE | Binding energy |
| MFE | Minimum folding energy |
References
- Torre, L.A.; Bray, F.; Siegel, R.L.; Ferlay, J.; Lortet-Tieulent, J.; Jemal, A. Global cancer statistics, 2012. CA: A Cancer J. Clin. 2015, 65, 87–108. [Google Scholar] [CrossRef] [PubMed] [Green Version]
- Birkenkamp-Demtroder, K.; Christensen, L.L.; Olesen, S.H.; Frederiksen, C.M.; Laiho, P.; Aaltonen, L.A.; Laurberg, S.; Sørensen, F.B.; Hagemann, R.; Ørntoft, T.F. Gene expression in colorectal cancer. Cancer Res. 2002, 62, 4352–4363. [Google Scholar] [PubMed]
- O’Keefe, S. Diet, microorganisms and their metabolites and colon cancer. Nature Rev. Gastroenterol. Hepatol. 2016, 13, 691–706. [Google Scholar] [CrossRef] [PubMed]
- Kheirelseid, E.A.; Miller, N.; Chang, K.H.; Nugent, M.; Kerin, M.J. Clinical applications of gene expression in colorectal cancer. J. Gastrointest. Oncol. 2013, 4, 144. [Google Scholar] [PubMed]
- Fadaka, A.O.; Pretorius, A.; Klein, A. Biomarkers for Stratification in Colorectal Cancer: MicroRNAs. Cancer Control. 2019, 26, 1073274819862784. [Google Scholar] [CrossRef] [PubMed]
- Tuszynska, I.; Magnus, M.; Jonak, K.; Dawson, W.; Bujnicki, J.M. NPDock: A web server for protein–nucleic acid docking. Nucleic Acids Res. 2015, 43, W425–W430. [Google Scholar] [CrossRef]
- Hudson, W.H.; Ortlund, E.A. The structure, function and evolution of proteins that bind DNA and RNA. Nat. Rev. Mol. Cell Biol. 2014, 15, 749–760. [Google Scholar] [CrossRef] [PubMed] [Green Version]
- Cooper, T.A.; Wan, L.; Dreyfuss, G. RNA and Disease. Cell 2009, 136, 777–793. [Google Scholar] [CrossRef] [Green Version]
- Höck, J.; Meister, G. The Argonaute protein family. Genome Biol. 2008, 9, 210. [Google Scholar] [CrossRef]
- Schirle, N.T.; Kinberger, G.A.; Murray, H.F.; Lima, W.F.; Prakash, T.P.; MacRae, I.J. Structural analysis of human Argonaute-2 bound to a modified siRNA guide. J. Am. Chem. Soc. 2016, 138, 8694–8697. [Google Scholar] [CrossRef]
- Elkayam, E.; Kuhn, C.-D.; Tocilj, A.; Haase, A.D.; Greene, E.M.; Hannon, G.J.; Joshua-Tor, L. The structure of human argonaute-2 in complex with miR-20a. Cell 2012, 150, 100–110. [Google Scholar] [CrossRef] [PubMed]
- Das, J.; Podder, S.; Ghosh, T.C. Insights into the miRNA regulations in human disease genes. BMC Genom. 2014, 15, 1010. [Google Scholar] [CrossRef] [PubMed]
- Silva Rodrigues, D.V.; Silva Monteiro, V.V.; Navegantes-Lima, K.C.; de Brito Oliveira, A.L.; de França Gaspar, S.L.; Gonçalves Quadros, L.B.; Monteiro, M.C. MicroRNAs in cell cycle progression and proliferation: Molecular mechanisms and pathways. Non-Coding RNA Investig. 2018. [Google Scholar] [CrossRef]
- Chivukula, R.R.; Shi, G.; Acharya, A.; Mills, E.W.; Zeitels, L.R.; Anandam, J.L.; Abdelnaby, A.A.; Balch, G.C.; Mansour, J.C.; Yopp, A.C. An essential mesenchymal function for miR-143/145 in intestinal epithelial regeneration. Cell 2014, 157, 1104–1116. [Google Scholar] [CrossRef] [PubMed]
- Xin, M.; Olson, E.N.; Bassel-Duby, R. Mending broken hearts: Cardiac development as a basis for adult heart regeneration and repair. Nat. Rev. Mol. Cell Biol. 2013, 14, 529. [Google Scholar] [CrossRef] [PubMed]
- Hasuwa, H.; Ueda, J.; Ikawa, M.; Okabe, M. miR-200b and miR-429 function in mouse ovulation and are essential for female fertility. Science 2013, 341, 71–73. [Google Scholar] [CrossRef]
- Giza, D.E.; Vasilescu, C.; Calin, G.A. Key principles of miRNA involvement in human diseases. Discoveries 2014, 2, e34. [Google Scholar] [CrossRef]
- Moridikia, A.; Mirzaei, H.; Sahebkar, A.; Salimian, J. MicroRNAs: Potential candidates for diagnosis and treatment of colorectal cancer. J. Cell. Physiol. 2018, 233, 901–913. [Google Scholar] [CrossRef]
- Nishida, N.; Nagahara, M.; Sato, T.; Mimori, K.; Sudo, T.; Tanaka, F.; Shibata, K.; Ishii, H.; Sugihara, K.; Doki, Y. Microarray analysis of colorectal cancer stromal tissue reveals upregulation of two oncogenic miRNA clusters. Clin. Cancer Res. 2012, 18, 3054–3070. [Google Scholar] [CrossRef]
- Hirata, H.; Ueno, K.; Shahryari, V.; Tanaka, Y.; Tabatabai, Z.L.; Hinoda, Y.; Dahiya, R. Oncogenic miRNA-182–5p targets Smad4 and RECK in human bladder cancer. PLoS ONE 2012, 7, e51056. [Google Scholar] [CrossRef]
- Fadaka, A.O.; Ojo, B.A.; Adewale, O.B.; Esho, T.; Pretorius, A. Effect of dietary components on miRNA and colorectal carcinogenesis. Cancer Cell Int. 2018, 18, 130. [Google Scholar] [CrossRef] [PubMed]
- Zhang, B.; Pan, X.; Cobb, G.P.; Anderson, T.A. microRNAs as oncogenes and tumor suppressors. Dev. Biol. 2007, 302, 1–12. [Google Scholar] [CrossRef] [PubMed] [Green Version]
- Li, L.; Yu, C.; Gao, H.; Li, Y. Argonaute proteins: Potential biomarkers for human colon cancer. BMC Cancer 2010, 10, 38. [Google Scholar] [CrossRef] [PubMed]
- Jafarnejad, S.M.; Ardekani, G.S.; Ghaffari, M.; Martinka, M.; Li, G. Sox4-mediated Dicer expression is critical for suppression of melanoma cell invasion. Oncogene 2013, 32, 2131. [Google Scholar] [CrossRef] [PubMed]
- Völler, D.; Meister, G.; Bosserhoff, A. Strong reduction of Ago2 expression in melanoma and cellular consequences. Exp. Dermatol. 2014, 23. [Google Scholar] [CrossRef] [PubMed]
- Carmell, M.A.; Xuan, Z.; Zhang, M.Q.; Hannon, G.J. The Argonaute family: Tentacles that reach into RNAi, developmental control, stem cell maintenance, and tumorigenesis. Genes Dev. 2002, 16, 2733–2742. [Google Scholar] [CrossRef]
- Sun, R.; Gao, C.-L.; Li, D.-H.; Li, B.-J.; Ding, Y.-H. Expression status of PIWIL1 as a prognostic marker of colorectal cancer. Dis. Markers 2017, 2017. [Google Scholar] [CrossRef] [PubMed]
- Völler, D.; Linck, L.; Bruckmann, A.; Hauptmann, J.; Deutzmann, R.; Meister, G.; Bosserhoff, A.K. Argonaute family protein expression in normal tissue and cancer entities. PLoS ONE 2016, 11, e0161165. [Google Scholar] [CrossRef]
- Bajorath, J. Integration of virtual and high-throughput screening. Nat. Rev. Drug Discov. 2002, 1, 882. [Google Scholar] [CrossRef]
- Demchenko, A.P. Recognition between flexible protein molecules: Induced and assisted folding. J. Mol. Recognit. 2001, 14, 42–61. [Google Scholar] [CrossRef]
- Du, X.; Li, Y.; Xia, Y.-L.; Ai, S.-M.; Liang, J.; Sang, P.; Ji, X.-L.; Liu, S.-Q. Insights into protein–ligand interactions: Mechanisms, models, and methods. Int. J. Mol. Sci. 2016, 17, 144. [Google Scholar] [CrossRef] [PubMed]
- Zhang, H.; Ye, Q.; Du, Z.; Huang, M.; Zhang, M.; Tan, H. MiR-148b-3p inhibits renal carcinoma cell growth and pro-angiogenic phenotype of endothelial cell potentially by modulating FGF2. Biomed. Pharmacother. 2018, 107, 359–367. [Google Scholar] [CrossRef] [PubMed]
- Huang, X.; Wang, L.; Liu, W.; Li, F. MicroRNA-497-5p inhibits proliferation and invasion of non-small cell lung cancer by regulating FGF2. Oncol. Lett. 2019, 17, 3425–3431. [Google Scholar] [CrossRef] [PubMed] [Green Version]
- Lou, X.; Zhang, J.; Liu, S.; Lou, X.; Liao, D.J. The other side of the coin: The tumor-suppressive aspect of oncogenes and the oncogenic aspect of tumor-suppressive genes, such as those along the CCND–CDK4/6–RB axis. Cell Cycle 2014, 13, 1677–1693. [Google Scholar] [CrossRef] [PubMed]
- Zhang, Y.; Hunter, T. Roles of Chk1 in cell biology and cancer therapy. Int. J. Cancer 2014, 134, 1013–1023. [Google Scholar] [CrossRef]
- Gali-Muhtasib, H.; Ocker, M.; Kuester, D.; Krueger, S.; El-Hajj, Z.; Diestel, A.; Evert, M.; El-Najjar, N.; Peters, B.; Jurjus, A. Thymoquinone reduces mouse colon tumor cell invasion and inhibits tumor growth in murine colon cancer models. J. Cell. Mol. Med. 2008, 12, 330–342. [Google Scholar] [CrossRef]
- Wallin, Å.; Francis, P.; Nilbert, M.; Svanvik, J.; Sun, X.-F. Gene expression profile of colon cancer cell lines treated with SN-38. Chemotherapy 2010, 56, 17–25. [Google Scholar] [CrossRef]
- Zhao, Y.; Yu, H.; Hu, W. The regulation of MDM2 oncogene and its impact on human cancers. Acta Biochim Biophys Sin. (Shanghai) 2014, 46, 180–189. [Google Scholar] [CrossRef] [Green Version]
- Wang, B.; Shen, Z.-L.; Gao, Z.-D.; Zhao, G.; Wang, C.-Y.; Yang, Y.; Zhang, J.-Z.; Yan, Y.-C.; Shen, C.; Jiang, K.-W. MiR-194, commonly repressed in colorectal cancer, suppresses tumor growth by regulating the MAP4K4/c-Jun/MDM2 signaling pathway. Cell Cycle 2015, 14, 1046–1058. [Google Scholar] [CrossRef] [Green Version]
- Zhang, C.; Liu, J.; Wang, X.; Wu, R.; Lin, M.; Laddha, S.V.; Yang, Q.; Chan, C.S.; Feng, Z. MicroRNA-339-5p inhibits colorectal tumorigenesis through regulation of the MDM2/p53 signaling. Oncotarget 2014, 5, 9106–9117. [Google Scholar] [CrossRef]
- Kaindl, U.; Morak, M.; Portsmouth, C.; Mecklenbräuker, A.; Kauer, M.; Zeginigg, M.; Attarbaschi, A.; Haas, O.; Panzer-Grümayer, R. Blocking ETV6/RUNX1-induced MDM2 overexpression by Nutlin-3 reactivates p53 signaling in childhood leukemia. Leukemia 2014, 28, 600. [Google Scholar] [CrossRef] [PubMed]
- Sporn, J.C.; Hothorn, T.; Jung, B. BARD1 expression predicts outcome in colon cancer. Clin. Cancer Res. 2011, 17, 5451–5462. [Google Scholar] [CrossRef] [PubMed]
- Zhang, Y.Q.; Pilyugin, M.; Kuester, D.; Leoni, V.P.; Li, L.; Casula, G.; Zorcolo, L.; Schneider-Stock, R.; Atzori, L.; Irminger-Finger, I. Expression of oncogenic BARD1 isoforms affects colon cancer progression and correlates with clinical outcome. Br. J. Cancer 2012, 107, 675–683. [Google Scholar] [CrossRef] [PubMed] [Green Version]
- Irminger-Finger, I.; Pilyugin, M. Regulation of BARD1 expression by non-coding RNA. Google Patents US10273475B2, 2019. [Google Scholar]
- Bach, D.-H.; Park, H.J.; Lee, S.K. The Dual Role of Bone Morphogenetic Proteins in Cancer. Mol. Oncolytics 2017, 8, 1–13. [Google Scholar] [CrossRef] [Green Version]
- Yu, W.; Chai, H. Inhibition of BAMBI reduces the viability and motility of colon cancer via activating TGF-β/Smad pathway in vitro and in vivo. Oncol. Lett. 2017, 14, 4793–4799. [Google Scholar] [CrossRef] [PubMed]
- Kim, Y.; Gupta Vallur, P.; Phaëton, R.; Mythreye, K.; Hempel, N. Insights into the Dichotomous Regulation of SOD2 in Cancer. Antioxidants 2017, 6, 86. [Google Scholar] [CrossRef]
- Zhang, Z.; Lang, J.; Cao, Z.; Li, R.; Wang, X.; Wang, W. Radiation-induced SOD2 overexpression sensitizes colorectal cancer to radiation while protecting normal tissue. Oncotarget 2017, 8, 7791. [Google Scholar] [CrossRef] [PubMed]
- Trimmer, C.; Sotgia, F.; Whitaker-Menezes, D.; Balliet, R.M.; Eaton, G.; Martinez-Outschoorn, U.E.; Pavlides, S.; Howell, A.; Iozzo, R.V.; Pestell, R.G.; et al. Caveolin-1 and mitochondrial SOD2 (MnSOD) function as tumor suppressors in the stromal microenvironment: A new genetically tractable model for human cancer associated fibroblasts. Cancer Biol. Ther. 2011, 11, 383–394. [Google Scholar] [CrossRef]
- Feng, H.; Gu, Z.-Y.; Li, Q.; Liu, Q.-H.; Yang, X.-Y.; Zhang, J.-J. Identification of significant genes with poor prognosis in ovarian cancer via bioinformatical analysis. J. Ovarian Res. 2019, 12, 35–35. [Google Scholar] [CrossRef]
- Wenzel, E.S.; Singh, A.T. Cell-cycle checkpoints and aneuploidy on the path to cancer. In Vivo 2018, 32, 1–5. [Google Scholar]
- Arthurs, C.; Murtaza, B.N.; Thomson, C.; Dickens, K.; Henrique, R.; Patel, H.R.; Beltran, M.; Millar, M.; Thrasivoulou, C.; Ahmed, A. Expression of ribosomal proteins in normal and cancerous human prostate tissue. PLoS ONE 2017, 12, e0186047. [Google Scholar] [CrossRef] [PubMed]
- Fan, H.; Lu, Y.; Qin, H.; Zhou, Y.; Gu, Y.; Zhou, J.; Wang, X.; Fan, D. High Ran level is correlated with poor prognosis in patients with colorectal cancer. Int. J. Clin. Oncol. 2013, 18, 856–863. [Google Scholar] [CrossRef] [PubMed]
- Flossbach, L.; Holzmann, K.; Mattfeldt, T.; Buck, M.; Lanz, K.; Held, M.; Möller, P.; Barth, T.F. High-resolution genomic profiling reveals clonal evolution and competition in gastrointestinal marginal zone B-cell lymphoma and its large cell variant. Int. J. Cancer 2013, 132, E116–E127. [Google Scholar] [CrossRef] [PubMed]
- Li, Z.; Han, C.; Feng, J. Relationship of the expression levels of XIAP and p53 genes in hepatocellular carcinoma and the prognosis of patients. Oncol. Lett. 2017, 14, 4037–4042. [Google Scholar] [CrossRef] [PubMed] [Green Version]
- Rao, R.C.; Dou, Y. Hijacked in cancer: The KMT2 (MLL) family of methyltransferases. Nat. Rev. Cancer 2015, 15, 334–346. [Google Scholar] [CrossRef] [PubMed]
- Fang, Y.; Zhang, D.; Hu, T.; Zhao, H.; Zhao, X.; Lou, Z.; He, Y.; Qin, W.; Xia, J.; Zhang, X. KMT2A histone methyltransferase contributes to colorectal cancer development by promoting cathepsin Z transcriptional activation. Cancer Med. 2019. [Google Scholar] [CrossRef] [PubMed]
- Badr, E.A.E.; Ali Assar, M.F.; Gohar, S.F.; Badr, M.H.; Hathout, R.M.; El-Kousy, S.M. The clinical impact of miRNA34a and P53 gene expression in colon cancer. Biochem. Biophys. Rep. 2018, 16, 88–95. [Google Scholar] [CrossRef]
- Okuda, H.; Toyota, M.; Ishida, W.; Furihata, M.; Tsuchiya, M.; Kamada, M.; Tokino, T.; Shuin, T. Epigenetic inactivation of the candidate tumor suppressor gene HOXB13 in human renal cell carcinoma. Oncogene 2006, 25, 1733–1742. [Google Scholar] [CrossRef]
- Maia, S.; Cardoso, M.; Pinto, P.; Pinheiro, M.; Santos, C.; Peixoto, A.; Bento, M.J.; Oliveira, J.; Henrique, R.; Jerónimo, C.; et al. Identification of Two Novel HOXB13 Germline Mutations in Portuguese Prostate Cancer Patients. PLoS ONE 2015, 10, e0132728. [Google Scholar] [CrossRef]
- Xue, X.; Taylor, M.; Anderson, E.; Hao, C.; Qu, A.; Greenson, J.K.; Zimmermann, E.M.; Gonzalez, F.J.; Shah, Y.M. Hypoxia-inducible factor-2α activation promotes colorectal cancer progression by dysregulating iron homeostasis. Cancer Res. 2012, 72, 2285–2293. [Google Scholar] [CrossRef]
- Heo, S.J.; Lee, C.-K.; Hahn, K.Y.; Kim, G.; Hur, H.; Choi, S.H.; Han, K.S.; Cho, A.; Jung, M. A Case of von Hippel-Lindau Disease with Colorectal Adenocarcinoma, Renal Cell Carcinoma and Hemangioblastomas. Cancer Res. Treat. 2016, 48, 409–414. [Google Scholar] [CrossRef] [PubMed]
- Popenda, M.; Szachniuk, M.; Antczak, M.; Purzycka, K.J.; Lukasiak, P.; Bartol, N.; Blazewicz, J.; Adamiak, R.W. Automated 3D structure composition for large RNAs. Nucleic Acids Res. 2012, 40, e112–e112. [Google Scholar] [CrossRef] [PubMed]
- Chhabra, G.; Sharma, P.; Anant, A.; Deshmukh, S.; Kaushik, H.; Gopal, K.; Srivastava, N.; Sharma, N.; Garg, L.C. Identification and modeling of a drug target for Clostridium perfringens SM101. Bioinformation 2010, 4, 278. [Google Scholar] [CrossRef] [PubMed]
- Laskowski, R.A.; Rullmann, J.A.C.; MacArthur, M.W.; Kaptein, R.; Thornton, J.M. AQUA and PROCHECK-NMR: Programs for checking the quality of protein structures solved by NMR. J. Biomol. NMR 1996, 8, 477–486. [Google Scholar] [CrossRef] [PubMed]
- Agrawal, P.; Singh, H.; Srivastava, H.K.; Singh, S.; Kishore, G.; Raghava, G.P. Benchmarking of different molecular docking methods for protein-peptide docking. BMC Bioinform. 2019, 19, 426. [Google Scholar] [CrossRef] [PubMed]
- Schneidman-Duhovny, D.; Inbar, Y.; Nussinov, R.; Wolfson, H.J. PatchDock and SymmDock: Servers for rigid and symmetric docking. Nucleic Acids Res. 2005, 33, W363–W367. [Google Scholar] [CrossRef] [PubMed]
- Wade, R.C.; Goodford, P.J. The role of hydrogen-bonds in drug binding. Prog. Clin. Biol. Res. 1989, 289, 433–444. [Google Scholar]
- Schiebel, J.; Gaspari, R.; Wulsdorf, T.; Ngo, K.; Sohn, C.; Schrader, T.E.; Cavalli, A.; Ostermann, A.; Heine, A.; Klebe, G. Intriguing role of water in protein-ligand binding studied by neutron crystallography on trypsin complexes. Nat. Commun. 2018, 9. [Google Scholar] [CrossRef] [PubMed]
- Tüfekci, K.U.; Öner, M.G.; Meuwissen, R.L.J.; Genç, Ş. The role of microRNAs in human diseases. In miRNomics: MicroRNA Biology and Computational Analysis; Springer: Berlin, Germany, 2014; pp. 33–50. [Google Scholar]
- Ha, T.-Y. MicroRNAs in human diseases: From cancer to cardiovascular disease. Immune Netw. 2011, 11, 135–154. [Google Scholar] [CrossRef]
- Ardekani, A.M.; Naeini, M.M. The Role of MicroRNAs in Human Diseases. Avicenna J. Med Biotechnol. 2010, 2, 161–179. [Google Scholar]
- Zhou, S.-S.; Jin, J.-P.; Wang, J.-Q.; Zhang, Z.-G.; Freedman, J.H.; Zheng, Y.; Cai, L. miRNAS in cardiovascular diseases: Potential biomarkers, therapeutic targets and challenges. Acta Pharmacol. Sin. 2018, 39, 1073. [Google Scholar] [CrossRef] [PubMed]
- Silva, D.C.P.D.; Carneiro, F.D.; Almeida, K.C.D.; Fernandes-Santos, C. Role of miRNAs on the Pathophysiology of Cardiovascular Diseases. Arq. Bras. De Cardiol. 2018, 111, 738–746. [Google Scholar] [CrossRef] [PubMed]
- Gui, Y.; Liu, H.; Zhang, L.; Lv, W.; Hu, X. Altered microRNA profiles in cerebrospinal fluid exosome in Parkinson disease and Alzheimer disease. Oncotarget 2015, 6, 37043. [Google Scholar] [CrossRef] [PubMed]
- Shah, P.; Cho, S.K.; Thulstrup, P.W.; Bjerrum, M.J.; Lee, P.H.; Kang, J.-H.; Bhang, Y.-J.; Yang, S.W. MicroRNA biomarkers in neurodegenerative diseases and emerging nanosensors technology. J. Mov. Disord. 2017, 10, 18. [Google Scholar] [CrossRef]
- Rajgor, D. Macro roles for microRNAs in neurodegenerative diseases. Non-Coding RNA Res. 2018, 3, 154–159. [Google Scholar] [CrossRef] [PubMed]
- James, A.B.; Fadaka, A.O.; Magbagbeola, O.A.; Oturu, A.; KOLAWOLE, O.O.; Ogunjimi, A.; Oshodi, T.; Habeebu, M.; Onawoga, F.O.; Ajogbeje, E.O. Haematological and miRNAs (let-7g, miR-21, miR-141) expression modulation profile in serum samples of Human prostate cancer. FASEB J. 2017, 31, 712–757. [Google Scholar]
- Ryan, B.M.; Robles, A.I.; Harris, C.C. Genetic variation in microRNA networks: The implications for cancer research. Nat. Rev. Cancer 2010, 10, 389. [Google Scholar] [CrossRef]
- Luo, X.; Burwinkel, B.; Tao, S.; Brenner, H. MicroRNA signatures: Novel biomarker for colorectal cancer? Cancer Epidemiol. Prev. Biomark. 2011, 20, 1272–1286. [Google Scholar] [CrossRef]
- Madhavan, D.; Cuk, K.; Burwinkel, B.; Yang, R. Cancer diagnosis and prognosis decoded by blood-based circulating microRNA signatures. Front. Genet. 2013, 4, 116. [Google Scholar] [CrossRef] [Green Version]
- Li, C.; Feng, Y.; Coukos, G.; Zhang, L. Therapeutic microRNA strategies in human cancer. AAPS J. 2009, 11, 747. [Google Scholar] [CrossRef]
- O’Brien, J.; Hayder, H.; Zayed, Y.; Peng, C. Overview of microRNA biogenesis, mechanisms of actions, and circulation. Front. Endocrinol. 2018, 9, 402. [Google Scholar] [CrossRef] [PubMed]
- Liu, H.-S.; Xiao, H.-S. MicroRNAs as potential biomarkers for gastric cancer. World J. Gastroenterol. 2014, 20, 12007–12017. [Google Scholar] [CrossRef] [PubMed]
- Gebert, L.F.R.; MacRae, I.J. Regulation of microRNA function in animals. Nat. Rev. Mol. Cell Biol. 2019, 20, 21–37. [Google Scholar] [CrossRef] [PubMed]
- Lu, Y.; Leslie, C.S. Learning to predict miRNA-mRNA interactions from AGO CLIP sequencing and CLASH data. PLoS Comput. Biol. 2016, 12, e1005026. [Google Scholar] [CrossRef] [PubMed]
- Kanai, M.; Hamada, J.-I.; Takada, M.; Asano, T.; Murakawa, K.; Takahashi, Y.; Murai, T.; Tada, M.; Miyamoto, M.; Kondo, S. Aberrant expressions of HOX genes in colorectal and hepatocellular carcinomas. Oncol. Rep. 2010, 23, 843–851. [Google Scholar]
- Zacchetti, G.; Duboule, D.; Zakany, J. Hox gene function in vertebrate gut morphogenesis: The case of the caecum. Development 2007, 134, 3967–3973. [Google Scholar] [CrossRef] [PubMed]
- Tatangelo, F.; Di Mauro, A.; Scognamiglio, G.; Aquino, G.; Lettiero, A.; Delrio, P.; Avallone, A.; Cantile, M.; Botti, G. Posterior HOX genes and HOTAIR expression in the proximal and distal colon cancer pathogenesis. J. Transl. Med. 2018, 16, 350. [Google Scholar] [CrossRef]
- Sekiya, T.; Adachi, S.; Kohu, K.; Yamada, T.; Higuchi, O.; Furukawa, Y.; Nakamura, Y.; Nakamura, T.; Tashiro, K.; Kuhara, S. Identification of BMP and activin membrane-bound inhibitor (BAMBI), an inhibitor of transforming growth factor-β signaling, as a target of the β-catenin pathway in colorectal tumor cells. J. Biol. Chem. 2004, 279, 6840–6846. [Google Scholar] [CrossRef]
- Togo, N.; Ohwada, S.; Sakurai, S.; Toya, H.; Sakamoto, I.; Yamada, T.; Nakano, T.; Muroya, K.; Takeyoshi, I.; Nakajima, T. Prognostic significance of BMP and activin membrane-bound inhibitor in colorectal cancer. World J. Gastroenterol. 2008, 14, 4880. [Google Scholar] [CrossRef]
- Tang, J.; Gifford, C.; Samarakoon, R.; Higgins, P. Deregulation of negative controls on TGF-β1 signaling in tumor progression. Cancers 2018, 10, 159. [Google Scholar] [CrossRef]
- Tiwari, A.K.; Joshi, S.; Brasky, J.T.; DeLaCruz, M.; Gibson, T.P.; Kunte, D.; Subramanian, P.; Wali, R.K.; Roy, H.K. Superoxide Dismutase 2 (Sod2) is Overexpressed at an Early Stage During Colorectal Carcinogenesis: A Putative Target for Celecoxib Chemoprevention. Gastroenterology 2011, 140, 343. [Google Scholar] [CrossRef]
- Irminger-Finger, I.; Ratajska, M.; Pilyugin, M. New concepts on BARD1: Regulator of BRCA pathways and beyond. Int. J. Biochem. Cell Biol. 2016, 72, 1–17. [Google Scholar] [CrossRef] [PubMed] [Green Version]
- Li, A.J.; Li, H.-G.; Tang, E.-J.; Wu, W.; Chen, Y.; Jiang, H.-H.; Lin, M.-B.; Yin, L. PIK3CA and TP53 mutations predict overall survival of stage II/III colorectal cancer patients. World J. Gastroenterol. 2018, 24, 631–640. [Google Scholar] [CrossRef] [PubMed]
- Andrews, P.; Craik, D.; Martin, J. Functional group contributions to drug-receptor interactions. J. Med. Chem. 1984, 27, 1648–1657. [Google Scholar] [CrossRef] [PubMed]
- Rath, S.N.; Das, D.; Konkimalla, V.B.; Pradhan, S.K. In silico study of miRNA based gene regulation, involved in solid cancer, by the assistance of argonaute protein. Genom. Inform. 2016, 14, 112. [Google Scholar] [CrossRef] [PubMed]
- Alex, A.; Millan, D.S.; Perez, M.; Wakenhut, F.; Whitlock, G.A. Intramolecular hydrogen bonding to improve membrane permeability and absorption in beyond rule of five chemical space. MedChemComm 2011, 2, 669–674. [Google Scholar] [CrossRef]
- Kuhn, B.; Mohr, P.; Stahl, M. Intramolecular hydrogen bonding in medicinal chemistry. J. Med. Chem. 2010, 53, 2601–2611. [Google Scholar] [CrossRef]
- Sahu, V.; Khan, A.; Singh, R.; Singh, P. Hydrophobic, polar and hydrogen bonding based drug-receptor interaction of tetrahydroimidazobenzodiazepinones. Am. J. Immunol 2008, 4, 33. [Google Scholar] [CrossRef]
- Hsu, S.-D.; Lin, F.-M.; Wu, W.-Y.; Liang, C.; Huang, W.-C.; Chan, W.-L.; Tsai, W.-T.; Chen, G.-Z.; Lee, C.-J.; Chiu, C.-M. miRTarBase: A database curates experimentally validated microRNA–target interactions. Nucleic Acids Res. 2010, 39, D163–D169. [Google Scholar] [CrossRef]
- Chou, C.-H.; Shrestha, S.; Yang, C.-D.; Chang, N.-W.; Lin, Y.-L.; Liao, K.-W.; Huang, W.-C.; Sun, T.-H.; Tu, S.-J.; Lee, W.-H. miRTarBase update 2018: A resource for experimentally validated microRNA-target interactions. Nucleic Acids Res. 2017, 46, D296–D302. [Google Scholar] [CrossRef]
- Huang, D.W.; Sherman, B.T.; Lempicki, R.A. Bioinformatics enrichment tools: Paths toward the comprehensive functional analysis of large gene lists. Nucleic Acids Res. 2008, 37, 1–13. [Google Scholar] [CrossRef] [PubMed]
- Huang, D.W.; Sherman, B.T.; Lempicki, R.A. Systematic and integrative analysis of large gene lists using DAVID bioinformatics resources. Nat. Protoc. 2009, 4, 44. [Google Scholar] [CrossRef] [PubMed]
Figure 1.
Schematic representation of the methodology.

Figure 2.
Biological processes of the microRNA target genes.

Figure 3.
MicroRNA target genes involved in several cancer subtypes.

Figure 4.
Structural model of miR-1 and mRNA of HOXB13 gene (A), miR-2 and mRNA of BAMBI gene (B), miR-3 and mRNA of SOD2 gene (C), miR-4 and mRNA of BARD1 gene (D), miR-5 and mRNA of TP53 gene (E), complexes are deciphered, respectively.
Figure 4.
Structural model of miR-1 and mRNA of HOXB13 gene (A), miR-2 and mRNA of BAMBI gene (B), miR-3 and mRNA of SOD2 gene (C), miR-4 and mRNA of BARD1 gene (D), miR-5 and mRNA of TP53 gene (E), complexes are deciphered, respectively.

Figure 5.
The receptor protein (3D-AGO protein) before preparation visualized by Maestro software.

Figure 6.
The structural details of the receptor. (A) Prepared chain A (Maestro, Discovery studio) and (B) its Ramachandran plot (PDBSum, PROCHECK). The quality of the prepared chain A was estimated by PDBSum server. The residues in most favored regions (A, B, L), the residues in additional allowed regions (a, b, l, p) and residues in generously allowed regions (~a, ~b ~l, ~p). The structural details of chain A (ID: 3F37: A) consist of 6 sheets, 9 gamma turns, 12 beta hairpins, 14 beta bulges, 33 strands, and 55 beta turns.

Figure 7.
The amino acid residues of Argonaute protein participating in the interaction with each of the five candidate microRNAs within a distance of 3.5 Å are deciphered, respectively. (A) amino acids participating in miR-1-Agonaute protein duplex, (B) amino acids participating in mir-2-Agonaute protein duplex, (C) amino acids participating in mir-3-Agonaute protein duplex, (D) amino acids participating in mir-4-Agonaute protein duplex, and (E) amino acids participating in mir-5-Agonaute protein duplex.

Figure 8.
Hydrogen bond interaction between the residual amino acids of the receptor protein and the microRNAs (A) miR-1, (B) miR-2, (C) miR-3, (D) miR-4, and (E) miR-5 respectively (3.5 Å distance).
Figure 8.
Hydrogen bond interaction between the residual amino acids of the receptor protein and the microRNAs (A) miR-1, (B) miR-2, (C) miR-3, (D) miR-4, and (E) miR-5 respectively (3.5 Å distance).

Figure 9.
Docking complex results of microRNA-mRNA and the receptor (Chain A of argonaute protein). The amino acid residues participating in the interaction between the receptor and miR-1-HOXB13 (A); Residual amino acids participating in the interaction between the receptor and miR-2-BAMBI (B); miR-3-SOD2 (C); miR-4-BARD1(D); and miR-5- TP53 (E).


Table 1.
MicroRNAs and their clusters.
| Candidate miRNA | Validated microRNA | Fasta Sequences |
|---|---|---|
| miR-1 | hsa-miR-193a-5p | >hsa-miR-193a-5p MIMAT0004614 UGGGUCUUUGCGGGCGAGAUGA |
| miR-2 | hsa-miR-450b-3p | >hsa-miR-450b-3p MIMAT0004910 UUGGGAUCAUUUUGCAUCCAUA |
| miR-3 | hsa-miR-501-3p | >hsa-miR-501-3p MIMAT0004774 AAUGCACCCGGGCAAGGAUUCU |
| miR-4 | hsa-miR-501-3p | >hsa-miR-501-3p MIMAT0004774 AAUGCACCCGGGCAAGGAUUCU |
| miR-5 | hsa-miR-513a-3p | >hsa-miR-513a-3p MIMAT0004777 UAAAUUUCACCUUUCUGAGAAGG |
Table 2.
MicroRNA target genes associated with colorectal cancer (CRC) and their MFE (miRTarBase).
| miR-1 | MFE | miR-2 | MFE | miR-3 | MFE | miR-4 | MFE | miR-5 | MFE |
|---|---|---|---|---|---|---|---|---|---|
| A1CF | −19.10 | BAMBI | −9.80 | SOD2 | −16.20 | BARD1 | −21.30 | PDCD4 | −11.80 |
| PAQR3 | −13.80 | XIAP | −8.70 | PAQR3 | −10.80 | SLC1A5 | −17.30 | VMP1 | −12.50 |
| STMN1 | −19.90 | BMP2 | −8.70 | SLC7A11 | −20.60 | WT1 | −14.80 | CDK4 | −10.70 |
| MACC1 | −18.00 | ZNF703 | −13.80 | MDM2 | −11.90 | CLMN | −16.40 | TP53 | −10.70 |
| FGB | −12.90 | PPM1D | −16.90 | RAN | −14.70 | REL | −19.80 | CHEK1 | −8.70 |
| HOXB13 | −23.90 | BUB1 | −8.00 | LAMB1 | −11.52 | HDGF | −21.70 | H2AFZ | −9.60 |
| ALDOA | −19.20 | LYN | −12.90 | ORAI2 | −19.50 | RNF138 | −18.20 | ||
| CHAC1 | −20.10 | KLF8 | −11.02 | VAV3 | −17.80 | SLC7A5 | −12.50 | ||
| GSTK1 | −18.10 | FGF2 | −14.60 | ||||||
| RPS19 | −19.10 | KMT2A | −17.02 | ||||||
| CRKL | −15.40 | ||||||||
| VHL | −19.90 |
MFE score based binding affinity between 5 miRNAs and 44 target genes associated with CRC as indicated by miRTarBase.
Table 3.
Gene enrichment in cancer and their biological functions.
| Gene | Function | miRNA | MFE |
|---|---|---|---|
| TP53 | Cell cycle, Apoptosis, Cell proliferation, others | miR-5 | −10.70 |
| FGF2 | Angiogenesis, Cell proliferation, others | miR-2 | −14.60 |
| CHEK1 | Cell cycle, Apoptosis, other functions | miR-5 | −8.70 |
| WT1 | Apoptosis, Cell proliferation, others | miR-4 | −14.80 |
| MDM2 | Cell cycle, Cell proliferation, others | miR-3 | −11.90 |
| BARD1 | Cell cycle, Apoptosis, others | miR-4 | −21.30 |
| BUB1 | Cell cycle, others | miR-2 | −8.00 |
| XIAP | Apoptosis, others | miR-2 | −8.70 |
| BMP2 | Cell proliferation, others | miR-2 | −8.70 |
| CDK4 | Cell cycle, others | miR-5 | −10.70 |
| HOXB13 | Angiogenesis, others | miR-1 | −23.90 |
| KMT2A | Apoptosis, others | miR-2 | −17.02 |
| VHL | Angiogenesis, others | miR-1 | −19.90 |
| BAMBI | Other functions | miR-2 | −9.80 |
| RAN | Other functions | miR-3 | −14.70 |
| REL | Other functions | miR-4 | −19.80 |
| RPS19 | Other functions | miR-1 | −19.10 |
| SOD2 | Other functions | miR-3 | −16.20 |
Table 4.
The final list of microRNAs and target genes.
| S/N | miRNAs | Target Gene |
|---|---|---|
| 1 | miR-1 | HOXB13 |
| 2 | miR-2 | BAMBI |
| 3 | miR-3 | SOD2 |
| 4 | miR-4 | BARD1 |
| 5 | miR-5 | TP53 |
Table 5.
Study of binding affinity between miRNA-mRNA duplex.
| Gene | miRNA | Dot-Bracket Notation | 2° Structure of Duplex | BE | MFE |
|---|---|---|---|---|---|
| HOXB13 | miR-1 | .......((((..((((((((........))))))))..)))) |  | −13.3 | −23.9 |
| BAMBI | miR-2 | ............(((((.((((.((.....)).))))..)))))....... |  | −2.3 | −9.6 |
| SOD2 | miR-3 | ...((((..(((......))).)))).((.(((......))).))... |  | −8.5 | −16.2 |
| BARD1 | miR-4 | .............((((((((((....)))))...))))).. |  | −12.8 | −21.3 |
| TP53 | miR-5 | .(((((...)))))..(((...(((...)))....)))... |  | −4.0 | −10.7 |
Note: BE- Minimum binding energy in kcal/mol; MFE- Minimum free energy in kcal/mol.
Table 6.
The docking scores between miRNA and AGO protein.
| miRNA-mRNA and AGO | Score | Area | ACE |
|---|---|---|---|
| miR-1 -AGO | 19544 | 3390.80 | −258.22 |
| miR-2-AGO | 18618 | 2832.70 | −22.43 |
| miR-3-AGO | 18420 | 2814.10 | −151.43 |
| miR-4-AGO | 18024 | 2344.20 | −131.18 |
| miR-5-AGO | 20.372 | 2913.20 | −488.07 |
The score indicates the geometric shape complementary score and atomic contact energy (ACE) score generated for each miRNA and AGO complex. miRNA, microRNA; AGO, argonaute; ACE, atomic contact energy.
Table 7.
Molecular docking analysis results of microRNA and receptors with participating aa residues (3.5 Å).
Table 7.
Molecular docking analysis results of microRNA and receptors with participating aa residues (3.5 Å).
| miRNA | Hydrophobic AA | Aromatic AA | H-Bond |
|---|---|---|---|
| (21 a), LEU45 d, ALA47 d, VAL58 d, VAL108 d, ALA111 d, LEU112 d, VAL129 d, LEU132 e, ALA133 e, LEU217 d, ALA245 d, ILE254 d, VAL264 d, LEU596 d | (7b), TYR43 d, TYR135 d, TRP156 e, TRP202 d | (25 c) ARG114 d, ARG574 d, GLY577 d, LYS248 d, ASP246 d, ASP154 d, ARG200 d, GLY131 d, PRO103 d, LEU153 d | |
| miR-2 | (20 a), ALA47 d, VAL58 d, VAL108 d, ALA111 d, LEU112 d, LEU132 e, ALA133 e, VAL152 d, LEU153 d, LEU217 d, ALA245 d, ILE254 d, VAL264 d, VAL549d d, LEU596 d, VAL620 d | (3 b), TYR43 d, TRP156 e, TRP202 d | (21 c) ARG114 d, ARG574 d, GLY577 d, LYS248 d, ASP246 d, ARG548 d, GLU483 d, SER576 d, ARG192 d, LYS599 d, ARG81 d |
| miR-3 | (27 a), ALA47 d, VAL58 d, LEU64 d, VAL108 d, ALA111 d, LEU112 d, VAL129 d, LEU132 e, ALA133 e, VAL152 d, LEU153 d, ALA450 d, ALA479 d, VAL549 d, VAL620 d, LEU652 d, VAL663 d | (6 b), TYR43 d, TRP156 e, TRP447 d | (26 c) ARG114, ARG574, GLY577, ASP154, ARG548 GLU483, LYS664 ARG661, ARG200 GLY131 PRO103, LYS599 ARG81, ASP660, |
| miR-4 | (22 a), ALA47 d, LEU132 e, ALA133 e, ALA151 d, VAL152 d, LEU153 d, ALA170 d, ILE173 d, VAL264 d, LEU265 d, LEU267 d, LEU279 d, ALA479 d, VAL573 d, ALA648 d, LEU652 d, LEU662 d, VAL663 d | (4 b), TYR135 d, TRP156e, PHE649 d | (15 c) ARG114, LYS248, ARG548 GLU483, SER576 ARG192, LYS664 ARG661, LEU153, THR266 LYS575 ARG482 |
| miR-5 | (27 a), LEU132 e, ALA133 e, ALA151 d, VAL152d, LEU153 d, ALA170 d, ILE173 d, VAL264 d, LEU265 d, LEU267 d, LEU279 d, ALA450 d, ALA479 d, VAL549 d, VAL573 d, ALA648 d, LEU652 d, LEU662 d, VAL663 d | (7 b) TYR135 d, TRP156 e, TRP447 d, PHE649 d | (17 c) ARG574 d, ASP246 d, ASP154 d, SER576 d, ARG192 d, LYS664 d, ARG661 d, ASP660 d, THR266 d, LYS575 d, ARG482 d |
a Total number of residual hydrophobic amino acids involved in the interaction between the receptor and the candidate microRNAs; b Total number of aromatic amino acids involved in the interaction between the receptor and the candidate microRNAs; c Total number of hydrogen bond observed in the interaction between the receptor and the candidate microRNAs; d The residual amino acids of the receptor protein common to more than one interaction between microRNA binding to receptor; e The residual amino acids of the receptor protein common to all the microRNA binding to AGO.
Table 8.
Hydrogen bond interaction between the amino acid residues of the receptor and the candidate microRNAs within the distance of 2.0 Å.
Table 8.
Hydrogen bond interaction between the amino acid residues of the receptor and the candidate microRNAs within the distance of 2.0 Å.
| microRNA | AA Residues | Atoms | Distance | NA Residues |
|---|---|---|---|---|
| miR-1 | GLN84 | HE21-OP1 | 1.8 | (G3) |
| ARG574 | HH11-O3’ | 1.7 | (G12) | |
| ALA111 | HA-O2’ | 1.9 | (G16) | |
| PRO36 | O-H4’ | 1.8 | (G2) | |
| ASP154 | OD1-H5’ | 2.0 | (A11) | |
| O-H4′ | 2.0 | (G2) | ||
| miR-2 | GLY104 | HA3-O6 | 1.8 | (G15) |
| ARG114 | HD3-O4’ | 1.6 | (G19) | |
| ARG574 | HD3-OP1 | 1.5 | (A10) | |
| GLU483 | OE1-H5 | 2.0 | (A8) | |
| ARG59 | O-H4’ | 1.9 | (A17) | |
| miR-3 | ARG548 | HH11-O2’ | 1.9 | (A17) |
| ARG574 | HH22-O4’ | 1.9 | (G) | |
| VAL129 | O-HO5’ | 1.8 | (A1) | |
| ASP154 | OD1-HO2’ | 1.6 | (A13) | |
| PRO44 | HA-O3’ | 2.0 | (C4) | |
| GLY577 | HA2-O2’ | 2.0 | (A14) | |
| ARG661 | HA-O2’ | 1.9 | (U19) | |
| GLU622 | OE1-H5’ | 1.8 | (G9) | |
| ASP660 | O-H2’ | 2.0 | (U19) | |
| miR-4 | ARG668 | HH12-O5’ | 1.8 | (G1) |
| ARG615 | HD2-OP2 | 2.0 | (A12) | |
| THR266 | OG1-H5’ | 2.0 | (G8) | |
| miR-5 | LYS575 | HZ1-O2 | 1.9 | (U6) |
| ARG661 | HE-O4’ | 1.9 | (U4) | |
| ARG574 | HD2-O4’ | 2.0 | (A8) | |
| SER576 | H-O2 | 2.0 | (C7) |
Table 9.
Docking scores between miRNA-mRNA and AGO protein.
| miRNA-mRNA and AGO | Score | Area | ACE |
|---|---|---|---|
| miR-1-HOXB13-AGO | 24046 | 3962.90 | −851.20 |
| miR-2-BAMBI-AGO | 24380 | 5528.70 | −966.63 |
| miR-3-SOD2-AGO | 27570 | 3974.80 | −652.52 |
| miR-4-BARD1–AGO | 24816 | 3524.00 | −836.85 |
| miR-5-TP53-AGO | 23716 | 3402.30 | −547.97 |
Score indicates the geometric shape complementary score and ACE score generated for each miRNA-mRNA and AGO complex. miRNA, microRNA; AGO, argonaute; ACE, atomic contact energy.
Table 10.
Amino acid residues of the binding pocket of the argonaute protein involved in the molecular interaction with the microRNA-mRNA complex (3.5 Å).
Table 10.
Amino acid residues of the binding pocket of the argonaute protein involved in the molecular interaction with the microRNA-mRNA complex (3.5 Å).
| miRNA-mRNA | Residual Hydrophobic AA | Aromatic AA |
|---|---|---|
| miR1-HOXB13 | (34 a), VAL42 c, LEU45 d, LEU132 c, ALA133 c, VAL147 c, ALA151 c, VAL152 c, ALA170 c, ILE173 c, VAL264 c, LEU265 d, LEU267 d, LEU277 c, LEU279 c, LEU281 c, ALA331 c, ALA414 c, ILE434 c, ALA479 c, VAL549 c, VAL573 c, VAL606 c, LEU617 c, ALA644 c, LEU652 c, VAL663 c, VAL685 c | (8 b), TYR43 d, TYR135 c, TRP202 d, TRP415 c, TYR642 c, PHE647 c, PHE649 d |
| miR-2-BAMBI | (38 a), VAL42 c, LEU45 d, LEU46 c, ALA47 c, ALA50 c, VAL58 c, ALA111 c, LEU132 c, VAL264 c, LEU265 d, LEU267 d, LEU277 c, ALA331 c, ALA414 c, LEU435 c, LEU439 c, ALA479 c, VAL549 c, ALA648 c, VAL663 c. | (12 b), TYR43 d, TRP202 d, TRP415 c, TRP447 c, PHE487 c, PHE610 c, PHE647 c, PHE649 d |
| miR-3-SOD2 | (24 a), VAL42 c, LEU45 d, LEU46 c, ALA47 c, VAL58 c, ALA111 c, LEU132 c, ALA133 c, VAL152 c, ALA170 c, ILE173 c, LEU265 d, LEU267 d, LEU279 c, LEU281 c, VAL606 c, LEU617 c, ALA648 c, LEU652 c | (9 b), TYR43 d, TYR171 c, TRP202 d, TRP415 c, PHE487 c, PHE647 c, PHE649 d |
| miR-4-BARD1 | (23 a), VAL42 c, LEU45 d, VAL147 c, VAL152 c, ALA170 c, ILE173 c, VAL264 c, LEU265 d, LEU267 d, LEU277 c, ALA278 c, LEU279 c, LEU281 c, ILE434 c, LEU435 c, ALA450 c, VAL573 c, VAL606 c, ALA644 c, ALA648 c, LEU652 c, VAL685 c | (10 b), TYR43 d, TYR135 c, TYR171 c, TRP202 d, TRP447 c, PHE487 c, PHE610 c, TYR642 c, PHE649 d |
| miR-5-TP53 | (30 a), LEU45 d, ALA47 c, ALA50 c, VAL58 c, ALA111 c, LEU132 c, ALA133 c, VAL147 c, ALA151 c, VAL152 c, ALA170 c, ILE173 c, VAL264 c, LEU265 d, LEU267 d, LEU277 c, ALA278 c, LEU279 c, LEU281 c, ILE434 c, LEU435 c, LEU439 c, ALA450 c, VAL606 c, LEU617 c, ALA644 c, ALA648 c, LEU652 c, VAL685 c | (10 b), TYR43 d, TYR135 c, TYR171 c, TRP202 d, TRP447 c, PHE610 c, TYR642 c, PHE647 c, PHE649 d |
AA- amino acid; a Total hydrophobic residual amino acid involved in docking interaction; b Total aromatic ring containing amino acid residues with aromatic rings; c The residual amino acid of the receptor involved in interaction common to more than one complex interaction; d The residual amino acids of the receptor protein common to all the microRNA-mRNA binding to AGO.
© 2019 by the authors. Licensee MDPI, Basel, Switzerland. This article is an open access article distributed under the terms and conditions of the Creative Commons Attribution (CC BY) license (http://creativecommons.org/licenses/by/4.0/).
Share and Cite
MDPI and ACS Style
Fadaka, A.O.; Pretorius, A.; Klein, A. MicroRNA Assisted Gene Regulation in Colorectal Cancer. Int. J. Mol. Sci. 2019, 20, 4899. https://0-doi-org.brum.beds.ac.uk/10.3390/ijms20194899
AMA Style
Fadaka AO, Pretorius A, Klein A. MicroRNA Assisted Gene Regulation in Colorectal Cancer. International Journal of Molecular Sciences. 2019; 20(19):4899. https://0-doi-org.brum.beds.ac.uk/10.3390/ijms20194899
Chicago/Turabian StyleFadaka, Adewale O., Ashley Pretorius, and Ashwil Klein. 2019. "MicroRNA Assisted Gene Regulation in Colorectal Cancer" International Journal of Molecular Sciences 20, no. 19: 4899. https://0-doi-org.brum.beds.ac.uk/10.3390/ijms20194899
Note that from the first issue of 2016, this journal uses article numbers instead of page numbers. See further details here.