Article

Type 1 FSHD with 6–10 Repeated Units: Factors Underlying Severity in Index Cases and Disease Penetrance in Their Relatives Attention

1
Reference Center of Neuromuscular disorders and ALS, Timone University Hospital, AP-HM, 264 rue Saint-Pierre, Cedex 05 13385 Marseille, France
2
Medical Genetics, Aix Marseille Université—Inserm UMR_1251, 13005 Marseille, France
3
Service de Neurologie et d’explorations fonctionnelles, Centre Hospitalier Universitaire de Toulouse, 31000 Toulouse, France
4
Reference Center of Neuromuscular Disorders AOC, Bordeaux University Hospitals, 33000 Bordeaux, France
5
Electroneuromyography and Neuromuscular Department, GHE Neurologic Hospital, Cedex 69677 Lyon-Bron, France
6
Neurogenetic Department, GHN Croix-Rousse Hospital, 69004 Lyon, France
7
Neuromuscular Disease Specialized Center, Nice University Hospital, 06000 Nice, France
8
Neurology Department, APHP, CHU de Bicêtre, 78 rue du Général Leclerc, Cedex 94276 Le Kremlin-Bicêtre, France
9
Nerve-Muscle Unit, Department of Clinical Neurosciences, Lausanne University, Hospital (CHUV), Lausanne 1002, Switzerland
*
Author to whom correspondence should be addressed.
Int. J. Mol. Sci. 2020, 21(6), 2221; https://0-doi-org.brum.beds.ac.uk/10.3390/ijms21062221
Submission received: 27 January 2020 / Revised: 20 March 2020 / Accepted: 21 March 2020 / Published: 23 March 2020
(This article belongs to the Special Issue Epigenetic Alterations in Neuromuscular Disorders)

Abstract

:
Molecular defects in type 1 facioscapulohumeral muscular dystrophy (FSHD) are caused by a heterozygous contraction of the D4Z4 repeat array from 1 to 10 repeat units (RUs) on 4q35. This study compared (1) the phenotype and severity of FSHD1 between patients carrying 6–8 vs. 9–10 RUs, (2) the amount of methylation in different D4Z4 regions between patients with FSHD1 with different clinical severity scores (CSS). This cross-sectional multicenter study was conducted to measure functional scales and for genetic analysis. Patients were classified into two categories according to RUs: Group 1, 6–8; Group 2, 9–10. Methylation analysis was performed in 27 patients. A total of 99 carriers of a contracted D4Z4 array were examined. No significant correlations between RUs and CSS (r = 0.04, p = 0.73) and any of the clinical outcome scales were observed between the two groups. Hypomethylation was significantly more pronounced in patients with high CSS (>3.5) than those with low CSS (<1.5) (in DR1 and 5P), indicating that the extent of hypomethylation might modulate disease severity. In Group 1, the disease severity is not strongly correlated with the allele size and is mostly correlated with the methylation of D4Z4 regions.

1. Introduction

Facioscapulohumeral muscular dystrophy (FSHD1; OMIM 158900) is a common form of muscular dystrophy, affecting 1 in 20,000 to 1 in 8000 people, characterized by asymmetric and progressive weakness of the facial, shoulder girdle, and upper arm muscles [1,2,3,4], but often also with subsequent lower limb involvement. FSHD is an autosomal dominant disorder with variable severity, inter- and intra-familial heterogeneity [5], and incomplete penetrance. Its molecular genetic basis is highly complex [6]. The disease locus was mapped to the subtelomeric region of the long arm of chromosome 4q35, according to the genetic linkage analysis [7]. The molecular defect of type 1 FSHD (FSHD1) results from a heterozygous contraction of the D4Z4 repeat array from 1 to 10 repeat units (RUs) on 4q35. D4Z4 contraction is considered pathogenic if it occurs on a specific chromosomal background, i.e., (i) the presence of a 4qA haplotype and (ii) a single nucleotide polymorphism that creates a polyadenylation site for the distal DUX4 transcript [8,9,10]. The pathological cut-off is conventionally determined at 10 RUs, and the majority of patients with FSHD1 carry 1–8 RUs on one allele [11]. Large studies provided data on the expressivity and penetrance in the 1–6 RU range; however, the size of the D4Z4 allele could not predict the severity of clinical outcomes at all times [12,13,14], and only a few studies reported the phenotypic spectrum associated with larger pathological alleles (>6 RUs) [11]. In FSHD1, the reduced size of the D4Z4 array is associated with hypomethylation of the repetitive element, whereas in FSHD2, decreased DNA methylation is more pronounced and often segregates with SMCHD1 gene mutation on chromosome 18p [15]. Changes in this epigenetic mark have been associated with the clinical expression of FSHD1 [1,16], and in a subset of patients carrying borderline D4Z4 arrays and SMCHD1 mutations [17].
Our previous study [18] has shown that the penetrance was lower in patients with 9–10 RUs than in those with 6–8 RUs. Here, we aimed at comparing the phenotype and severity between patients with FSHD1 carrying 6–8 RUs and those carrying 9–10 RUs. In addition, the level of methylation in different D4Z4 regions was compared between patients with FSHD1 with different clinical severities to identify the main factor (i.e., RUs or methylation) associated with the disease severity in patients with 6–10 RUs. Through a multivariate analysis and a binary logistic regression, we also tried to identify how several factors synergistically influence CSS.

2. Results

2.1. Patient Demographic Characteristics

A total of 99 carriers of a contracted D4Z4 array (65 index cases and 34 relatives) from 65 unrelated families were examined, and 62 (62.6%) of them were men. The number of patients (ICs) in Group 1 (6–8 RUs) was 49 (75.4%) and in Group 2 (9–10 RUs), 16 (24.6%). The mean ± standard deviation age of patients was 51 ± 15.8 (Group 1, 51.2 ± 14.2; Group 2, 51.3 ± 17.6; p = 0.34) years. The number of women in Group 1 (ICs) was 14 (28.6 %), and in Group 2, 7 (43.8 %).

2.2. Age of Onset, RUs, and CSS

In index cases, the mean age at diagnosis was 44.2 ± 15.9 (Group 1, 44.1 ± 15.4; Group 2, 44.6 ± 18.1; p = 0.94) years. The mean age at the onset of upper limb weakness was 33.4 ± 17.0 (Group 1, 34.0 ± 17.6; Group 2, 34.0 ± 15.8; p = 0.95) years and that of the lower limbs was 41.4 ± 15.7 (Group 1, 41.7 ± 15.8; Group 2, 40.1 ± 16.2; p = 0.96) years. RUs were not significantly correlated with CSS (r = 0.17, p = 0.51) as well as adjusted mini motor test sum (SMMT) (r = 0.04, p = 0.71).

2.3. Comparison of Clinical Data Between the Two Groups

Results of the comparison between the two groups according to RUs are summarized in Table 1. No significant difference was observed in terms of any clinical evaluations between the two groups including adjusted SMMT, CSS, Brooke, Gardner, Brooke/Gardner sum-score, MFM score, Time to Walk 10 m, Time to climb 4 steps, Time of Barré (s), Time of Mingazzini (s), ABDUR, ABDUL, ANTER, and ANTEL (Table 1).
In addition, no significantly different frequency of abdominal weakness (χ² = 0.98, p = 0.32), facial involvement (χ² = 1.28, p =0.26), asymmetrical weakness (χ² = 0.18, p = 0.67), and steppage gait (χ² = 0.43, p = 0.51) was observed between the two groups. Remarkably, seven patients (10.8%) were wheelchair users with a higher proportion of patients in Group 1 vs. Group 2 (6/1), but the difference did not reach significance.

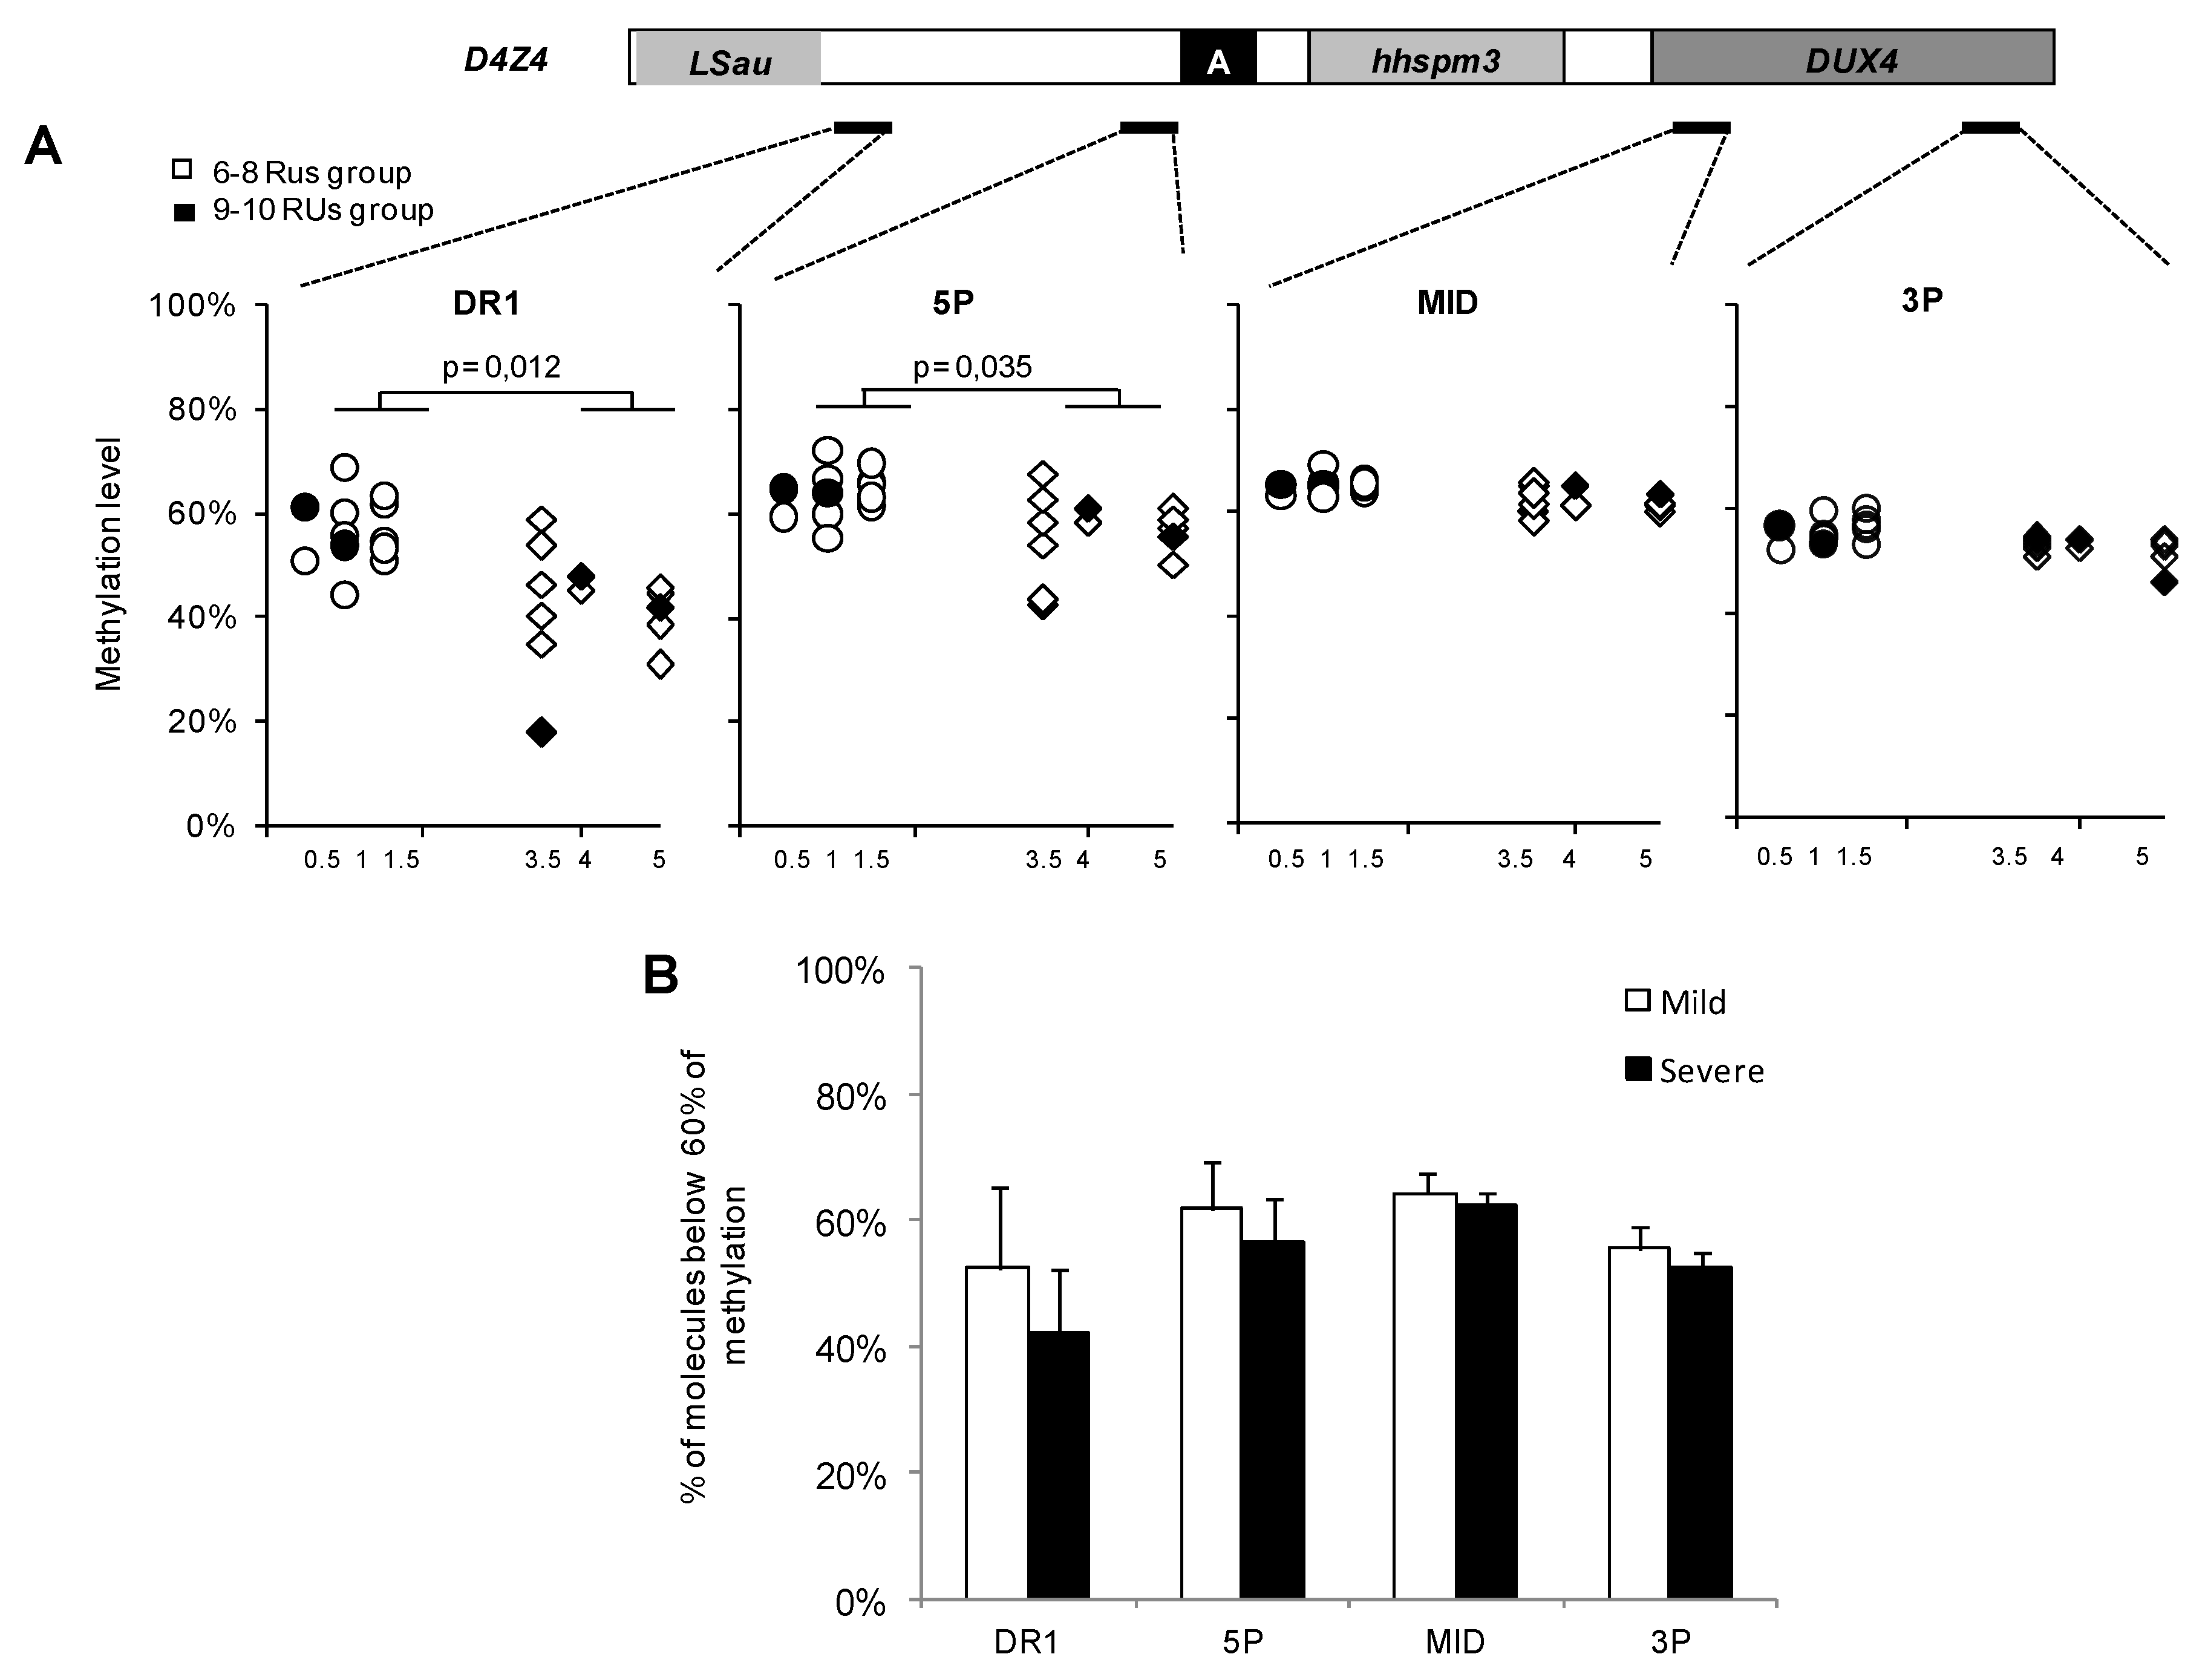
2.4. Association Between FSHD Severity DNA Methylation

DNA methylation has been proposed as a potential modifier of FSHD severity. To test this association in our cohort, we analyzed D4Z4 methylation profile in an equivalent number of randomly selected severely affected patients on the one hand (clinical score, 3.5–5 in 13 samples), and patients who are mildly affected on the other hand (clinical score, 0.5–1.5 in 14 samples), i.e. 27 patients among the 99 cases included in the study.
Figure 1 displays the percentage of methylation in patients with a low severity score (<1.5) compared to patients with a high severity score (>3.5) (panel A). DNA methylation was assessed for four regions across D4Z4, the DR1, and 5P sequences, which are differentially methylated in the disease and the MID and 3P sequences for which stable methylation has been reported [19]. We also report the percentage of DNA molecules with low methylation levels (i.e., the percentage of molecules showing a level of methylation <60%, panel B). By analyzing the global percentage of methylation in the two categories, we observed that hypomethylation was more significantly pronounced in patients with a high severity score than in those with a low severity score for the proximal D4Z4 region (DR1 and 5P), suggesting that in these two groups, hypomethylation might be associated with disease severity.
We then calculated the correlation between CSS and methylation level. Although on a small subgroup of patients, significant correlations were found with different parameters. The correlation coefficient between CSS and global methylation level (%) for different D4Z4 regions was significant: DR1: r = −0.47, p = 0.01; 5P: r = −0.42, p = 0.03; MID: r = −0.51, p = 0.01; 3P: r = −0.43, r = 0.03 (Table 2). The correlation between CSS and the percentage of hypomethylated molecules was solely significant in the DR1 region: r = 0.42, p = 0.03 (Table 2).
To test whether functional parameters used for patients assessment might be associated with methylation changes, we calculated the correlation between DNA methylation and functional scores of Brooke, Gardner, and time to walk 10 min, time to climb 4 steps, time of Barré, time of Mingazzini, ABDUR, ABDUL, ANTER, and ANTEL (Table 2). The time of Barré was significantly positively correlated with the percentage of methylation in DR1, 5P, MID, and 3P. However, no significant correlation was observed between the amount of methylation and other scores (Table 2). Further investigations on a larger cohort of samples would be required to ascertain the link between DNA methylation, functional parameters, disease severity, and the number of residual repeats.

3. Discussion

The contraction of D4Z4 repeats at the 4q35 locus has been associated with FSHD1. Upon contraction, the size of the residual array has been considered as a determinant in the clinical phenotype, age of onset, and disease severity. However, given the variability of disease presentation among patients, incomplete penetrance, and familial heterogeneity, genotype–phenotype correlations remain a challenge for genetic counseling or prediction of the clinical disease progression.
In this cross-sectional multicenter study, the phenotype–genotype correlation was evaluated in 99 patients carrying contracted alleles of 6−10 RUs corresponding to 65 unrelated families. Our previous study [18] reported that penetrance in this range of alleles was low (57%) and incomplete. Furthermore, penetrance was found to be lower in patients with 9–10 RUs (47%) than in those with 6–8 RUs (62%), as described in other reports [11,12]. However, although penetrance inversely decreases with the number of RUs, the RU number does not predict the clinical severity in patients with 6–10 RUs. Based on our results, the phenotype–genotype correlation in patients with FSHD1 with higher RUs is not as obvious as in patients with lower RUs. Due to differences in disease severity, from the absence of clinical alterations to more severe clinical outcomes in patients with higher RUs, this range may be considered as a gray zone for the phenotype–genotype correlation, for which factors, other than the number of RUs, are involved in the disease severity.
Genotype–phenotype correlation. Regarding the D4Z4 repeat number, the correlation between clinical severity and RUs has been found, with individuals carrying 1–3 RUs typically representing the most severe end of the disease spectrum with earlier onset and more severe disease presentations [20,21,22,23]. However, differences in disease severity have been reported in patients carrying a short allele (1–3 RUs), ranging from very severe to milder forms or asymptomatic carriers [24,25]. Two recent studies have reported that the size of contracted alleles has no definitive prognostic value for disease severity [12,13], and a short 1–3 RUs allele was not always predictive of a severe clinical outcome with relatives carrying an allele of 1–3 RUs, exhibiting clinical variability from healthy subjects to patients with severe motor impairment [13]. At the other end of the spectrum, patients with contracted alleles of 7–10 RUs have been suggested to have a milder and later phenotype [11], with the possible exception of patients carrying a mutation in a modifier gene such as SMCHD [17], or patients inheriting an additional neuromuscular condition coincidentally [26,27].
In agreement, in a prospective cross-sectional observational study of 74 clinically affected patients with FSHD1, clinical severity measurements (measured by sum score MMT) between patients with 1–6 D4Z4 repeats and 7–10 repeats demonstrated that the residual repeat size in patients with 1–6 repeats had a linear effect on clinical severity, which was not found in those with 7–10 repeats [11]. However, thus far, no consistent correlation was found between fragment size and age at which ambulation was lost. [20]. Interestingly, in a Chinese cohort of 178 patients with 1–9 RUs, a significant typical inverse correlation was found between the EcoRI fragment size and clinical severity score [28], suggesting that differences might also depend on the size range considered for correlation analyses.
FSHD severity and DNA methylation. It recently became evident that the SMCHD1 epigenetic modifier has a role in FSHD [29], as well as in the regulation of D4Z4 methylation [30]. Although we did not evaluate methylation in all patients, hypomethylation was overall more significant in patients randomly selected in the two subgroups tested, i.e., patients with a high severity score (CSS >3.5) as compared to patients with a low severity score (CSS <1.5), particularly for the proximal D4Z4 region (DR1 and 5P). Significant correlations were found between the global amount of methylation and CSS, suggesting that the level of methylation might contribute to disease severity [31]. However, we found that RUs were not significantly associated with CSS, indicating that the FSHD severity is hardly predictable in patients with 6–10 RUs. DNA methylation was not tested in the group of patients with an intermediate score of severity, but by randomly selecting patients in the “low” and “high” severity score groups, disease severity was found to be correlated with DNA methylation.
Compared to healthy individuals or asymptomatic carriers, D4Z4 methylation is lower in patients with FSHD1 and more markedly decreased in patients with FSHD2. [16,31,32]. Due to the inclusion of both small and large families, our study has some limitations. There was a high proportion of index cases among affected carriers. We may suppose that index cases are more severe than carriers’ relatives. This is a bias for analysis of the severity.
The bivariate correlation analysis showed that all the potential CSS predictive factors are independent. Despite the fact that the full model containing all predictors (four percentage of methylation variables) was significant (chi2 = 5.53, p = 0.02), the only percentage of methylation of the 3P region could make a statistically significant contribution to the model recording an odds ratio of 0.71 (p = 0.049).
In conclusion, our study indicates that the disease severity is not strongly correlated with the size of the allele (RUs) in the upper range of RUs in FSHD1 (6–10 RUs), but that the level of methylation might be more variable in severely affected patients compared to mildly affected cases. However, these results have to be taken with caution, and even if a global trend is observed when comparing the two groups of patients, the use of DNA methylation as a prognostic marker at the individual level remains difficult. This further highlights the need of a complete understanding on the role and regulation of this epigenetic modification in the disease.

4. Materials and Methods

4.1. Patients

A cross-sectional multicenter study was conducted in 6 French and 1 Swiss neuromuscular center (for more information, see Campana-Salort et al. Orphanet J Rare Dis 2015) [18]. Among 65 FSHD1 families, examined in the reference centers from 2007 to 2009, 184 subjects were included in the study. All patients had a clinical examination by expert neurologists. All index cases (IC) harbored a 4qA contracted allele. Among the 119 relatives, 59 were carriers of the D4Z4 contraction identified in the IC, and 60 were non-carriers. Among the 59 carriers’ relatives, based on clinical examination by expert neurologists, 34 were defined as clinically affected carriers, and 25 were unaffected carriers. Individuals carrying a contracted D4Z4 array with an estimated size of 6 RUs (27kb) to 10 RUs (40 kb) (index cases; IC, n= 65) and their clinically affected carriers’ relatives (n = 34) were selected. For ethical considerations, patients younger than 18 years of age or pregnant women were not included.
All patients enrolled provided informed consent to participate in the study. This study was approved by the local ethics committee (Comité de Protection des Personnes Sud Mediterranée I).

4.2. Clinical and Functional Evaluation

Neurologists performed clinical examination of all relatives blinded to their genetic results, and the status (clinical affected or asymptomatic carriers) were defined based on the clinical examination. For each patient, the following data were recorded: Medical history, pedigree, clinical examination, functional assessment, and manual muscular test results. The first symptom experienced and the age of onset was recorded for ICs only.
Neurologists examined the presence or absence of scapular winging, facial, limb, and thoracoabdominal muscle weakness, selective involvement, and asymmetry of muscle weakness. The functional evaluation included manual muscle testing (MMT, according to Medical Research Council), clinical severity scale (CSS) [20]. Motor Function Measure scale (MFM) [33], and functional grades of Brooke and Vignos scales for the upper limb [34], and Gardner-Medwin Walton (Gardner) for the lower limbs [35]. Timed motor tests were also performed including the time to walk 10 min, climb 4 steps, tests of time of Barré (position of arms stretched forward to be maintained), time of Mingazzini (supine, legs flexed), degree of upper limb abduction and anterior flexion (right upper limb abduction [ABDUR], left upper limb abduction [ABDUL], right upper limb anterior flexion [ANTER], and left upper limb anterior flexion [ANTEL]). The shoulder range of motion was categorized into 4 grades: 1, 0–45°; 2, 46–90°; 3, 91–135°; and 4, 136–180°.
Sum-score MMT (SMMT) was used to measure the strength in 36 muscle groups according to the MRC scale (graded from 0 to 5) and 4 muscle groups of the face (graded from 0 to 3). Normal SMMT is 242, the total scores of 40 muscles examined.
To adjust for the difference in age among patients, the SMMT score was divided according to patients’ age to obtain an overall rate: Adjusted SMMT= (242-SMMT) × 100/age (lower values of adjusted score corresponding to a better test result).

4.3. Genetic Testing/Methylation Profile Analysis

All genetic analyses were performed at the Laboratory of Molecular Genetics in the Department of Medical Genetics in Marseille by Molecular Combing or Southern blotting, as previously described [18]. Patients were arbitrarily divided into 2 categories according to RUs: Group 1, 6–8 RUs, and Group 2, 9–10 RUs.
To determine whether clinical severity was associated with DNA methylation changes, this epigenetic mark was analyzed in the 2 subgroups: Severely affected (CSS between 3.5 and 5) and mildly affected (CSS between 0.5 and 1.5) using the blood DNA after the chemical modification with sodium bisulfite and deep sequencing for a total of 27 patients randomly selected out of the 99 included in the study. For each sample, 4 different regions within D4Z4 were analyzed [16,36]. For each region, thousands of DNA molecules were sequenced on average, with global coverage of 82%.
The level of methylation was calculated as the mean methylation level for all CpG in a given sequence for all DNA molecules analyzed, as described in Roche et al. [19]. All 4q alleles were analyzed for 4 different regions across D4Z4 (DR1, 5P, Mid, and 3P) with 3 two different regions, which were invariable in the different context (healthy individuals, affected patients, MID and 3P) and for which DNA methylation was not subjected to changes depending on the number of copies as described in Roche et al. [19]

4.4. Statistical Analyses

For data analyses, the R Studio software (R version 3.1.2) was used. Shapiro–Wilk was used to determine the normal distribution of data. Since clinical measurements did not follow a normal distribution, the Mann–Whitney test was used to compare the clinical outcome measures between the two groups (6–8 vs. 9–10 RUs). To compare the categorical data (i.e., abdominal weakness, facial involvement, asymmetrical weakness, and steppage gait), the chi-square test (χ² test) was used. In addition, the correlation between RUs and age of onset in the upper and lower limbs, as well as the correlation between methylation values and clinical scores, was measured using the Spearman correlation analysis. To compare the percentage of methylation in patients with a low severity score (CSS <1.5) to patients with a high severity (CSS >3.5), the Mann–Whitney test was used. Data were reported as median with a confidence interval (25–75 percentile). Differences were considered significant for all analyses when the p-values were <0.05. To assess the influence of the different factors on the disease severity, we performed a binary logistic regression, as the CSS does not follow the abnormal distribution. We conducted a bivariate correlation analysis (Spearman correlation analysis) between CSS and factors such as age at the onset, sex, RUs, and D4Z4 methylations, and we considered factors with correlation significance < 0.1 in the logistic regression equation.

Author Contributions

E.S.-C. recruited patients, performed the neurological examination, analyzed the data, and wrote the paper. F.F. recruited patients, performed the neurological examination, analyzed the data, conducted and performed the statistical analysis, and wrote the paper. S.B.-D. participated in the writing of the paper and its critical reading. K.N. and R.B. performed genetic consulting and analysis, analyzed the data, and revised the manuscript. S.R. contributed to the genetic analysis. P.C., E.O., S.S., G.S., F.B., S.C., A.E.-L., J.N., and T.K. recruited patients, performed the neurological examination, and analyzed the data. N.L. contributed to the genetic consulting and analysis, analyzed the data, and revised the manuscript. F.M. contributed to the study design, performed the genetic and statistical analyses, analyzed the data, and wrote the paper. S.A. was the principal investigator, designed and coordinated the project, recruited patients, performed the neurological examination, analyzed the data, and wrote the paper. All authors read and approved the final manuscript.

Funding

This work was supported by a grant from the AFM-Téléthon (Association Française contre les Myopathies) (N°10906).

Acknowledgments

We would like to warmly thank all patients and their families for participation.

Conflicts of Interest

The authors declare no conflict of interest.

Abbreviations

ABDULLeft Upper Limb Abduction
ABDULRight Upper Abduction
ANTELLeft Upper Limb Anterior Flexion
ANTERRight Upper Limb Flexion
CSSClinical Severity Score
FSHDMuscular Facioscapulohumeral Dystrophy
ICIndex case
MFMMotor Function Measure
RURepeat Unit
SMMTMini Motor Test Sum

References

  1. Lemmers, R.J.L.F.; Van Der Vliet, P.J.; Klooster, R.; Sacconi, S.; Camaño, P.; Dauwerse, J.G.; Snider, L.; Straasheijm, K.R.; Van Ommen, G.J.; Padberg, G.W.; et al. A Unifying Genetic Model for Facioscapulohumeral Muscular Dystrophy. Science 2010, 329, 1650–1653. [Google Scholar] [CrossRef] [PubMed] [Green Version]
  2. Padberg, G.; Lunt, P.; Koch, M.; Fardeau, M. Diagnostic criteria for facioscapulohumeral muscular dystrophy. Neuromuscul. Disord. 1991, 1, 231–234. [Google Scholar] [CrossRef]
  3. Tawil, R.; Van Der Maarel, S.M.; Padberg, G.W.; Van Engelen, B. 171st ENMC International Workshop: Standards of care and management of facioscapulohumeral muscular dystrophy. Neuromuscul. Disord. 2010, 20, 471–475. [Google Scholar] [CrossRef]
  4. Deenen, J.C.; Arnts, H.; Van Der Maarel, S.M.; Padberg, G.W.; Verschuuren, J.J.; Bakker, E.; Weinreich, S.S.; Verbeek, A.L.; Van Engelen, B.G. Population-based incidence and prevalence of facioscapulohumeral dystrophy. Neurology 2014, 83, 1056–1059. [Google Scholar] [CrossRef] [Green Version]
  5. Mostacciuolo, M.; Pastorello, E.; Vazza, G.; Miorin, M.; Angelini, C.; Tomelleri, G.; Galluzzi, G.; Trevisan, C.P. Facioscapulohumeral muscular dystrophy: epidemiological and molecular study in a north-east Italian population sample. Clin. Genet. 2009, 75, 550–555. [Google Scholar] [CrossRef] [PubMed]
  6. Ferri, G.; Huichalaf, C.H.; Caccia, R.; Gabellini, D. Direct interplay between two candidate genes in FSHD muscular dystrophy. Hum. Mol. Genet. 2014, 24, 1256–1266. [Google Scholar] [CrossRef] [Green Version]
  7. Sarfarazi, M.; Wijmenga, C.; Upadhyaya, M.; Weiffenbach, B.; Hyser, C.; Mathews, K.; Murray, J.; Gilbert, J.; Pericak-Vance, M.; Lunt, P.; et al. Regional mapping of facioscapulohumeral muscular dystrophy gene on 4q35: Combined analysis of an international consortium. Am. J. Hum. Genet. 1992, 51, 396–403. [Google Scholar]
  8. Feeney, S.J.; McGrath, M.J.; Sriratana, A.; Gehrig, S.M.; Lynch, G.S.; D’Arcy, C.E.; Price, J.T.; McLean, C.A.; Tupler, R.; Mitchell, C.A. FHL1 Reduces Dystrophy in Transgenic Mice Overexpressing FSHD Muscular Dystrophy Region Gene 1 (FRG1). PLoS ONE 2015, 10, e0117665. [Google Scholar] [CrossRef] [Green Version]
  9. Van Der Maarel, S.M.; Miller, D.; Tawil, R.; Filippova, G.N.; Tapscott, S.J. Facioscapulohumeral muscular dystrophy: consequences of chromatin relaxation. Curr. Opin. Neurol. 2012, 25, 614–620. [Google Scholar] [CrossRef] [Green Version]
  10. Ehrlich, M.; Lacey, M. Deciphering transcription dysregulation in FSH muscular dystrophy. J. Hum. Genet. 2012, 57, 477–484. [Google Scholar] [CrossRef]
  11. Statland, J.M.; Donlin-Smith, C.M.; Tapscott, S.J.; Lemmers, R.J.L.F.; van der Maarel, S.M.; Tawil, R. Milder phenotype in facioscapulohumeral dystrophy with 7–10 residual D4Z4 repeats. Neurology 2015, 85, 2147–2150. [Google Scholar]
  12. Ricci, G.; Scionti, I.; Sera, F.; Govi, M.; D’Amico, R.; Frambolli, I.; Mele, F.; Filosto, M.; Vercelli, L.; Ruggiero, L.; et al. Large scale genotype-phenotype analyses indicate that novel prognostic tools are required for families with facioscapulohumeral muscular dystrophy. Brain 2013, 136, 3408–3417. [Google Scholar] [CrossRef] [PubMed] [Green Version]
  13. Nikolic, A.; Ricci, G.; Sera, F.; Bucci, E.; Govi, M.; Mele, F.; Rossi, M.; Ruggiero, L.; Vercelli, L.; Ravaglia, S.; et al. Clinical expression of facioscapulohumeral muscular dystrophy in carriers of 1–3 D4Z4 reduced alleles: experience of the FSHD Italian National Registry. BMJ Open 2016, 6, e007798. [Google Scholar] [CrossRef] [PubMed] [Green Version]
  14. Scionti, I.; Greco, F.; Ricci, G.; Govi, M.; Arashiro, P.; Vercelli, L.; Berardinelli, A.; Angelini, C.; Antonini, G.; Cao, M.; et al. Large-Scale Population Analysis Challenges the Current Criteria for the Molecular Diagnosis of Fascioscapulohumeral Muscular Dystrophy. Am. J. Hum. Genet. 2012, 90, 628–635. [Google Scholar] [CrossRef] [Green Version]
  15. Daxinger, L.; Tapscott, S.J.; Van Der Maarel, S.M. Genetic and epigenetic contributors to FSHD. Curr. Opin. Genet. Dev. 2015, 33, 56–61. [Google Scholar] [CrossRef] [PubMed] [Green Version]
  16. Gaillard, M.-C.; Roche, S.; Dion, C.; Tasmadjian, A.; Bouget, G.; Salort-Campana, E.; Vovan, C.; Chaix, C.; Broucqsault, N.; Morère, J.; et al. Differential DNA methylation of the D4Z4 repeat in patients with FSHD and asymptomatic carriers. Neurology 2014, 83, 733–742. [Google Scholar] [CrossRef]
  17. Sacconi, S.; Lemmers, R.J.; Balog, J.; Van Der Vliet, P.J.; Lahaut, P.; Van Nieuwenhuizen, M.P.; Straasheijm, K.R.; Debipersad, R.D.; Vos-Versteeg, M.; Salviati, L.; et al. The FSHD2 Gene SMCHD1 Is a Modifier of Disease Severity in Families Affected by FSHD1. Am. J. Hum. Genet. 2013, 93, 744–751. [Google Scholar] [CrossRef] [Green Version]
  18. Emmanuelle, S.; Nguyen, K.; Bernard, R.; Jouve, E.; Solé, G.; Nadaj-Pakleza, A.; Niederhauser, J.; Charles, E.; Ollagnon, E.; Bouhour, F.; et al. Low penetrance in facioscapulohumeral muscular dystrophy type 1 with large pathological D4Z4 alleles: a cross-sectional multicenter study. Orphanet J. Rare Dis. 2015, 10, 2. [Google Scholar]
  19. Roche, S.; Dion, C.; Broucqsault, N.; Laberthonnière, C.; Gaillard, M.-C.; Robin, J.D.; Lagarde, A.; Puppo, F.; Vovan, C.; Chaix, C.; et al. Methylation hotspots evidenced by deep sequencing in patients with facioscapulohumeral dystrophy and mosaicism. Neurol. Genet. 2019, 5, e372. [Google Scholar] [CrossRef] [Green Version]
  20. Ricci, E.; Galluzzi, G.; Deidda, G.; Cacurri, S.; Colantoni, L.; Merico, B.; Piazzo, N.; Servidei, S.; Vigneti, E.; Pasceri, V.; et al. Progress in the molecular diagnosis of facioscapulohumeral muscular dystrophy and correlation between the number of KpnI repeats at the 4q35 locus and clinical phenotype. Ann. Neurol. 1999, 45, 751–757. [Google Scholar] [CrossRef]
  21. Tawil, R.; Forrester, J.; Griggs, R.; Mendell, J.; Kissel, J.; McDermott, M.; King, W.; Weiffenbach, B.; Figlewicz, D. The Fsh-Dy Group Evidence for anticipation and association of deletion size with severity in facioscapulohumerd muscular dystrophy. Ann. Neurol. 1996, 39, 744–748. [Google Scholar] [CrossRef] [PubMed]
  22. Lunt, P.W.; Jardine, P.E.; Koch, M.; Maynard, J.; Osborn, M.; Williams, M.; Harper, P.S.; Upadhyaya, M. Phenotypic-genotypic correlation will assist genetic counseling in 4q35-facioscapulohumeral muscular dystrophy. Muscle Nerve 1995, 18, S103–S109. [Google Scholar] [CrossRef]
  23. Goto, K.; Lee, J.; Matsuda, C.; Hirabayashi, K.; Kojo, T.; Nakamura, A.; Mitsunaga, Y.; Furukawa, T.; Sahashi, K.; Arahata, K. DNA rearrangements in Japanese facioscapulohumeral muscular dystrophy patients: clinical correlations. Neuromuscul. Disord. 1995, 5, 201–208. [Google Scholar] [CrossRef]
  24. Brouwer, O.F.; Padberg, G.W.; Wijmenga, C.; Frants, R.R. Facioscapulohumeral Muscular Dystrophy in Early Childhood. Arch. Neurol. 1994, 51, 387–394. [Google Scholar] [CrossRef] [PubMed]
  25. Sakellariou, P.; Kekou, K.; Fryssira, H.; Sofocleous, C.; Manta, P.; Panousopoulou, A.; Gounaris, K.; Kanavakis, E. Mutation spectrum and phenotypic manifestation in FSHD Greek patients. Neuromuscul. Disord. 2012, 22, 339–349. [Google Scholar] [CrossRef]
  26. Rudnik-Schöneborn, S.; Weis, J.; Kress, W.; Häusler, M.; Zerres, K. Becker’s muscular dystrophy aggravating facioscapulohumeral muscular dystrophy–double trouble as an explanation for an atypical phenotype. Neuromuscul. Disord. 2008, 18, 881–885. [Google Scholar] [CrossRef]
  27. Korngut, L.; Siu, V.M.; Venance, S.L.; Levin, S.; Ray, P.; Lemmers, R.J.; Keith, J.; Campbell, C. Phenotype of combined Duchenne and facioscapulohumeral muscular dystrophy. Neuromuscul. Disord. 2008, 18, 579–582. [Google Scholar] [CrossRef]
  28. Lin, F.; Wang, Z.-Q.; Lin, M.-T.; Murong, S.-X.; Wang, N. New Insights into Genotype-phenotype Correlations in Chinese Facioscapulohumeral Muscular Dystrophy: A Retrospective Analysis of 178 Patients. Chin. Med. J. 2015, 128, 1707–1713. [Google Scholar] [CrossRef]
  29. Dion, C.; Roche, S.; Laberthonnière, C.; Broucqsault, N.; Mariot, V.; Xue, S.; Gurzau, A.D.; Nowak, A.; Gordon, C.T.; Gaillard, M.-C.; et al. SMCHD1 is involved in de novo methylation of the DUX4-encoding D4Z4 macrosatellite. Nucleic Acids Res. 2019, 47, 2822–2839. [Google Scholar] [CrossRef] [Green Version]
  30. Jansz, N.; Chen, K.; Murphy, J.M.; Blewitt, M.E. The Epigenetic Regulator SMCHD1 in Development and Disease. Trends Genet. 2017, 33, 233–243. [Google Scholar] [CrossRef]
  31. Lemmers, R.J.; Goeman, J.J.; Van Der Vliet, P.J.; Van Nieuwenhuizen, M.P.; Balog, J.; Vos-Versteeg, M.; Camaño, P.; Arroyo, M.A.R.; Jerico, I.; Rogers, M.T.; et al. Inter-individual differences in CpG methylation at D4Z4 correlate with clinical variability in FSHD1 and FSHD2. Hum. Mol. Genet. 2014, 24, 659–669. [Google Scholar] [CrossRef] [PubMed] [Green Version]
  32. De Greef, J.C.; Frants, R.R.; Van Der Maarel, S.M. Epigenetic mechanisms of facioscapulohumeral muscular dystrophy. Mutat. Res. Mol. Mech. Mutagen. 2008, 647, 94–102. [Google Scholar] [CrossRef] [PubMed] [Green Version]
  33. Bérard, C.; Payan, C.; Hodgkinson, I.; Fermanian, J. A motor function measure for neuromuscular diseases. Construction and validation study. Neuromuscul. Disord. 2005, 15. [Google Scholar] [CrossRef] [PubMed]
  34. Brooke, M.H.; Griggs, R.; Mendell, J.R.; Fenichel, G.M.; Shumate, J.B.; Pellegrino, R.J. Clinical trial in duchenne dystrophy. I. The design of the protocol. Muscle Nerve 1981, 4, 186–197. [Google Scholar] [CrossRef] [PubMed]
  35. Vignos, P.J., Jr.; Archibald, K.C. Maintenance of ambulation in childhood muscular dystrophy. J. Chronic Dis. 1960, 12, 273–290. [Google Scholar] [CrossRef]
  36. Hartweck, L.M.; Anderson, L.J.; Lemmers, R.J.; Dandapat, A.; Toso, E.A.; Dalton, J.C.; Tawil, R.; Day, J.W.; Van Der Maarel, S.M.; Kyba, M. A focal domain of extreme demethylation within D4Z4 in FSHD2. Neurology 2013, 80, 392–399. [Google Scholar] [CrossRef] [Green Version]
Figure 1. The percentage of methylation in patients with a low severity score (<1.5) compared to patients with a high severity (>3.5), patients from the 6–8 repeat units (RUs) group are represented by white dots, patients from the 9–10 RUs group are represented by black dots (panel A). The percentage of DNA molecules below 60% of the methylation level is also illustrated (panel B). Hypomethylation was more significantly pronounced in patients with a high severity score than in those with a low severity score, especially for the proximal D4Z4 region (DR1 and 5P).
Ijms 21 02221 g001
Table 1. Comparison of clinical scales between the two groups of patients with facioscapulohumeral muscular dystrophy (FSHD) (6–8 RUs vs. 9–10 RUs).
6–8 RUs (n = 74)9–10 RUs (n = 25)Zp
Adjusted SMMT0.67 (0.32–1.07)0.52 (0.28–0.99)−0.380.70
CSS2.5 (1.4–3.5)2.5 (1.0–3.3)−0.510.61
Brooke2 (1–3)2 (1–2.75)−0.090.93
Gardner2 (0–3)1 (0–2)−1.370.17
Brooke/Gardner sum-score4 (2–5)3 (2–4)−1.20.23
MFM score92.5 (81.5–99)95.5 (86.25–98)−0.560.58
Time to Walk 10 m7 (6–11)8 (6–9.75)−0.340.74
Time to climb 4 steps3 (2–5)3.5 (2–7)−0230.82
Time of Barré (s)60 (30–143)92 (30–150)−990.32
Time of Mingazzini (s)60 (26.25–124.75)75 (60–132)−1.60.12
ABDUR90 (80–180)120 (80–180)−0.640.52
ABDUL90 (80–180)170 (75–180)−0.410.68
ANTER110 (88.75–180)120 (75–180)−0.120.92
ANTEL110 (90–180)170 (75–180)−0.470.64
Table 2. The correlation between functional scales and methylation.
Percentage of MethylationPercentage of Hypomethylation
DR15PMid3PDR15PMid3P
SMMTr−0.31−0.26−0.35−0.330.270.310.210.30
p0.120.120.080.100.180.120.300.14
CSSr−0.47−.042−0.51−0.430.420.310.230.29
p0.010.030.010.030.030.120.260.14
Brooker−0.22−0.15−0.21−0.120.150.09−0.060
p0.260.450.290.550.450.650.780.99
Gardnerr−0.37−0.29−0.37−0.340.330.180.170.2
p0.060.150.060.080.090.380.390.31
Time to Walk 10 mr−0.040.1−0.16−0.1−0.07−0.080.170.09
p0.860.630.420.630.740.70.40.67
Time to climb 4 stepsr−0.040.08−0.03−0.02−0.0800.30.23
p0.860.710.890.930.720.990.150.27
Time of Barrér0.480.460.50.39−0.52−0.08−0.33−0.01
p0.010.020.010.050.010.70.10.95
Time of Mingazzinir0.190.170.170.17−0.22−0.26−0.22−0.07
p0.390.440.440.440.310.230.320.74
ABDURr0.0100.050.130.040.030.150.02
p0.950.990.80.540.860.890.480.92
ABDULr0.060.080.060.24−0.09−0.14−0.04−0.28
p0.780.70.750.250.660.480.860.16
ANTERr0.120.090.150.3−0.06−0.010−0.19
p0.570.660.470.140.760.970.990.36
ANTELr0.140.130.120.34−0.14−0.16−0.18−0.47
p0.510.540.540.090.480.440.380.02
SMMT: Sum score MMT, CSS: Clinical severity score, ABDUR: Right upper limb abduction, ABDUL: Left upper limb abduction, ANTER: Right upper limb anterior flexion, ANTEL: Left upper limb anterior flexion. Red data: highlight the clinically significant data

