Arachidonic Acid Attenuates Cell Proliferation, Migration and Viability by a Mechanism Independent on Calcium Entry

 , , and
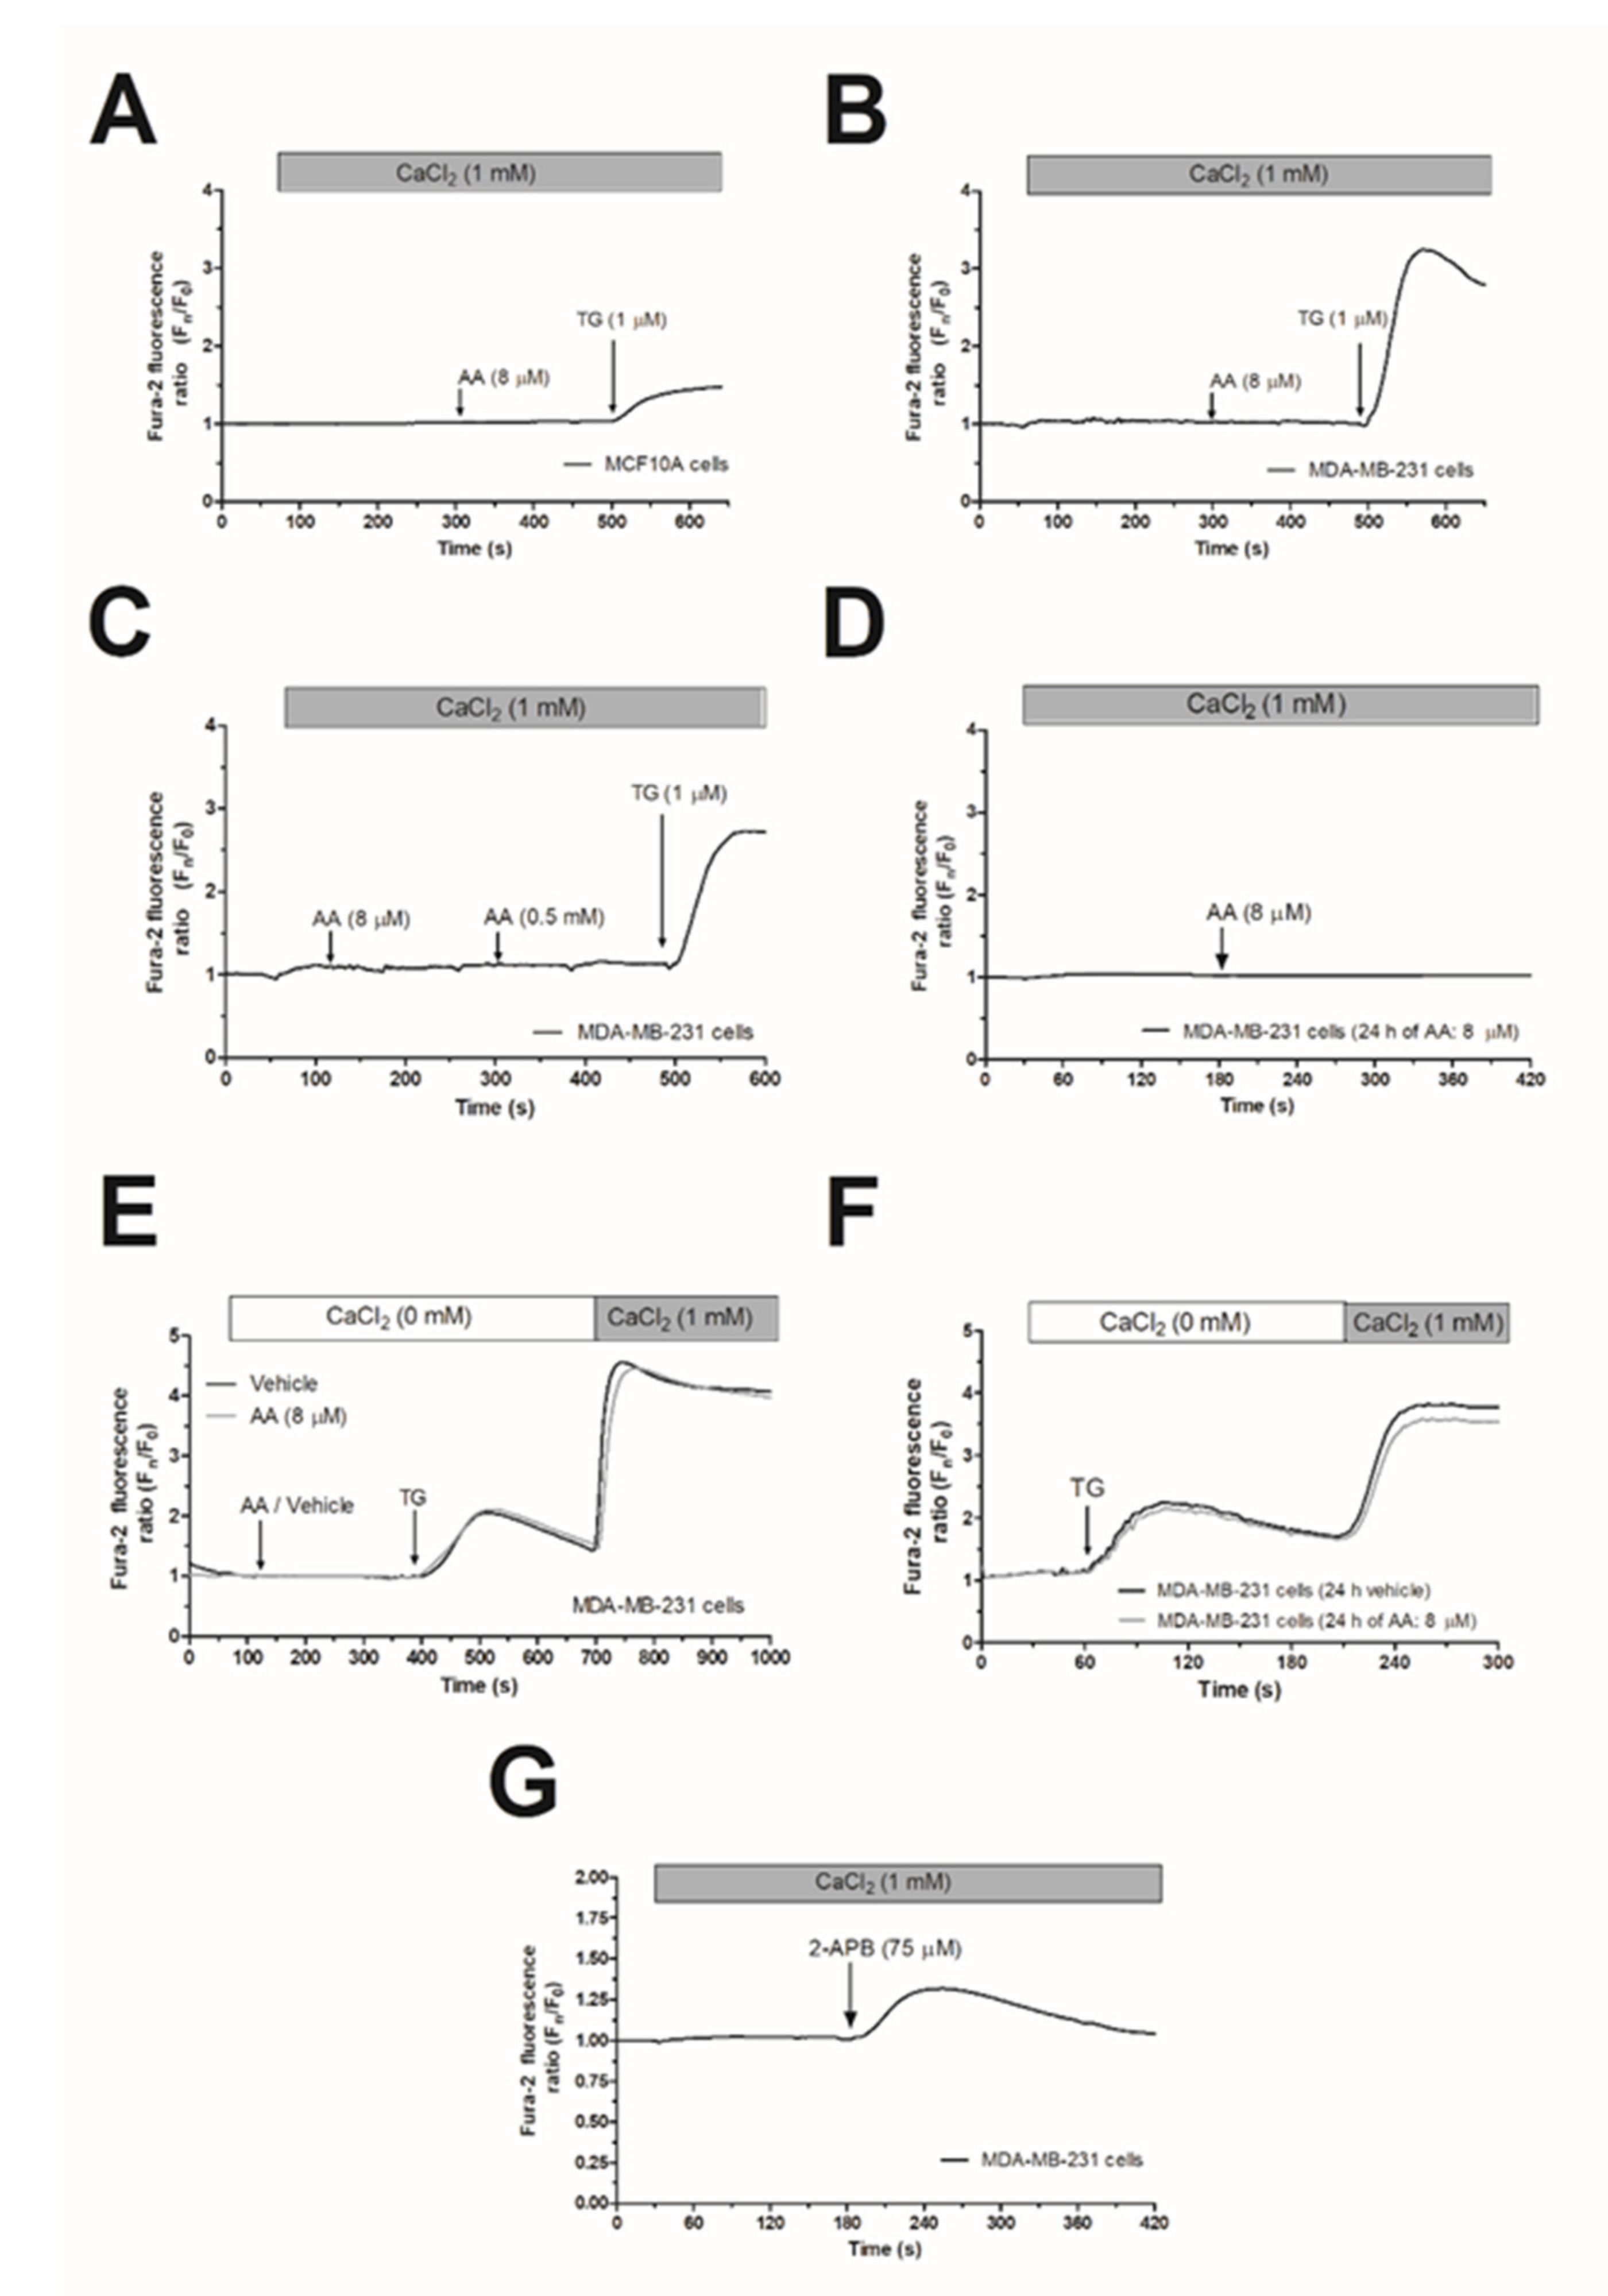
Abstract
:1. Introduction
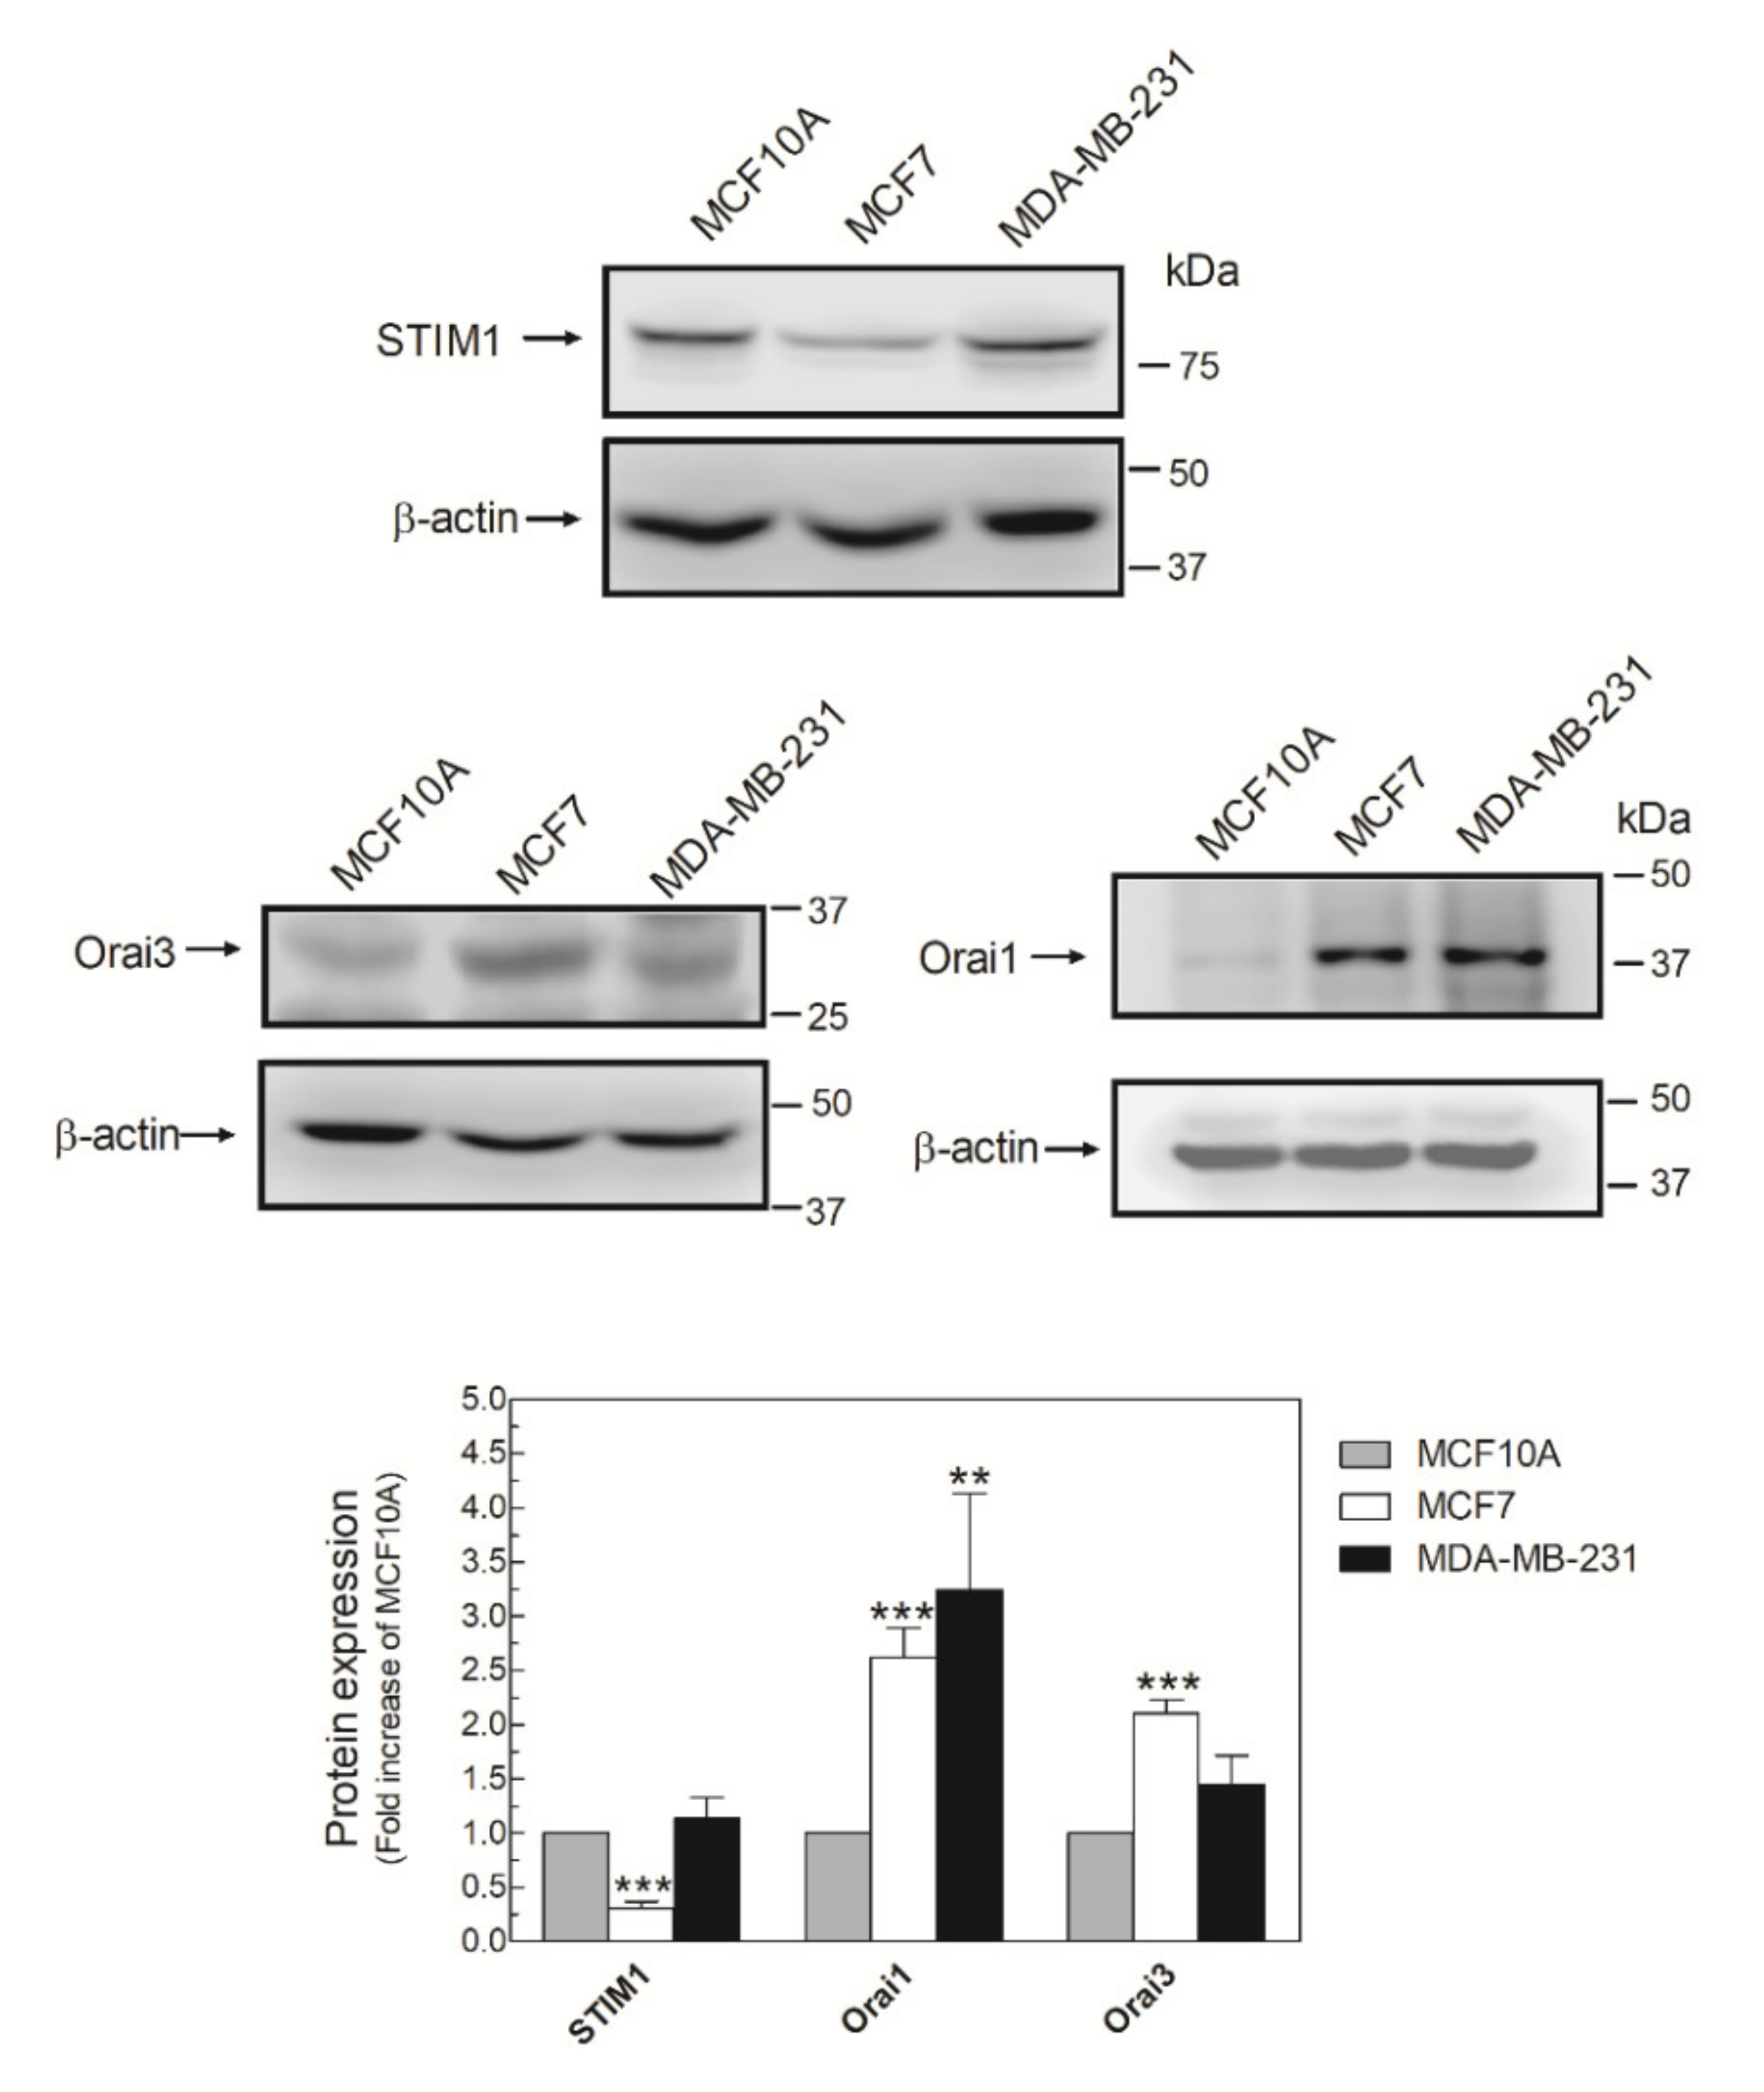
2. Results
2.1. Arachidonic Acid (AA) Is Unable to Induce Ca2+ Mobilization in MCF10A and MDA-MB-231 Cells
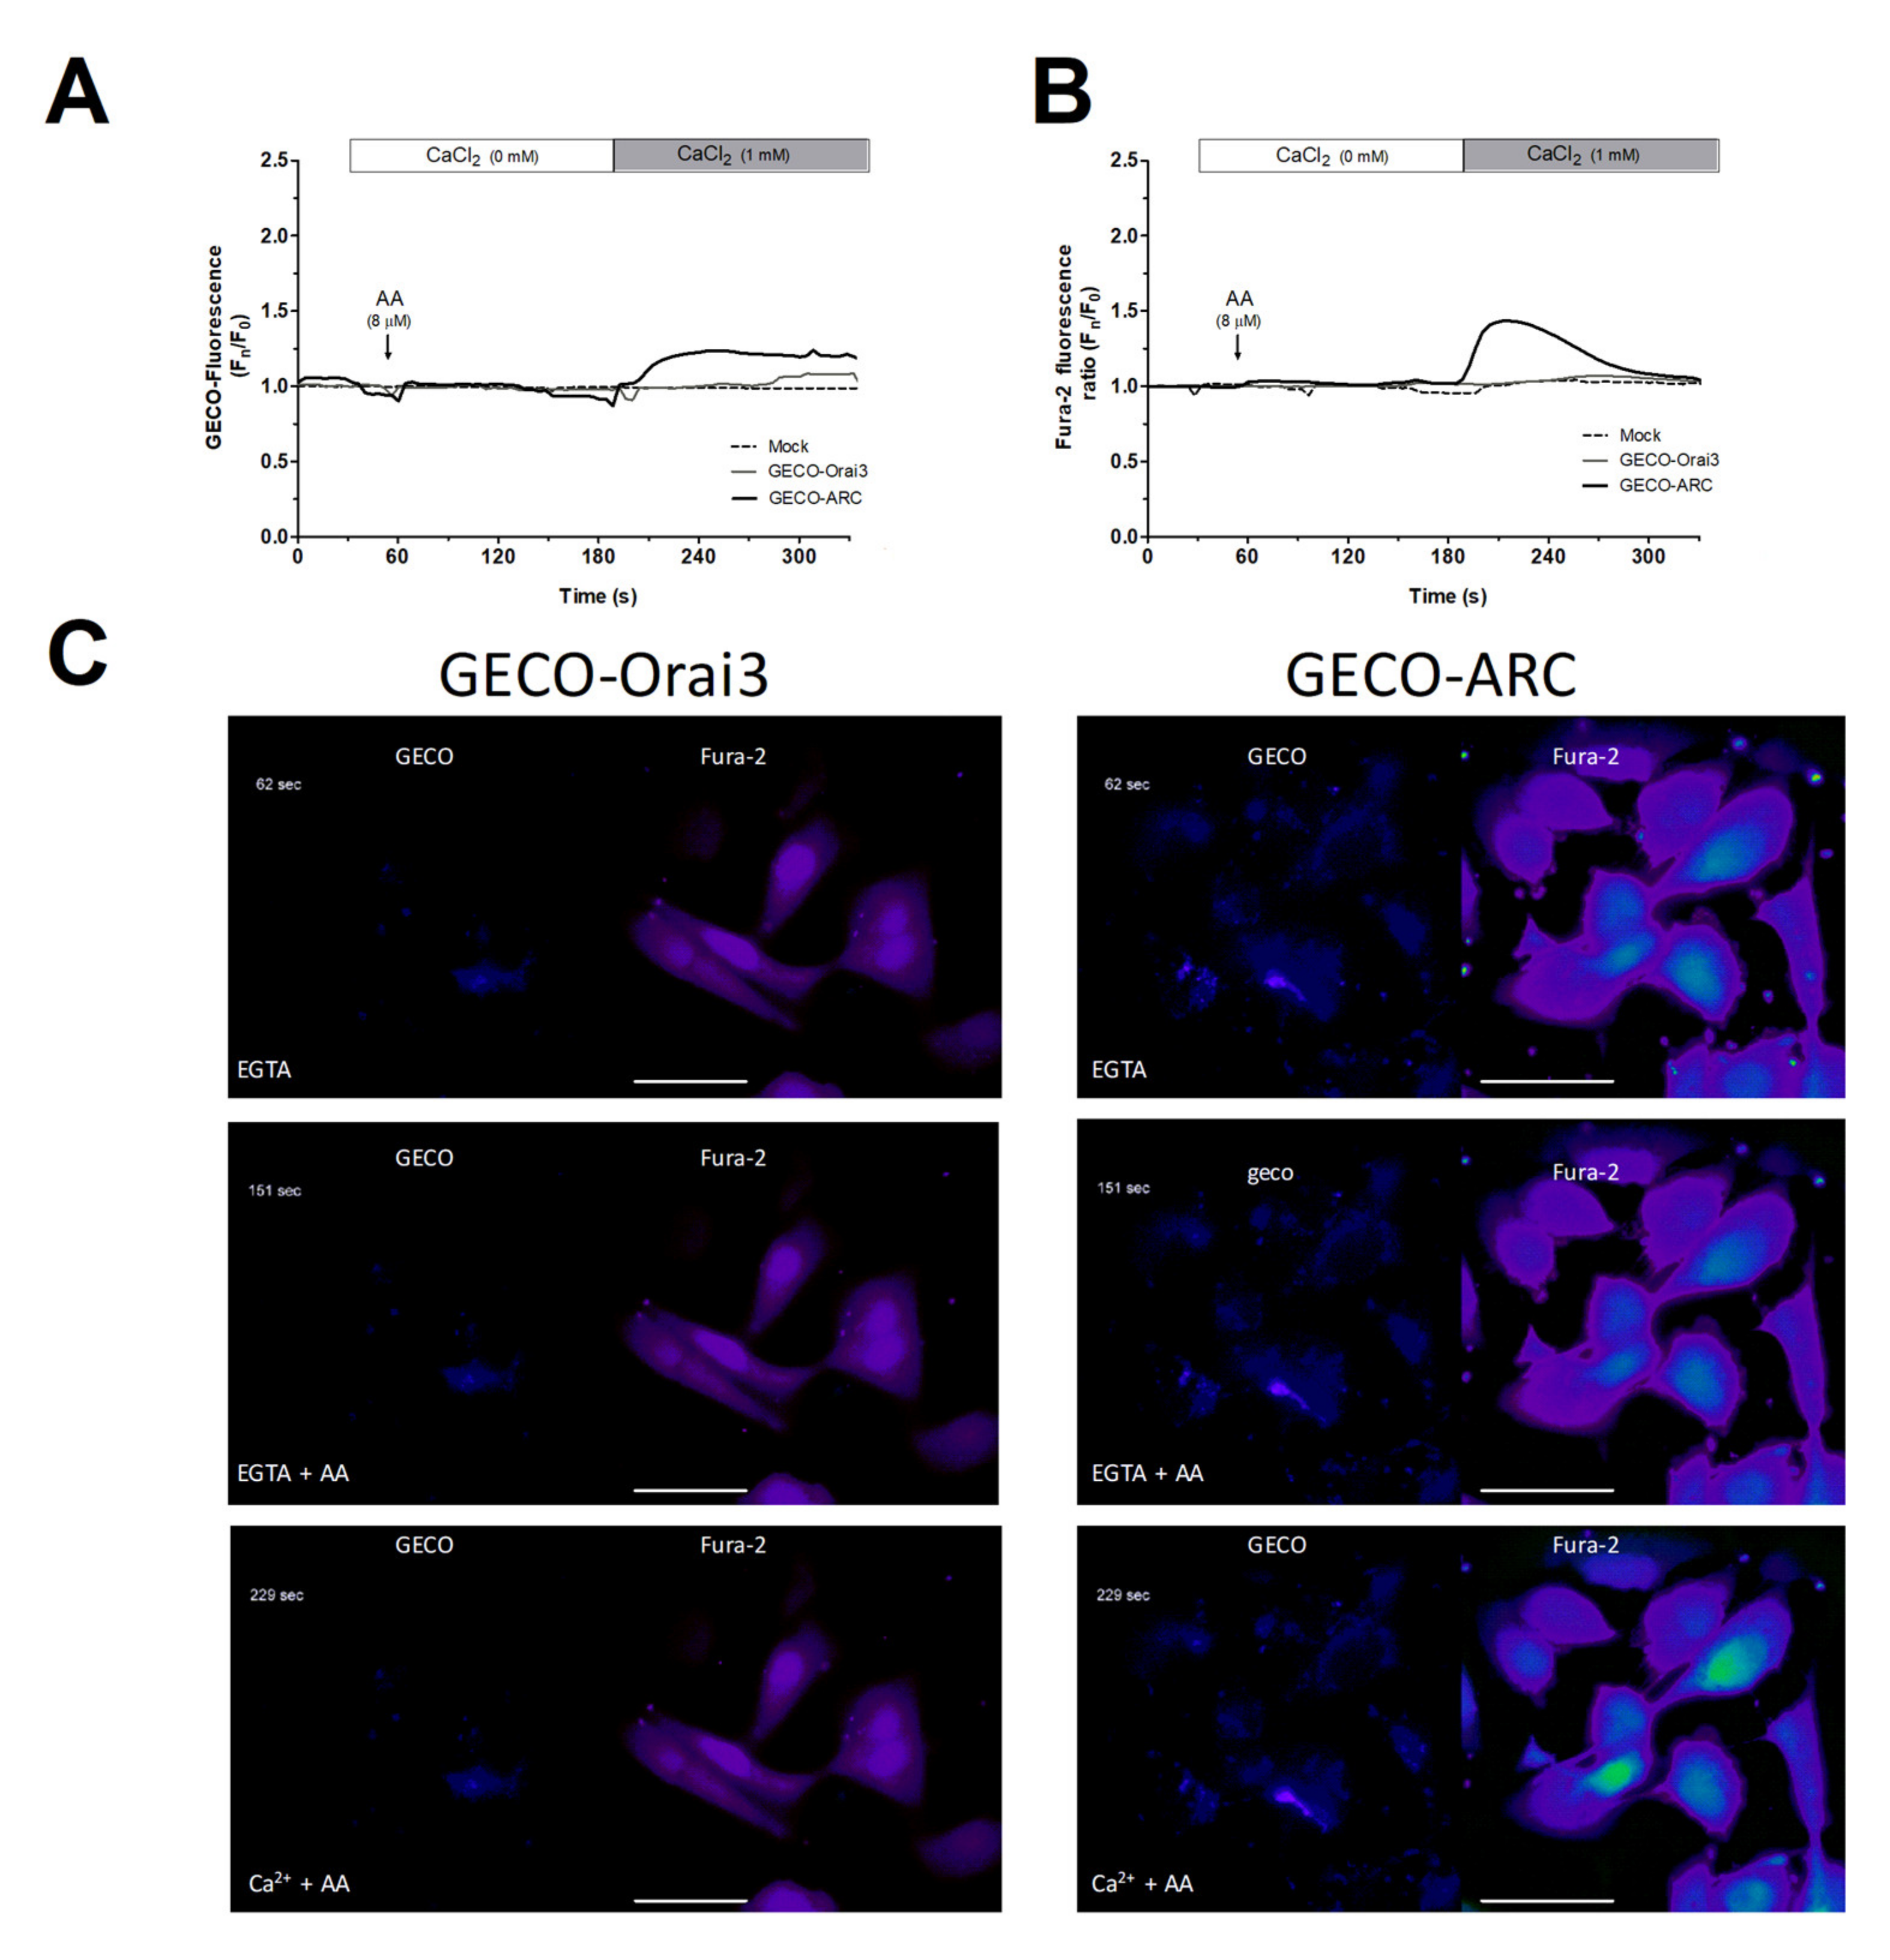
2.2. MDA-MB-231 Cells Lack Functional Native Arachidonate-Regulated Ca2+-Selective (ARC) Channels
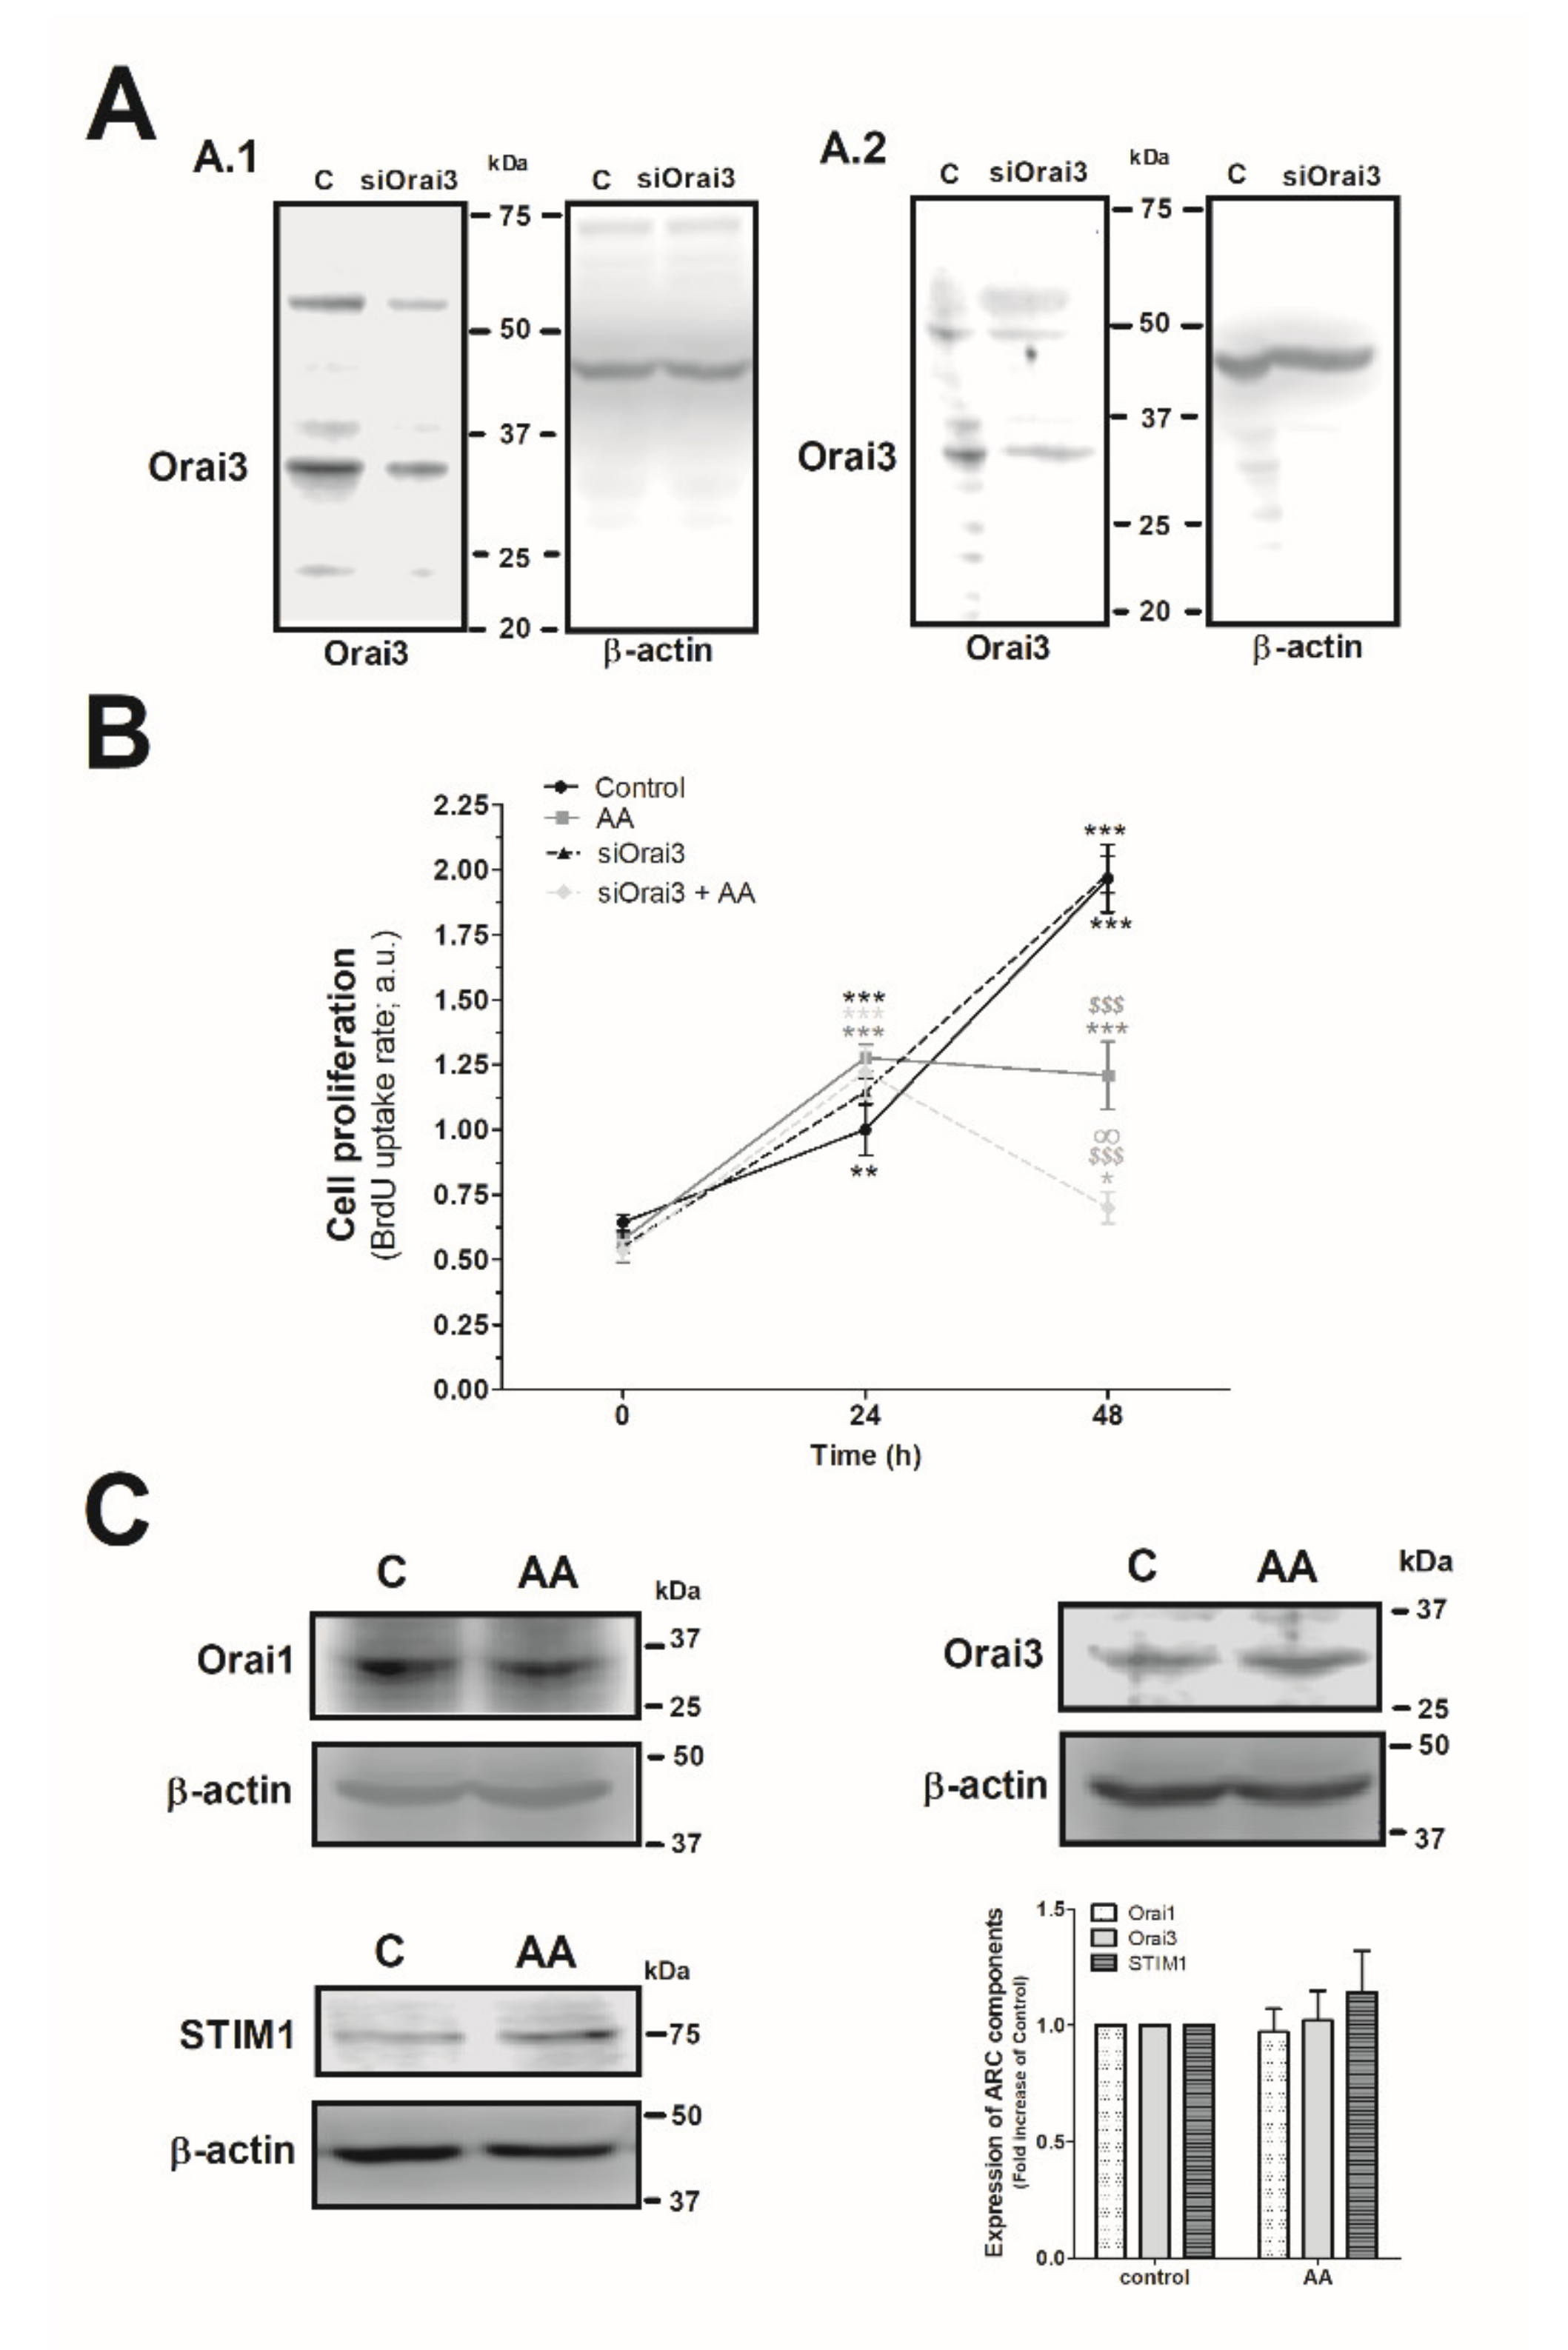
2.3. Effect of AA in MDA-MB-231 Cell Proliferation
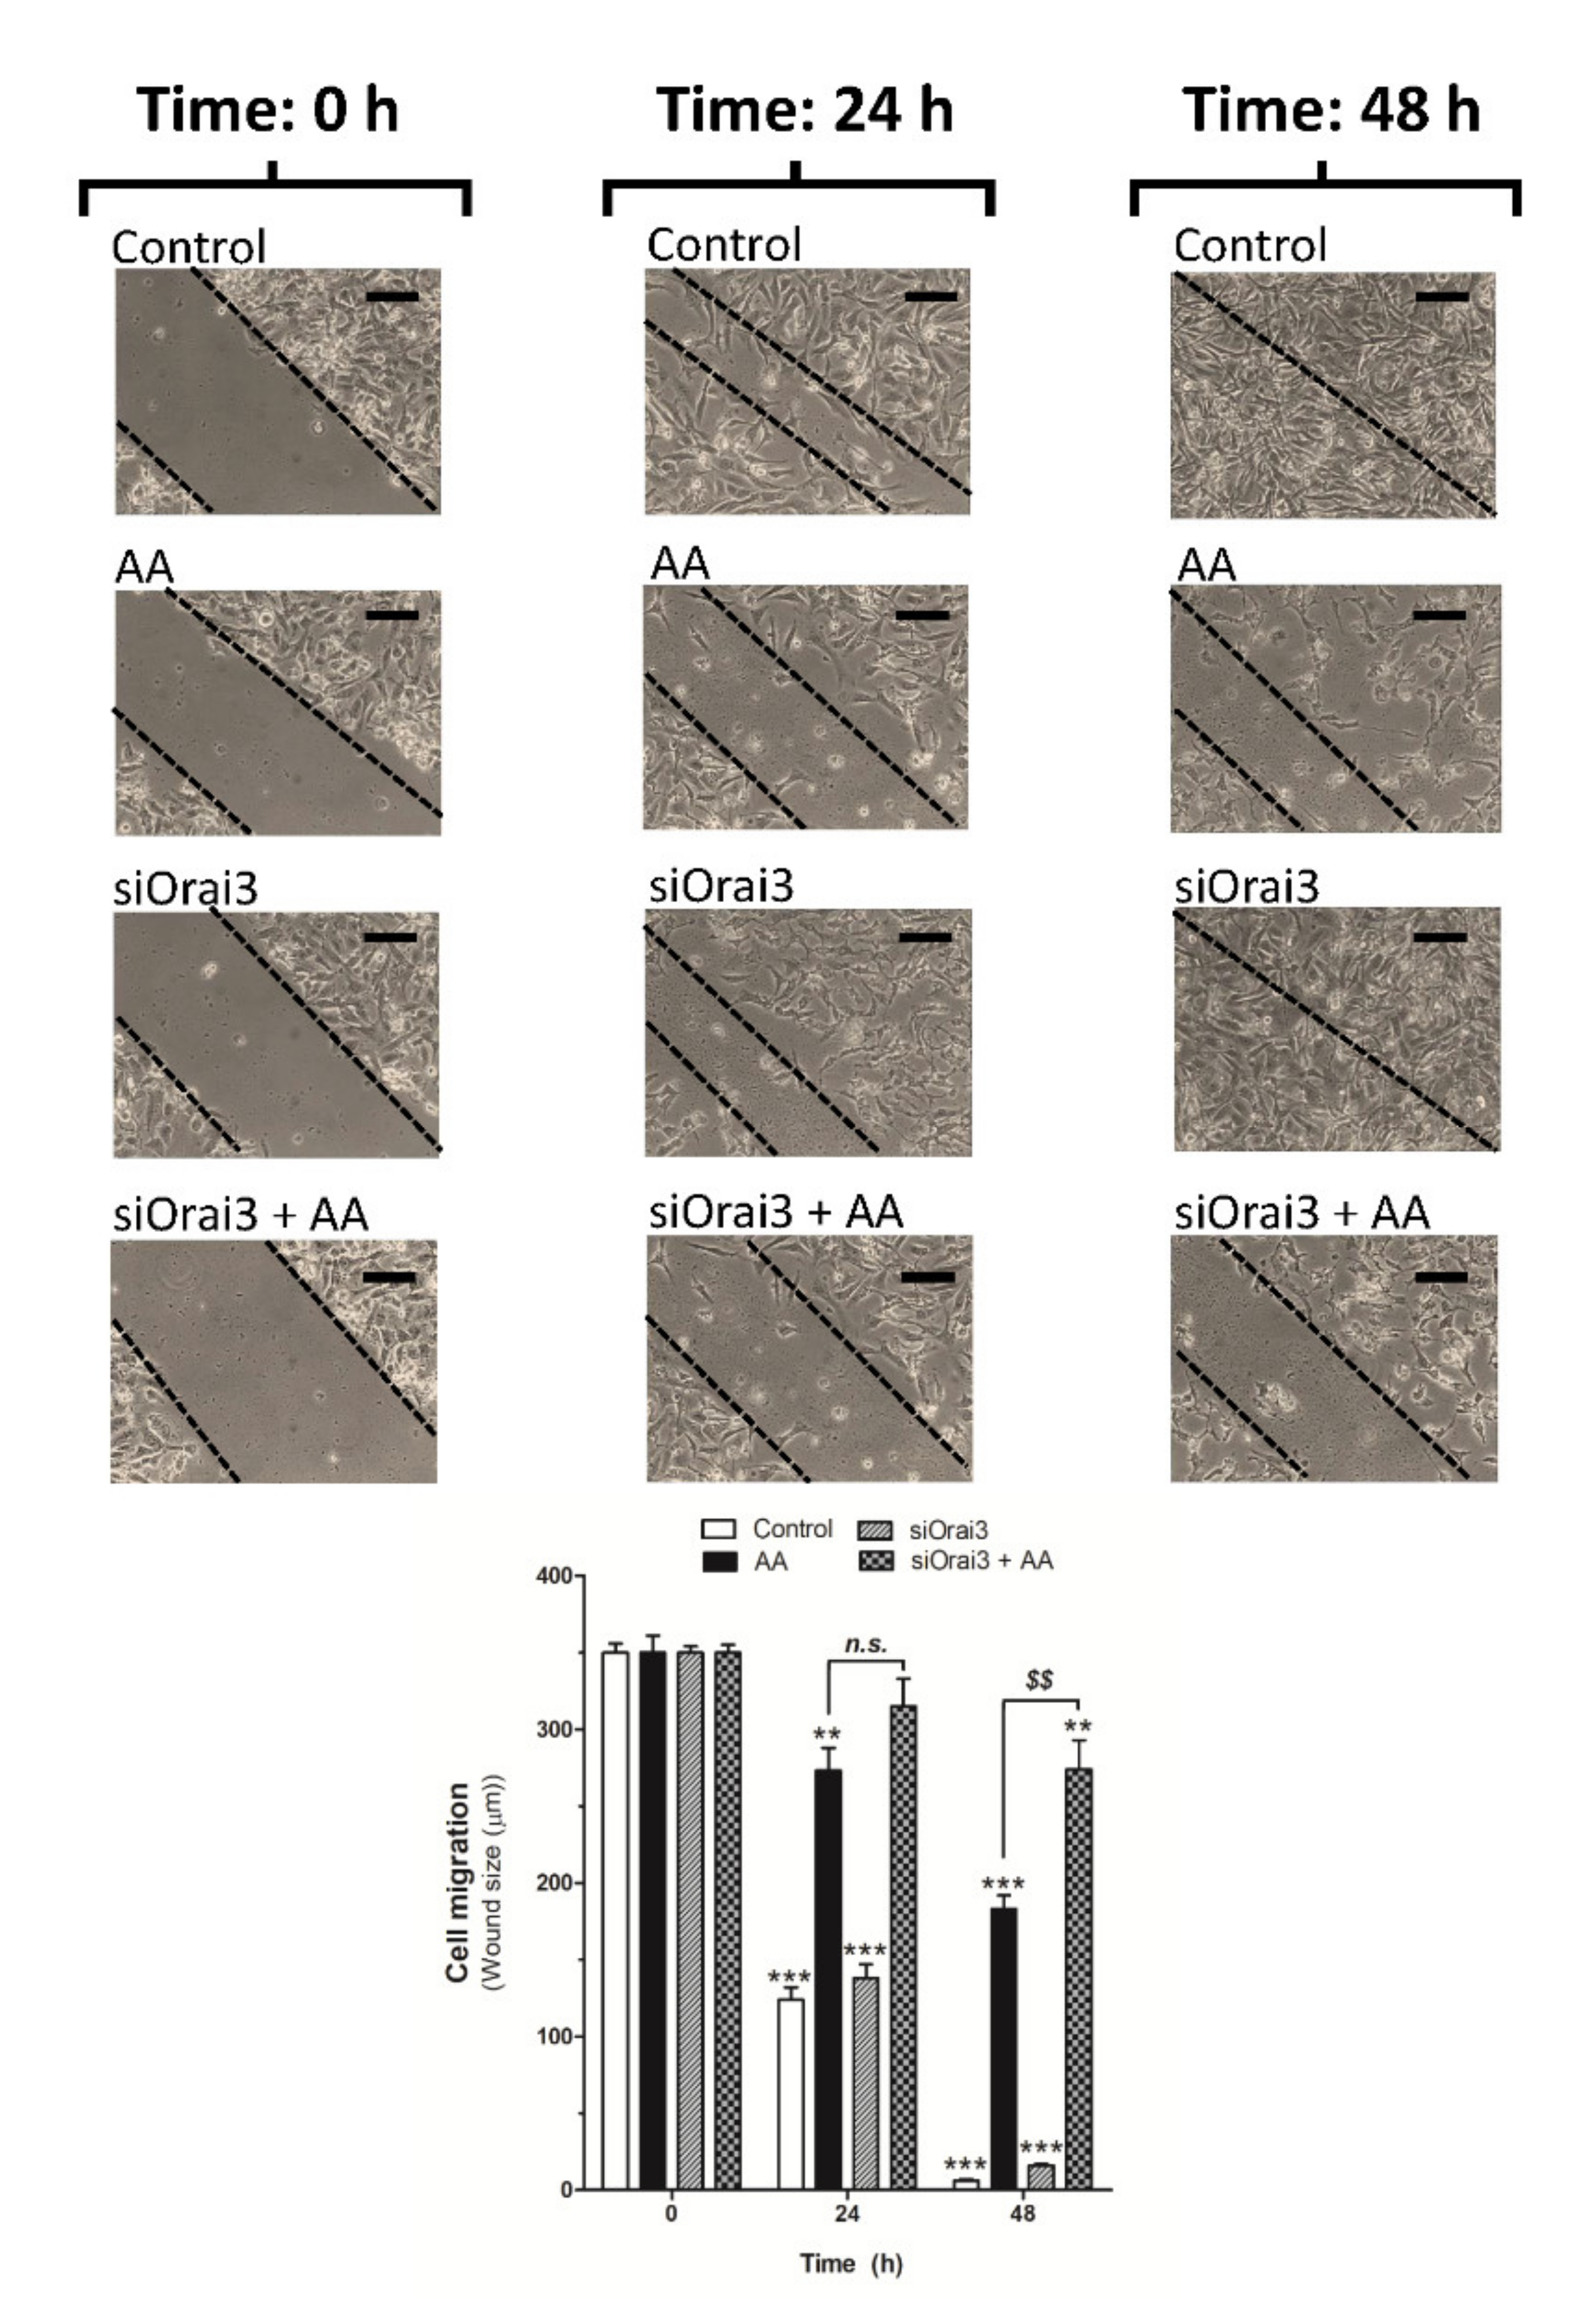
2.4. AA Inhibits MDA-MB-231 Cell Migration
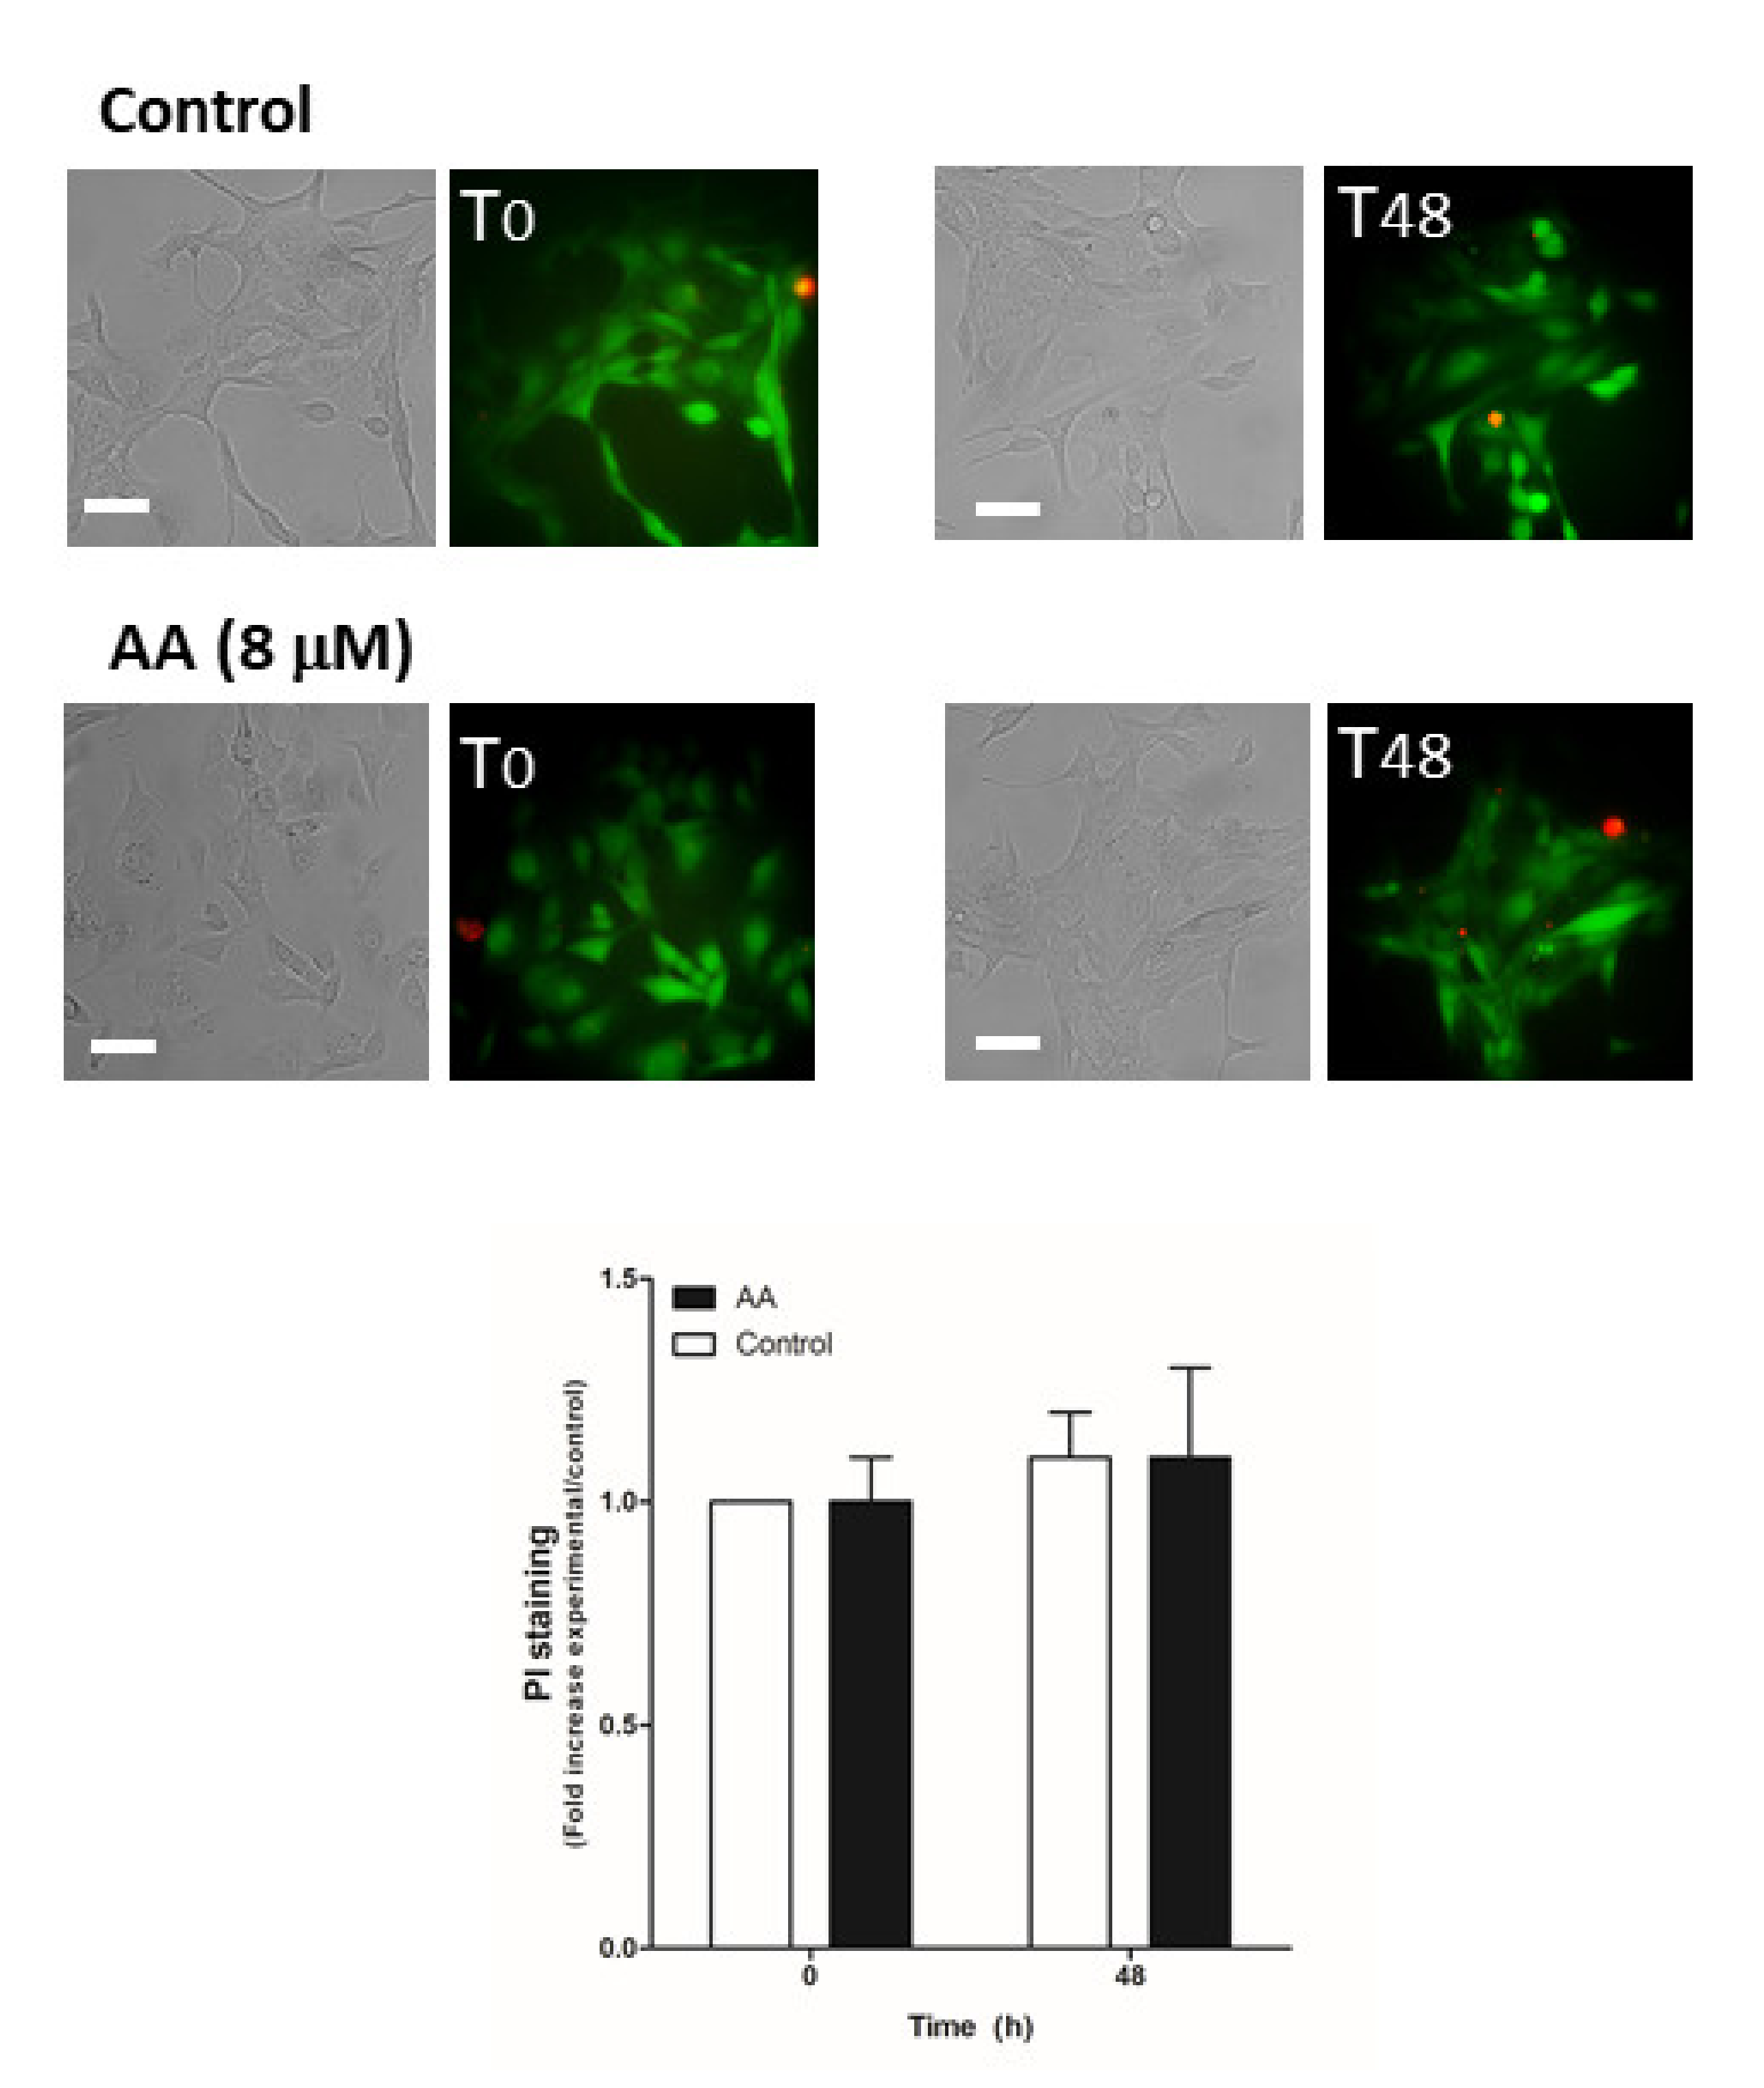
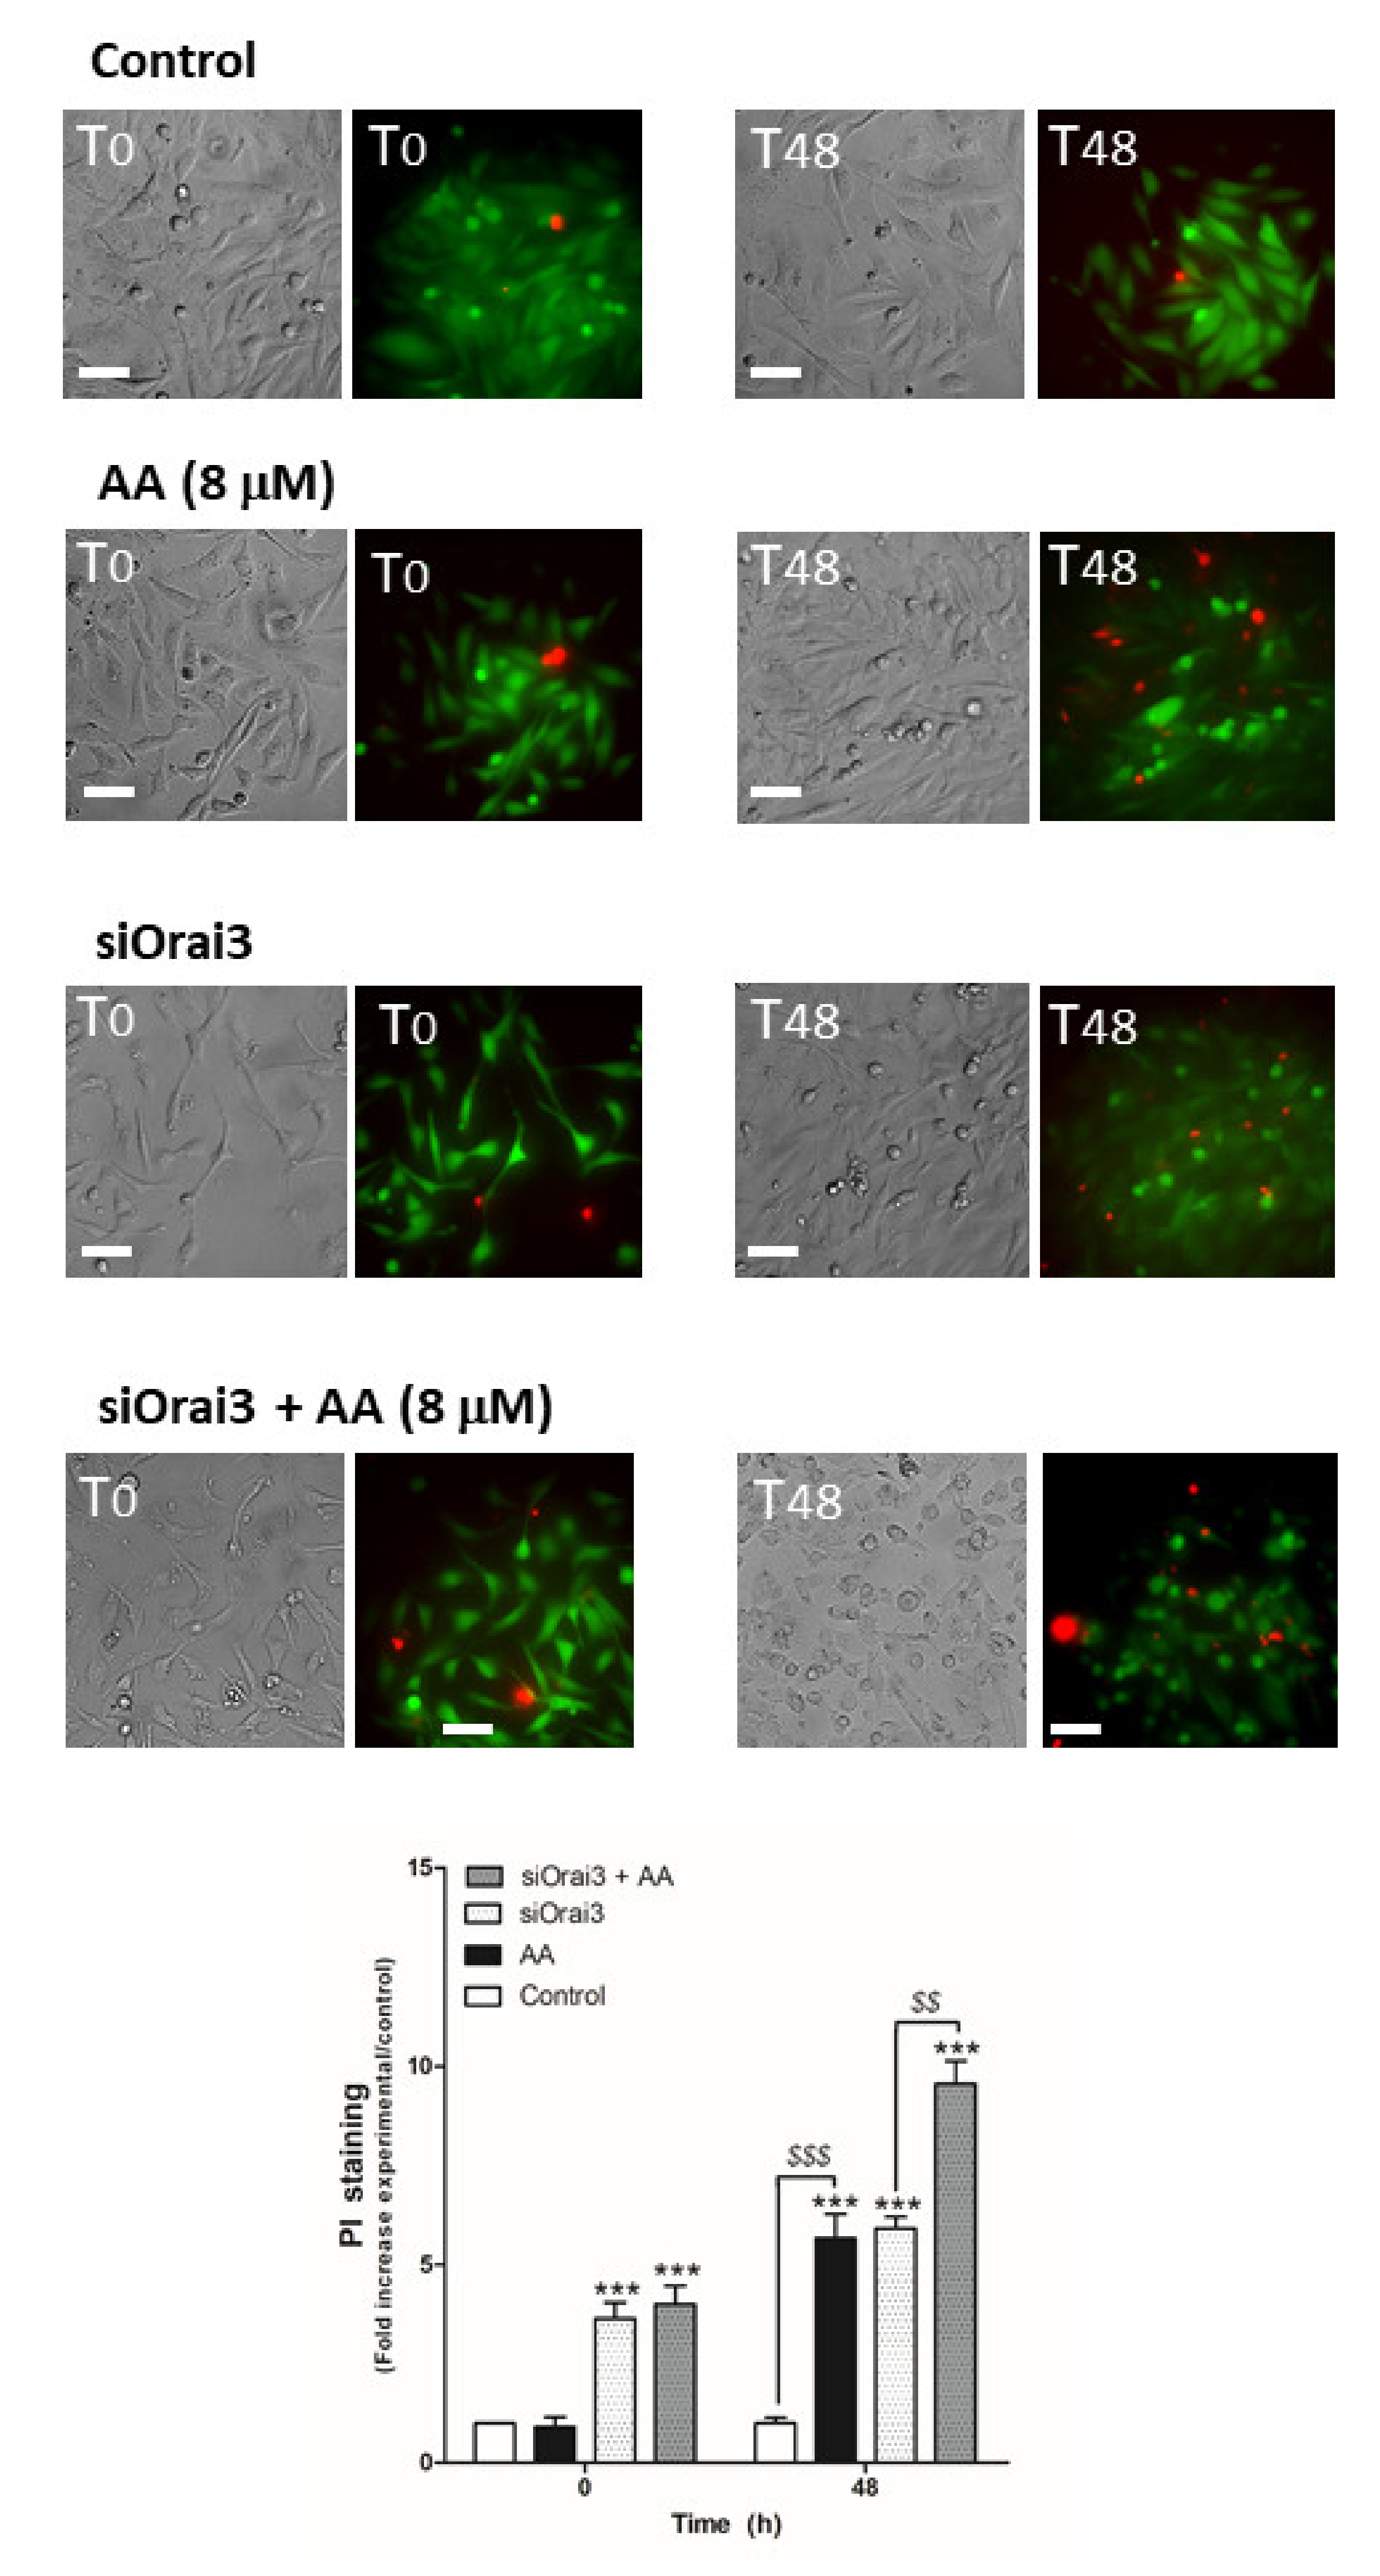
2.5. AA Attenuates MDA-MB-231 Cell Viability
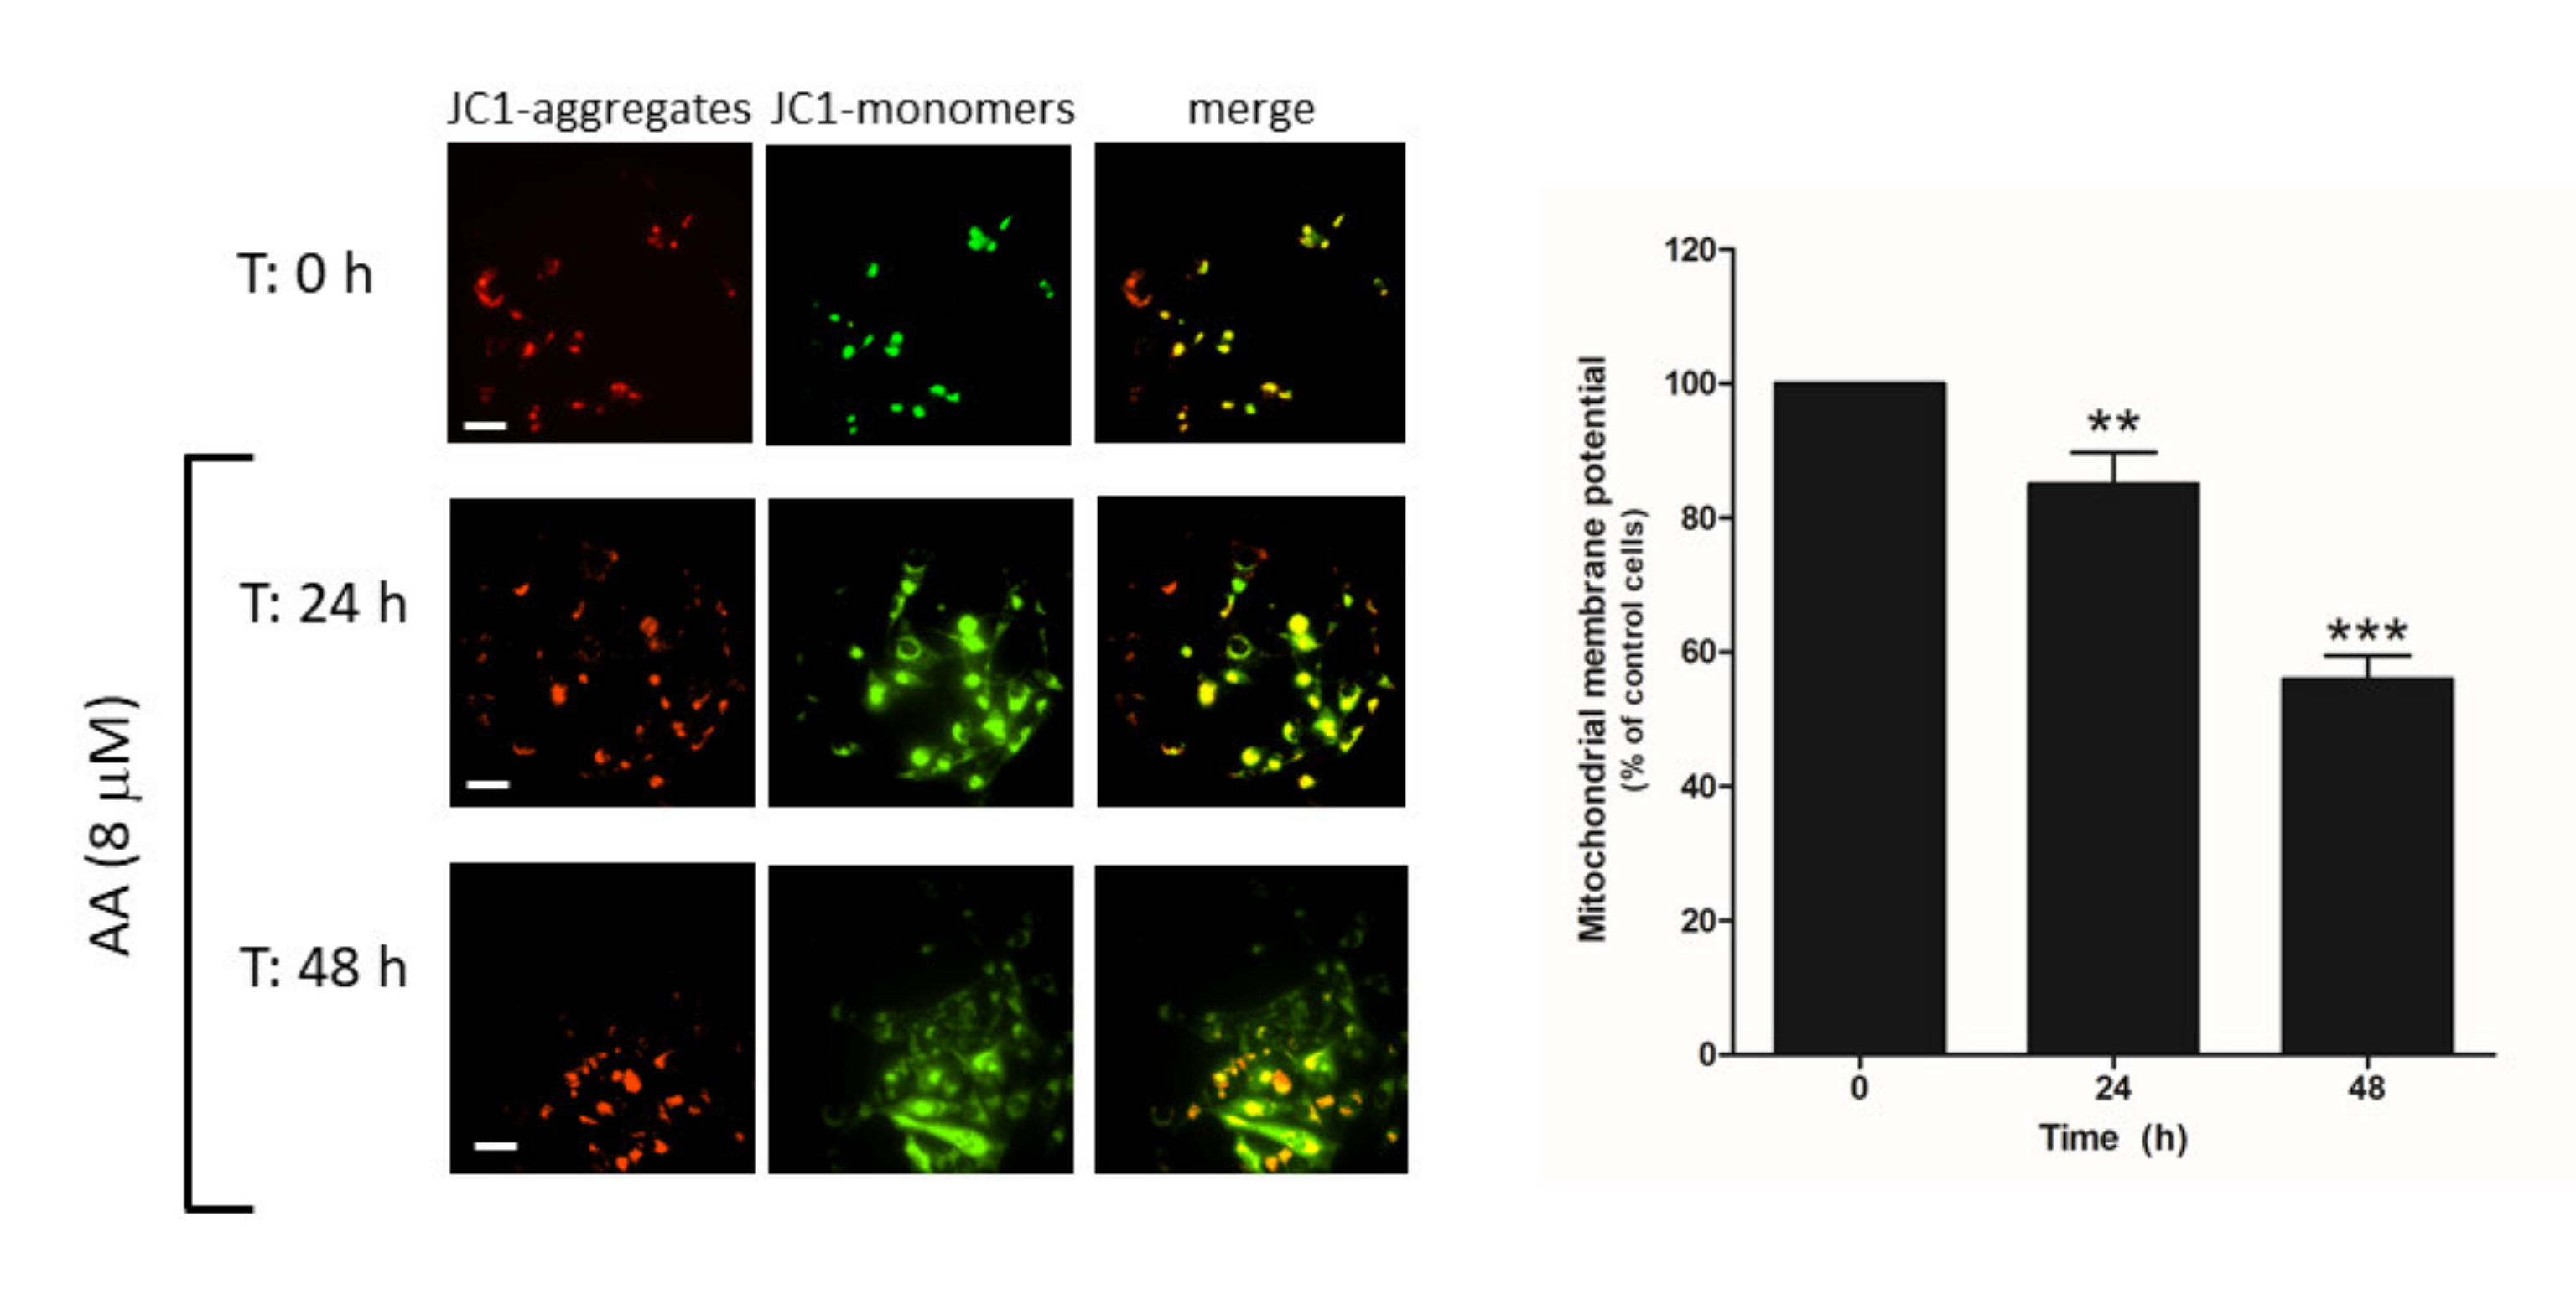
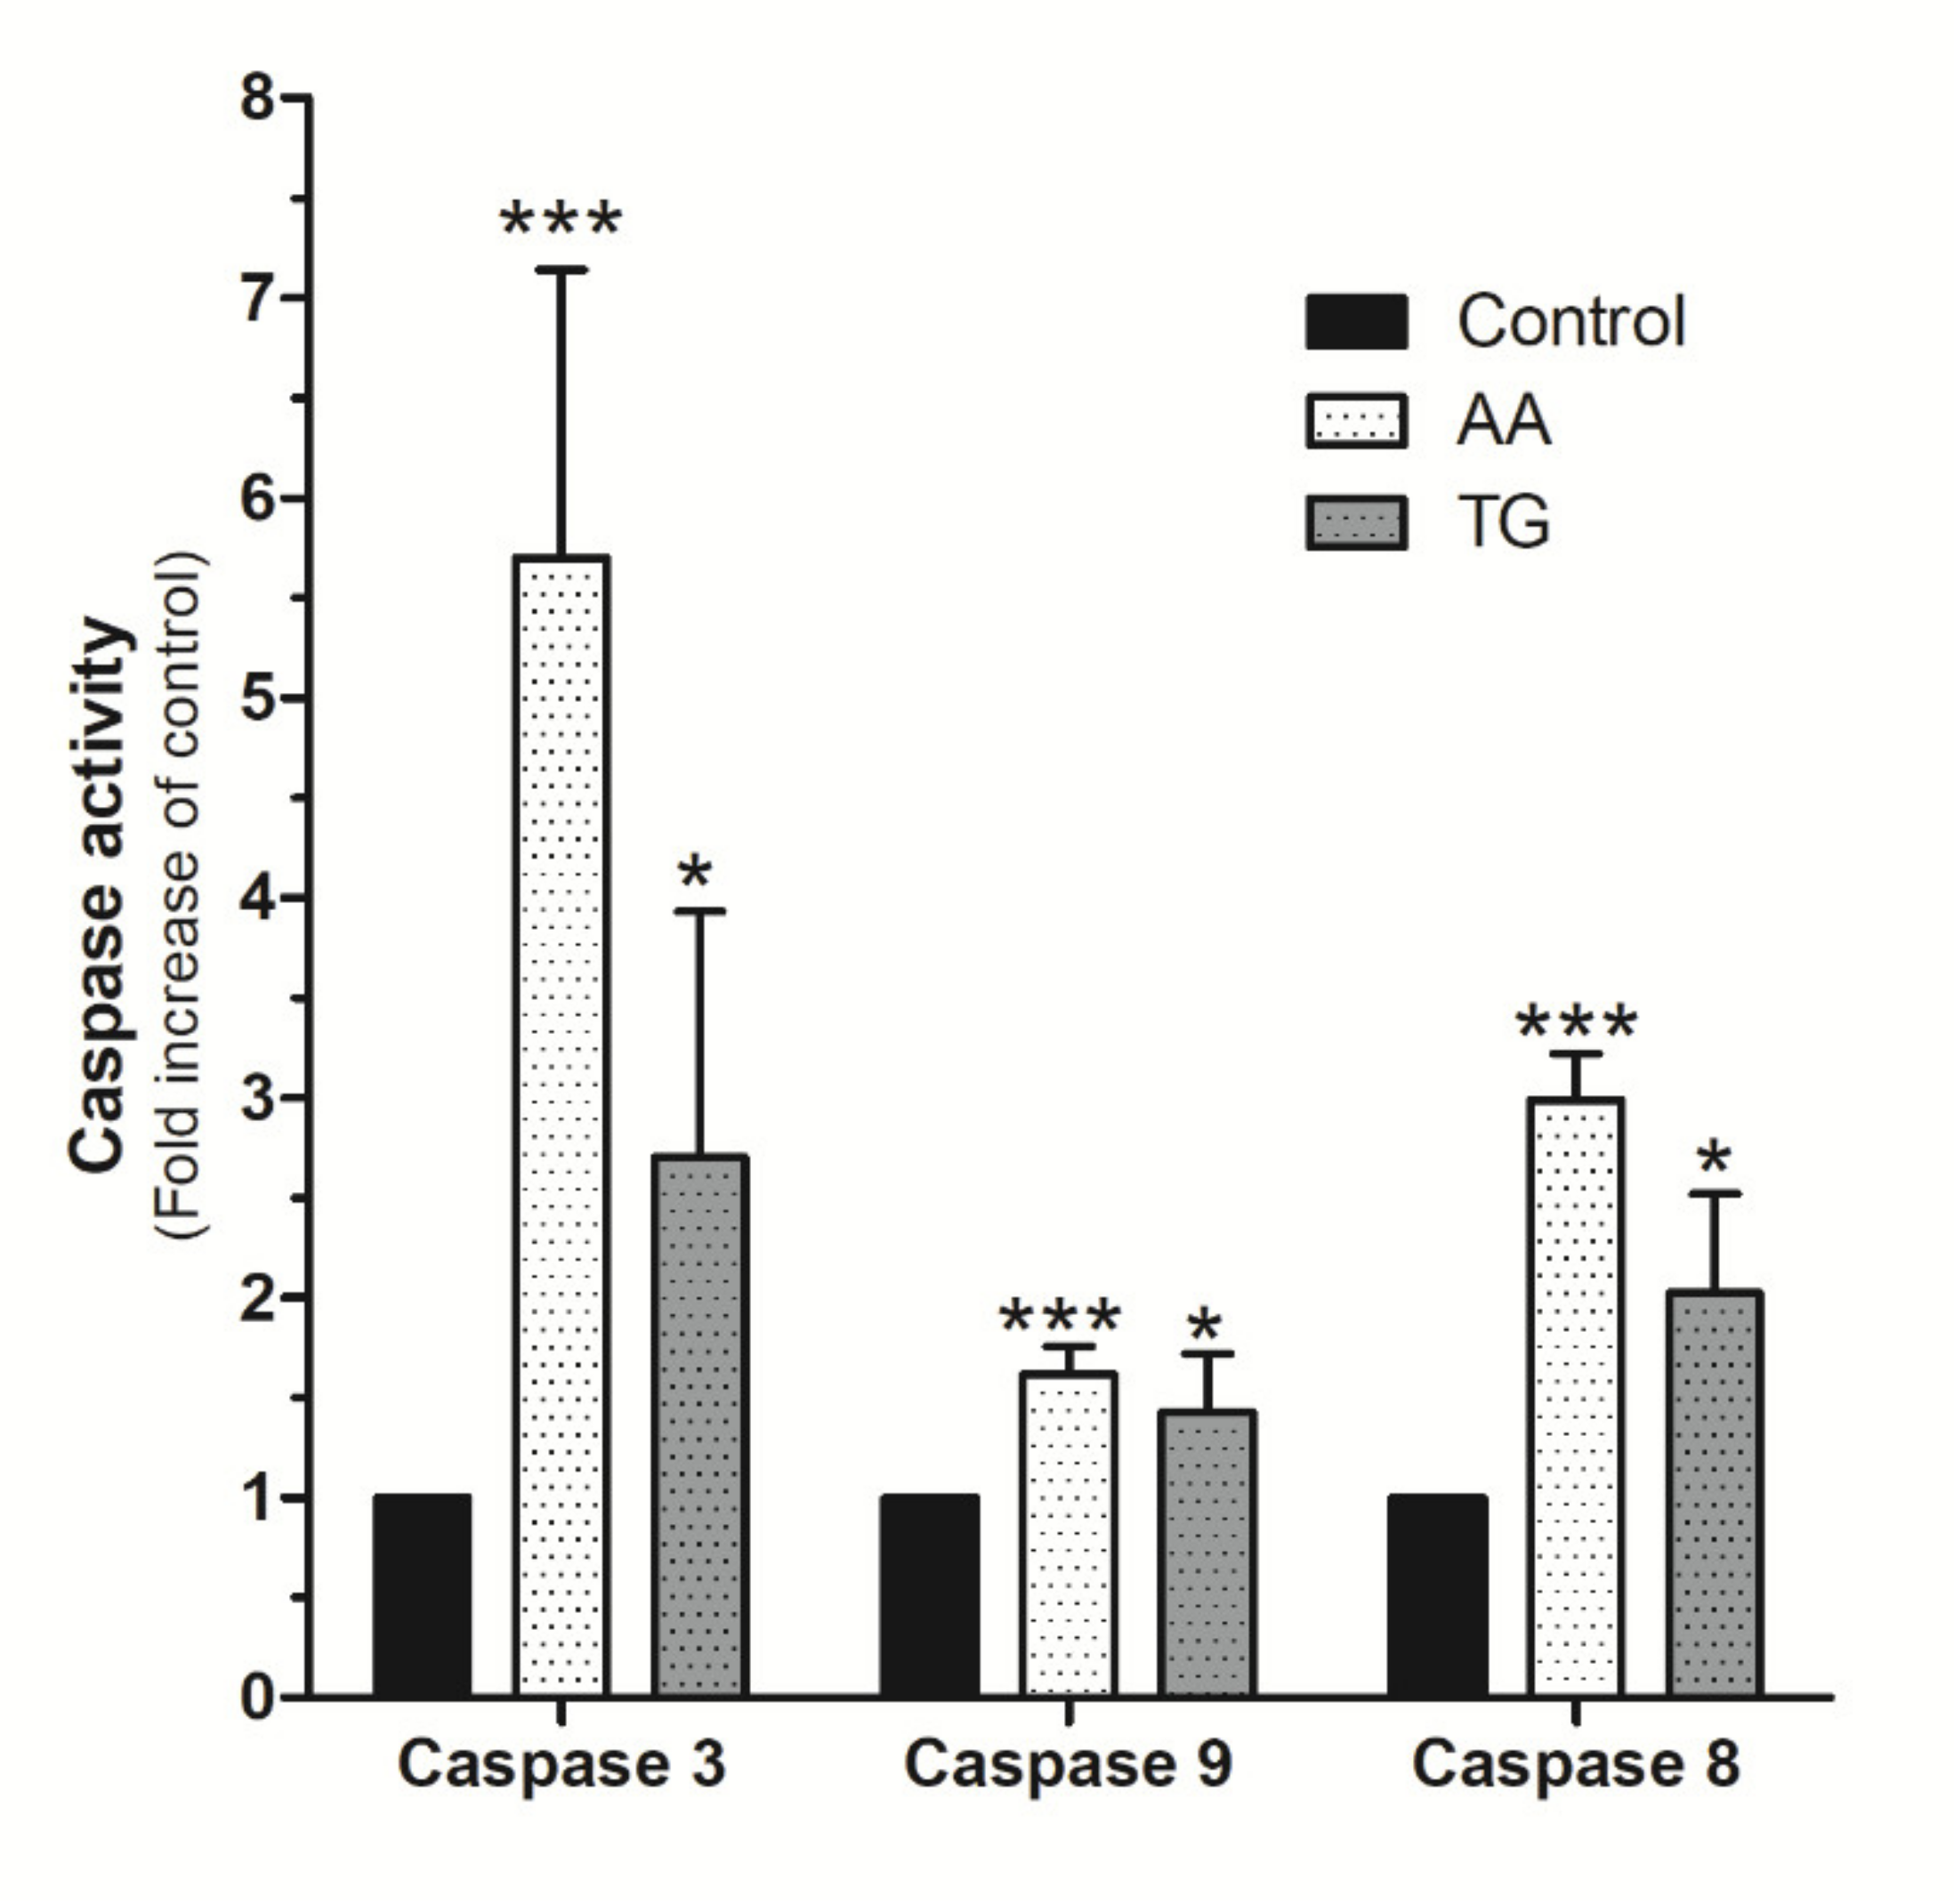
2.6. AA Induces Mitochondrial Membrane Depolarization and Caspase Activation
3. Discussion
4. Materials and Methods
4.1. Material and Cell Lines
4.2. Determination of the Changes in The Cytosolic Free-Ca2+ Concentration ([Ca2+]c)
4.3. Western Blotting (WB)
4.4. Cell Proliferation Assay
4.5. Migration Assay
4.6. Cell Death and Mitochondrial Potential Depolarization Analysis
4.7. Analysis of Caspase Activity
4.8. Statistical Analysis
5. Conclusions
Author Contributions
Funding
Acknowledgments
Conflicts of Interest
Abbreviations
References
- Abdullaev, I.F.; Bisaillon, J.M.; Potier, M.; Gonzalez, J.C.; Motiani, R.K.; Trebak, M. Stim1 and Orai1 mediate CRAC currents and store-operated calcium entry important for endothelial cell proliferation. Circ. Res. 2008, 103, 1289–1299. [Google Scholar] [CrossRef] [PubMed]
- Potier, M.-C.; Gonzalez, J.C.; Motiani, R.K.; Abdullaev, I.F.; Bisaillon, J.M.; Singer, H.A.; Trebak, M. Evidence for STIM1- and Orail-dependent storeoperated calcium influx through I CRAC in vascular smooth muscle cells: Role in proliferation and migration. FASEB J. 2009, 23, 2425–2437. [Google Scholar] [CrossRef] [PubMed] [Green Version]
- Jardin, I.; Lopez, J.J.; Salido, G.M.; Rosado, J.A. Store-Operated Ca2+ Entry in Breast Cancer Cells: Remodeling and Functional Role. Int. J. Mol. Sci. 2018, 19, 4053. [Google Scholar] [CrossRef] [PubMed] [Green Version]
- Frischauf, I.; Zayats, V.; Deix, M.; Hochreiter, A.; Jardin, I.; Muik, M.; Lackner, B.; Svobodova, B.; Pammer, T.; Ukova, M.L.; et al. A calcium-accumulating region, CAR, in the channel Orai1 enhances Ca2+ permeation and SOCE-induced gene transcription. Sci. Signal. 2015, 8, ra131. [Google Scholar] [CrossRef] [PubMed] [Green Version]
- Jardin, I.; Diez-Bello, R.; Lopez, J.J.; Redondo, P.C.; Salido, G.M.; Smani, T.; Rosado, J.A. TRPC6 Channels Are Required for Proliferation, Migration and Invasion of Breast Cancer Cell Lines by Modulation of Orai1 and Orai3 Surface Exposure. Cancers 2018, 10, 331. [Google Scholar] [CrossRef] [Green Version]
- Cantonero, C.; Camello, P.J.; Abate, C.; Berardi, F.; Salido, G.M.; Rosado, J.A.; Redondo, P.C. NO1, a New Sigma 2 Receptor/TMEM97 Fluorescent Ligand, Downregulates SOCE and Promotes Apoptosis in the Triple Negative Breast Cancer Cell Lines. Cancers 2020, 12, 257. [Google Scholar] [CrossRef] [Green Version]
- Pierro, C.; Sneyers, F.; Bultynck, G.; Roderick, H.L. ER Ca2+ release and store-operated Ca2+ entry — partners in crime or independent actors in oncogenic transformation? Cell Calcium 2019, 82, 102061. [Google Scholar] [CrossRef]
- Li, S.; Yao, M.; Niu, C.; Liu, D.; Tang, Z.; Gu, C.; Zhao, H.; Ke, J.; Wu, S.; Wang, X.; et al. Inhibition of MCF-7 breast cancer cell proliferation by a synthetic peptide derived from the C-terminal sequence of Orai channel. Biochem. Biophys. Res. Commun. 2019, 516, 1066–1072. [Google Scholar] [CrossRef]
- Villalobos, C.; Hernández-Morales, M.; Gutiérrez, L.G.; Núñez, L. TRPC1 and ORAI1 channels in colon cancer. Cell Calcium 2019, 81, 59–66. [Google Scholar] [CrossRef]
- Desai, P.N.; Zhang, X.; Wu, S.; Janoshazi, A.; Bolimuntha, S.; Putney, J.; Trebak, M. Multiple types of calcium channels arising from alternative translation initiation of theOrai1message. Sci. Signal. 2015, 8, ra74. [Google Scholar] [CrossRef] [Green Version]
- Cantonero, C.; Sanchez-Collado, J.; Nuñez, M.A.G.; Salido, G.; Lopez, J.; Jardin, I.; Rosado, J.A. Store-independent Orai1-mediated Ca2+ entry and cancer. Cell Calcium 2019, 80, 1–7. [Google Scholar] [CrossRef] [PubMed]
- Shuttleworth, T.J. Arachidonic Acid Activates the Noncapacitative Entry of Ca2+ during [Ca2+]I Oscillations. J. Biol. Chem. 1996, 271, 21720–21725. [Google Scholar] [CrossRef] [PubMed] [Green Version]
- Mignen, O.; Shuttleworth, T.J. IARC, a novel arachidonate-regulated, noncapacitative Ca2+ entry channel. J. Biol. Chem. 2000, 275, 9114–9119. [Google Scholar] [CrossRef] [PubMed] [Green Version]
- Mignen, O.; Thompson, J.L.; Shuttleworth, T.J. STIM1 regulates Ca2+ entry via arachidonate-regulated Ca2+-selective (ARC) channels without store depletion or translocation to the plasma membrane. J. Physiol. 2006, 579, 703–715. [Google Scholar] [CrossRef]
- Mignen, O.; Thompson, J.L.; Shuttleworth, T.J. Both Orai1 and Orai3 are essential components of the arachidonate-regulated Ca2+-selective (ARC) channels. J. Physiol. 2007, 586, 185–195. [Google Scholar] [CrossRef]
- Mignen, O.; Thompson, J.L.; Shuttleworth, T.J. Orai1 subunit stoichiometry of the mammalian CRAC channel pore. J. Physiol. 2007, 586, 419–425. [Google Scholar] [CrossRef]
- Collado, S.-; Lopez, J.J.; Jardin, I.; Camello, P.J.; Falcón, D.; Regodon, S.; Salido, G.M.; Smani, T.; Rosado, J.A.; Sanchez-Collado, J. Adenylyl Cyclase Type 8 Overexpression Impairs Phosphorylation-Dependent Orai1 Inactivation and Promotes Migration in MDA-MB-231 Breast Cancer Cells. Cancers 2019, 11, 1624. [Google Scholar] [CrossRef] [Green Version]
- Thompson, J.L.; Mignen, O.; Shuttleworth, T.J. The N-terminal domain of Orai3 determines selectivity for activation of the store-independent ARC channel by arachidonic acid. Channels 2010, 4, 398–410. [Google Scholar] [CrossRef] [Green Version]
- Mignen, O. Ca2+ Selectivity and Fatty Acid Specificity of the Noncapacitative, Arachidonate-regulated Ca2+ (ARC) Channels. J. Biol. Chem. 2003, 278, 10174–10181. [Google Scholar] [CrossRef] [Green Version]
- Dubois, C.; Abeele, F.V.; Lehen’Kyi, V.; Gkika, D.; Guarmit, B.; Lepage, G.; Slomianny, C.; Borowiec, A.S.; Bidaux, G.; Benahmed, M.; et al. Remodeling of Channel-Forming ORAI Proteins Determines an Oncogenic Switch in Prostate Cancer. Cancer Cell 2014, 26, 19–32. [Google Scholar] [CrossRef] [Green Version]
- Motiani, R.K.; Abdullaev, I.F.; Trebak, M. A Novel Native Store-operated Calcium Channel Encoded by Orai3. J. Biol. Chem. 2010, 285, 19173–19183. [Google Scholar] [CrossRef] [PubMed] [Green Version]
- Pla, A.F.; Grange, C.; Antoniotti, S.; Tomatis, C.; Merlino, A.; Bussolati, B.; Munaron, L. Arachidonic Acid-Induced Ca2+ Entry Is Involved in Early Steps of Tumor Angiogenesis. Mol. Cancer Res. 2008, 6, 535–545. [Google Scholar] [CrossRef] [PubMed] [Green Version]
- Kramer, R.M.; Sharp, J.D. Recent Insights into the Structure, Function and Biology of cPLA2. Agents Actions Suppl. 1995, 46, 65–76. [Google Scholar] [CrossRef] [PubMed]
- Tunset, H.M.; Feuerherm, A.J.; Selvik, L.-K.M.; Johansen, B.; Moestue, S.A. Cytosolic Phospholipase A2 Alpha Regulates TLR Signaling and Migration in Metastatic 4T1 Cells. Int. J. Mol. Sci. 2019, 20, 4800. [Google Scholar] [CrossRef] [PubMed] [Green Version]
- Yamashita, S.-I.; Yamashita, J.-I.; Sakamoto, K.; Inada, K.; Nakashima, Y.; Murata, K.; Saishoji, T.; Nomura, K.; Ogawa, M. Increased expression of membrane-associated phospholipase A2 shows malignant potential of human breast cancer cells. Cancer 1993, 71, 3058–3064. [Google Scholar] [CrossRef]
- Chiorazzo, M.G.; Tunset, H.M.; Popov, A.V.; Johansen, B.; Moestue, S.; Delikatny, E.J. Detection and Differentiation of Breast Cancer Sub-Types using a cPLA2α Activatable Fluorophore. Sci. Rep. 2019, 9, 6122. [Google Scholar] [CrossRef]
- Caiazza, F.; Harvey, B.J.; Thomas, W. Cytosolic Phospholipase A2 Activation Correlates with HER2 Overexpression and Mediates Estrogen-Dependent Breast Cancer Cell Growth. Mol. Endocrinol. 2010, 24, 953–968. [Google Scholar] [CrossRef] [Green Version]
- De Chatterjee, A.; Roy, D.; Guevara, P.; Pal, R.; Naryan, M.; Roychowdhury, S.; Das, S. Arachidonic Acid Induces the Migration of MDA-MB-231 Cells by Activating Raft-associated Leukotriene B4 Receptors. Clin. Cancer Drugs 2018, 5, 28–41. [Google Scholar] [CrossRef]
- Bocca, C.; Bozzo, F.; Martinasso, G.; Canuto, R.A.; Miglietta, A. Involvement of PPARalpha in the growth inhibitory effect of arachidonic acid on breast cancer cells. Br. J. Nutr. 2008, 100, 739–750. [Google Scholar] [CrossRef] [Green Version]
- Chang, N.-W.; Wu, C.-T.; Chen, D.-R.; Yeh, C.-Y.; Lin, C. High levels of arachidonic acid and peroxisome proliferator-activated receptor-alpha in breast cancer tissues are associated with promoting cancer cell proliferation. J. Nutr. Biochem. 2013, 24, 274–281. [Google Scholar] [CrossRef]
- Hong, S.H.; Avis, I.; Vos, M.D.; Martínez, A.; Treston, A.M.; Mulshine, J.L. Relationship of arachidonic acid metabolizing enzyme expression in epithelial cancer cell lines to the growth effect of selective biochemical inhibitors. Cancer Res. 1999, 59, 2223–2228. [Google Scholar] [PubMed]
- Schindl, R.; Bergsmann, J.; Frischauf, I.; Derler, I.; Fahrner, M.; Muik, M.; Fritsch, R.; Groschner, K.; Romanin, C. 2-Aminoethoxydiphenyl Borate Alters Selectivity of Orai3 Channels by Increasing Their Pore Size. J. Biol. Chem. 2008, 283, 20261–20267. [Google Scholar] [CrossRef] [PubMed] [Green Version]
- Dynes, J.L.; Amcheslavsky, A.; Cahalan, M.D. Genetically targeted single-channel optical recording reveals multiple Orai1 gating states and oscillations in calcium influx. Proc. Natl. Acad. Sci. USA 2015, 113, 440–445. [Google Scholar] [CrossRef] [PubMed] [Green Version]
- Rosado, J.A.; Lopez, J.J.; Redondo, P.C.; Salido, G.M.; Pariente, J.; Gomez-Arteta, E. Early caspase-3 activation independent of apoptosis is required for cellular function. J. Cell. Physiol. 2006, 209, 142–152. [Google Scholar] [CrossRef] [PubMed]
- Lopez, J.J.; Salido, G.M.; Gómez-Arteta, E.; Rosado, J.A.; Pariente, J. Thrombin induces apoptotic events through the generation of reactive oxygen species in human platelets. J. Thromb. Haemost. 2007, 5, 1283–1291. [Google Scholar] [CrossRef]
- Feng, M.; Grice, D.M.; Faddy, H.; Nguyen, N.; Leitch, S.; Wang, Y.; Muend, S.; Kenny, P.A.; Sukumar, S.; Roberts-Thomson, S.; et al. Store-Independent Activation of Orai1 by SPCA2 in Mammary Tumors. Cell 2010, 143, 84–98. [Google Scholar] [CrossRef] [Green Version]
- Mignen, O.; Thompson, J.L.; Shuttleworth, T.J. The molecular architecture of the arachidonate-regulated Ca2+-selective ARC channel is a pentameric assembly of Orai1 and Orai3 subunits. J. Physiol. 2009, 587, 4181–4197. [Google Scholar] [CrossRef]
- Ay, A.-S.; Benzerdjerb, N.; Sevestre, H.; Ahidouch, A.; Ouadid-Ahidouch, H. Orai3 Constitutes a Native Store-Operated Calcium Entry That Regulates Non Small Cell Lung Adenocarcinoma Cell Proliferation. PLoS ONE 2013, 8, e72889. [Google Scholar] [CrossRef] [Green Version]
- Leon, D.; Pacheco, J.; Chavez-Reyes, J.; Galindo, J.M.; Valdes, J.; Vaca, L.; Guerrero-Hernández, A. Orai3 channel is the 2-APB-induced endoplasmic reticulum calcium leak. Cell Calcium 2017, 65, 91–101. [Google Scholar] [CrossRef]
- Borowiec, A.-S.; Bidaux, G.; Tacine, R.; Dubar, P.; Pigat, N.; Delcourt, P.; Mignen, O.; Capiod, T. Are Orai1 and Orai3 channels more important than calcium influx for cell proliferation? Biochim. Biophys. Acta Bioenerg. 2014, 1843, 464–472. [Google Scholar] [CrossRef] [Green Version]
- Hasna, J.; Hague, F.; Rodat-Despoix, L.; Geerts, D.; Leroy, C.; Tulasne, D.; Ouadid-Ahidouch, H.; Kischel, P. Orai3 calcium channel and resistance to chemotherapy in breast cancer cells: The p53 connection. Cell Death Differ. 2018, 25, 693–707. [Google Scholar] [CrossRef] [PubMed]
- Chen, Y.; Wang, Y.; Huang, Y.; Zeng, H.; Hu, B.; Guan, L.; Zhang, H.; Yu, A.M.; Johnson, C.H.; Gonzalez, F.J.; et al. PPARalpha regulates tumor cell proliferation and senescence via a novel target gene carnitine palmitoyltransferase 1C. Carcinogenesis 2017, 38, 474–483. [Google Scholar] [CrossRef] [PubMed] [Green Version]
- Metzler, B.; Hu, Y.; Sturm, G.; Wick, G.; Xu, Q. Induction of Mitogen-activated Protein Kinase Phosphatase-1 by Arachidonic Acid in Vascular Smooth Muscle Cells. J. Biol. Chem. 1998, 273, 33320–33326. [Google Scholar] [CrossRef] [PubMed] [Green Version]
- Williams, J.; Leaver, H.; Ironside, J.W.; Miller, E.; Whittle, I.; Gregor, A. Apoptosis in human primary brain tumours: Actions of arachidonic acid. Prostaglandins Leukot. Essent. Fat. Acids 1998, 58, 193–200. [Google Scholar] [CrossRef]
- Wolf, L.A.; Laster, S.M. Characterization of arachidonic acid-induced apoptosis. Cell Biophys. 1999, 30, 353–368. [Google Scholar] [CrossRef]
- Garrido, R.; Mattson, M.P.; Hennig, B.; Toborek, M. Nicotine protects against arachidonic-acid-induced caspase activation, cytochrome c release and apoptosis of cultured spinal cord neurons. J. Neurochem. 2001, 76, 1395–1403. [Google Scholar] [CrossRef] [Green Version]
- Shin, S.M.; Kim, S.G. Inhibition of Arachidonic Acid and Iron-Induced Mitochondrial Dysfunction and Apoptosis by Oltipraz and Novel 1,2-Dithiole-3-thione Congeners. Mol. Pharmacol. 2008, 75, 242–253. [Google Scholar] [CrossRef] [Green Version]
- Maia, R.C.; Culver, C.A.; Laster, S.M. Evidence against calcium as a mediator of mitochondrial dysfunction during apoptosis induced by arachidonic acid and other free fatty acids. J. Immunol. 2006, 177, 6398–6404. [Google Scholar] [CrossRef] [Green Version]
- Prakriya, M.; Feske, S.; Gwack, Y.; Srikanth, S.; Rao, A.; Hogan, P.G. Orai1 is an essential pore subunit of the CRAC channel. Nature 2006, 443, 230–233. [Google Scholar] [CrossRef]
- Nunes-Hasler, P.; Maschalidi, S.; Lippens, C.; Castelbou, C.; Bouvet, S.; Guido, D.; Bermont, F.; Bassoy, E.Y.; Page, N.; Merkler, D.; et al. STIM1 promotes migration, phagosomal maturation and antigen cross-presentation in dendritic cells. Nat. Commun. 2017, 8, 1852. [Google Scholar] [CrossRef] [Green Version]
- Pauzi, A.Z.M.; Yeap, S.K.; Abu, N.; Lim, K.L.; Omar, A.; Abd-Aziz, S.; Leow, T.C.; Subramani, T.; Tan, S.; Alitheen, N.B. Combination of cisplatin and bromelain exerts synergistic cytotoxic effects against breast cancer cell line MDA-MB-231 in vitro. Chin. Med. 2016, 11, 46. [Google Scholar] [CrossRef] [PubMed] [Green Version]


© 2020 by the authors. Licensee MDPI, Basel, Switzerland. This article is an open access article distributed under the terms and conditions of the Creative Commons Attribution (CC BY) license (http://creativecommons.org/licenses/by/4.0/).
Share and Cite
Cantonero, C.; Sánchez-Collado, J.; Lopez, J.J.; Salido, G.M.; Rosado, J.A.; Redondo, P.C. Arachidonic Acid Attenuates Cell Proliferation, Migration and Viability by a Mechanism Independent on Calcium Entry. Int. J. Mol. Sci. 2020, 21, 3315. https://0-doi-org.brum.beds.ac.uk/10.3390/ijms21093315
Cantonero C, Sánchez-Collado J, Lopez JJ, Salido GM, Rosado JA, Redondo PC. Arachidonic Acid Attenuates Cell Proliferation, Migration and Viability by a Mechanism Independent on Calcium Entry. International Journal of Molecular Sciences. 2020; 21(9):3315. https://0-doi-org.brum.beds.ac.uk/10.3390/ijms21093315
Chicago/Turabian StyleCantonero, Carlos, Jose Sánchez-Collado, Jose J. Lopez, Ginés M. Salido, Juan A. Rosado, and Pedro C. Redondo. 2020. "Arachidonic Acid Attenuates Cell Proliferation, Migration and Viability by a Mechanism Independent on Calcium Entry" International Journal of Molecular Sciences 21, no. 9: 3315. https://0-doi-org.brum.beds.ac.uk/10.3390/ijms21093315