Probing Nanoelectroporation and Resealing of the Cell Membrane by the Entry of Ca2+ and Ba2+ Ions

 , , and
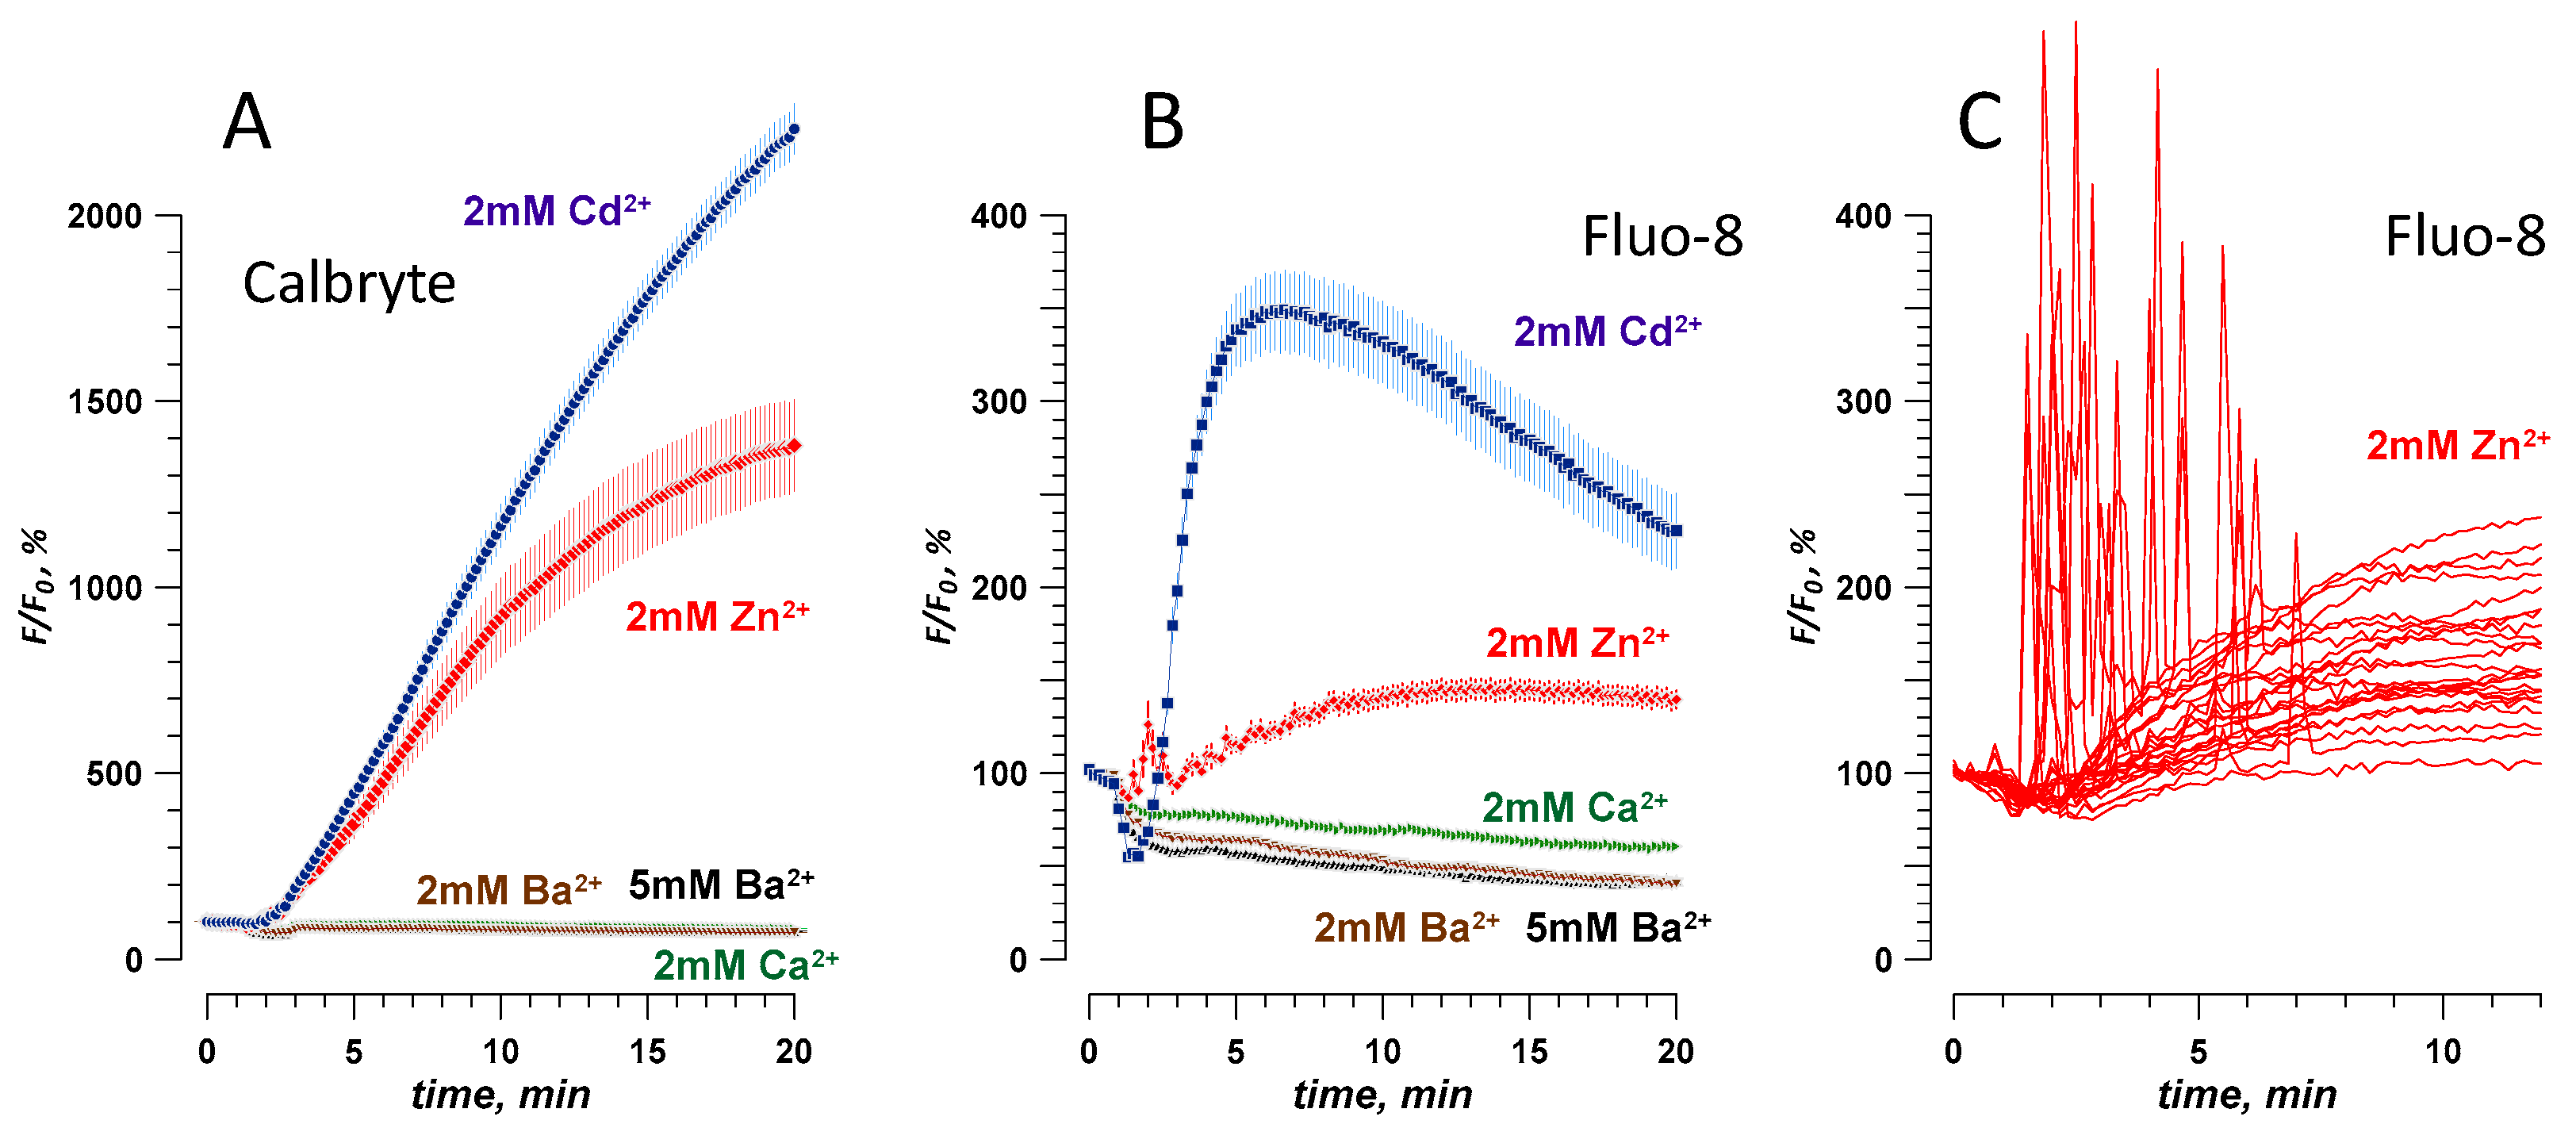
Abstract
:1. Introduction
- (1)
- Whole-cell patch clamp, which is arguably the most sensitive and quantitative technique. It is, however, most laborious (one cell at a time) and prone to diverse artifacts due to the nsPEF pickup by the amplifier. It requires either a temporary disconnection of the amplifier when nsPEF is applied [22], or nsPEF exposure of cells prior to the whole-cell formation [17,23], or a confirmation of patch-clamp data by independent (e.g., optical) methods [11,15,16,24,25].
- (2)
- Measurements of changes in the cell or bleb volume, which result from the colloid-osmotic water uptake or loss [14,15,26]. This method is surprisingly sensitive to the molecular size of the solute, which is admitted (or not) into the cell through nanopores, thereby yielding an accurate estimate of pore size. The measurements are, however, indirect and relatively slow.
- (3)
- Fluorescence detection of the entry or leakage of ions or dyes is by far the most common method of detection and quantitation of membrane electropermeabilization [13,15,21,27,28,29,30]. Dyes like propidium (Pr) iodide and YO-PRO-1 chloride display little fluorescence outside of the cell and have poor or no permeability through the intact cell membrane. Once the membrane integrity is compromised, the dyes enter the cell and bind to nucleic acids, which greatly enhances the fluorescence signal. The method is fast and semi-quantitative, as the emission gain is proportional to the number of dye molecules entering the cell in a given time interval [21,30].
2. Results
2.1. Intact Cell Permeability to Cd2+, Zn2+, Ba2+, and Ca2+
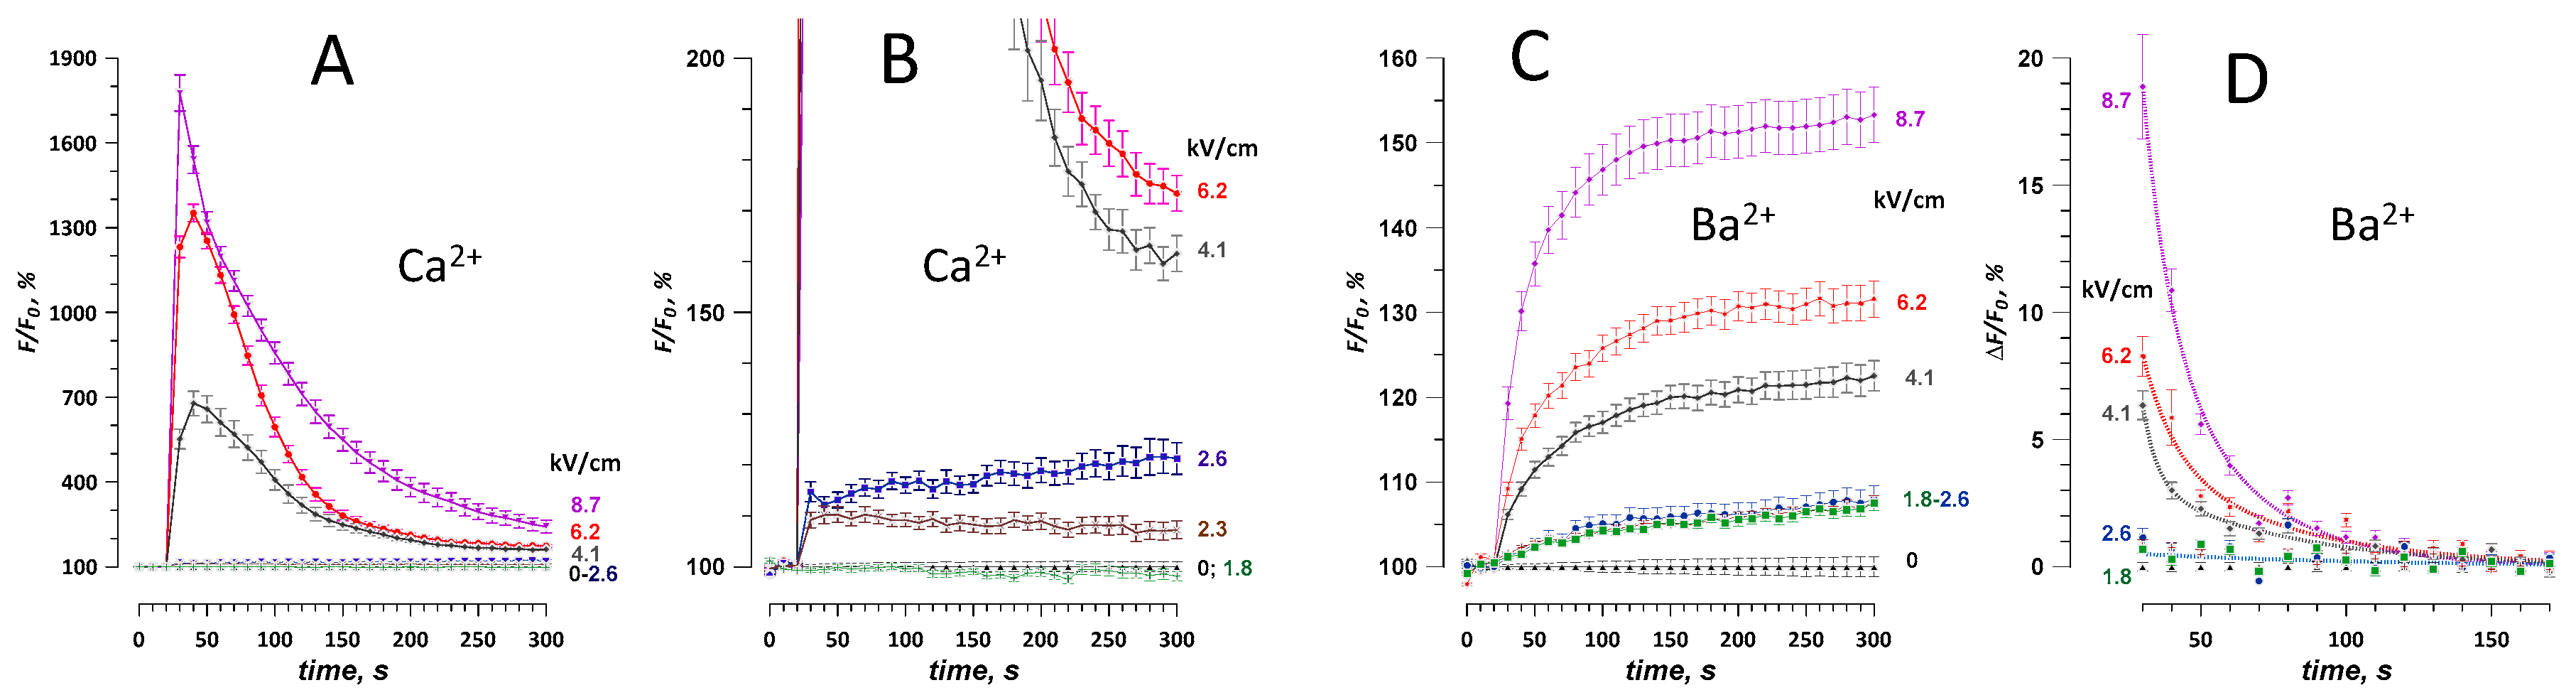
2.2. Effect of a Single 300-ns Pulse at Different Electric Field Strengths
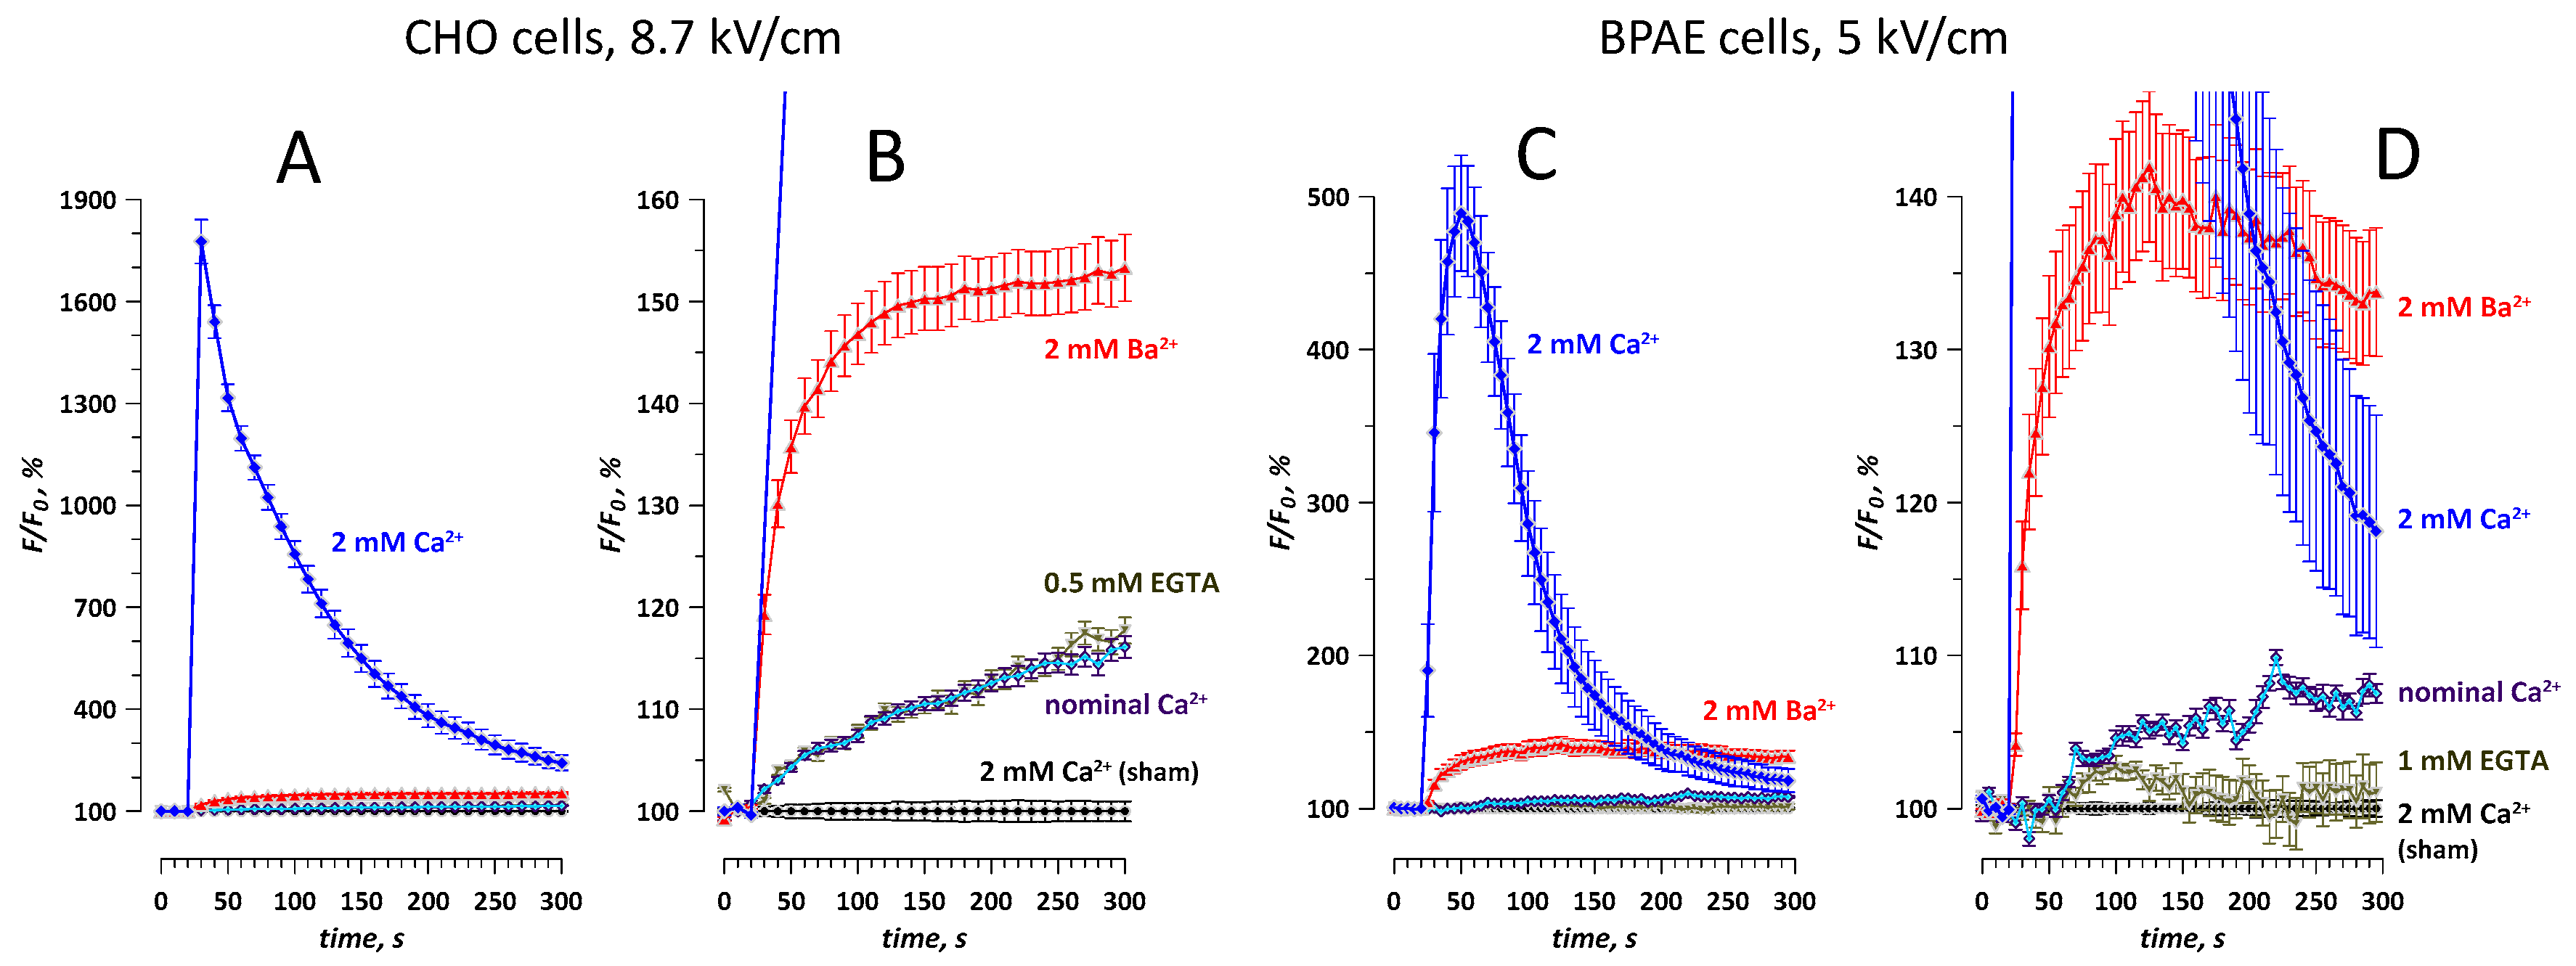
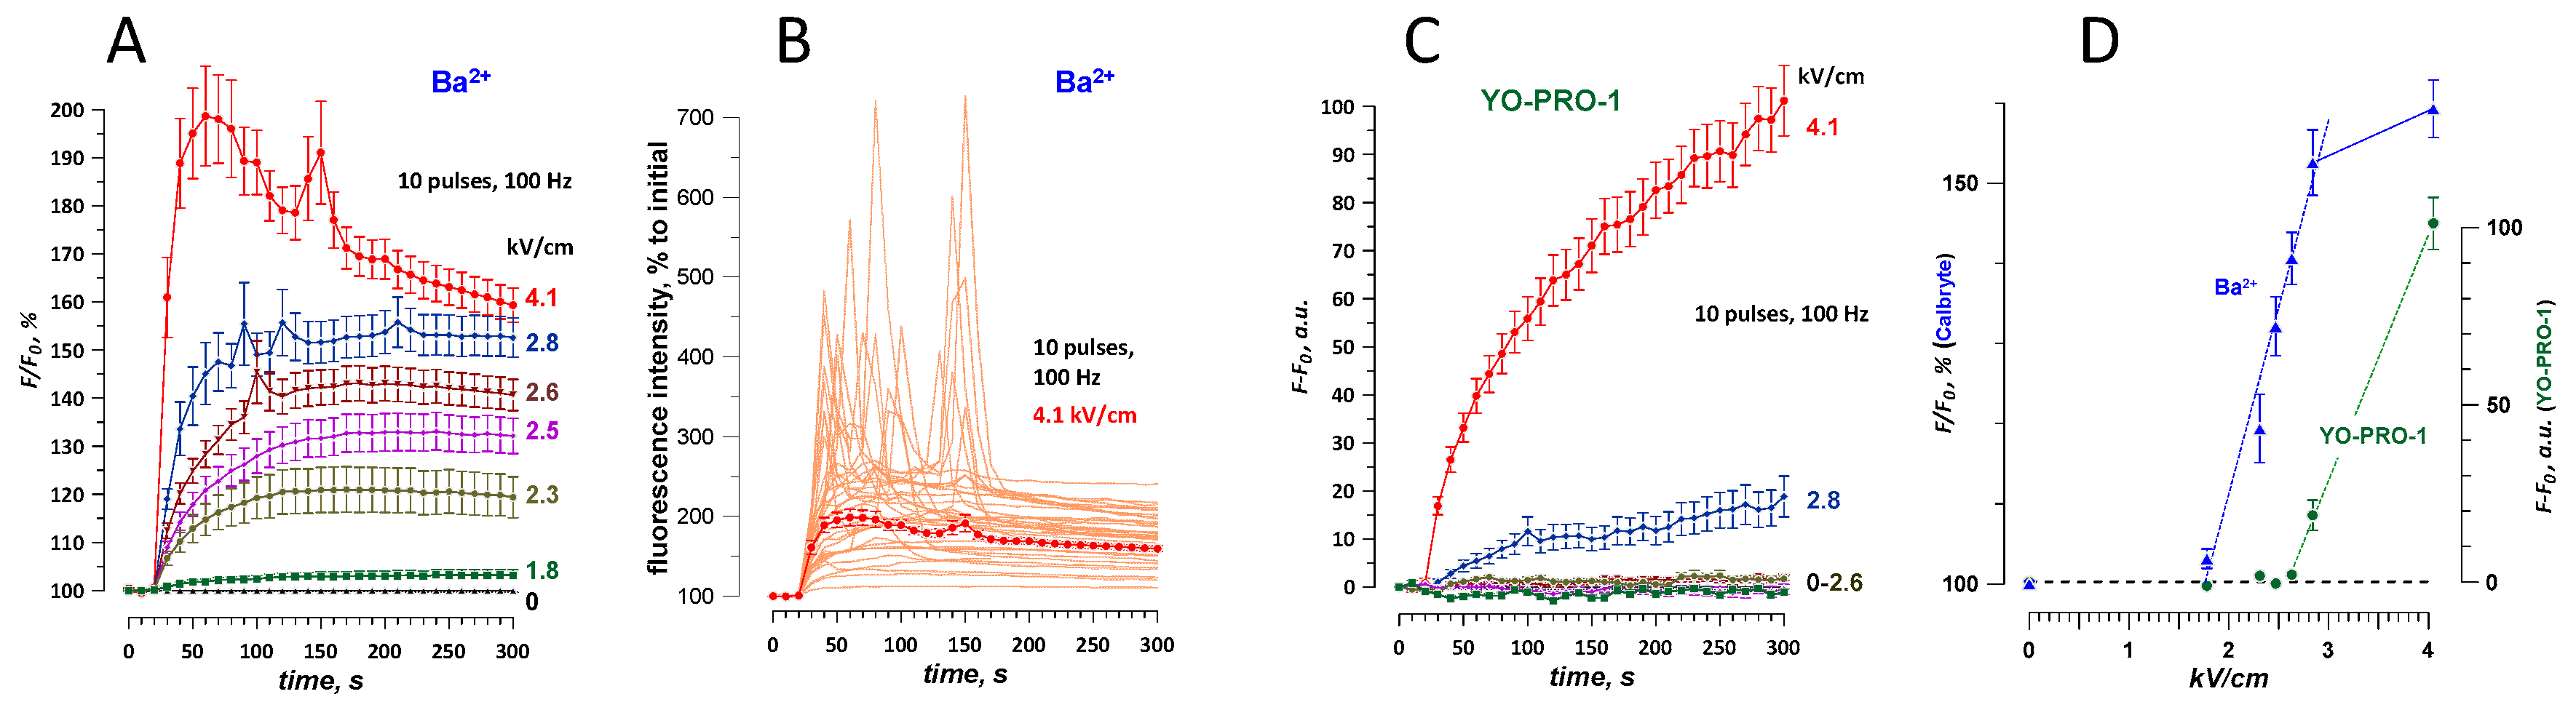
2.3. Nominal Ca2+ and Intracellular Ca2+ Stores May Contribute to Ba2+ Entry Response to nsPEF
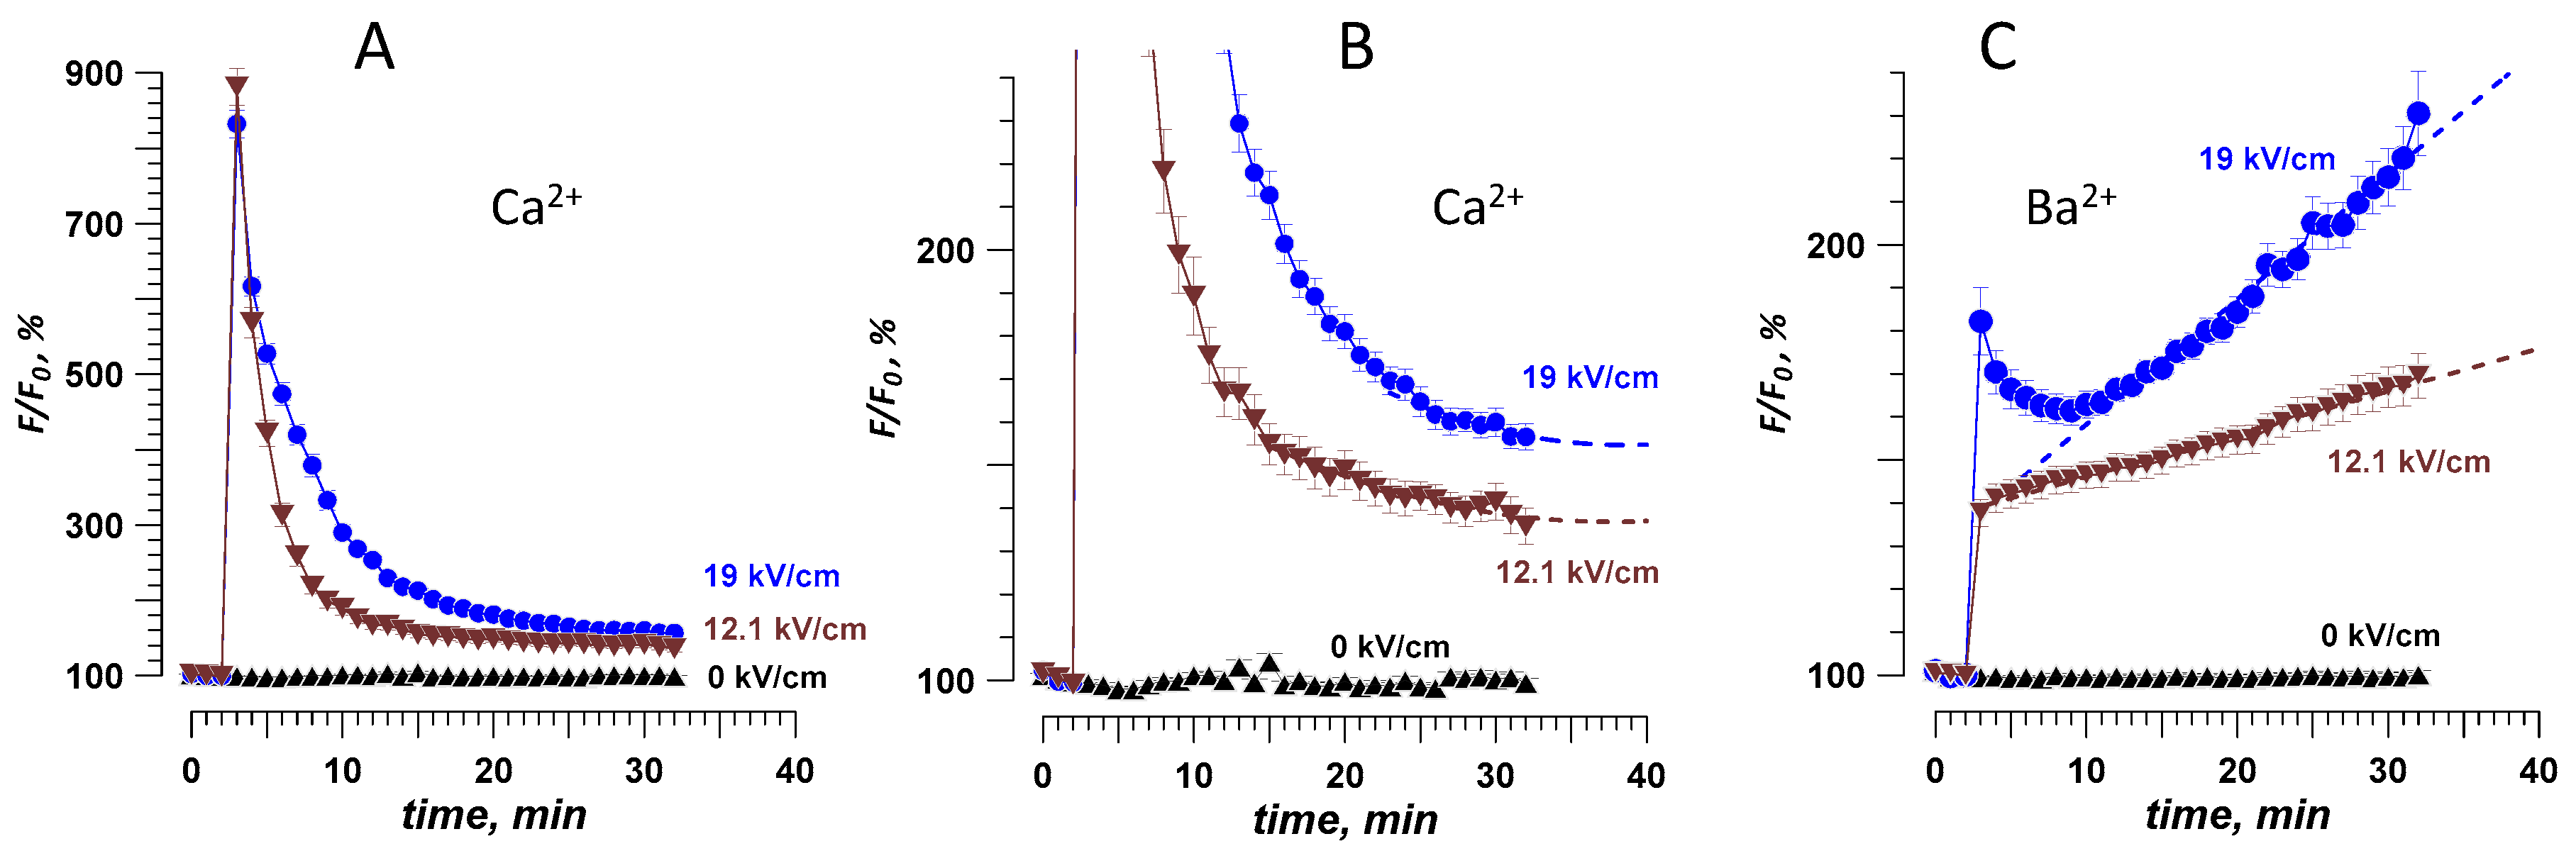
2.4. Different Time Courses of Ca2+ and Ba2+ Effects over an Extended Time Interval after nsPEF
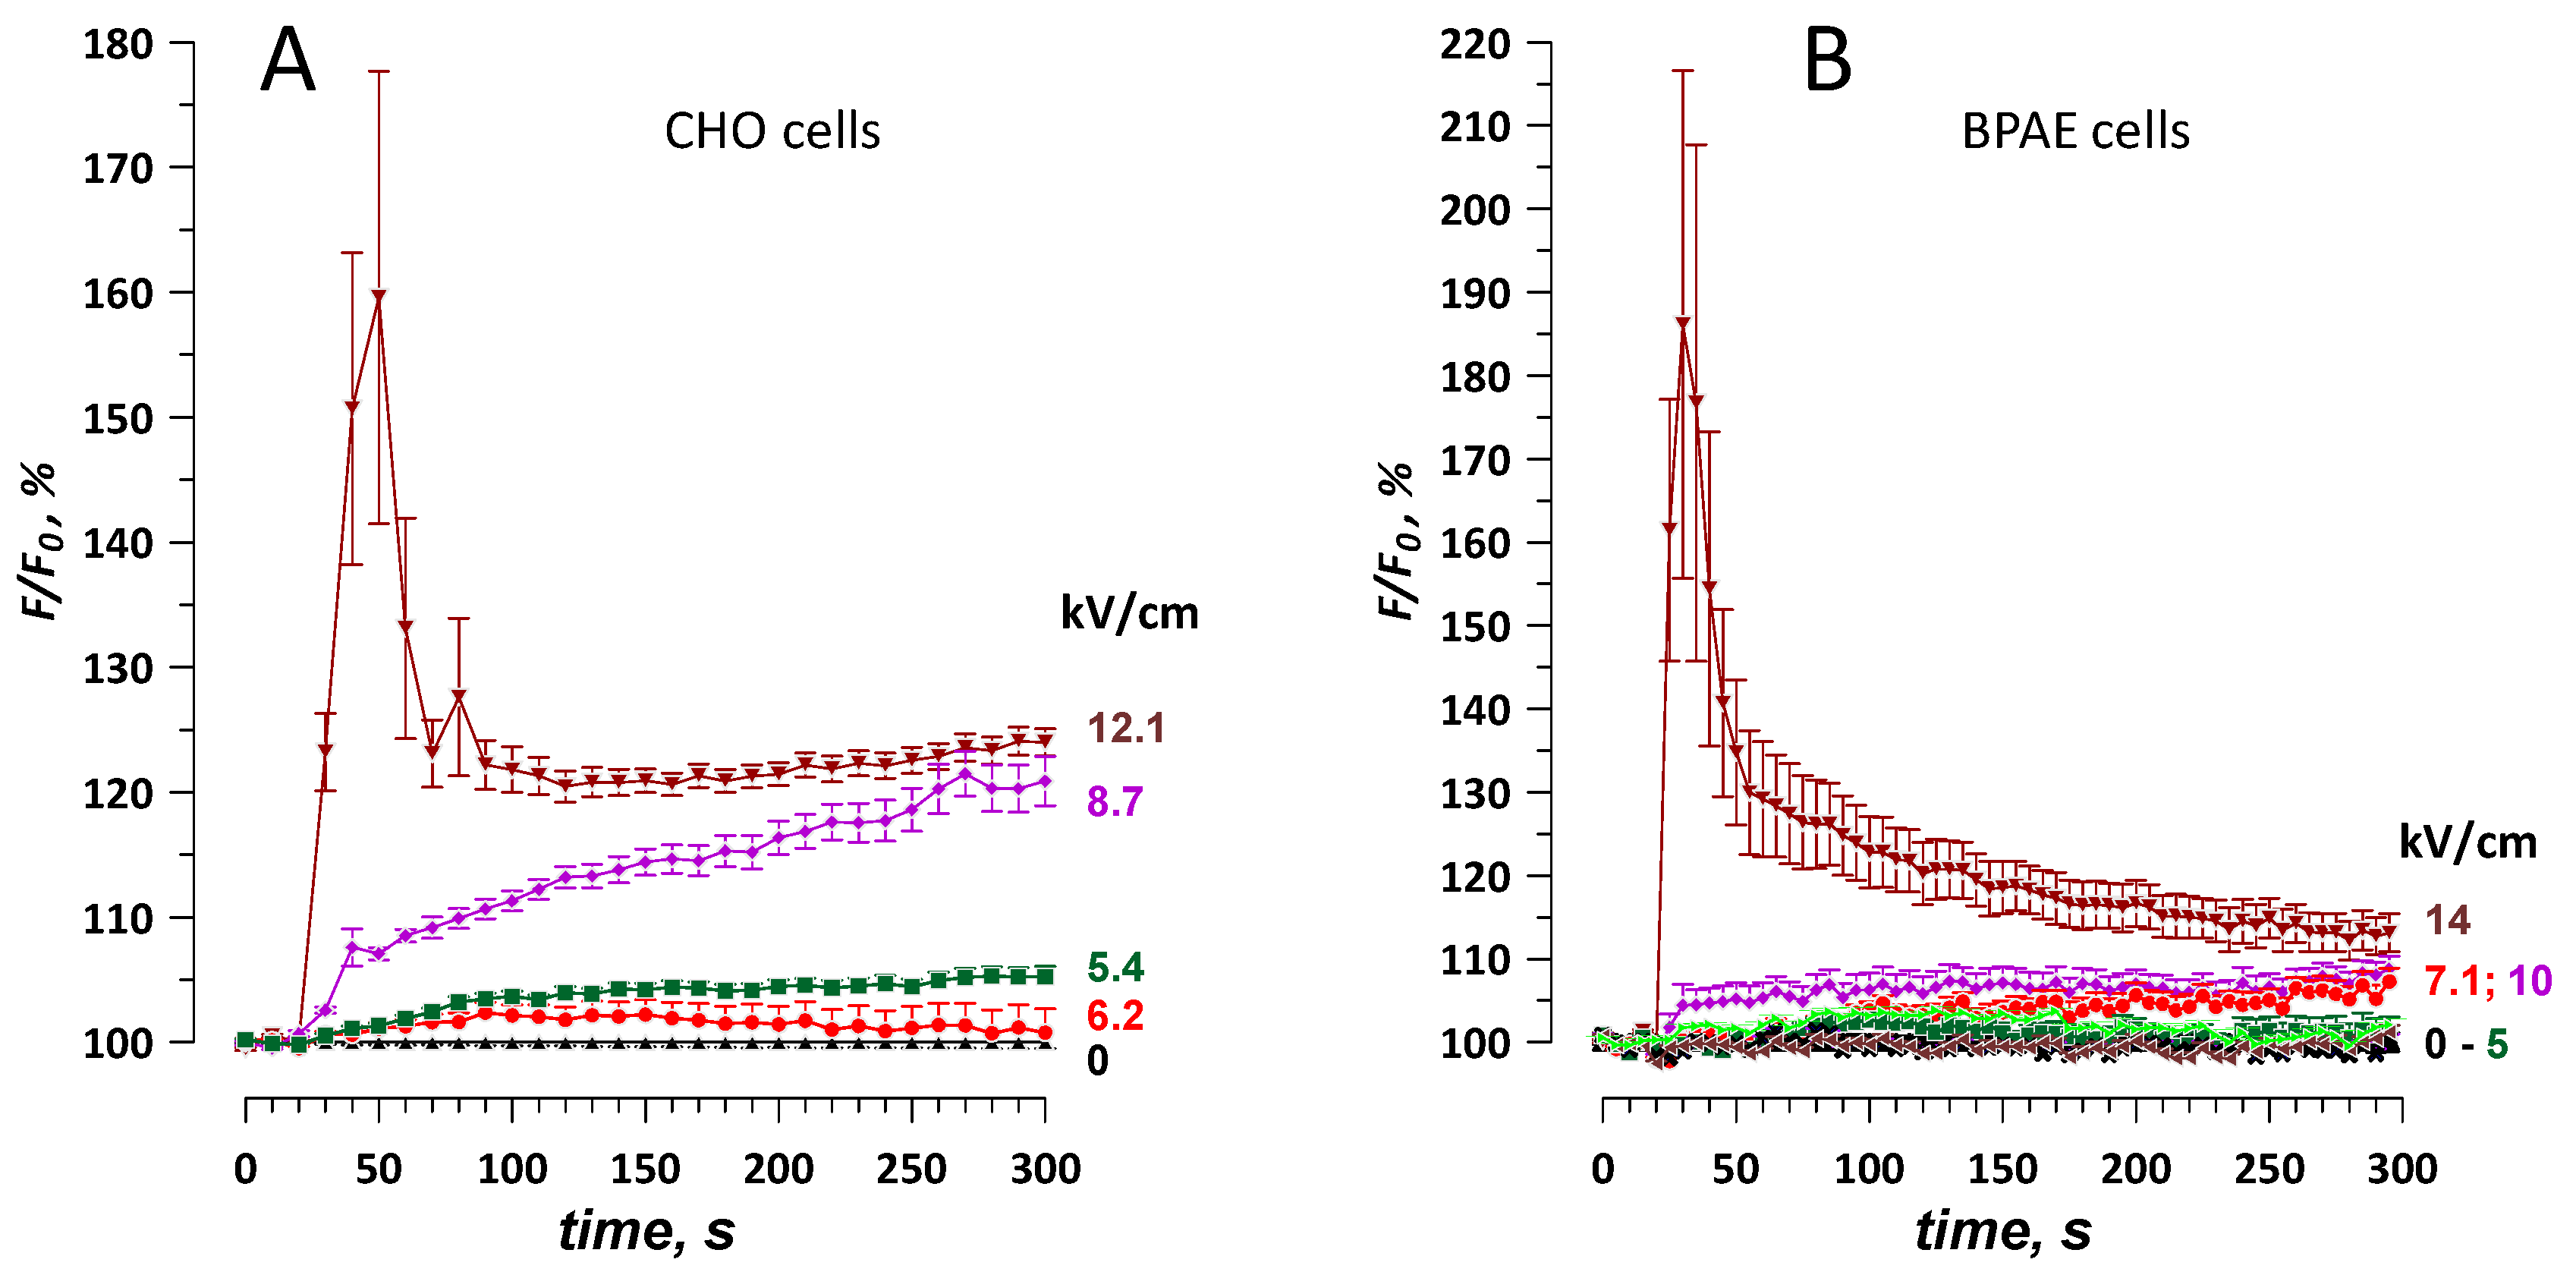
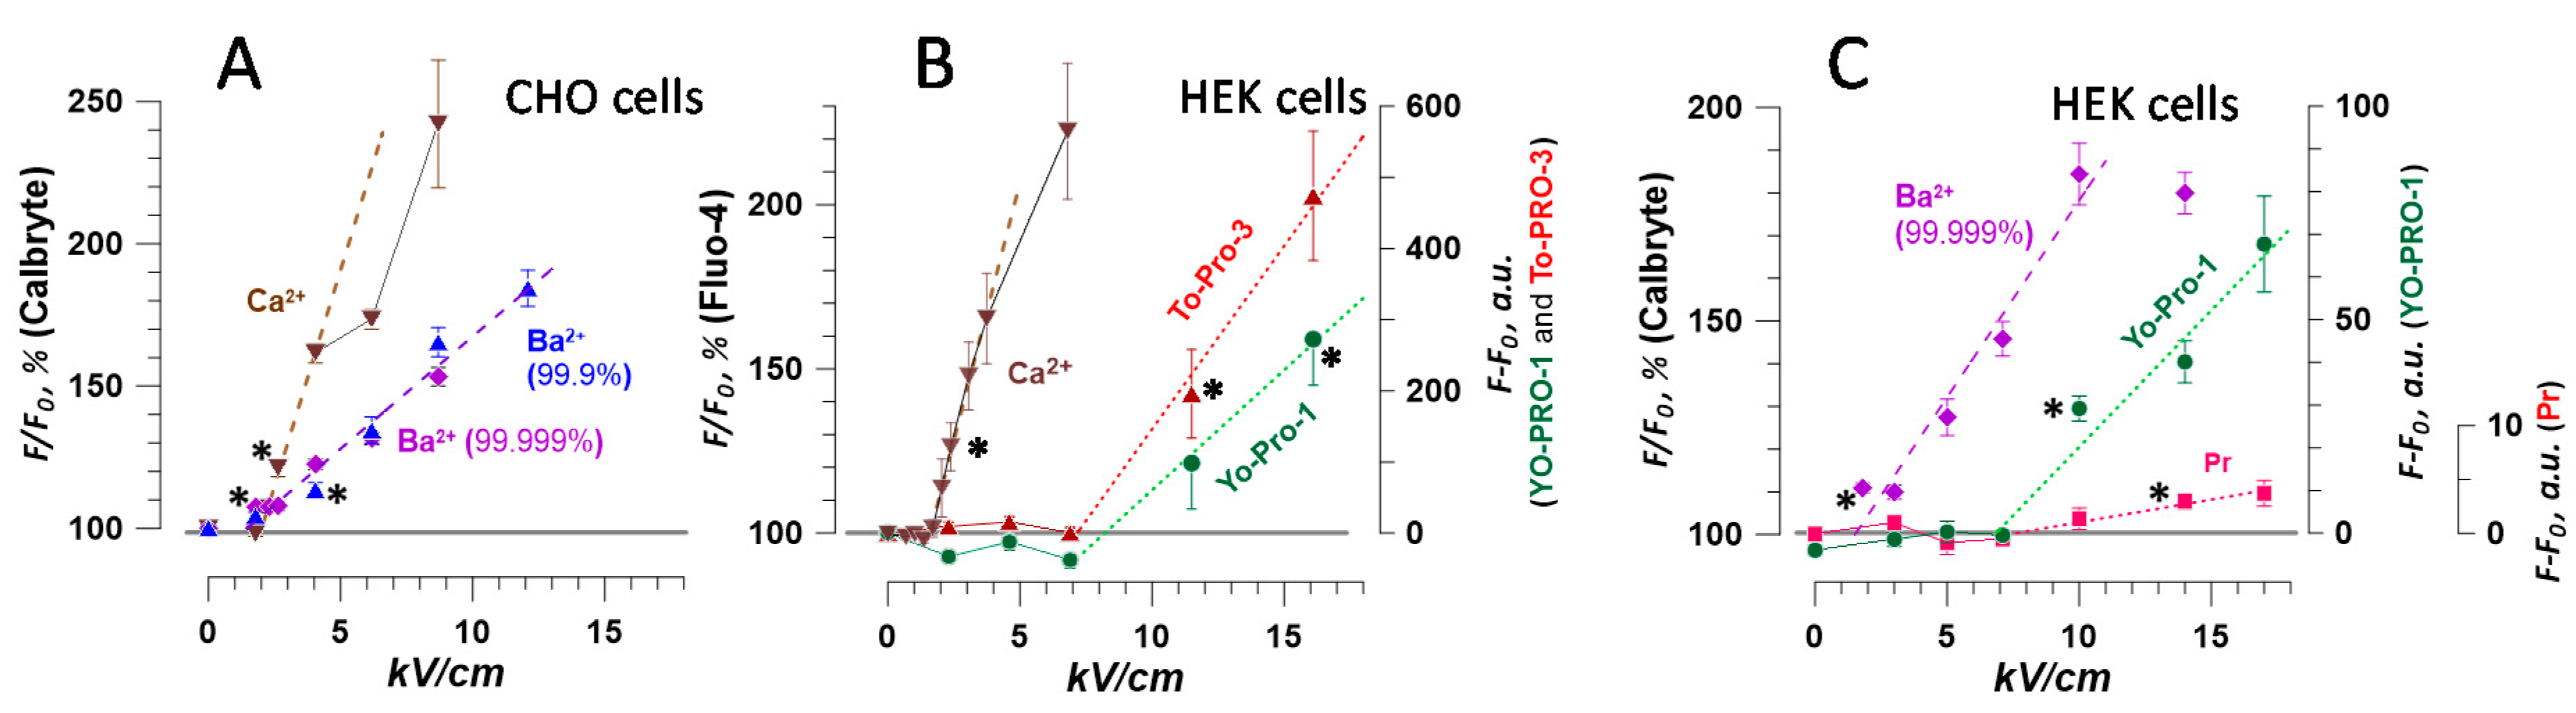
2.5. The Dose-Effect and Sensitivity for Ca2+ and Ba2+ Detection Compared to the Uptake of Membrane-Impermeable Nucleic Stains
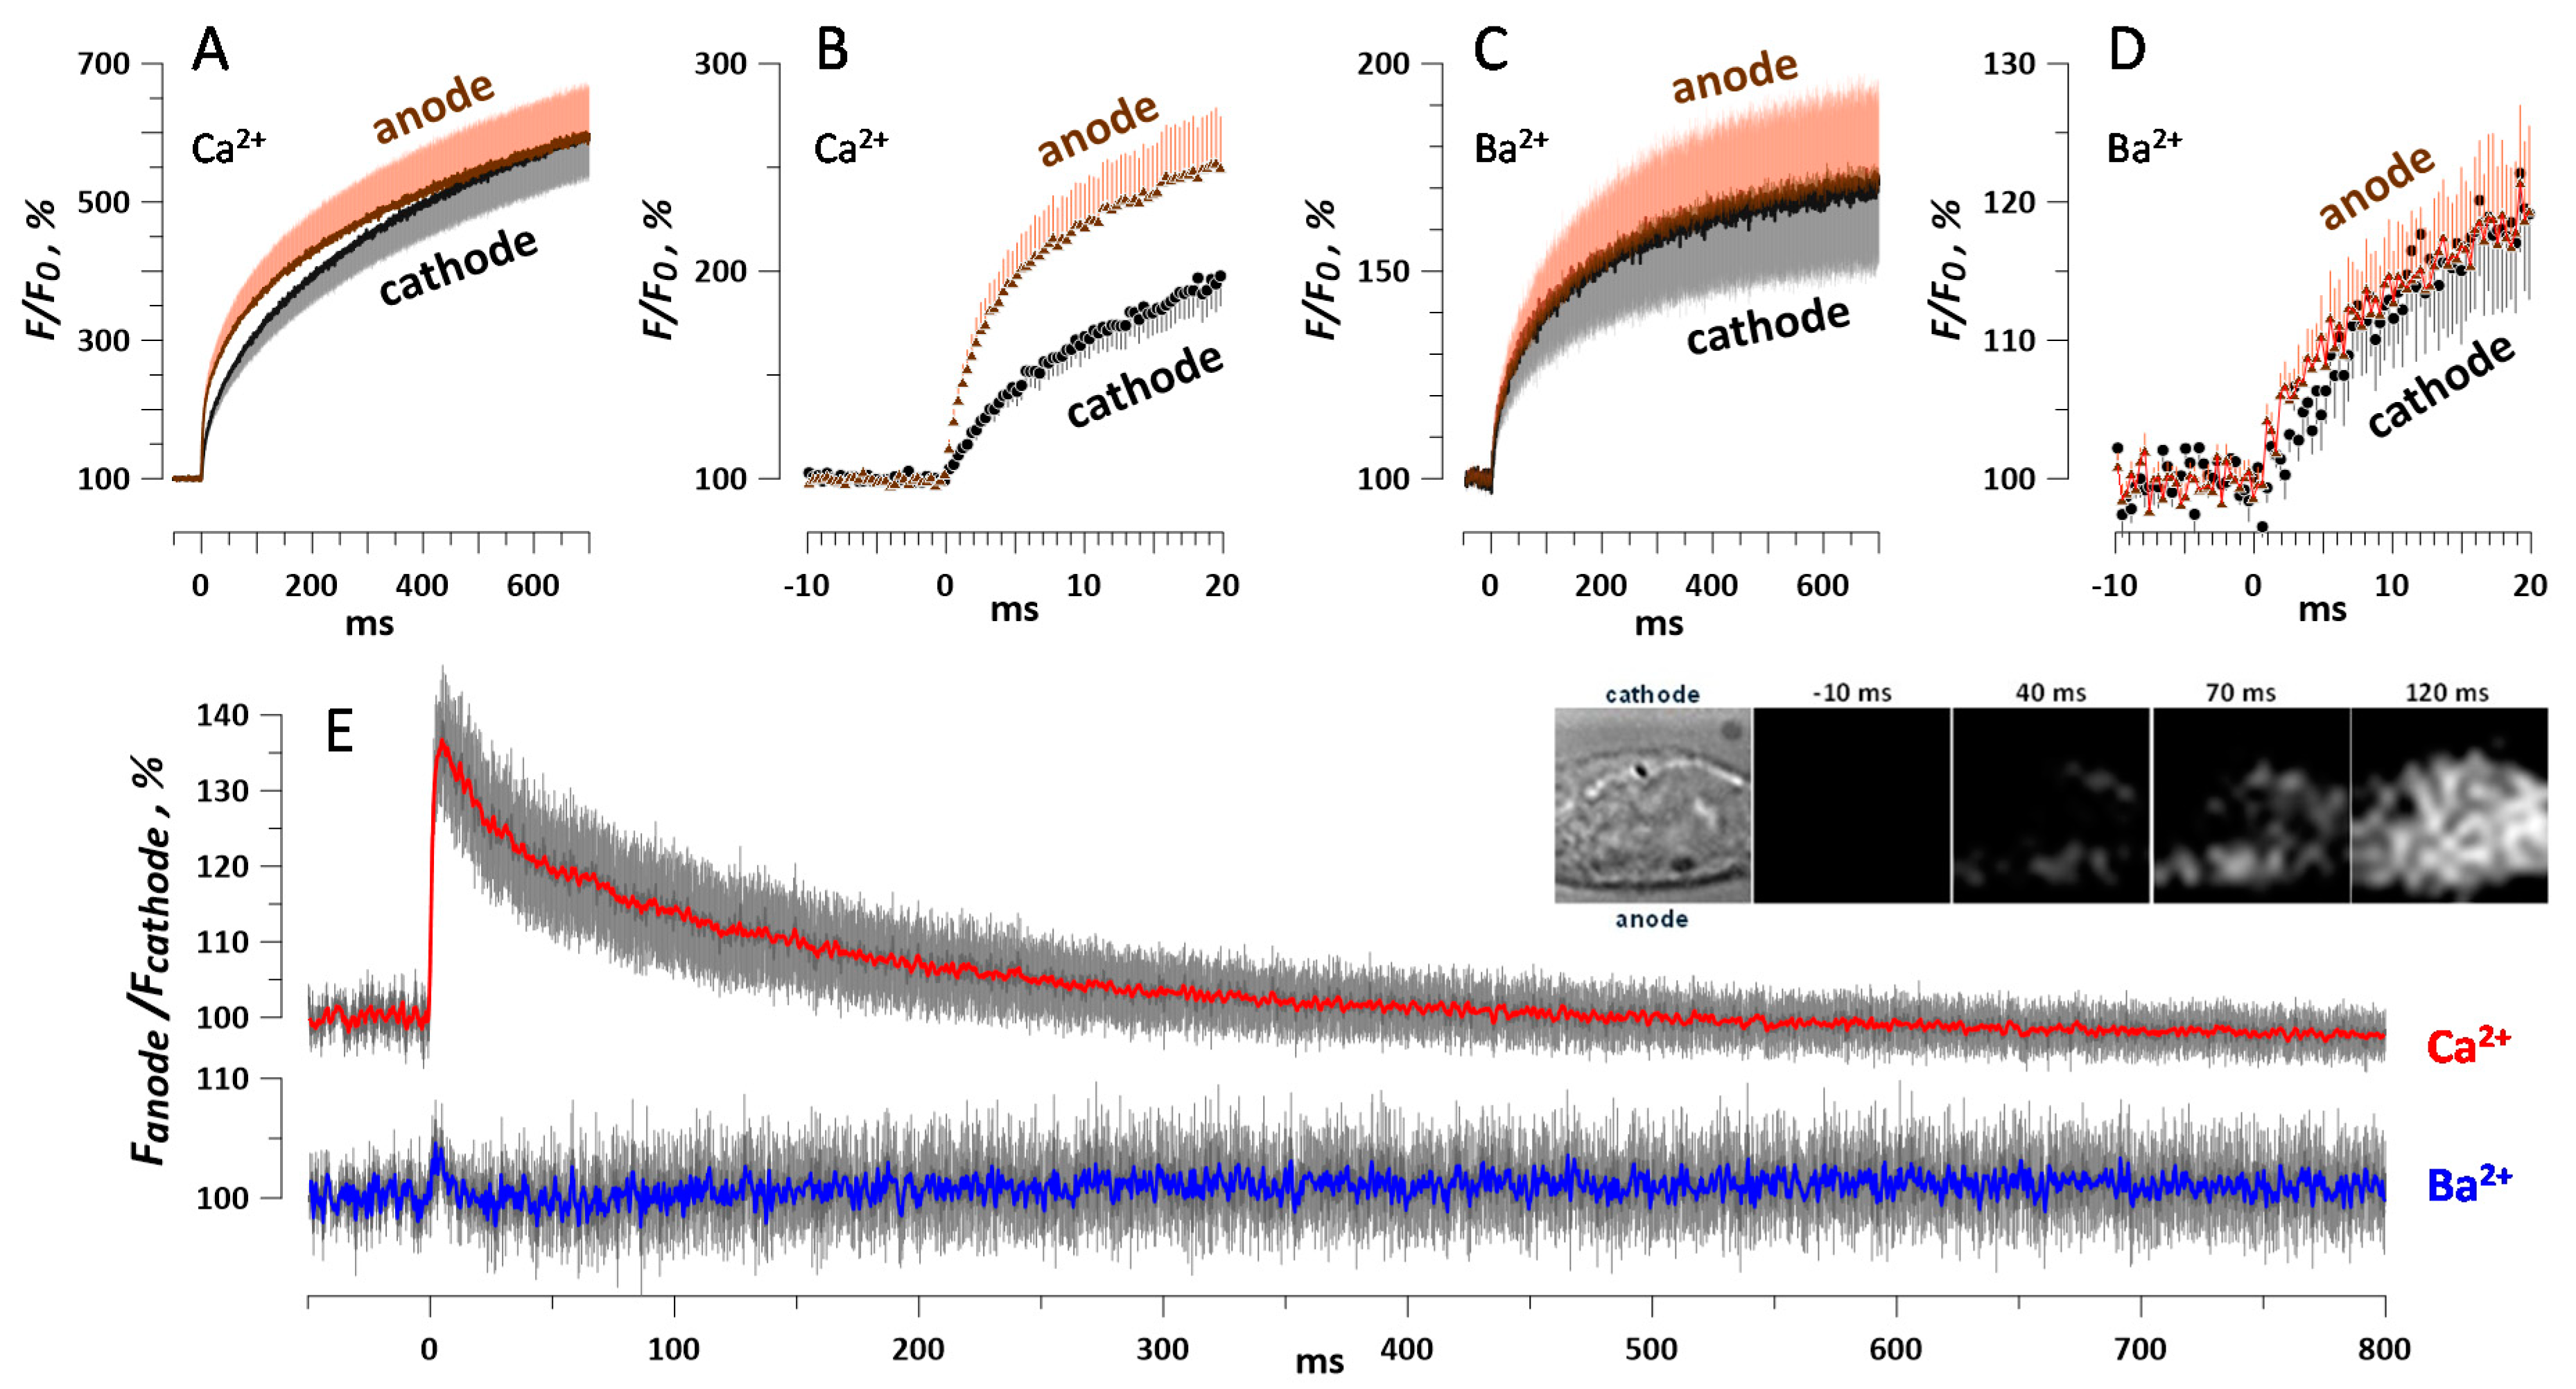
2.6. Fast Imaging of Ca2+ and Ba2+ Entry and the Asymmetry of nsPEF Effects
3. Discussion
4. Materials and Methods
4.1. Cells and Media
4.2. Solutions and Fluorescence Dyes
4.3. Cell Imaging and Fluorescence Measurements
4.4. Nanosecond Pulsed Electric Field Generation, Exposure, and Dosimetry
4.5. Experiment Protocols, Statistics, and Fluorescence Data Analysis
Author Contributions
Funding
Conflicts of Interest
Abbreviations
| nsPEF | Nanosecond pulsed electric field |
| CICR | Calcium-induced calcium release |
| Pr | Propidium |
References
- Zimmermann, U.; Neil, G.A. (Eds.) Electromanipulation of Cells; CRC Press: Boca Raton, FL, USA, 1996. [Google Scholar]
- Neumann, E.; Sowers, A.E.; Jordan, C.A. (Eds.) Electroporation and Electrofusion in Cell Biology; Plenum: New York, NY, USA, 1989. [Google Scholar]
- Golzio, M.; Teissie, J.; Rols, M.P. Direct visualization at the single-cell level of electrically mediated gene delivery. Proc. Natl. Acad. Sci. USA 2002, 99, 1292–1297. [Google Scholar] [CrossRef] [PubMed] [Green Version]
- Pakhomov, A.G.; Miklavcic, D.; Markov, M.S. (Eds.) Advanced Electroporation Techniques in Biology in Medicine; CRC Press: Boca Raton, FL, USA, 2010; p. 528. [Google Scholar]
- Breton, M.; Mir, L.M. Microsecond and nanosecond electric pulses in cancer treatments. Bioelectromagnetics 2012, 33, 106–123. [Google Scholar] [CrossRef] [PubMed]
- Schoenbach, K.S.; Hargrave, B.; Joshi, R.P.; Kolb, J.; Osgood, C.; Nuccitelli, R.; Pakhomov, A.G.; Swanson, J.; Stacey, M.; White, J.A.; et al. Bioelectric Effects of Nanosecond Pulses. IEEE Trans. Dielectr. Electr. Insul. 2007, 14, 1088–1109. [Google Scholar] [CrossRef] [Green Version]
- Napotnik, T.B.; Wu, Y.H.; Gundersen, M.A.; Miklavcic, D.; Vernier, P.T. Nanosecond electric pulses cause mitochondrial membrane permeabilization in Jurkat cells. Bioelectromagnetics 2012, 33, 257–264. [Google Scholar] [CrossRef] [PubMed]
- Semenov, I.; Xiao, S.; Pakhomova, O.N.; Pakhomov, A.G. Recruitment of the intracellular Ca2+ by ultrashort electric stimuli: The impact of pulse duration. Cell Calcium 2013, 54, 145–150. [Google Scholar] [CrossRef] [PubMed] [Green Version]
- Gowrishankar, T.R.; Esser, A.T.; Vasilkoski, Z.; Smith, K.C.; Weaver, J.C. Microdosimetry for conventional and supra-electroporation in cells with organelles. Biochem. Biophys. Res. Commun. 2006, 341, 1266–1276. [Google Scholar] [CrossRef] [PubMed]
- Casciola, M.; Xiao, S.; Apollonio, F.; Paffi, A.; Liberti, M.; Muratori, C.; Pakhomov, A.G. Cancellation of nerve excitation by the reversal of nanosecond stimulus polarity and its relevance to the gating time of sodium channels. Cell. Mol. Life Sci. 2019, 76, 4539–4550. [Google Scholar] [CrossRef] [PubMed]
- Gianulis, E.C.; Lee, J.; Jiang, C.; Xiao, S.; Ibey, B.L.; Pakhomov, A.G. Electroporation of mammalian cells by nanosecond electric field oscillations and its inhibition by the electric field reversal. Sci. Rep. 2015, 5, 13818. [Google Scholar] [CrossRef]
- Pakhomov, A.G.; Semenov, I.; Xiao, S.; Pakhomova, O.N.; Gregory, B.; Schoenbach, K.H.; Ullery, J.C.; Beier, H.T.; Rajulapati, S.R.; Ibey, B.L. Cancellation of cellular responses to nanoelectroporation by reversing the stimulus polarity. Cell. Mol. Life Sci. 2014, 71, 4431–4441. [Google Scholar] [CrossRef] [Green Version]
- Sozer, E.B.; Vernier, P.T. Modulation of biological responses to 2ns electrical stimuli by field reversal. Biochim. Biophys. Acta Biomembr. 2019, 1861, 1228–1239. [Google Scholar] [CrossRef]
- Nesin, O.M.; Pakhomova, O.N.; Xiao, S.; Pakhomov, A.G. Manipulation of cell volume and membrane pore comparison following single cell permeabilization with 60- and 600-ns electric pulses. Biochim. Biophys. Acta 2011, 1808, 792–801. [Google Scholar] [CrossRef] [PubMed] [Green Version]
- Pakhomov, A.G.; Pakhomova, O.N. Nanopores: A distinct transmembrane passageway in electroporated cells. In Advanced Electroporation Techniques in Biology in Medicine; Pakhomov, A.G., Miklavcic, D., Markov, M.S., Eds.; CRC Press: Boca Raton, FL, USA, 2010; pp. 178–194. [Google Scholar]
- Pakhomov, A.G.; Bowman, A.M.; Ibey, B.L.; Andre, F.M.; Pakhomova, O.N.; Schoenbach, K.H. Lipid nanopores can form a stable, ion channel-like conduction pathway in cell membrane. Biochem. Biophys. Res. Commun. 2009, 385, 181–186. [Google Scholar] [CrossRef] [PubMed] [Green Version]
- Pakhomov, A.G.; Shevin, R.; White, J.A.; Kolb, J.F.; Pakhomova, O.N.; Joshi, R.P.; Schoenbach, K.H. Membrane permeabilization and cell damage by ultrashort electric field shocks. Arch. Biochem. Biophys. 2007, 465, 109–118. [Google Scholar] [CrossRef] [PubMed]
- Gowrishankar, T.R.; Weaver, J.C. Electrical behavior and pore accumulation in a multicellular model for conventional and supra-electroporation. Biochem. Biophys. Res. Commun. 2006, 349, 643–653. [Google Scholar] [CrossRef] [Green Version]
- Siwy, Z.; Gu, Y.; Spohr, H.A.; Baur, D.; Wolf-Reber, A.; Spohr, R.; Apel, P.; Korchev, Y.E. Rectification and voltage gating of ion currents in a nanofabricated pore. Europhys. Lett. 2002, 60, 349–355. [Google Scholar] [CrossRef]
- Sozer, E.B.; Levine, Z.A.; Vernier, P.T. Quantitative Limits on Small Molecule Transport via the Electropermeome—Measuring and Modeling Single Nanosecond Perturbations. Sci. Rep. 2017, 7, 57. [Google Scholar] [CrossRef]
- Batista Napotnik, T.; Miklavcic, D. In vitro electroporation detection methods—An overview. Bioelectrochemistry 2018, 120, 166–182. [Google Scholar] [CrossRef]
- Yoon, J.; Leblanc, N.; Zaklit, J.; Vernier, P.T.; Chatterjee, I.; Craviso, G.L. Enhanced Monitoring of Nanosecond Electric Pulse-Evoked Membrane Conductance Changes in Whole-Cell Patch Clamp Experiments. J. Membr. Biol. 2016, 249, 633–644. [Google Scholar] [CrossRef]
- Ibey, B.L.; Xiao, S.; Schoenbach, K.H.; Murphy, M.R.; Pakhomov, A.G. Plasma membrane permeabilization by 60- and 600-ns electric pulses is determined by the absorbed dose. Bioelectromagnetics 2009, 30, 92–99. [Google Scholar] [CrossRef] [Green Version]
- Hristov, K.; Mangalanathan, U.; Casciola, M.; Pakhomova, O.N.; Pakhomov, A.G. Expression of voltage-gated calcium channels augments cell susceptibility to membrane disruption by nanosecond pulsed electric field. Biochim. Biophys. Acta (BBA) Biomembr. 2018, 1860, 2175–2183. [Google Scholar] [CrossRef]
- Semenov, I.; Xiao, S.; Pakhomov, A.G. Electroporation by subnanosecond pulses. Biochem. Biophys. Rep. 2016, 6, 253–259. [Google Scholar] [CrossRef] [PubMed] [Green Version]
- Pakhomova, O.N.; Gregory, B.; Semenov, I.; Pakhomov, A.G. Calcium-mediated pore expansion and cell death following nanoelectroporation. Biochim. Biophys. Acta 2014, 1838, 2547–2554. [Google Scholar] [CrossRef] [PubMed] [Green Version]
- Vernier, P.T.; Sun, Y.; Gundersen, M.A. Nanoelectropulse-driven membrane perturbation and small molecule permeabilization. BMC Cell Biol. 2006, 7, 37. [Google Scholar] [CrossRef] [PubMed] [Green Version]
- Bowman, A.M.; Nesin, O.M.; Pakhomova, O.N.; Pakhomov, A.G. Analysis of plasma membrane integrity by fluorescent detection of Tl(+) uptake. J. Membr. Biol. 2010, 236, 15–26. [Google Scholar] [CrossRef] [Green Version]
- Craviso, G.L.; Choe, S.; Chatterjee, P.; Chatterjee, I.; Vernier, P.T. Nanosecond electric pulses: A novel stimulus for triggering Ca2+ influx into chromaffin cells via voltage-gated Ca2+ channels. Cell. Mol. Neurobiol. 2010, 30, 1259–1265. [Google Scholar] [CrossRef] [PubMed]
- Pakhomov, A.G.; Gianulis, E.; Vernier, P.T.; Semenov, I.; Xiao, S.; Pakhomova, O.N. Multiple nanosecond electric pulses increase the number but not the size of long-lived nanopores in the cell membrane. Biochim. Biophys. Acta 2015, 1848, 958–966. [Google Scholar] [CrossRef] [Green Version]
- Semenov, I.; Casciola, M.; Ibey, B.L.; Xiao, S.; Pakhomov, A.G. Electropermeabilization of cells by closely spaced paired nanosecond-range pulses. Bioelectrochemistry 2018, 121, 135–141. [Google Scholar] [CrossRef]
- Vernier, P.T.; Sun, Y.; Chen, M.T.; Gundersen, M.A.; Craviso, G.L. Nanosecond electric pulse-induced calcium entry into chromaffin cells. Bioelectrochemistry 2008, 73, 1–4. [Google Scholar] [CrossRef]
- Semenov, I.; Xiao, S.; Pakhomov, A.G. Primary pathways of intracellular Ca(2+) mobilization by nanosecond pulsed electric field. Biochim. Biophys. Acta 2013, 1828, 981–989. [Google Scholar] [CrossRef] [Green Version]
- Bagalkot, T.R.; Terhune, R.C.; Leblanc, N.; Craviso, G.L. Different Membrane Pathways Mediate Ca2+ Influx in Adrenal Chromaffin Cells Exposed to 150–400 ns Electric Pulses. BioMed Res. Int. 2018, 2018, 12. [Google Scholar] [CrossRef] [Green Version]
- Roth, C.C.; Tolstykh, G.P.; Payne, J.A.; Kuipers, M.A.; Thompson, G.L.; DeSilva, M.N.; Ibey, B.L. Nanosecond pulsed electric field thresholds for nanopore formation in neural cells. J. Biomed. Opt. 2013, 18, 035005. [Google Scholar] [CrossRef] [PubMed] [Green Version]
- Azarov, J.E.; Semenov, I.; Casciola, M.; Pakhomov, A.G. Excitation of murine cardiac myocytes by nanosecond pulsed electric field. J. Cardiovasc. Electrophysiol. 2019, 30, 392–401. [Google Scholar] [CrossRef] [PubMed]
- Tolstykh, G.P.; Cantu, J.C.; Tarango, M.; Ibey, B.L. Receptor- and store-operated mechanisms of calcium entry during the nanosecond electric pulse-induced cellular response. Biochim. Biophys. Acta Biomembr. 2019, 1861, 685–696. [Google Scholar] [CrossRef] [PubMed]
- Berridge, M.J.; Lipp, P.; Bootman, M.D. The versatility and universality of calcium signalling. Nat. Rev. Mol. Cell Biol. 2000, 1, 11–21. [Google Scholar] [CrossRef]
- Gamper, N.; Stockand, J.D.; Shapiro, M.S. The use of Chinese hamster ovary (CHO) cells in the study of ion channels. J. Pharmacol. Toxicol. Methods 2005, 51, 177–185. [Google Scholar] [CrossRef] [PubMed]
- Hille, B. Ionic Channels of Excitable Membranes, 3rd ed.; Sinauer Associates: Sunderland, MA, USA, 2001. [Google Scholar]
- Nesin, V.; Pakhomov, A.G. Inhibition of voltage-gated Na(+) current by nanosecond pulsed electric field (nsPEF) is not mediated by Na(+) influx or Ca(2+) signaling. Bioelectromagnetics 2012, 33, 443–451. [Google Scholar] [CrossRef] [Green Version]
- Tolstykh, G.P.; Thompson, G.L.; Beier, H.T.; Steelman, Z.A.; Ibey, B.L. nsPEF-induced PIP2 depletion, PLC activity and actin cytoskeletal cortex remodeling are responsible for post-exposure cellular swelling and blebbing. Biochem. Biophys. Rep. 2017, 9, 36–41. [Google Scholar] [CrossRef] [Green Version]
- Condrescu, M.; Chernaya, G.; Kalaria, V.; Reeves, J.P. Barium influx mediated by the cardiac sodium-calcium exchanger in transfected Chinese hamster ovary cells. J. Gen. Physiol. 1997, 109, 41–51. [Google Scholar] [CrossRef] [Green Version]
- Schoenmakers, T.J.; Visser, G.J.; Flik, G.; Theuvenet, A.P. CHELATOR: An improved method for computing metal ion concentrations in physiological solutions. Biotechniques 1992, 12, 870–874, 876–879. [Google Scholar]
- Cooper, S.T.; McNeil, P.L. Membrane Repair: Mechanisms and Pathophysiology. Physiol. Rev. 2015, 95, 1205–1240. [Google Scholar] [CrossRef] [Green Version]
- Blazek, A.D.; Paleo, B.J.; Weisleder, N. Plasma Membrane Repair: A Central Process for Maintaining Cellular Homeostasis. Physiology 2015, 30, 438–448. [Google Scholar] [CrossRef]
- Idone, V.; Tam, C.; Goss, J.W.; Toomre, D.; Pypaert, M.; Andrews, N.W. Repair of injured plasma membrane by rapid Ca2+-dependent endocytosis. J. Cell Biol. 2008, 180, 905–914. [Google Scholar] [CrossRef] [Green Version]
- Idone, V.; Tam, C.; Andrews, N.W. Two-way traffic on the road to plasma membrane repair. Trends Cell Biol. 2008, 18, 552–559. [Google Scholar] [CrossRef] [Green Version]
- Pakhomov, A.G.; Xiao, S.; Novickij, V.; Casciola, M.; Semenov, I.; Mangalanathan, U.; Kim, V.; Zemlin, C.; Sozer, E.; Muratori, C.; et al. Excitation and electroporation by MHz bursts of nanosecond stimuli. Biochem. Biophys. Res. Commun. 2019, 518, 759–764. [Google Scholar] [CrossRef]
- Gabriel, B.; Teissie, J. Time courses of mammalian cell electropermeabilization observed by millisecond imaging of membrane property changes during the pulse. Biophys. J. 1999, 76, 2158–2165. [Google Scholar] [CrossRef] [Green Version]
- Semenov, I.; Zemlin, C.; Pakhomova, O.N.; Xiao, S.; Pakhomov, A.G. Diffuse, non-polar electropermeabilization and reduced propidium uptake distinguish the effect of nanosecond electric pulses. Biochim. Biophys. Acta 2015, 1848, 2118–2125. [Google Scholar] [CrossRef] [Green Version]
- Kwan, C.Y.; Putney, J.W., Jr. Uptake and intracellular sequestration of divalent cations in resting and methacholine-stimulated mouse lacrimal acinar cells. Dissociation by Sr2+ and Ba2+ of agonist-stimulated divalent cation entry from the refilling of the agonist-sensitive intracellular pool. J. Biol. Chem. 1990, 265, 678–684. [Google Scholar]
- Pakhomov, A.G.; Semenov, I.; Casciola, M.; Xiao, S. Neuronal excitation and permeabilization by 200-ns pulsed electric field: An optical membrane potential study with FluoVolt dye. Biochim. Biophys. Acta 2017, 1859, 1273–1281. [Google Scholar] [CrossRef]
- Zhang, B.X.; Zhao, H.; Loessberg, P.A.; Muallem, S. Regulation of agonist-evoked [Ca2+]i oscillation by intracellular Ca2+ and Ba2+ in AR42J cells. Am. J. Physiol. 1992, 262, C1125–C1133. [Google Scholar] [CrossRef]
- Yamaguchi, D.T.; Green, J.; Kleeman, C.R.; Muallem, S. Properties of the depolarization-activated calcium and barium entry in osteoblast-like cells. J. Biol. Chem. 1989, 264, 197–204. [Google Scholar]
- Roza, O.; Berman, L.B. The pathophysiology of barium: Hypokalemic and cardiovascular effects. J. Pharmacol. Exp. Ther. 1971, 177, 433–439. [Google Scholar]
- Przywara, D.A.; Chowdhury, P.S.; Bhave, S.V.; Wakade, T.D.; Wakade, A.R. Barium-induced exocytosis is due to internal calcium release and block of calcium efflux. Proc. Natl. Acad. Sci. USA 1993, 90, 557–561. [Google Scholar] [CrossRef] [Green Version]
- Owen, C.S.; Dever, S. Indo-1 can simultaneously detect Ba2+ entry and Ca2+ blockade at a plasma membrane calcium channel. Mol. Cell. Biochem. 1995, 151, 91–98. [Google Scholar] [CrossRef]
- Cukierman, S. Barium modulates the gating of batrachotoxin-treated Na+ channels in high ionic strength solutions. Biophys. J. 1993, 65, 1168–1173. [Google Scholar] [CrossRef] [Green Version]
- Yang, L.; Craviso, G.L.; Vernier, P.T.; Chatterjee, I.; Leblanc, N. Nanosecond electric pulses differentially affect inward and outward currents in patch clamped adrenal chromaffin cells. PLoS ONE 2017, 12, e0181002. [Google Scholar] [CrossRef]
- Gianulis, E.C.; Pakhomov, A.G. Gadolinium modifies the cell membrane to inhibit permeabilization by nanosecond electric pulses. Arch. Biochem. Biophys. 2015, 570, 1–7. [Google Scholar] [CrossRef] [Green Version]
- Schneider, C.A.; Rasband, W.S.; Eliceiri, K.W. NIH Image to ImageJ: 25 years of image analysis. Nat. Methods 2012, 9, 671–675. [Google Scholar] [CrossRef]
- Semenov, I.; Grigoryev, S.; Neuber, J.U.; Zemlin, C.W.; Pakhomova, O.N.; Casciola, M.; Pakhomov, A.G. Excitation and injury of adult ventricular cardiomyocytes by nano- to millisecond electric shocks. Sci. Rep. 2018, 8, 8233. [Google Scholar] [CrossRef] [Green Version]
- Ryan, H.A.; Hirakawa, S.; Yang, E.; Zhou, C.; Xiao, S. High-Voltage, Multiphasic, Nanosecond Pulses to Modulate Cellular Responses. IEEE Trans. Biomed. Circuits Syst. 2018, 12, 338–350. [Google Scholar] [CrossRef]
- Novickij, V.; Grainys, A.; Butkus, P.; Tolvaisiene, S.; Svediene, J.; Paskevicius, A.; Novickij, J. High-frequency submicrosecond electroporator. Biotechnol. Biotechnol. Equip. 2016, 30, 607–613. [Google Scholar] [CrossRef] [Green Version]
- Dunnet, C.W. A multiple comparison procedure for comparing several treatments with a control. J. Am. Stat. Assoc. 1955, 50, 1096–1121. [Google Scholar] [CrossRef]
- Winer, B.J. Statistical Principles in Experimental Design; McGraw-Hill Book Company: New York, NY, USA, 1971. [Google Scholar]
- Cumming, G.; Fidler, F.; Vaux, D.L. Error bars in experimental biology. J. Cell. Biol. 2007, 177, 7–11. [Google Scholar] [CrossRef] [Green Version]


© 2020 by the authors. Licensee MDPI, Basel, Switzerland. This article is an open access article distributed under the terms and conditions of the Creative Commons Attribution (CC BY) license (http://creativecommons.org/licenses/by/4.0/).
Share and Cite
Bo, W.; Silkunas, M.; Mangalanathan, U.; Novickij, V.; Casciola, M.; Semenov, I.; Xiao, S.; Pakhomova, O.N.; Pakhomov, A.G. Probing Nanoelectroporation and Resealing of the Cell Membrane by the Entry of Ca2+ and Ba2+ Ions. Int. J. Mol. Sci. 2020, 21, 3386. https://0-doi-org.brum.beds.ac.uk/10.3390/ijms21093386
Bo W, Silkunas M, Mangalanathan U, Novickij V, Casciola M, Semenov I, Xiao S, Pakhomova ON, Pakhomov AG. Probing Nanoelectroporation and Resealing of the Cell Membrane by the Entry of Ca2+ and Ba2+ Ions. International Journal of Molecular Sciences. 2020; 21(9):3386. https://0-doi-org.brum.beds.ac.uk/10.3390/ijms21093386
Chicago/Turabian StyleBo, Wenfei, Mantas Silkunas, Uma Mangalanathan, Vitalij Novickij, Maura Casciola, Iurii Semenov, Shu Xiao, Olga N. Pakhomova, and Andrei G. Pakhomov. 2020. "Probing Nanoelectroporation and Resealing of the Cell Membrane by the Entry of Ca2+ and Ba2+ Ions" International Journal of Molecular Sciences 21, no. 9: 3386. https://0-doi-org.brum.beds.ac.uk/10.3390/ijms21093386