Article

Changes in Expression Level of OsHKT1;5 Alters Activity of Membrane Transporters Involved in K+ and Ca2+ Acquisition and Homeostasis in Salinized Rice Roots

1
Tasmanian Institute of Agriculture, University of Tasmania, Hobart, TAS 7005, Australia
2
School of Science and Health, Western Sydney University, Penrith, NSW 2751, Australia
3
International Research Centre for Environmental Membrane Biology, Foshan University, Foshan 528000, China
4
Graduate School of Agricultural and Life Sciences, University of Tokyo, Tokyo 113-8657, Japan
5
Hawkesbury Institute for the Environment, Western Sydney University, Penrith, NSW 2751, Australia
6
Australian Research Council Centre of Excellence in Plant Energy Biology, School of Agriculture, Food and Wine, University of Adelaide, Glen Osmond, SA 5064, Australia
7
Department of Biology, University of York, York, YO10 5DD, UK
8
Plant Molecular Biology Laboratory, M.S. Swaminathan Research Foundation, Chennai 600113, India
9
Division of Applied Biology, Faculty of Textile Science and Technology, Shinshu University, Nagano 386-8567, Japan
*
Author to whom correspondence should be addressed.
These authors contributed equally to the work.
Int. J. Mol. Sci. 2020, 21(14), 4882; https://0-doi-org.brum.beds.ac.uk/10.3390/ijms21144882
Submission received: 19 June 2020 / Revised: 5 July 2020 / Accepted: 6 July 2020 / Published: 10 July 2020
(This article belongs to the Special Issue Ion Transport and Homeostasis in Plants)

Abstract

:
In rice, the OsHKT1;5 gene has been reported to be a critical determinant of salt tolerance. This gene is harbored by the SKC1 locus, and its role was attributed to Na+ unloading from the xylem. No direct evidence, however, was provided in previous studies. Also, the reported function of SKC1 on the loading and delivery of K+ to the shoot remains to be explained. In this work, we used an electrophysiological approach to compare the kinetics of Na+ uptake by root xylem parenchyma cells using wild type (WT) and NIL(SKC1) plants. Our data showed that Na+ reabsorption was observed in WT, but not NIL(SKC1) plants, thus questioning the functional role of HKT1;5 as a transporter operating in the direct Na+ removal from the xylem. Instead, changes in the expression level of HKT1;5 altered the activity of membrane transporters involved in K+ and Ca2+ acquisition and homeostasis in the rice epidermis and stele, explaining the observed phenotype. We conclude that the role of HKT1;5 in plant salinity tolerance cannot be attributed to merely reducing Na+ concentration in the xylem sap but triggers a complex feedback regulation of activities of other transporters involved in the maintenance of plant ionic homeostasis and signaling under stress conditions.

1. Introduction

The exposure of plants to high levels of salt in the rhizosphere results in the accumulation of toxic levels of Na+ and Cl- in the cellular and extracellular compartments affecting cellular metabolic activity and, thus, overall plant performance. Salt-tolerant plants have developed many mechanisms for minimizing radial and long-distant transport of Na+ and preventing its accumulation in metabolically active tissues. These mechanisms, known as salt exclusion mechanisms, include: (1) minimizing Na+ entry by the selective uptake of ions by root cells; (2) Na+ exclusion from the root back to rhizosphere; (3) preventing xylem Na+ loading; (4) enhanced retrieval of Na+ from xylem vessels; and (5) the control of phloem ion loading [1,2,3,4,5].
Glycophytic plants, such as rice, use these salt-excluding mechanisms as their primary strategy for preventing the toxic accumulation of salt in photosynthetic tissues [6]. In such plants, maintenance of a relatively high K+/Na+ ratio, especially in shoots, is a key factor in the development of salt tolerance [7,8,9]. The concerted activity of a large number of transporters located in the plasma and vacuolar membranes plays an important role in determining the K+/Na+ ratio in plant cells, through Na+, K+-selective and non-selective pathways [8,10,11,12]. The long-distance transport of Na+ in plants is determined by the rate of net xylem loading. The latter is a result of an orchestrated operation of transporters mediating Na+ release into the xylem (e.g., via salt overly sensitive 1 (SOS1) or chloride-dation cotransporter (CCC) transporters or non-selective cation channels; [2,13]) and transporters involved in the retrieval of Na+ from the transpiration stream. Key players in the latter process are HKT1 transporters.
HKT1 transporters (subfamily I) belong to the TrK/Ktr/HKT family (Transporter of K+/K+ transporter/High-affinity K+ Transporter) that is implicated in various functions, from K+ or Na+ uptake to the maintenance of membrane potential, ion homeostasis, and Na+ recirculation from the shoot to the root [14]. The HKT family can be divided into two distinct subfamilies based on their ion selectivity [15,16]. The transporters in subfamily I, such as OsHKT1;1 and OsHKT1;5, are selective for Na+, while those in subfamily II are selective for either Na+ or K+ or, alternatively, transport both ions [16,17,18]. The Arabidopsis genome encodes only one gene, AtHKT1;1, that was demonstrated to function in Na+ transport and exclusion from leaves [19,20,21]. In durum wheat, the TmHKT1;5-A gene was shown to be present in the Nax2 QTL that contributes to lowering Na+ levels in leaves [22,23], and the near-isogenic line (NIL) of durum wheat harboring TmHKT1;5-A increased grain yield by 25% under saline conditions [24]. It was also suggested that TaHKT1;5-D is the candidate gene for the Kna1 locus in bread wheat, which has long been known as essential for leaf Na+ exclusion and the maintenance of a high K+/Na+ ratio in leaves [25,26]. Another important allele for Na+ exclusion, Nax1, was identified in wheat by QTL analysis; in contrast to Nax2, this locus was able to confer Na+ unloading not only in roots but also in leaf sheaths [22]. Nax1 was later predicted to be the TmHKT1;4-A2 gene which is also the class I HKT HKTs [27]. However, more recent studies suggested that the above Nax loci harboring HKT1;4 or HKT1;5 genes involved in the retrieval of Na+ back into the root stele but also plays a role in reducing the rate of Na+ loading into the xylem by modulating activity and expression levels of the SOS1 gene [28]. Thus, the actual role of HKT1 in Na+ unloading from the xylem may be not as straightforward as previously believed.
In the rice genome, a total of nine HKT genes have been found, divided between subfamilies I and II [17,29,30]. One of them, OsHKT1;5, has been narrowed down as a determinant of salt tolerance by QTL analysis and attributed to the SKC1 locus [31]. These authors showed that near-isogenic (NIL) SKC1 plants accumulated less Na+ and had a more salt-tolerant phenotype. Based on GUS (β-glucuronidase) staining (SKC1 promoter), Na+ analysis of the xylem sap, and transport assays in Xenopus oocytes, the authors concluded that the SKC1 locus encoded an Na+-selective HKT1;5 transporter that was expressed in the xylem parenchyma and was involved in the unloading of Na+ from the xylem. However, no direct evidence for the operation of HKT1;5 in the xylem parenchyma was provided. Also, the reported xylem sap data was collected from plants treated with rather mild (25 mM NaCl) salinities while all the genetic data in the present work refer to much more severe (140 mM NaCl) treatment.
Ren et al. [31] also reported a major difference in loading and delivery of K+ to the shoot between SKC1 and WT lines. In fact, the name of the locus per se (SKC1) stands for “shoot K+ content 1” and implies that this locus has a major impact on plant K+ homeostasis. This is further echoed by the fact that in wheat, both Nax1 and Nax2 loci have also been shown to increase the rate of K+ transport from root to shoot [22]. Also, the SKC1 locus was later found to be localized within the Saltol locus, a major salt tolerance QTL in rice [32], and the latter was also shown to be an important determinant of K+ homeostasis during salt stress [33]. A role for OsHKT1;5 in mediating Na+ exclusion in the phloem has also been shown [34]. Taken together, these results question the causal link between the observed salt-tolerant phenotype and the role of HKT1;5 in Na+ retrieval from the xylem and point at the possibility of operation of some other (complementary) mechanisms. Surprisingly, this issue has not been properly addressed in direct functional experiments. In their work, Ren et al. [31] explained elevated K+ content in NIL SKC1 rice plants as coming from some “interplay between individual HKT members and other transporters” suggesting that “one ion can affect the transport and accumulation of another”. No further details have been elucidated, and, to the best of our knowledge, no follow-up work has been conducted to address this issue. Filling this void in our knowledge is the main aim of this study.

2. Results

In our work, we compared the responses of wild type (WT; cv. Koshihikari) and its near-isogenic line with a short segment containing SKC1 [abbreviated here as NIL(SKC1)] rice plants to salinity treatment. In our hands, NIL(SKC1) plants showed significantly higher expression of HKT1;5 in both the elongation and mature root zones compared with WT (Figure 1A), and HKT1;5 transcript levels were significantly upregulated by salinity (Figure 1B,C). Thus, at the operational level, NIL(SKC1) plants could be deemed as an HKT1;5 overexpressing line.
Root growth in NIL(SKC1) plants were similar to those in WT (Figure 2E,F). In contrast, the shoot fresh (FW) and dry (DW) weights were smaller in SKC1 plants grown under control conditions (Figure 2B,C). Salinity stress resulted in a significant (p < 0.05) reduction in both root and shoot growth (Figure 2). In contrast to Ren et al. [31], we used less severe treatment (80 mM for one week compared to their 140 mM for 10 days). Under these conditions, the NIL(SKC1) line showed a more sensitive phenotype, with a larger proportion of chlorotic and necrotic leaves (Figure 2A) and significantly lower relative shoot (Figure 2D) and root (Figure 2G) dry weights compared to WT.
Similar to Ren et al. [31], NIL(SKC1) plants also accumulated more K+ under saline conditions (Figure 3B) but, interestingly, also had more Na+ (Figure 3A). The latter result is clearly inconsistent with the notion that SKC1 operates in Na+ removal from the shoot.
The conclusion made by Ren et al. [31] about HKT1;5 operating in Na+ retrieval from the xylem into the parenchyma cells was based on the detection of GUS activity mainly in the parenchyma cells bordering the xylem vessels. However, no direct evidence for in planta HKT1;5 operation was given. To address this issue, we have employed the microelectrode ion flux estimation (MIFE) technique to directly measure fluxes of Na+ at the xylem/parenchyma interface of rice NIL(SKC1) lines.
In addition to comparing WT with NIL(SKC1) (operating as HKT1;5 overexpressing line at the functional level), we have also included O. sativa cv. Dongjin 4A-02764 mutant allele genotype harboring a T-DNA insertion in OsHKT1;5 used in Kobayashi et al. [34]. These plants showed a reduction in OsHKT1;5 expression in roots in comparison to the level in WT plants (as evidenced from the results of the RT-PCR using 10-day-old whole rice seedlings; see Figure 7A and Supplementary Figure S2 from [34]) and, therefore, at the functional level could be termed as a knock-down (KD). As this allele has the japonica rice cv. Dongjin background, fluxes were normalized for the appropriate WT, to make results comparable.
When 80 mM NaCl was applied to the root stele of WT plants (mimicking an increase in the xylem sap Na+ concentration), strong and sustained net Na+ uptake was measurable (Figure 4A,C). In functional terms, this uptake would be consistent with reabsorption of Na+ from the xylem in intact roots (either via HKT1;5 or by some other transport system). However, in the NIL(SKC1), such uptake was absent. On the contrary, the KD line showed even slightly higher net Na+ uptake by the xylem parenchyma cells than the WT (Figure 4A,C). These results are consistent with the above whole-plant Na+ content data shown in Figure 2.
We then measured the effects of NaCl on K+ transport across the plasma membrane of root stellar tissues (Figure 4B,D). In all three lines, the addition of NaCl to the bath solution resulted in a transient net K+ efflux. In functional terms, in planta, this would be equivalent to NaCl-induced K+ loading into the transpiration stream. The magnitude of K+ efflux was NIL(SKC1) > WT > KD and consistent with our data (Figure 3B) and that from Ren et al. of higher K+ accumulation in the shoot of the NIL(SKC1) line.
Ion homeostasis in plants is regulated by numerous positive and negative feedback loops, and changes in the expression level/activity of one transporter may affect the functionality of others. Accordingly, we compared changes in the expression levels of some key genes affecting plant ion homeostasis between roots of WT and SKC1 plants. In addition to genes controlling K+ and Na+ homeostasis (e.g., SOS1 for Na+/H+ exchange; GORK channel for K+ efflux; HAK5 for high affinity K+ uptake), we also looked at the changes in the expression levels of RBOHD, a gene that encodes an NADPH (nicotinamide adenine dinucleotide phosphate) oxidase and thus, mediates stress-induced Ca2+ signaling in plants by controlling operation of the “ROS-Ca2+ hub” at the plasma membrane [35]). A significant difference was found in the expression levels of many transporter genes (Figure 5); this difference also showed strong time- and tissue-dependence (e.g., different response patterns in the elongation and mature root zones). Specifically, NIL(SKC1) plants had reduced expression of RBOH transcripts under both control and saline conditions (in both root zones; Figure 5) but much higher expression of RBOHD in the elongation zone. Also, when exposed to salinity, the NIL(SKC1) line showed reduced GORK expression but increased expression of RBOHD transcripts compared with WT (Figure 5). Also, there were lower SOS1 transcript levels in both root zones.
We then asked if the altered HKT1;5 expression could affect the functional activity of membrane transporters in the root epidermis. For doing this, we first compared the patterns of Na+ uptake in root epidermis (Figure 6A,B) in all three lines. This uptake was strongest in NIL(SKC1) followed by WT and then by the KD lines indicating that changes in the expression levels of HKT1;5 in the root stellar tissue strongly affected Na+ uptake ability in the root epidermis. Further, the NaCl-induced K+ loss from epidermal root cells was as: NIL(SKC1) > WT > KD (Figure 6C–E). This pattern was observed in both root zones. Similar to previous studies on various species (e.g., [8,36]), K+ loss from the elongation zone (EZ) was much stronger (about six-fold) compared with the MZ.
As commented above, transcriptional studies showed a significant difference in profiles of SOS1 and RBHOD between WT and NIL(SKC1) lines grown under saline conditions (Figure 5).
Th operation of Na+/H+ exchangers is controlled by the SOS pathway [5]; the essential step in this process is salt stress-induced elevation in the cytosolic free Ca2+. Such changes in cytosolic Ca2+ are also essential for the regulation of NADPH oxidase operation that impacts the activity of cation channels via apoplastic ROS production [35,38]. Accordingly, we compared patterns of NaCl-induced net Ca2+ fluxes in rice HKT1;5 lines used above (Figure 7). Acute NaCl treatment caused transient Ca2+ efflux, most likely as a result of the Donnan exchange in the cell wall [39]. However, this response was stronger in EZ, and at the end of the transient response, net Ca2+ flux values remained negative, suggesting the involvement of some active Ca2+ efflux system. This net Ca2+ efflux was changed in a sequence NIL(SKC1) < WT < KD suggesting that the overexpression of HKT1;5 in NIL(SKC1) had compromised operation of one of the Ca2+ efflux systems (either Ca2+-ATPase or CAX exchanger; [40]).
H2O2 plays an important role in the adaptive responses to the salinity and sensitivity of cation-permeable channels to H2O2, which often explains tissue- and genotypic-variability in salinity stress tolerance [41,42]. Accordingly, we compared the magnitude of H2O2-induced Ca2+ fluxes in the root epidermis of the three genotypes (Figure 8).
Similar to previous findings, H2O2 triggered transient Ca2+ influx that was KD > WT > NIL(SKC1). Thus, overexpressing HKT1;5 in NIL(SKC1) had compromised sensitivity of Ca2+-permeable cation channels to H2O2, potentially affecting the ability of the plant to sense and respond to salt stress.

3. Discussion

HKT1 transporters have been on researchers’ radar since 1994 [43] and are firmly associated with plant salinity tolerance; this is specifically true for HKT1;5. However, the causal link between the operation of HKT1;5 and plant phenotype remains complicated. The general consensus is that HKT1;5 transporters are expressed in the xylem parenchyma and operate in the reabsorption of Na+ loaded into the xylem [1,24]. However, to the best of our knowledge, no direct measurements of Na+ fluxes across the xylem/parenchyma boundary have been reported so far. Here, we used non-invasive Na+ selective microelectrodes and compared kinetics of Na+ uptake by root parenchyma cells between NIL(SKC1) (overexpressing HKT1;5) and WT plants (Figure 4). In our protocols, adding Na+ to the bath solution surrounding the xylem parenchyma tissue would mimic the in planta situation when Na+ is loaded into the xylem. As shown in Figure 4, Na+ reabsorption (net Na+ influx) was clearly observed in WT but not in NIL SKC1 plants. These observations question the functional role of HKT1;5 as a transporter operating in direct Na+ removal from the xylem.
Several possible explanations could be considered to explain this apparent conundrum. First, even though the GUS staining is strongest in the xylem parenchyma, HKT1;5 may be potentially also present in the root epidermis). Indeed, while the expression of the OsHKT1;5 gene in stellar cells is robust, it may be much lower in the epidermis and below the detection limit of the GUS staining analysis. Yet, when overexpressed in epidermal tissue, HKT1;5 could potentially increase the rate of root Na+ uptake (and then the subsequent xylem loading). The supporting evidence comes from MIFE net Na+ flux data measured from the root epidermis (Figure 6). Here, the strongest Na+ uptake by roots was observed in NIL SKC1 plants followed by WT and then by KD plants. Thus, if HKT1;5 is overexpressed in both xylem parenchyma and root epidermis, the beneficial role of the stele-based HKT1;5 in removing Na+ from the xylem may be overridden by a concurrent increase in root Na+ uptake in epidermis. This could explain the fact that the overall accumulation of Na+ in the shoot was higher in the NIL(SKC1) line compared with WT (Figure 3). In a sense, this scenario is analogous to the expression/operation of SOS1 transporters, which are also expressed in both root tissues (Shi et al. 2000). However, the q-PCR analysis on OsHKT1;5 found in the RiceXPro database indicated that OsHKT1;5 expression is quite specific in the root stellar cell region of the mature zone (https://ricexpro.dna.affrc.go.jp/), and the same conclusion was derived from the immuno-staining data [34].
It is also plausible to suggest that the SKC1 locus may also contain some other genes that could attribute to transcriptional, translational and the post-translational changes in HKT1;5 function overall. The colocalization of transcription factors are known to underpin major QTL effects [44], and this could be the case in our study. Finally, plant functioning relies on a myriad of signaling loops, and changes in the transcript levels of one gene might have feedback effects on the operation of others, including those encoding different transporters. In our case, elevated HKT1;5 transcript levels in NIL(SKC1) plants had a significant impact on the expression levels of transporters mediating plant K+ (GORK, HAK5) and ROS (reactive oxygen species; RBOHD) homeostasis (Figure 5), thus modulating their functional activity (Figure 6 and Figure 7). Recently, El Mahi et al. [45] have shown that HKT8/HKT1;5/SKC1 transcript level is significantly down-regulated in roots of sos1 mutant rice plants, and it was suggested that this down-regulation could represent a root-protecting mechanism limiting the back-flow of Na+ to roots that are already exposed to high Na+ contents. Also, the bypass flow plays a significant role in Na+ uptake in rice [46]. In Arabidopsis, RBOHD controls lignification and suberin deposition in root endodermis [47]. Given that RBOHD expression levels were altered in NIL(SKC1) plants in our study, alterations in a sodium uptake through apoplast are plausible.
Salinity stress tolerance in plants is associated with the ability of their roots to retain K+ when exposed to salinity [9,48]; this is specifically true for rice [36]. In our case, the magnitude of NaCl-induced K+ efflux was strongest in NIL (SKC1) plants (Figure 6C–E), explaining its salt-sensitive phenotype. These results could not be explained by transcriptional changes in the expression levels of GORK and HAK5 transporters in the mature root zone (Figure 5), implying some operational regulation. In the elongation zone; however, WT plants showed strong (four-fold) up-regulation of HAK5 (Figure 5), while its transcript levels remained unchanged in the NIL(SKC1) line. Therefore, the difference in phenotype might be potentially explained by the difference in K+ homeostasis in the root apex between NIL(SKC1) and WT plants.
A role of K+ as a second messenger mediating plant’ adaptive responses to a hostile environment has emerged recently [49,50]. According to this concept, stress-induced K+ efflux may represent a ‘metabolic switch’ that allows plants to inhibit energy-consuming anabolic reactions and redirect a large pool of ATP towards defense [50,51]. However, the amount of K+ used in signaling should not compromise a plant’s nutritional demand for this element, so the above process occurs in a highly tissue-specific manner and is confined to the root apex [48]. Also, the signaling process is transient, and, once over, the cytosolic K+ needs to be restored. Strong upregulation of HAK5 transcripts (encoding high-affinity K+/H+ symport) may be an essential part of this process.
Salinity-induced elevation in the cytosolic free Ca2+ is an essential component of salt-stress signaling [52]. Amongst other things, such signaling is essential for the activation of the SOS1 Na+/H+ exchanger that operates in the removal of excessive Na+ from the cytosol [5]. The plasma membrane-based NADPH oxidase plays a critical role in salt stress-induced Ca2+ elevation. Encoded by RBOH genes, together with non-selective Ca2+ permeable channels, NADPH oxidase forms the so-called ‘ROS-Ca2+ hub” that amplifies Ca2+ signals [53] and operates upstream of the plant adaptive networks. In our case, NIL(SKC1) plants showed the smallest H2O2-induced Ca2+ uptake, suggesting that higher levels of HKT1;5 expression might have compromised the plant’s ability for ROS and Ca2+ signaling. The specific details of this regulation remain a subject for future investigation.
Under our experimental conditions, NIL(SKC1) plants showed a more salt-sensitive phenotype compared with WT. This is, in contrast, to the report by Ren et al. [31]. The possible explanation for this inconsistency may be in the strategies and metabolic cost of osmotic adjustment to salt stress. If plants opt for a strategy to exclude Na+ from the shoot, they need to rely on de novo synthesis of organic osmolytes, which is an energetically expensive process [4] that will entail substantial yield penalties. Thus, if the stress is not too severe (as in our case) and the amount of Na+ taken up is reasonable to be dealt with by means of vacuolar sequestration in the shoot, plants may prefer to rely on Na+ uptake for osmotic adjustment. This may be the case here. In Ren et al. [31], the authors used a much more severe treatment, for which Na+ exclusion from the shoot might be the better option.
Overall, the findings in this work suggest that the results obtained by using mutant plants should be treated with great caution and cannot be taken as mechanistic evidence for the role of a specific gene in question due to the presence of the multiple feedback loops in living organisms. Also, transcriptional profiling and GUS staining may be misleading and provide incomplete information about the operation/function of a specific transporter protein. More emphasis needs to be put, therefore, on in planta functional assays.

4. Materials and Methods

4.1. Plant Material and Growth Conditions

The bulk of experiments was conducted using rice (Oryza sativa L. japonica) cv. Koshikari and its near-isogenic line SKC1 (NIL-SKC1). Seeds were kindly provided by Prof D. Xue (Hangzhou Normal University, China). In electrophysiological experiments, these two lines were complemented by Oshkt1;5 (4A-02764) knock-down (KD) mutant and its O. sativa L. japonica cv. Dongjin wild type. Seeds of both lines were kindly supplied by Dr. Chang-deok Han from the National Institute of Agricultural Biotechnology, South Korea. Seeds were surface sterilized with 70% ethanol for 1 min and then with 1.5% sodium hypochlorite solution for 30 min and washed with distilled water for five times. Seeds were germinated at 28 °C and 100% relative humidity and kept in a dark room for 48 h for uniform germination. Once the seeds started sprouting, uniformly germinated seeds were transferred into two plastic seedling floats containing Yoshida nutrient solution [54]. Rice seedlings were grown in a greenhouse at 30 °C during the day and 22 °C at night under natural light conditions for 14 days. The uniformly grown seedlings were then exposed to salinity stress by adding 0- and 80-mM salt (NaCl) to Yoshida nutrient solution. Nutrient solutions containing salt were replaced every three days, and the solution pH was adjusted to 5.0 on a daily basis.

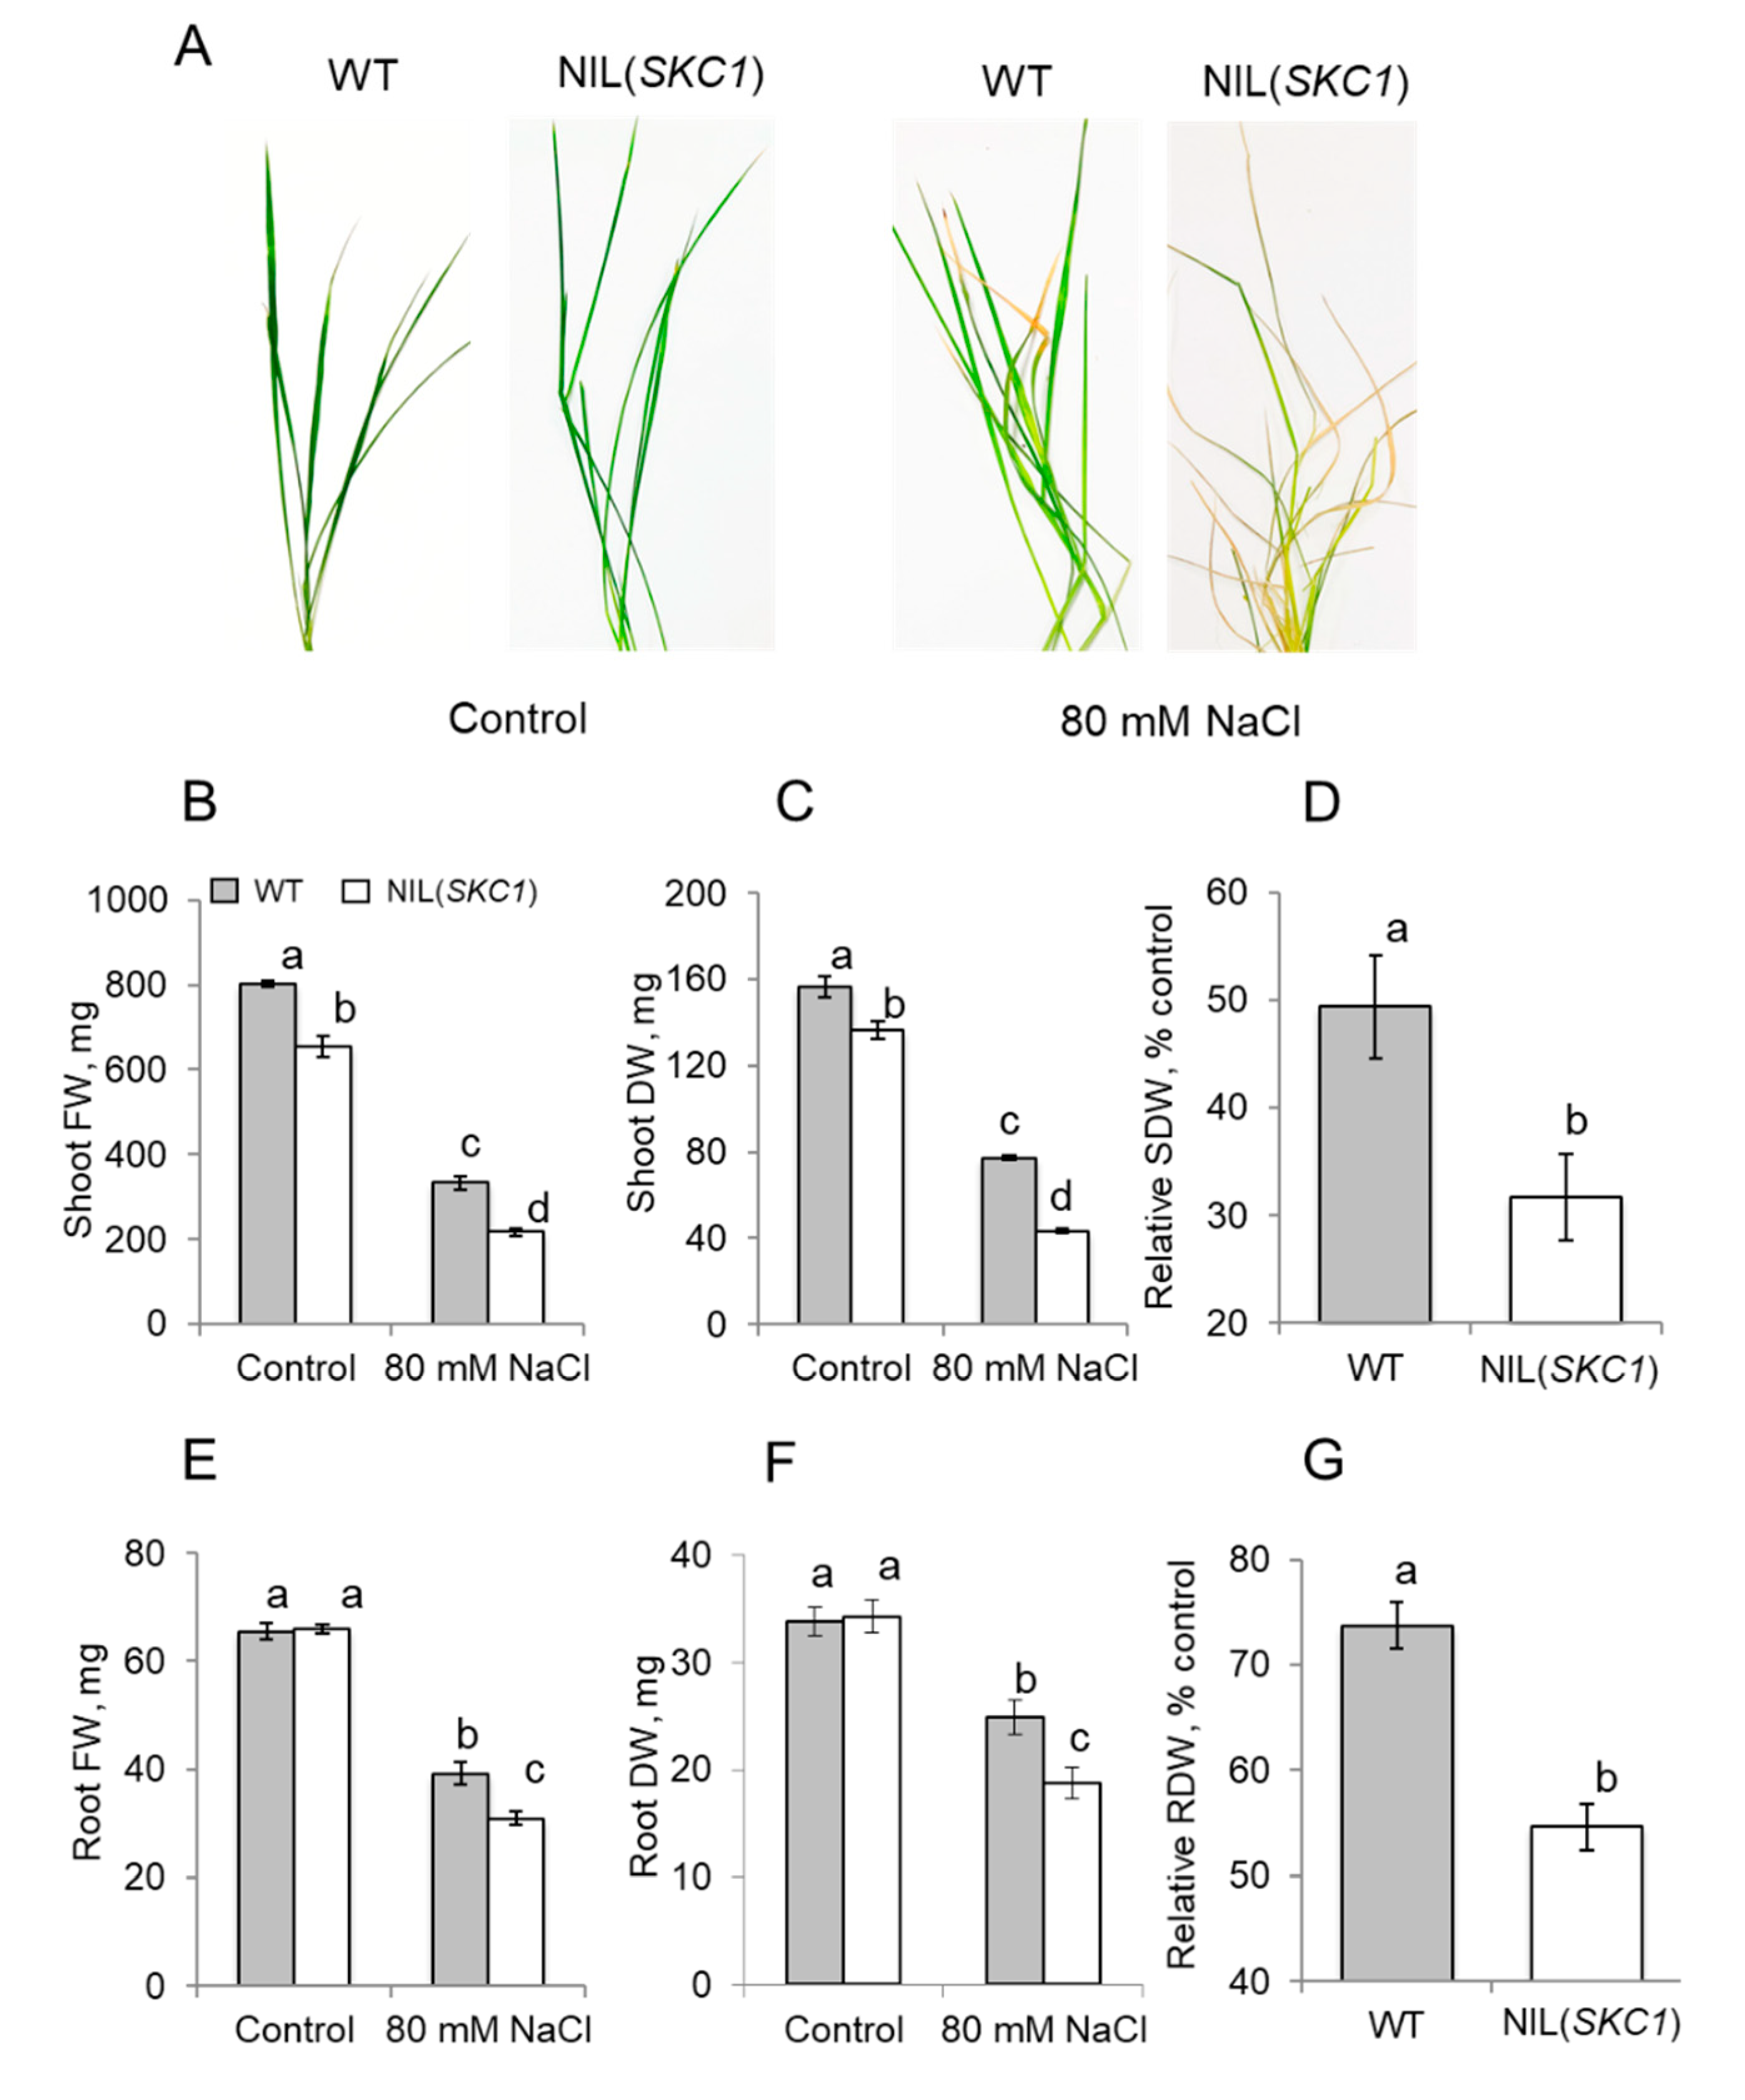
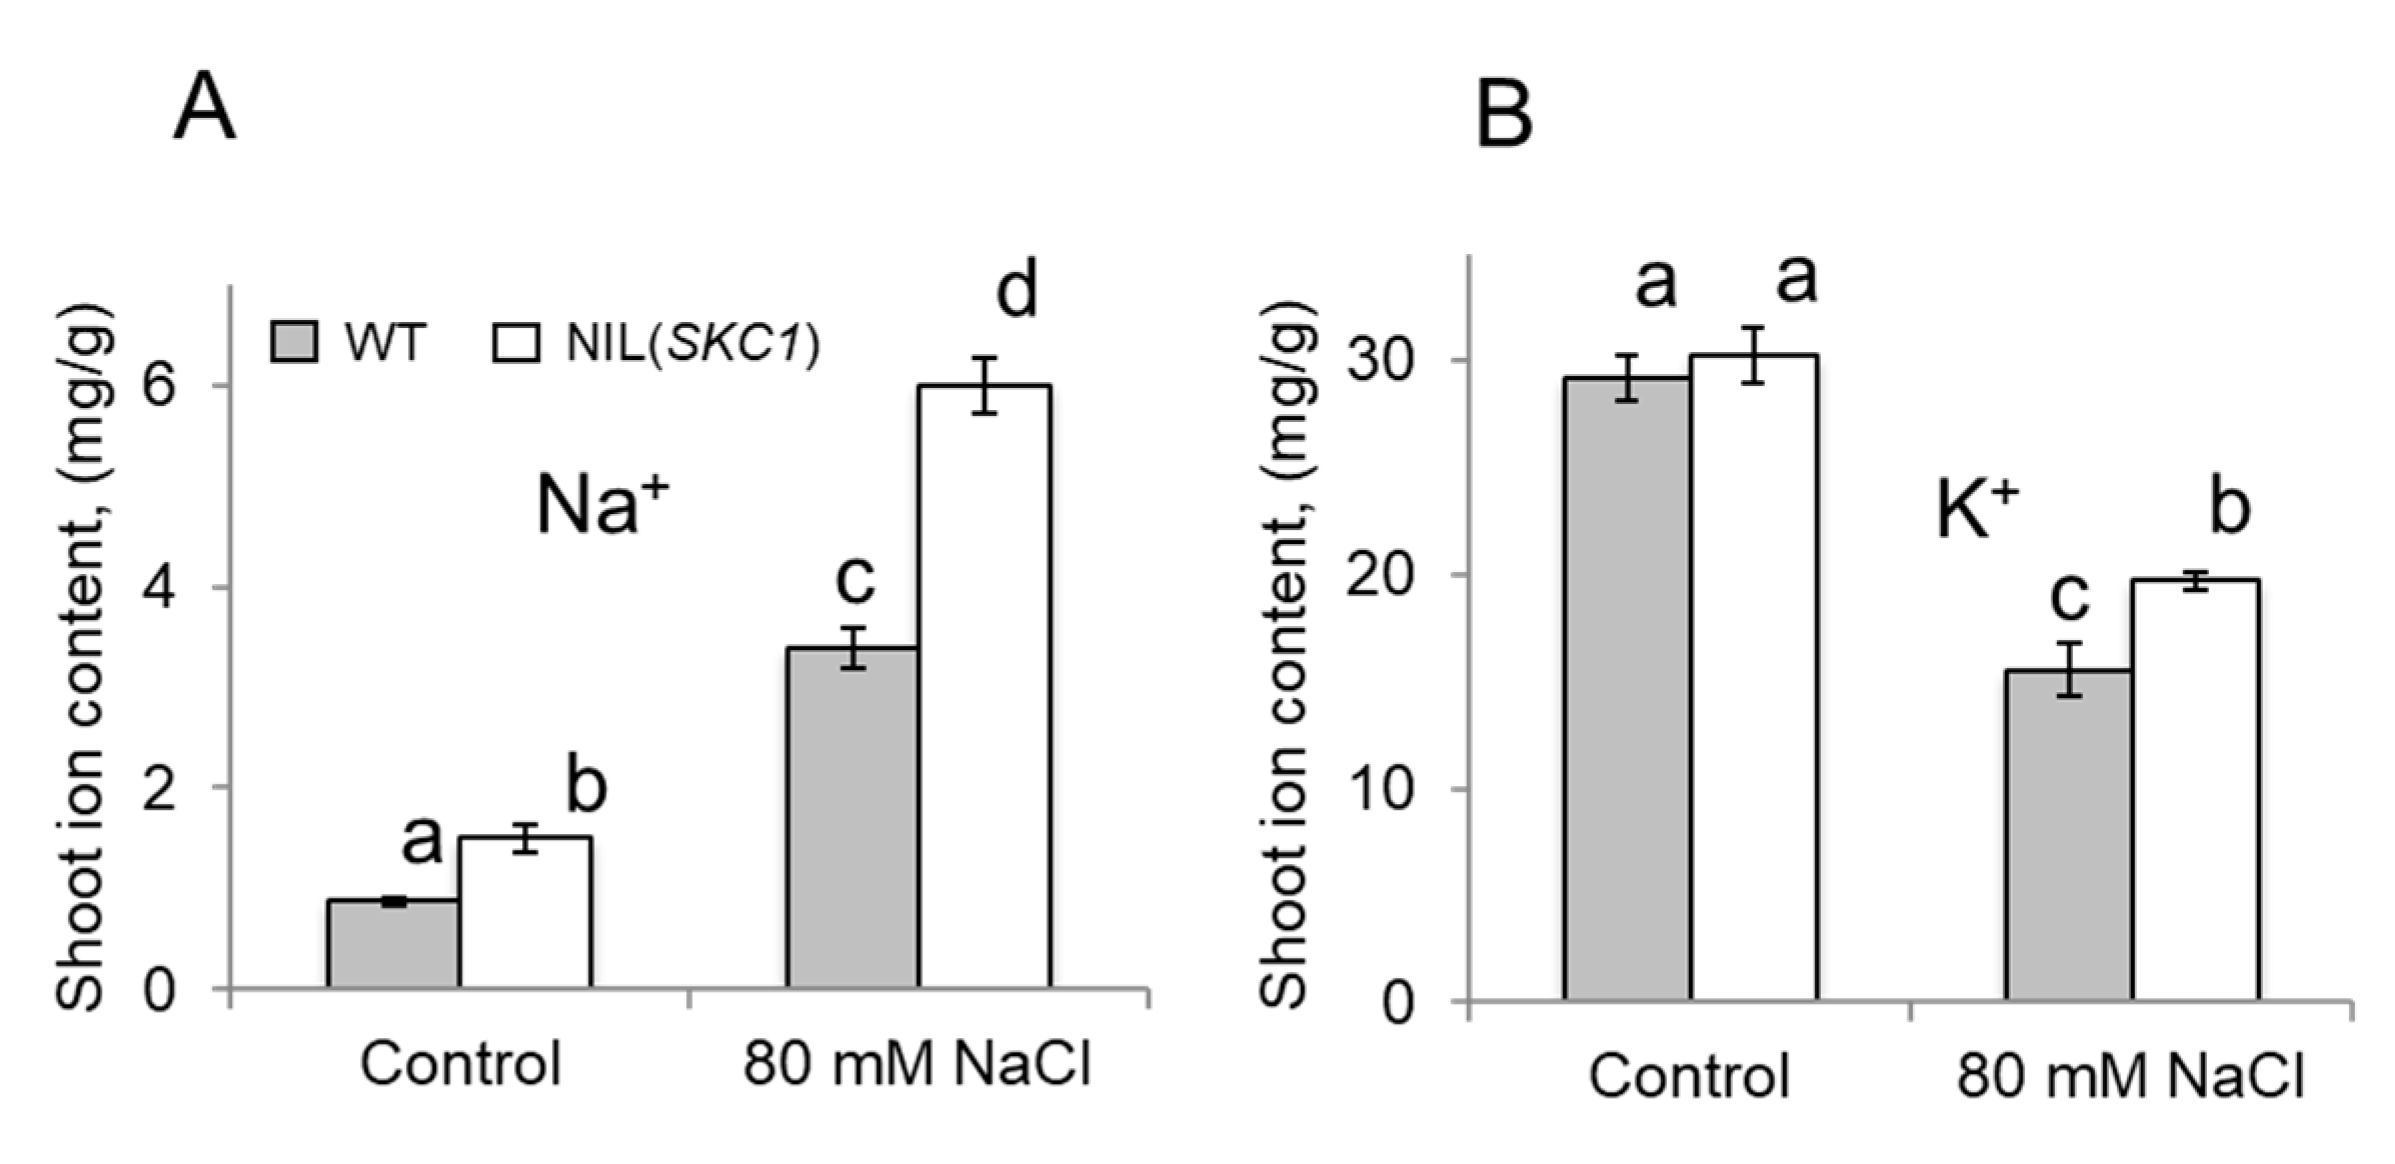
4.2. Plant Growth Responses and Elemental Content

Rice seedlings were harvested one week after stress onset. Plants were harvested, and root and shoot fresh weights (FW) were measured immediately after the harvest. Plant samples were then oven-dried at 70 °C for three days to a constant weight, and dry weights were measured. For determining leaf Na+ and K+ content, dry shoot samples were powdered using a Geno Grinder, and ion concentrations were measured using X-ray fluorescence spectrometry Niton XL3t XRF analyzer (Thermo Fisher, Austin, TX, USA). Elemental concentrations were calculated using standard calibration curves optimized for the machine.

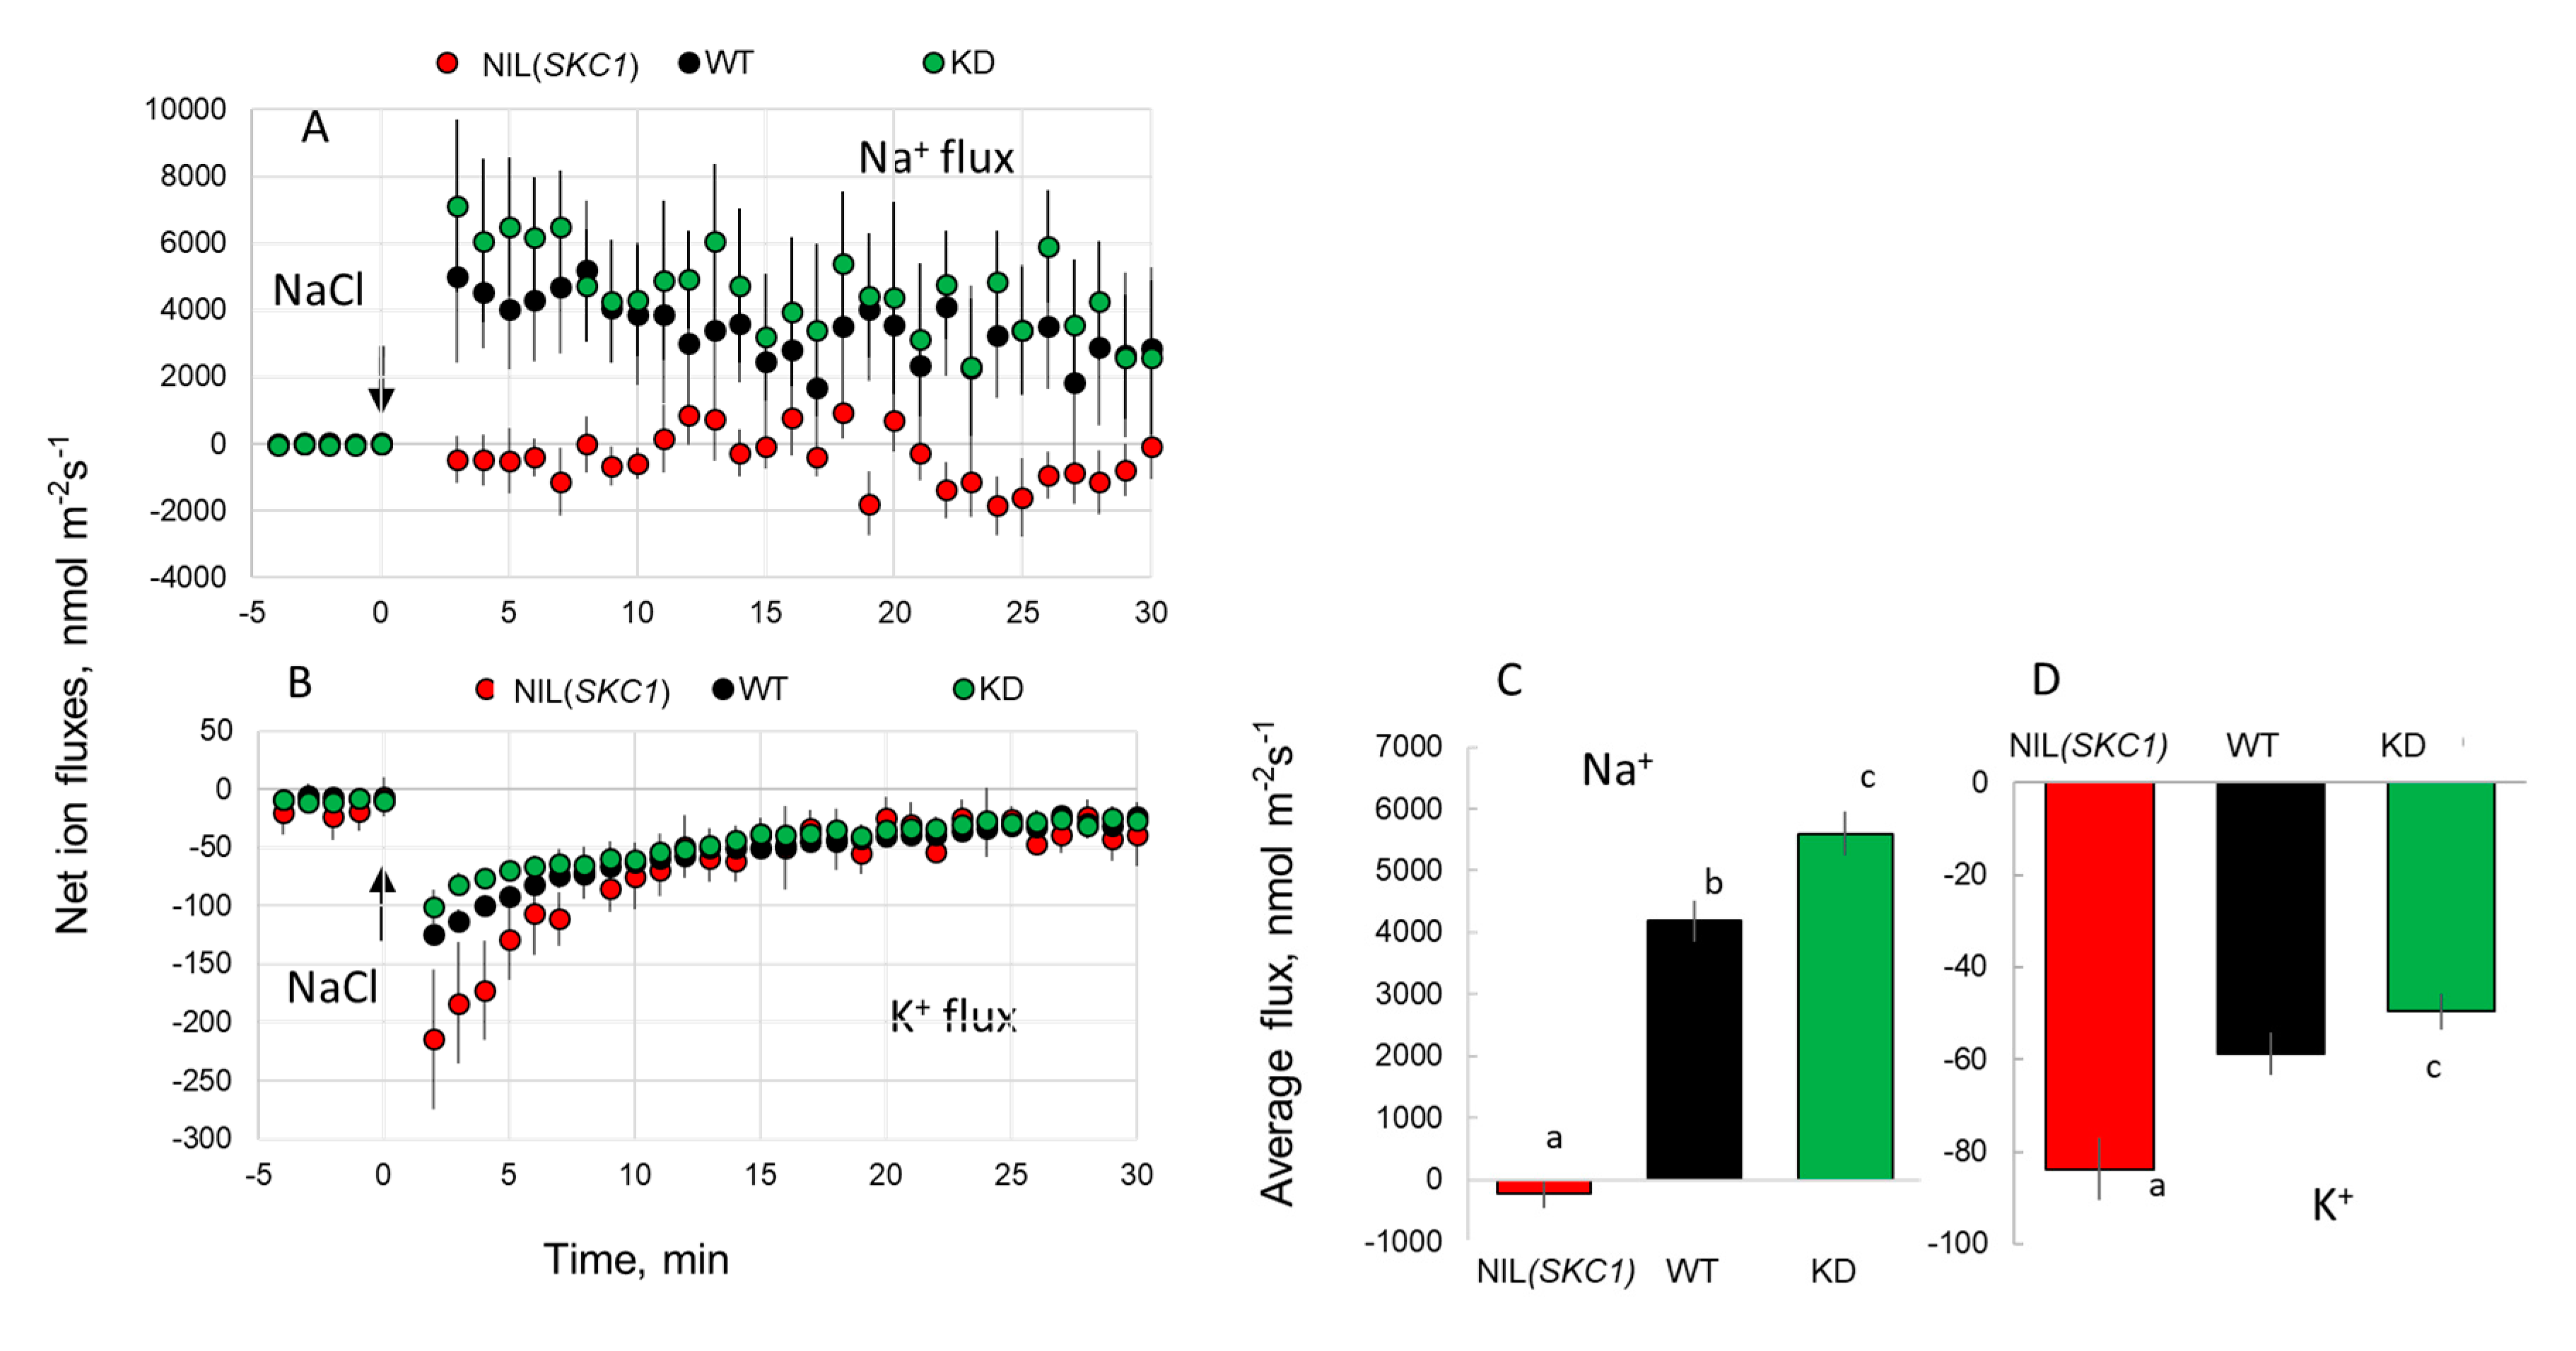
4.3. Non-Invasive Ion Flux Measurements

Net fluxes of Na+, K+, and Ca2+ were measured from epidermal and stellar root tissues using non-invasive microelectrode ion fluxes measuring the MIFE system (Univ. Tasmania, Australia). Full details of microelectrodes fabrication and calibration and principles of the MIFE ion flux measurements are reported in our previous publications [55,56]. For K+ and Ca2+ flux measurements, commercial LIX (liquid ion exchangers) were used (catalog number 99,311 for K+; 99,310 for Ca2+, all from Sigma-Aldrich, St. Louis, MO, USA). For Na+ flux, the calixarene-based microelectrodes with superior Na+ selectivity were used [57].
For epidermal flux measurements, hydroponically grown five-day-old seedlings were immobilized in a measuring chamber in horizontal position and left for equilibration for 1 h. The bathing medium (BSM solution) consisted of 200 µM NaCl, 100 µM CaCl2, and 200 µM KCl (pH 5.5). Ion-selective microelectrodes were positioned next to the root surface, either in elongation (1.2 mm from the tip) or mature (15 mm from the tip) root zones. Steady-state net ion fluxes were measured for 10 min by moving electrodes in a square manner (5 s/5 s cycles) between two positions, 40 and 90 μm above the root surface. After 10 min of recording in control conditions, the treatment was administered by adding either 80 mM NaCl or 10 mM H2O2 to the chamber, and transient flux responses were recorded for another 30–40 min. Net ion fluxes were then calculated using the MIFEFLUX software assuming a cylindrical diffusion profile [55].
For flux measurements from the xylem parenchyma tissue, root stele was mechanically isolated using the procedure described by Shabala et al. [58]. The isolated stellar segments were allowed to float on a surface of BSM solution for 3–4 h, to avoid any potential confounding effects of mechanical damage during segment isolation. Then the stellar segments were immobilized in the measuring chamber, and transient flux responses from the xylem parenchyma were measured as described above for epidermal cells.

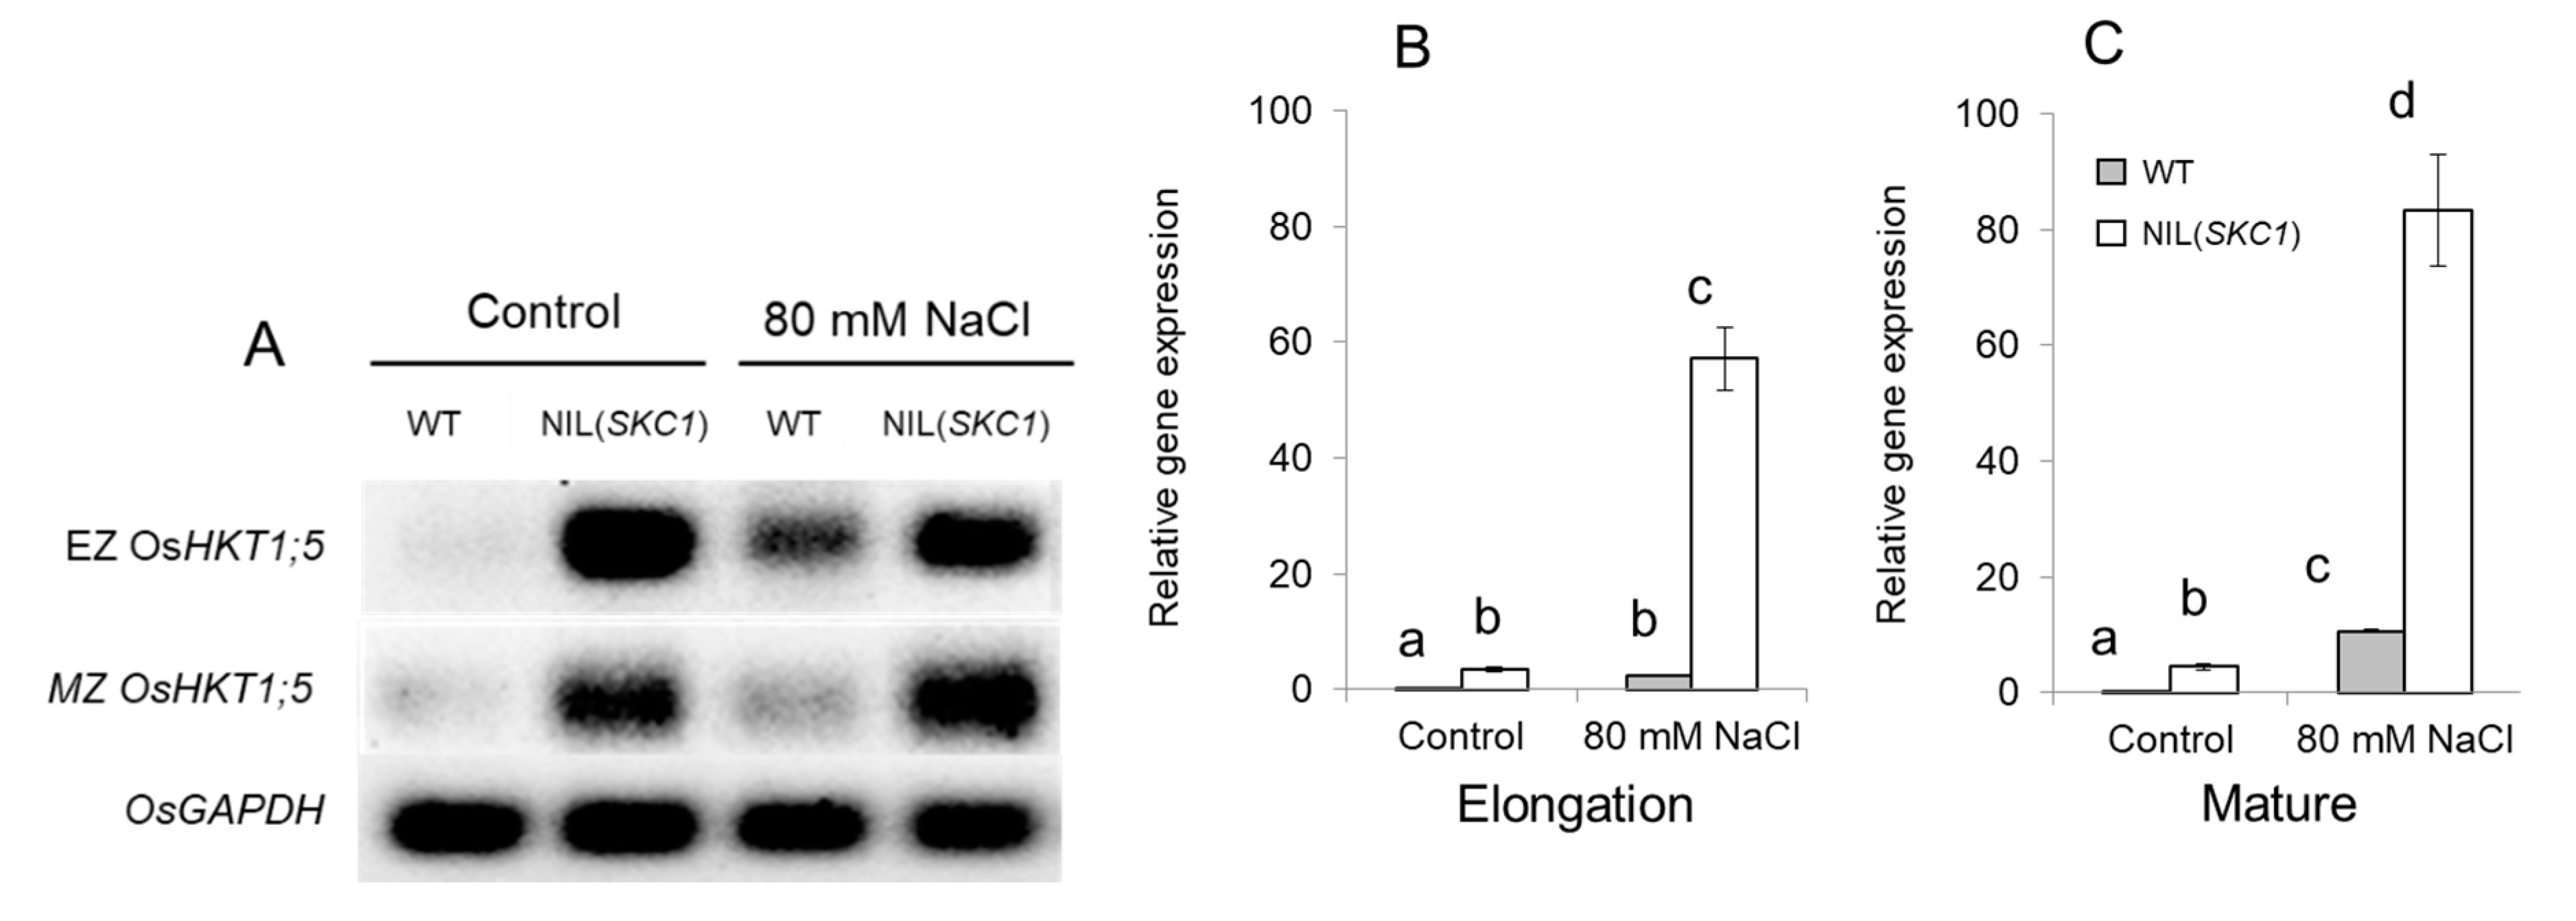
4.4. Gene Expression Analysis

Root tissues were harvested from the control and salt-treated plants. The root apex (the first 2–3 mm from the tip) composed from the meristem and elongation (EZ) zone cells was excised with a scalpel, and another 20 mm-long-segment was cut from the remaining mature (MZ) root zone. Samples were immediately frozen in liquid nitrogen. Three independent replicates were collected, each containing pooled samples from six different plants. The total RNA was extracted using the TRIzol reagent (Invitrogen, Carlsbad, CA, USA), and reverse transcription was performed according to the protocol of the SensiFAST cDNA synthesis kit (Bioline, London, UK). SKC1 transcripts levels were analyzed by amplifying with 25 PCR cycles using real-time quantitative RT-PCR Quantinova Sybr Green Kit in a Rotor-Gene 3000 quantitative PCR instrument (Corbett Research, Mortlake, NSW, Australia). OsGAPDH was used as a reference gene.

Author Contributions

S.S., M.A., J.B. and L.S. conceived and designed the experiments; M.A., L.S., C.S., and T.O. performed the experiments and analyzed the data; S.S., L.S., M.A., Z.C., J.B., F.J.M.M., G.V., K.T., M.Y., M.Z., T.H. contributed to data analyses and interpretation, and writing the manuscript. S.S., L.S., M.Z., M.Y. contributed reagents/materials/analysis tools. All authors have read and agreed to the published version of the manuscript.

Funding

This research was supported by China National Natural Science Foundation [Projects 31961143001 and 31870249] and Australian Department of Industry, Innovation and Science [project AISRF48490] grants to Sergey Shabala; Indo-Australian Biotechnology Fund (BT/Indo-Aus/09/03/2015) grant provided by the Department of Biotechnology, Government of India to Gayatri Venkataraman; Australian Research Council grant [DE170100346] to Jayakumar Bose; and JSPS KAKENHI Grant Number JP 17KK0152 to Tomoaki Horie.

Acknowledgments

We thank Chang-deok Han from the National Institute of Agricultural Biotechnology, South Korea, for providing Oshkt1;5 (4A-02764) mutant seeds.

Conflicts of Interest

The authors declare no conflict of interest.

Abbreviations

WTWild type
NIL(SKC1)Near-isogenic line with a short segment containing SKC1
KDKnock-down
HKTHigh-affinity K+ Transporter
GORKGuard cell Outward Rectifying K+ channel
FWFresh weight
DWDry weight
ROSReactive Oxygen Species
SOSSalt Overly Sensitive
QTLQuantitative Trait Locus
MIFEMicroelectrode Ion Flux Estimation
LIXLiquid Ion Exchanger
BSMBasic Salt Medium
EZRoot elongation zone
MZRoot mature zone

References

  1. Munns, R.; Tester, M. Mechanisms of salinity tolerance. Annu. Rev. Plant Biol. 2008, 59, 651–681. [Google Scholar] [CrossRef] [PubMed] [Green Version]
  2. Shabala, S. Learning from halophytes: Physiological basis and strategies to improve abiotic stress tolerance in crops. Ann. Bot. 2013, 112, 1209–1221. [Google Scholar] [CrossRef] [PubMed]
  3. Roy, S.J.; Negrao, S.; Tester, M. Salt resistant crop plants. Curr. Opin. Biotechnol. 2014, 26, 115–124. [Google Scholar] [CrossRef] [PubMed]
  4. Munns, R.; Day, D.A.; Fricke, W.; Watt, M.; Arsova, B.; Barkla, B.J.; Bose, J.; Byrt, C.S.; Chen, Z.H.; Foster, K.J.; et al. Energy costs of salt tolerance in crop plants. New Phytol. 2020, 225, 1072–1090. [Google Scholar] [CrossRef] [Green Version]
  5. Zhao, C.; Zhang, H.; Song, C.; Zhu, J.-K.; Shabala, S. Mechanisms of plant responses and adaptation to soil salinity. Innovation 2020, 1, 1–41. [Google Scholar]
  6. George, E.; Horst, W.J.; Neumann, E. Adaptation of plants to adverse chemical soil conditions. In Marschner’s Mineral Nutrition of Higher Plants, 3rd ed.; Marschner, P., Ed.; Academic Press: San Diego, CA, USA, 2012; pp. 409–472. [Google Scholar]
  7. Hauser, F.; Horie, T. A conserved primary salt tolerance mechanism mediated by HKT transporters: A mechanism for sodium exclusion and maintenance of high K+/Na+ ratio in leaves during salinity stress. Plant Cell Environ. 2010, 33, 552–565. [Google Scholar] [CrossRef]
  8. Shabala, L.; Zhang, J.; Pottosin, I.; Bose, J.; Zhu, M.; Fuglsang, A.T.; Velarde-Buendia, A.; Massart, A.; Hill, C.B.; Roessner, U.; et al. Cell-type-specific H+-ATPase activity in root tissues enables K+ retention and mediates acclimation of barley (Hordeum vulgare) to salinity stress. Plant Physiol. 2016, 172, 2445–2458. [Google Scholar] [CrossRef] [Green Version]
  9. Wu, H.H.; Zhang, X.C.; Giraldo, J.P.; Shabala, S. It is not all about sodium: Revealing tissue specificity and signalling roles of potassium in plant responses to salt stress. Plant Soil 2018, 431, 1–17. [Google Scholar] [CrossRef]
  10. Maathuis, F.J.M.; Amtmann, A. K+ nutrition and Na+ toxicity: The basis of cellular K+/Na+ ratios. Ann. Bot. 1999, 84, 123–133. [Google Scholar] [CrossRef] [Green Version]
  11. Shabala, S.; Cuin, T.A. Potassium transport and plant salt tolerance. Physiol. Plant. 2008, 133, 651–669. [Google Scholar] [CrossRef]
  12. Benito, B.; Haro, R.; Amtmann, A.; Cuin, T.A.; Dreyer, I. The twins K+ and Na+ in plants. J. Plant Physiol. 2014, 171, 723–731. [Google Scholar] [CrossRef] [PubMed]
  13. Ishikawa, T.; Cuin, T.A.; Bazihizina, N.; Shabala, S. Xylem ion loading and its implications for plant abiotic stress tolerance. Adv. Bot. Res. 2018, 87, 267–301. [Google Scholar]
  14. Corratge-Faillie, C.; Jabnoune, M.; Zimmermann, S.; Very, A.A.; Fizames, C.; Sentenac, H. Potassium and sodium transport in non-animal cells: The Trk/Ktr/HKT transporter family. Cell. Mol. Life Sci. 2010, 67, 2511–2532. [Google Scholar] [CrossRef] [PubMed]
  15. Maser, P.; Eckelman, B.; Vaidyanathan, R.; Horie, T.; Fairbairn, D.J.; Kubo, M.; Yamagami, M.; Yamaguchi, K.; Nishimura, M.; Uozumi, N.; et al. Altered shoot/root Na+ distribution and bifurcating salt sensitivity in Arabidopsis by genetic disruption of the Na+ transporter AtHKTI1. FEBS Lett. 2002, 531, 157–161. [Google Scholar] [CrossRef] [Green Version]
  16. Horie, T.; Hauser, F.; Schroeder, J.I. HKT transporter-mediated salinity resistance mechanisms in Arabidopsis and monocot crop plants. Trends Plant Sci. 2009, 14, 660–668. [Google Scholar] [CrossRef] [PubMed] [Green Version]
  17. Platten, J.D.; Cotsaftis, O.; Berthomieu, P.; Bohnert, H.; Davenport, R.J.; Fairbairn, D.J.; Horie, T.; Leigh, R.A.; Lin, H.X.; Luan, S.; et al. Nomenclature for HKT transporters, key determinants of plant salinity tolerance. Trends Plant Sci. 2006, 11, 372–374. [Google Scholar] [CrossRef]
  18. Waters, S.; Gilliham, M.; Hrmova, M. Plant high-affinity potassium (HKT) transporters involved in salinity tolerance: Structural insights to probe differences in ion selectivity. Int. J. Mol. Sci. 2013, 14, 7660–7680. [Google Scholar] [CrossRef] [Green Version]
  19. Uozumi, N.; Kim, E.J.; Rubio, F.; Yamaguchi, T.; Muto, S.; Tsuboi, A.; Bakker, E.P.; Nakamura, T.; Schroeder, J.I. The Arabidopsis HKT1 gene homolog mediates inward Na+ currents in Xenopus laevis oocytes and Na+ uptake in Saccharomyces cerevisiae. Plant Physiol. 2000, 122, 1249–1259. [Google Scholar] [CrossRef] [Green Version]
  20. Sunarpi; Horie, T.; Motoda, J.; Kubo, M.; Yang, H.; Yoda, K.; Horie, R.; Chan, W.Y.; Leung, H.Y.; Hattori, K.; et al. Enhanced salt tolerance mediated by AtHKT1 transporter-induced Na+ unloading from xylem vessels to xylem parenchyma cells. Plant J. 2005, 44, 928–938. [Google Scholar] [CrossRef]
  21. Davenport, R.J.; Munoz-Mayor, A.; Jha, D.; Essah, P.A.; Rus, A.; Tester, M. The Na+ transporter AtHKT1;1 controls retrieval of Na+ from the xylem in Arabidopsis. Plant Cell Environ. 2007, 30, 497–507. [Google Scholar] [CrossRef]
  22. James, R.A.; Davenport, R.J.; Munns, R. Physiological characterization of two genes for Na+ exclusion in durum wheat, Nax1 and Nax2. Plant Physiol. 2006, 142, 1537–1547. [Google Scholar] [CrossRef] [PubMed] [Green Version]
  23. Byrt, C.S.; Platten, J.D.; Spielmeyer, W.; James, R.A.; Lagudah, E.S.; Dennis, E.S.; Tester, M.; Munns, R. HKT1;5-like cation transporters linked to Na+ exclusion loci in wheat, Nax2 and Kna1. Plant Physiol. 2007, 143, 1918–1928. [Google Scholar] [CrossRef] [PubMed] [Green Version]
  24. Munns, R.; James, R.A.; Xu, B.; Athman, A.; Conn, S.J.; Jordans, C.; Byrt, C.S.; Hare, R.A.; Tyerman, S.D.; Tester, M.; et al. Wheat grain yield on saline soils is improved by an ancestral Na+ transporter gene. Nat. Biotechnol. 2012, 30, 360–U173. [Google Scholar] [CrossRef]
  25. Gorham, J.; Jones, R.G.W.; Bristol, A. partial characterization of the trait for enhanced K+-Na+ discrimination in the D-genome of wheat. Planta 1990, 180, 590–597. [Google Scholar] [CrossRef] [PubMed]
  26. Byrt, C.S.; Xu, B.; Krishnan, M.; Lightfoot, D.J.; Athman, A.; Jacobs, A.K.; Watson-Haigh, N.S.; Plett, D.; Munns, R.; Tester, M.; et al. The Na+ transporter, TaHKT1;5-D, limits shoot Na+ accumulation in bread wheat. Plant J. 2014, 80, 516–526. [Google Scholar] [CrossRef] [Green Version]
  27. Huang, S.B.; Spielmeyer, W.; Lagudah, E.S.; James, R.A.; Platten, J.D.; Dennis, E.S.; Munns, R. A sodium transporter (HKT7) is a candidate for Nax1, a gene for salt tolerance in durum wheat. Plant Physiol. 2006, 142, 1718–1727. [Google Scholar] [CrossRef] [Green Version]
  28. Zhu, M.; Shabala, L.; Cuin, T.A.; Huang, X.; Zhou, M.X.; Munns, R.; Shabala, S. Nax loci affect SOS1-like Na+/H+ exchanger expression and activity in wheat. J. Exp. Bot. 2016, 67, 835–844. [Google Scholar] [CrossRef] [Green Version]
  29. Garciadeblas, B.; Senn, M.E.; Banuelos, M.A.; Rodriguez-Navarro, A. Sodium transport and HKT transporters: The rice model. Plant J. 2003, 34, 788–801. [Google Scholar] [CrossRef]
  30. Huang, S.; Spielmeyer, W.; Lagudah, E.S.; Munns, R. Comparative mapping of HKT genes in wheat, barley, and rice, key determinants of Na+ transport, and salt tolerance. J. Exp. Bot. 2008, 59, 927–937. [Google Scholar] [CrossRef] [Green Version]
  31. Ren, Z.H.; Gao, J.P.; Li, L.G.; Cai, X.L.; Huang, W.; Chao, D.Y.; Zhu, M.Z.; Wang, Z.Y.; Luan, S.; Lin, H.X. A rice quantitative trait locus for salt tolerance encodes a sodium transporter. Nat. Genet. 2005, 37, 1141–1146. [Google Scholar] [CrossRef]
  32. Ismail, A.M.; Horie, T. Genomics, physiology, and molecular breeding approaches for improving salt tolerance. Annu. Rev. Plant Biol. 2017, 68, 405–434. [Google Scholar] [CrossRef] [Green Version]
  33. Thomson, M.J.; de Ocampo, M.; Egdane, J.; Rahman, M.A.; Sajise, A.G.; Adorada, D.L.; Tumimbang-Raiz, E.; Blumwald, E.; Seraj, Z.I.; Singh, R.K.; et al. Characterizing the Saltol quantitative trait locus for salinity tolerance in rice. Rice 2010, 3, 148–160. [Google Scholar] [CrossRef] [Green Version]
  34. Kobayashi, N.I.; Yamaji, N.; Yamamoto, H.; Okubo, K.; Ueno, H.; Costa, A.; Tanoi, K.; Matsumura, H.; Fujii-Kashino, M.; Horiuchi, T.; et al. OsHKT1;5 mediates Na+ exclusion in the vasculature to protect leaf blades and reproductive tissues from salt toxicity in rice. Plant J. 2017, 91, 657–670. [Google Scholar] [CrossRef] [PubMed] [Green Version]
  35. Demidchik, V.; Shabala, S.; Isayenkov, S.; Cuin, T.A.; Pottosin, I. Calcium transport across plant membranes: Mechanisms and functions. New Phytol. 2018, 220, 49–69. [Google Scholar] [CrossRef] [PubMed] [Green Version]
  36. Liu, J.; Shabala, S.; Shabala, L.; Zhou, M.X.; Meinke, H.; Venkataraman, G.; Chen, Z.H.; Zeng, F.R.; Zhao, Q.Z. Tissue-specific regulation of Na+ and K+ transporters explains genotypic differences in salinity stress tolerance in rice. Front. Plant Sci. 2019, 10, 1361. [Google Scholar] [CrossRef] [Green Version]
  37. Shi, H.Z.; Ishitani, M.; Kim, C.S.; Zhu, J.K. The Arabidopsis thaliana salt tolerance gene SOS1 encodes a putative Na+/H+ antiporter. Proc. Natl. Acad. Sci. USA 2000, 97, 6896–6901. [Google Scholar] [CrossRef] [Green Version]
  38. Pottosin, I.; Velarde-Buendia, A.M.; Bose, J.; Zepeda-Jazo, I.; Shabala, S.; Dobrovinskaya, O. Cross-talk between reactive oxygen species and polyamines in regulation of ion transport across the plasma membrane: Implications for plant adaptive responses. J. Exp. Bot. 2014, 65, 1271–1283. [Google Scholar] [CrossRef] [Green Version]
  39. Shabala, S.; Newman, I. Salinity effects on the activity of plasma membrane H+ and Ca2+ transporters in bean leaf mesophyll: Masking role of the cell wall. Ann. Bot. 2000, 85, 681–686. [Google Scholar] [CrossRef] [Green Version]
  40. Bose, J.; Pottosin, I.I.; Shabala, S.S.; Palmgren, M.G.; Shabala, S. Calcium efflux systems in stress signaling and adaptation in plants. Front. Plant Sci. 2011, 2, 85. [Google Scholar] [CrossRef] [Green Version]
  41. Chen, Z.; Pottosin, I.I.; Cuin, T.A.; Fuglsang, A.T.; Tester, M.; Jha, D.; Zepeda-Jazo, I.; Zhou, M.; Palmgren, M.G.; Newman, I.A.; et al. Root plasma membrane transporters controlling K+/Na+ homeostasis in salt-stressed barley. Plant Physiol. 2007, 145, 1714–1725. [Google Scholar] [CrossRef] [Green Version]
  42. Wang, H.; Shabala, L.; Zhou, M.; Shabala, S. Hydrogen peroxide-induced root Ca2+ and K+ fluxes correlate with salt tolerance in cereals: Towards the cell-based phenotyping. Int. J. Mol. Sci. 2018, 19, 702. [Google Scholar] [CrossRef] [PubMed] [Green Version]
  43. Schachtman, D.P.; Schroeder, J.I. Structure and transport mechanism of a high-affinity potassium uptake transporter from higher plants. Nature 1994, 370, 655–658. [Google Scholar] [CrossRef]
  44. Dixit, S.; Biswal, A.K.; Min, A.; Henry, A.; Oane, R.H.; Raorane, M.L.; Longkumer, T.; Pabuayon, I.M.; Mutte, S.K.; Vardarajan, A.R.; et al. Action of multiple intra-QTL genes concerted around a co-localized transcription factor underpins a large effect QTL. Sci. Rep. 2015, 5, 15183. [Google Scholar] [CrossRef] [PubMed]
  45. El Mahi, H.; Perez-Hormaeche, J.; De Luca, A.; Villalta, I.; Espartero, J.; Gamez-Arjona, F.; Fernandez, J.L.; Bundo, M.; Mendoza, I.; Mieulet, D.; et al. A Critical Role of Sodium Flux via the Plasma Membrane Na+/H+ Exchanger SOS1 in the Salt Tolerance of Rice. Plant Physiol. 2019, 180, 1046–1065. [Google Scholar] [CrossRef] [PubMed] [Green Version]
  46. Flam-Shepherd, R.; Huynh, W.Q.; Coskun, D.; Hamam, A.M.; Britto, D.T.; Kronzucker, H.J. Membrane fluxes, bypass flows, and sodium stress in rice: The influence of silicon. J. Exp. Bot. 2018, 69, 1679–1692. [Google Scholar] [CrossRef] [PubMed]
  47. Fujita, S.; De Bellis, D.; Edel, K.H.; Koster, P.; Andersen, T.G.; Schmid-Siegert, E.; Tendon, V.D.; Pfister, A.; Marhavy, P.; Ursache, R.; et al. SCHENGEN receptor module drives localized ROS production and lignification in plant roots. EMBO J. 2020, 39, e103894. [Google Scholar] [CrossRef] [PubMed]
  48. Rubio, F.; Nieves-Cordones, M.; Horie, T.; Shabala, S. Doing ‘business as usual’ comes with a cost: Evaluating energy cost of maintaining plant intracellular K+ homeostasis under saline conditions. New Phytol. 2020, 225, 1097–1104. [Google Scholar] [CrossRef] [Green Version]
  49. Anschütz, U.; Becker, D.; Shabala, S. Going beyond nutrition: Regulation of potassium homoeostasis as a common denominator of plant adaptive responses to environment. J. Plant Physiol. 2014, 171, 670–687. [Google Scholar] [CrossRef]
  50. Shabala, S. Signalling by potassium: Another second messenger to add to the list? J. Exp. Bot. 2017, 68, 4003–4007. [Google Scholar] [CrossRef] [Green Version]
  51. Demidchik, V. Mechanisms and physiological roles of K+ efflux from root cells. J. Plant Physiol. 2014, 171, 696–707. [Google Scholar] [CrossRef]
  52. Seifikalhor, M.; Aliniaeifard, S.; Shomali, A.; Azad, N.; Hassani, B.; Lastochkina, O.; Li, T. Calcium signaling and salt tolerance are diversely entwined in plants. Plant Signal. Behav. 2019, 14, 1665455. [Google Scholar] [CrossRef] [PubMed]
  53. Demidchik, V.; Shabala, S. Mechanisms of cytosolic calcium elevation in plants: The role of ion channels, calcium extrusion systems and NADPH oxidase-mediated ‘ROS-Ca2+ Hub’. Funct. Plant Biol. 2018, 45, 9–27. [Google Scholar] [CrossRef] [PubMed]
  54. Yoshida, S.; Forno, D.A.; Cock, J.H.; Gomez, K.A. Laboratory Manual for Physiological Studies of Rice; IRRI: Las Banos/Laguna, CA, USA, 1976; p. 83. [Google Scholar]
  55. Shabala, S.N.; Newman, I.A.; Morris, J. Oscillations in H+ and Ca2+ ion fluxes around the elongation region of corn roots and effects of external pH. Plant Physiol. 1997, 113, 111–118. [Google Scholar] [CrossRef] [PubMed] [Green Version]
  56. Shabala, L.; Ross, T.; McMeekin, T.; Shabala, S. Non-invasive microelectrode ion flux measurements to study adaptive responses of microorganisms to the environment. FEMS Microbiol. Rev. 2006, 30, 472–486. [Google Scholar] [CrossRef] [PubMed] [Green Version]
  57. Jayakannan, M.; Babourina, O.; Rengel, Z. Improved measurements of Na+ fluxes in plants using calixarene-based microelectrodes. J. Plant Physiol. 2011, 168, 1045–1051. [Google Scholar] [CrossRef] [PubMed]
  58. Shabala, S.; Shabala, S.; Cuin, T.A.; Pang, J.; Percey, W.; Chen, Z.; Conn, S.; Eing, C.; Wegner, L.H. Xylem ionic relations and salinity tolerance in barley. Plant J. 2010, 61, 839–853. [Google Scholar] [CrossRef] [PubMed]
Figure 1. (A) qRT-PCR analysis of expression of OsHKT1;5 in the elongation (EZ) and mature (MZ) root zones under control and salinity (80mM NaCl, seven days) conditions. (B,C) Relative gene expression values normalized by the corresponding amount of OsGAPDH as an internal control. Mean ± SE (n = 3 technical each consisting of six pooled individual plants). The numbers labeled by different letters are statistically different at p < 0.05.
Ijms 21 04882 g001
Figure 2. Morphological changes of wild-type (WT) and SKC1-NIL plants grown under control and saline (80 mM NaCl for seven days) conditions. (A) plant phenotype; (BD) changes in shoot weight; (EG) changes in root weight. FW, fresh weight; DW, dry weight. SDW, shoot dry weight; RDW, root dry weight. Mean ± SE (n = 5). The numbers labeled by different letters are statistically different at p < 0.05.
Ijms 21 04882 g002
Figure 3. Shoot Na+ (A) and K+ (B) content of WT and NIL(SKC1) plants grown under control and saline (80 mM NaCl for seven days) conditions. Mean ± SE (n = 5). Numbers labelled by different letters are statistically different at p < 0.05.
Ijms 21 04882 g003
Figure 4. Net Na+ and K+ fluxes measured from the xylem parenchyma cells in response to acute 80 mM NaCl treatment. (A,B) transient Na+ (A) and K+ (B) fluxes measured from NIL(SKC1), WT, and Oshkt1;5 (4A-02764) knock-down lines (KD). As the latter allele has a japonica rice cv. Dongjin background, fluxes were normalized for the appropriate WT, to make the results comparable with those measured from NIL(SKC1) and its wild type. (C,D) mean Na+ and K+ fluxes over the 30 min period after stress onset, respectively. Mean ± SE (n = 4 to 9). For all MIFE measurements, the sign convention is “influx positive”. The numbers labeled by different letters are statistically different at p < 0.05.
Ijms 21 04882 g004
Figure 5. Effect of salinity on the expression of GORK, HAK5, SOS1, and RBOHD genes in NIL(SKC1) line and its wild type. Mean ± SE (n = 3 technical samples each consisting of 6 pooled individual plants). The numbers labeled by different letters are statistically different at p < 0.05.
Ijms 21 04882 g005
Figure 6. Net Na+ and K+ fluxes measured from the epidermal root cells in response to acute 80 mM NaCl treatment in functionally different root zones. (A) transient Na+ fluxes measured from the elongation zone of WT plants. (B) the magnitude (peak Na+ uptake value) measured from NIL(SKC1), WT and Oshkt1;5 (4A-02764) knock-down (KD) lines in the elongation zone. Measurements from the mature zone have not been conducted as SOS1 genes mediating Na+ extrusion are expressed predominantly in the root apex [37]. (C) transient K+ fluxes measured from the elongation and mature zones of WT plants. (D,E) mean K+ fluxes measured over the 30 min period after stress onset from elongation and mature root zones of NIL(SKC1), WT, and Oshkt1;5 plants, respectively. Mean ± SE (n = 4–9). The numbers labeled by different letters are statistically different at p < 0.05.
Ijms 21 04882 g006
Figure 7. Net Ca2+ fluxes measured from the epidermal root cells in response to acute 80 mM NaCl treatment in functionally different root zones. (A) transient Ca2+ fluxes measured from the elongation and mature zones of WT plants. (B,C) mean Ca2+ fluxes measured over the 30 min period after stress onset from elongation and mature root zones of NIL(SKC1), WT and Oshkt1;5 plants, respectively. Mean ± SE (n = 4–9). The numbers labeled by different letters are statistically different at p < 0.05.
Ijms 21 04882 g007
Figure 8. Net Ca2+ fluxes measured from the epidermal cells in the elongation region of rice roots in response to 10 mM H2O2 treatment. (A) transient Ca2+ fluxes measured the elongation zone of WT plants. (B) peak Ca2+ flux measured from the epidermal cells of NIL (SKC1), WT and Oshkt1;5 (KD) plants. Mean ± SE (n = 4–9). The numbers labeled by different letters are statistically different at p < 0.05.
Ijms 21 04882 g008

