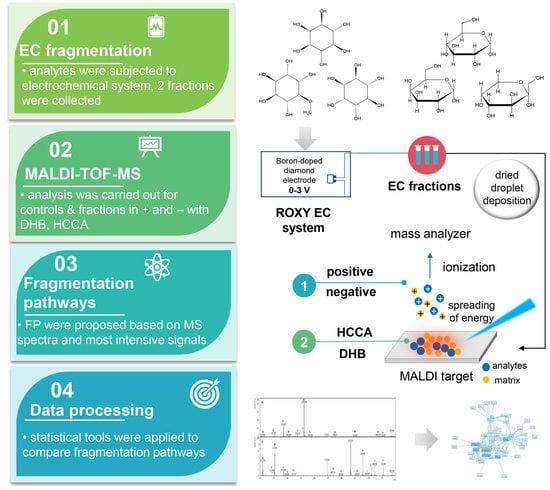
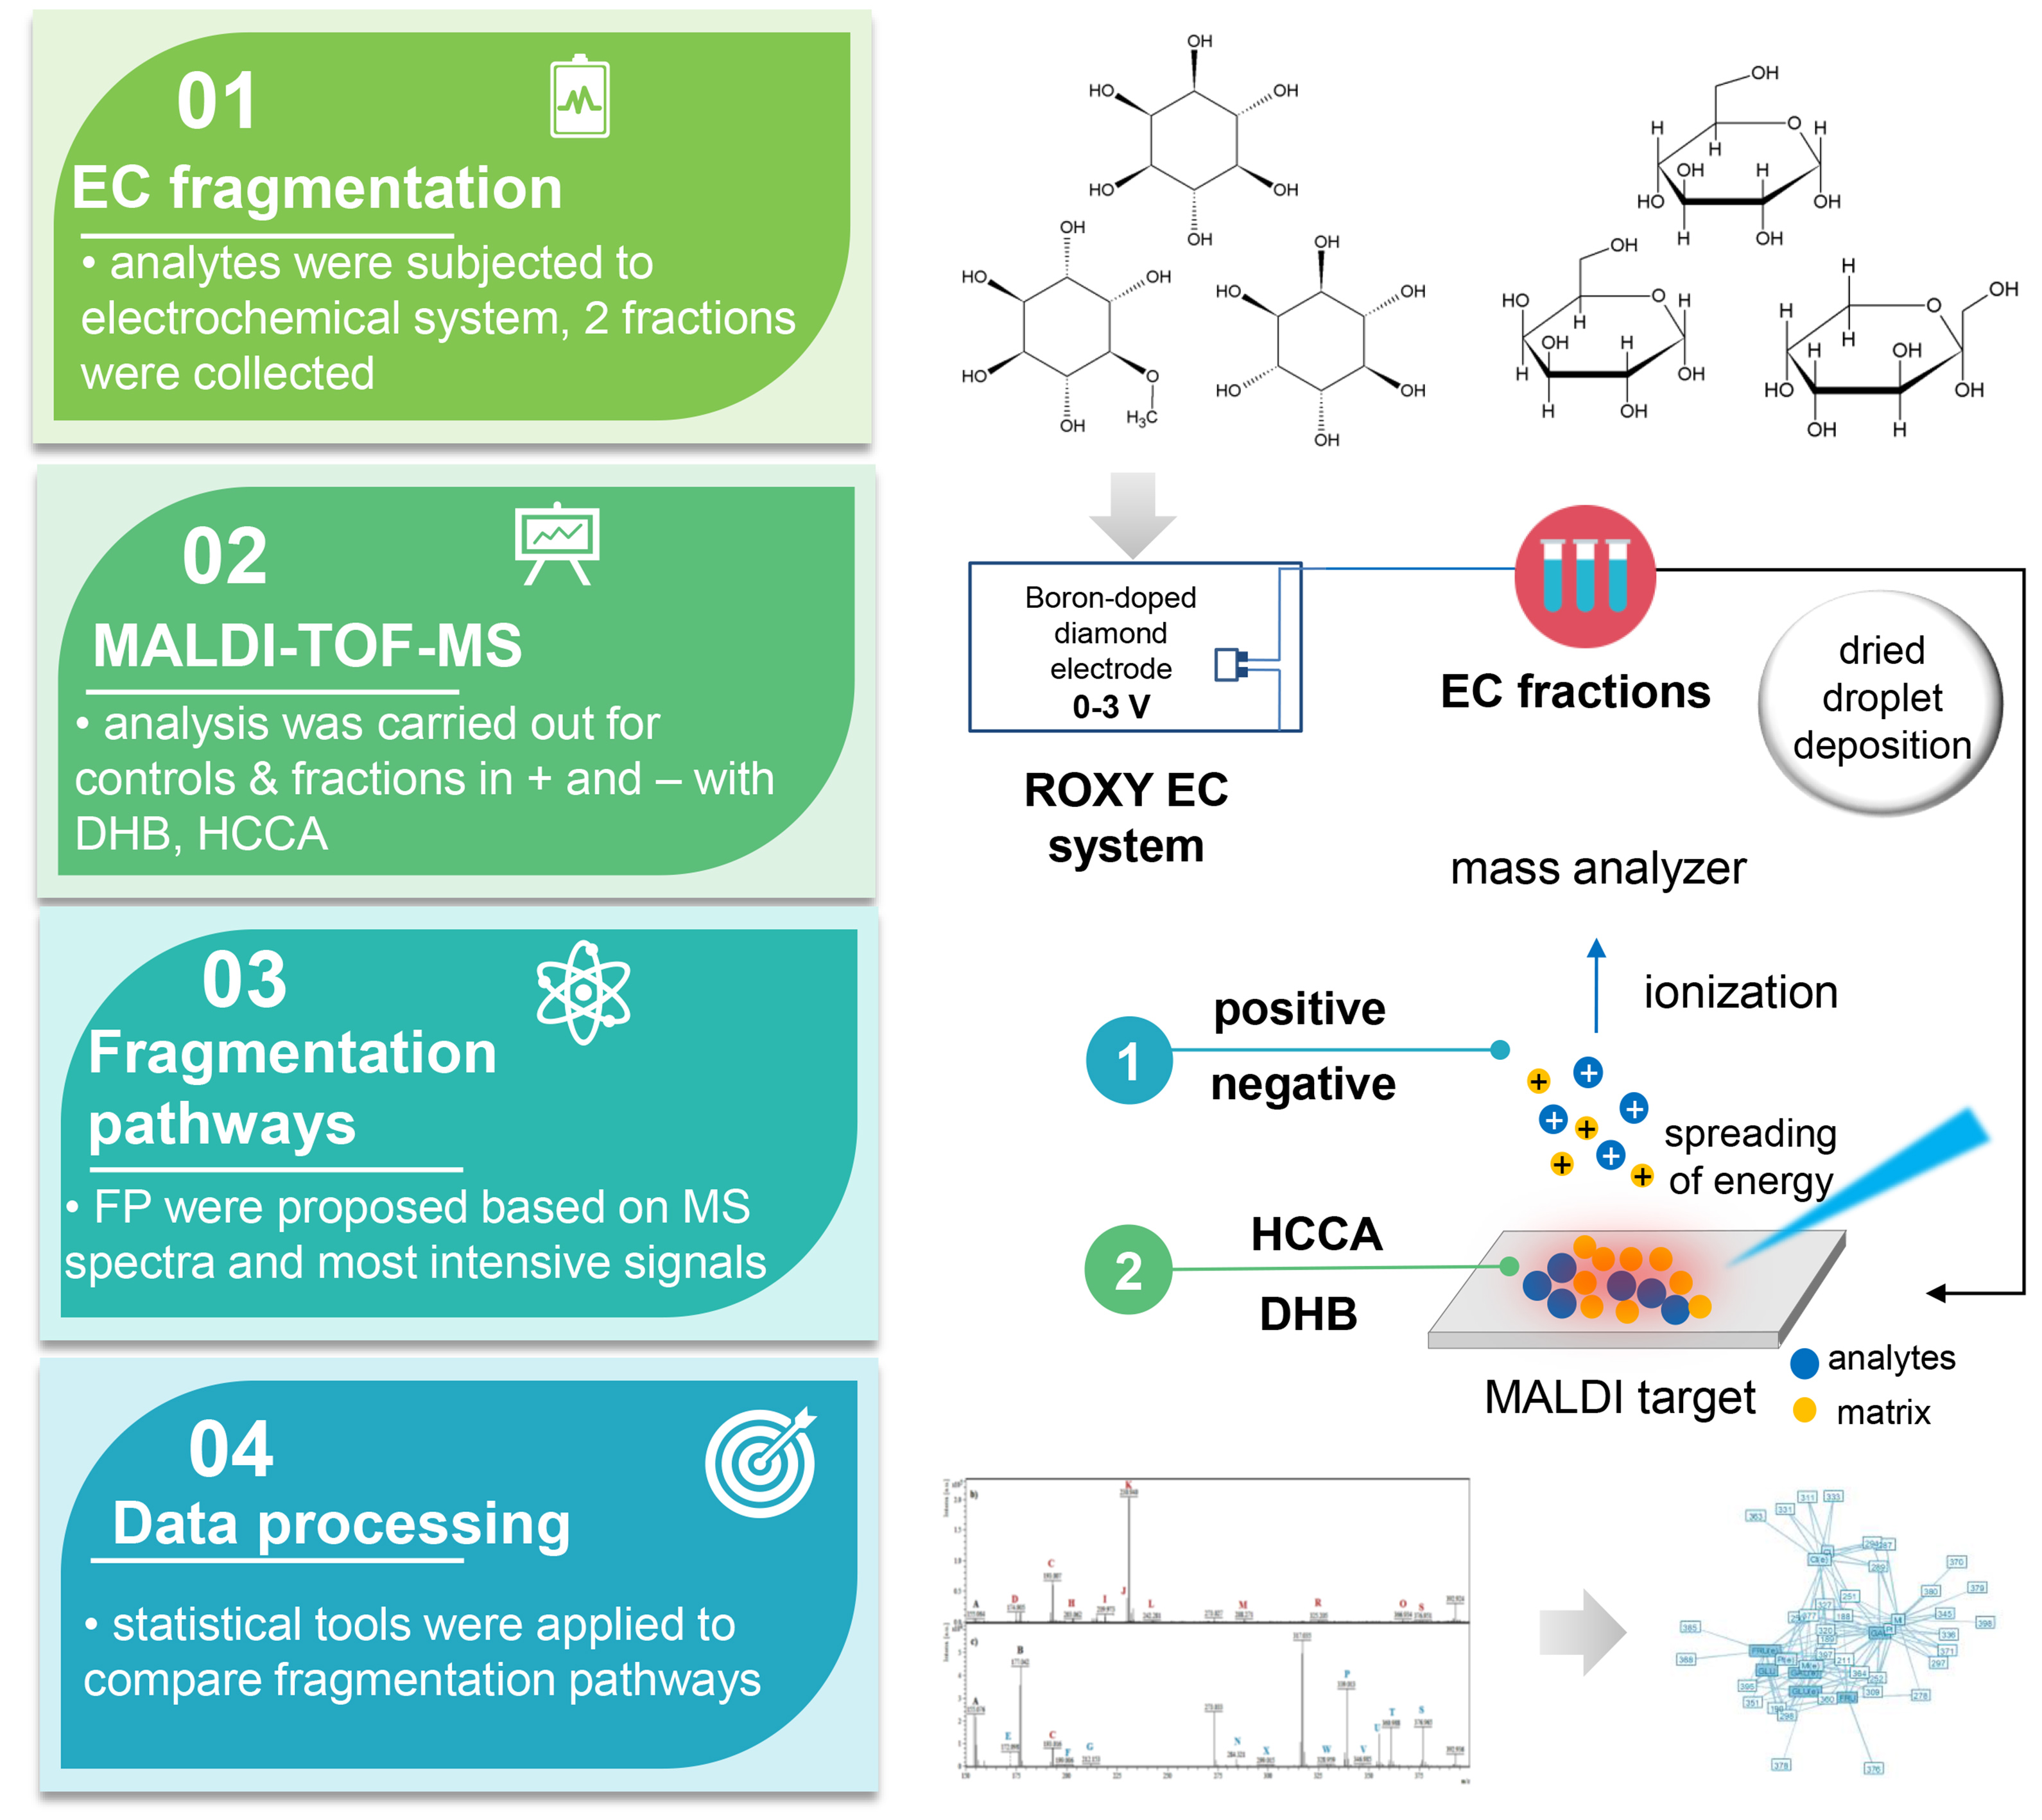
New Methodology for the Identification of Metabolites of Saccharides and Cyclitols by Off-Line EC-MALDI-TOF-MS

 , and
, and 
Abstract
:
1. Introduction
2. Results and Discussion
2.1. Effect of Matrix
2.2. Off-Line EC-MALDI-TOF-MS
2.2.1. D-Pinitol
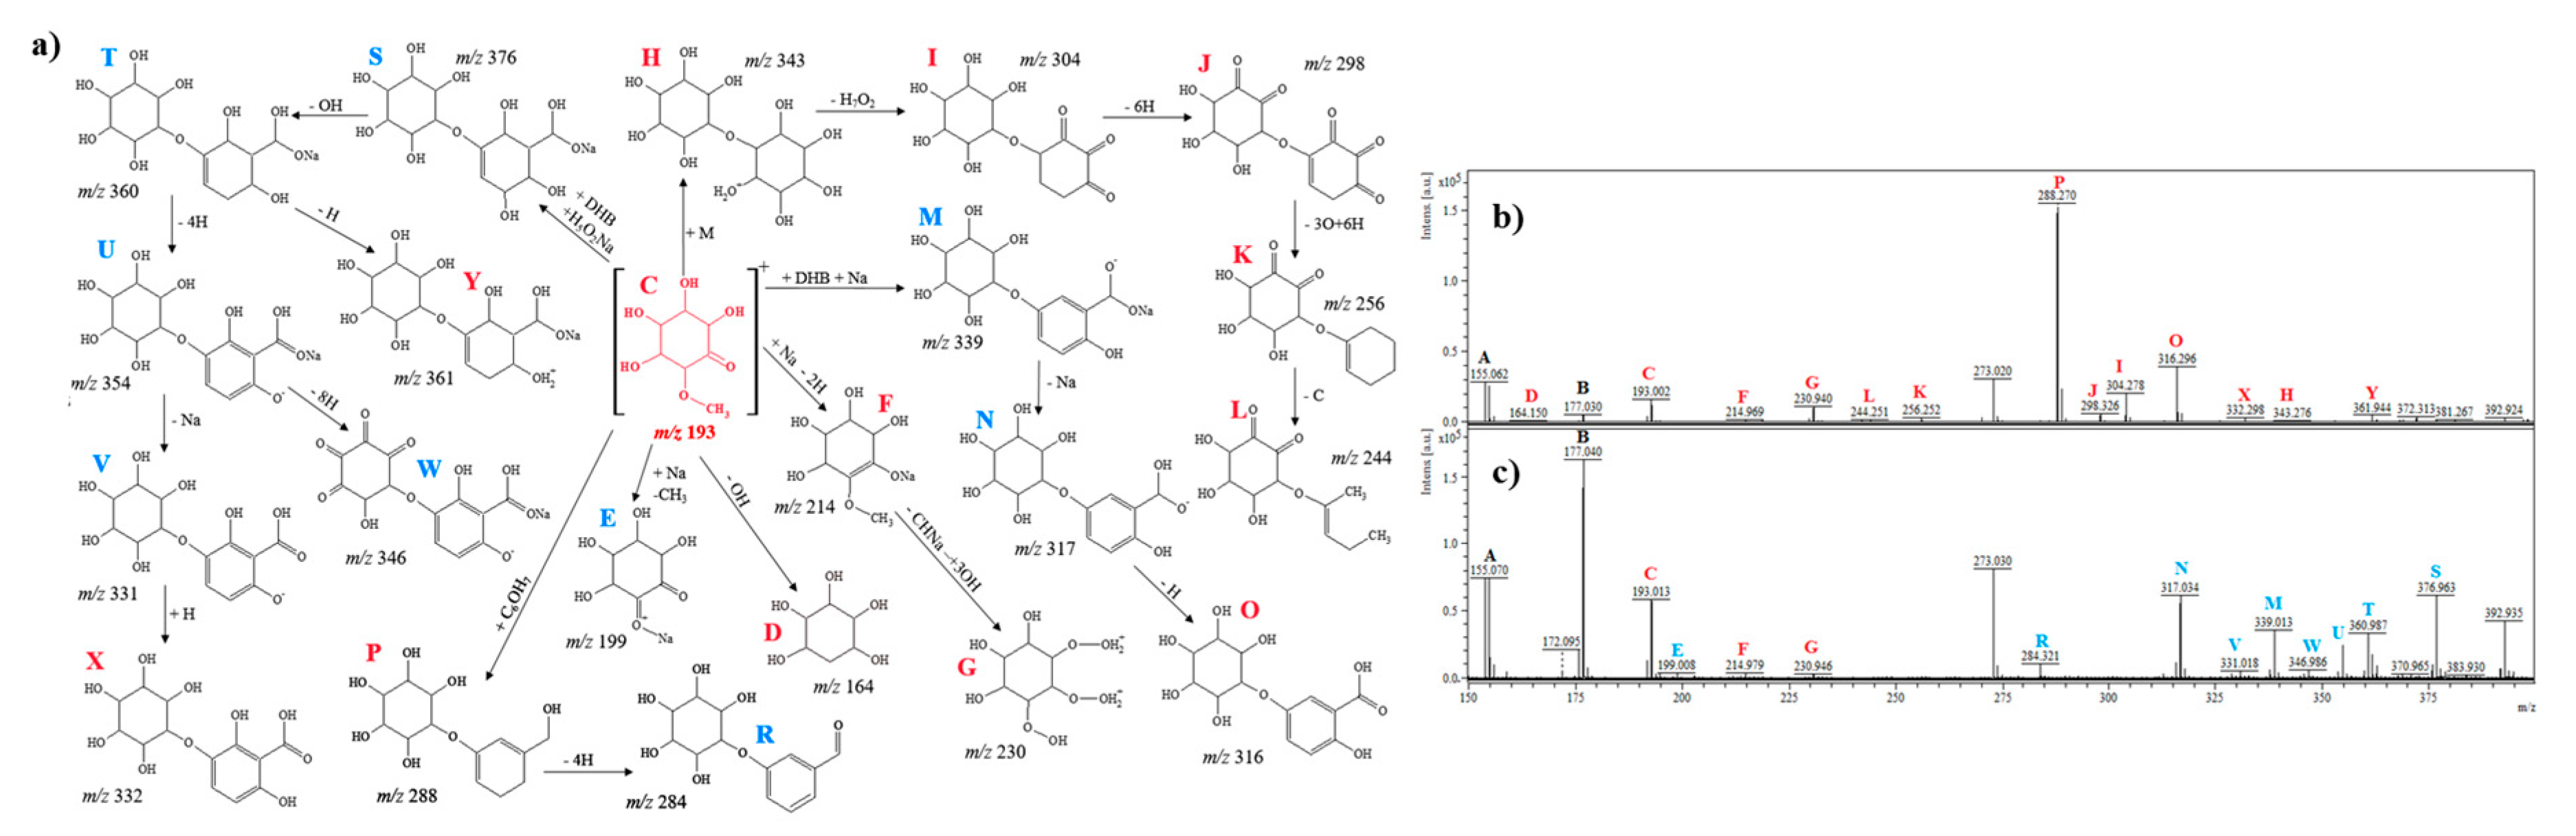
2.2.2. L-Chiro-Inositol
2.2.3. Myo-Inositol
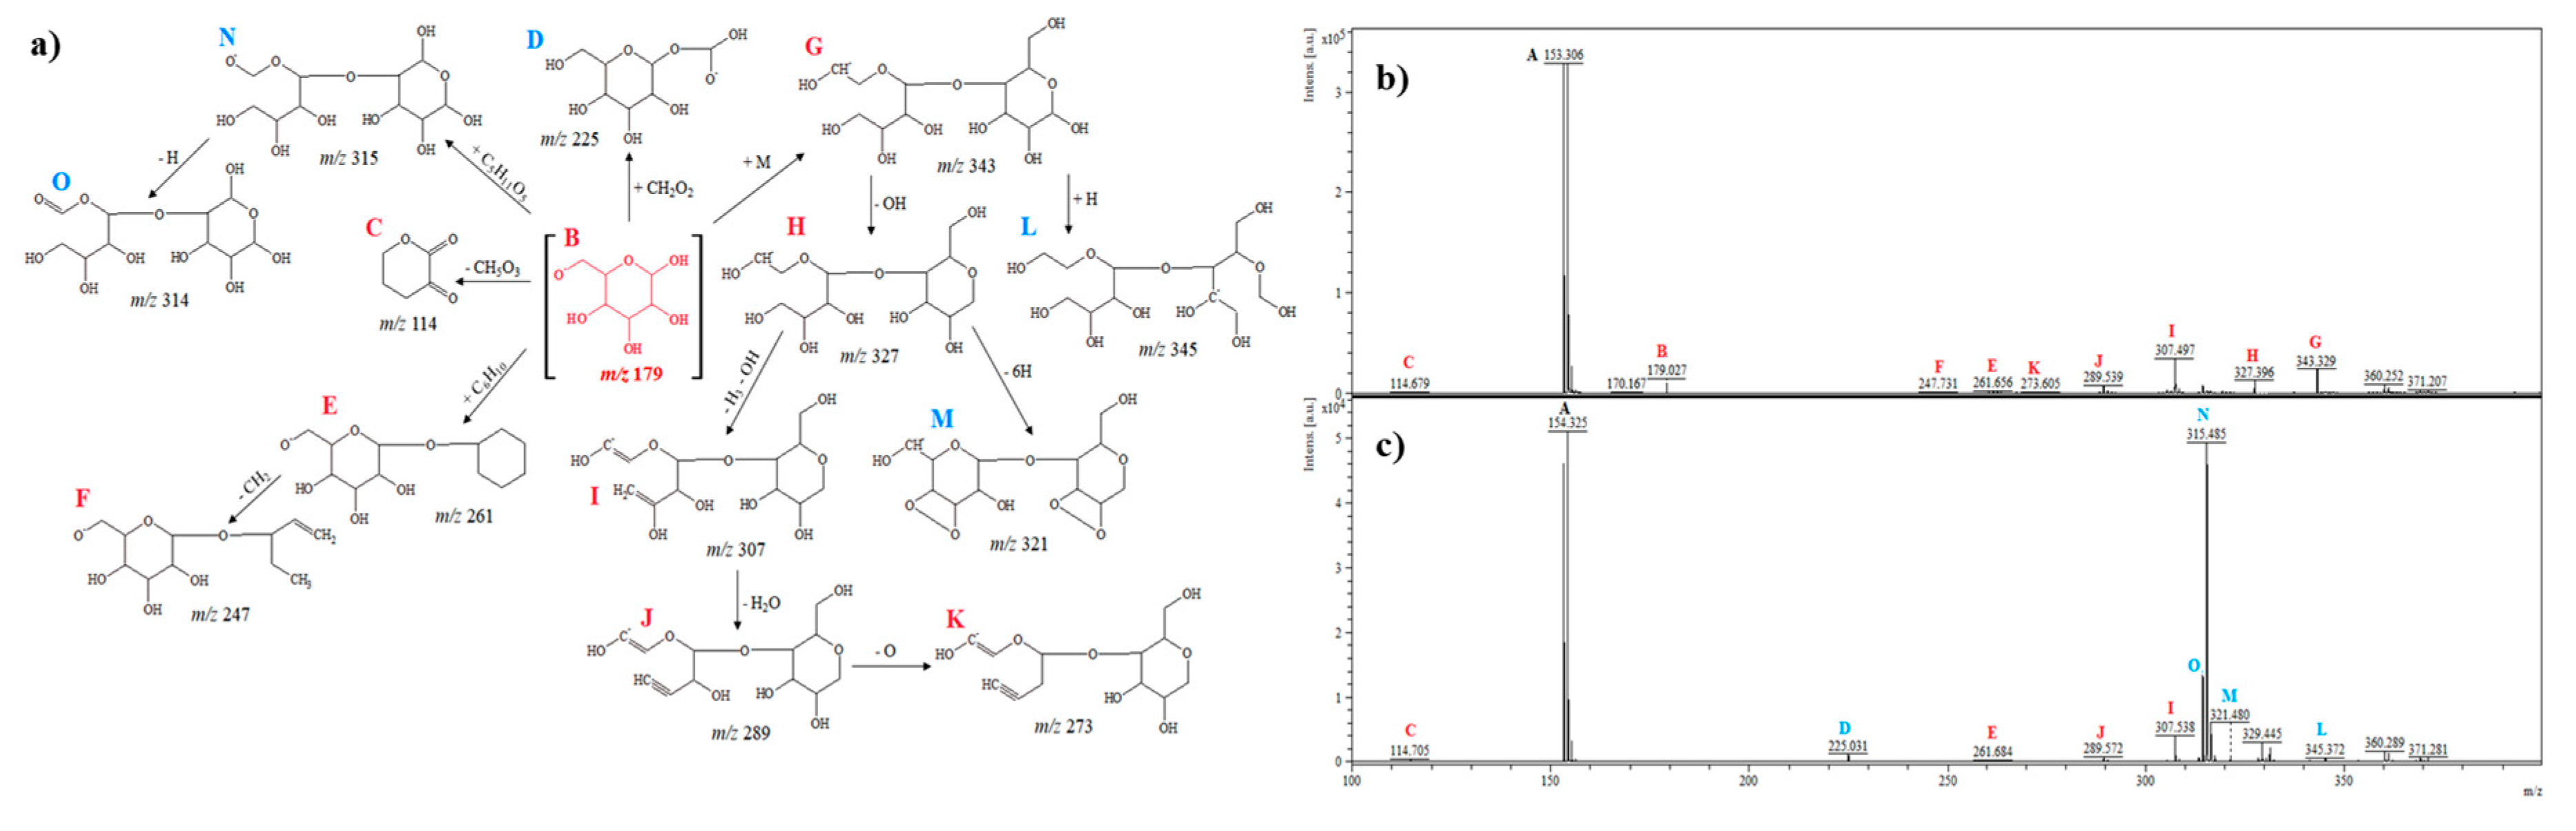
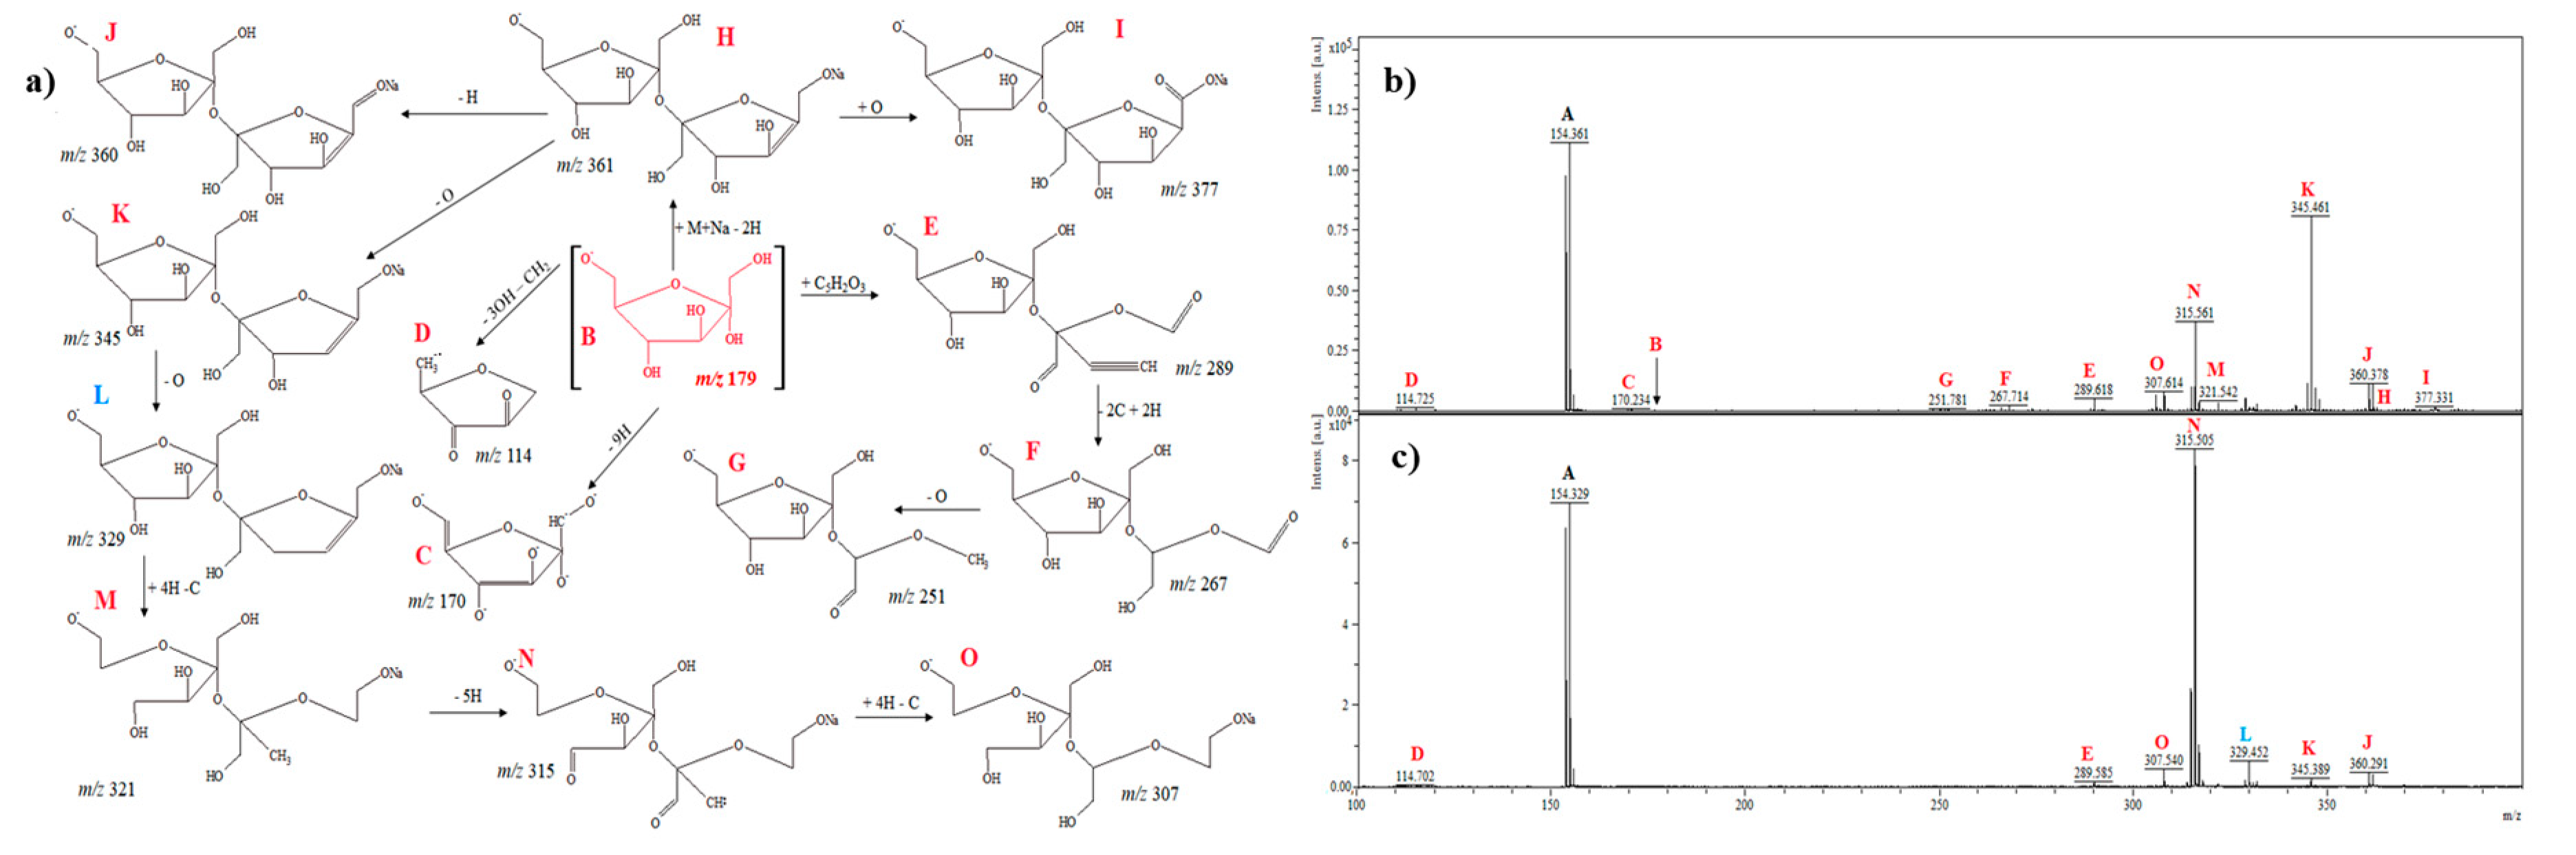
2.2.4. D-Glucose
2.2.5. D-Fructose
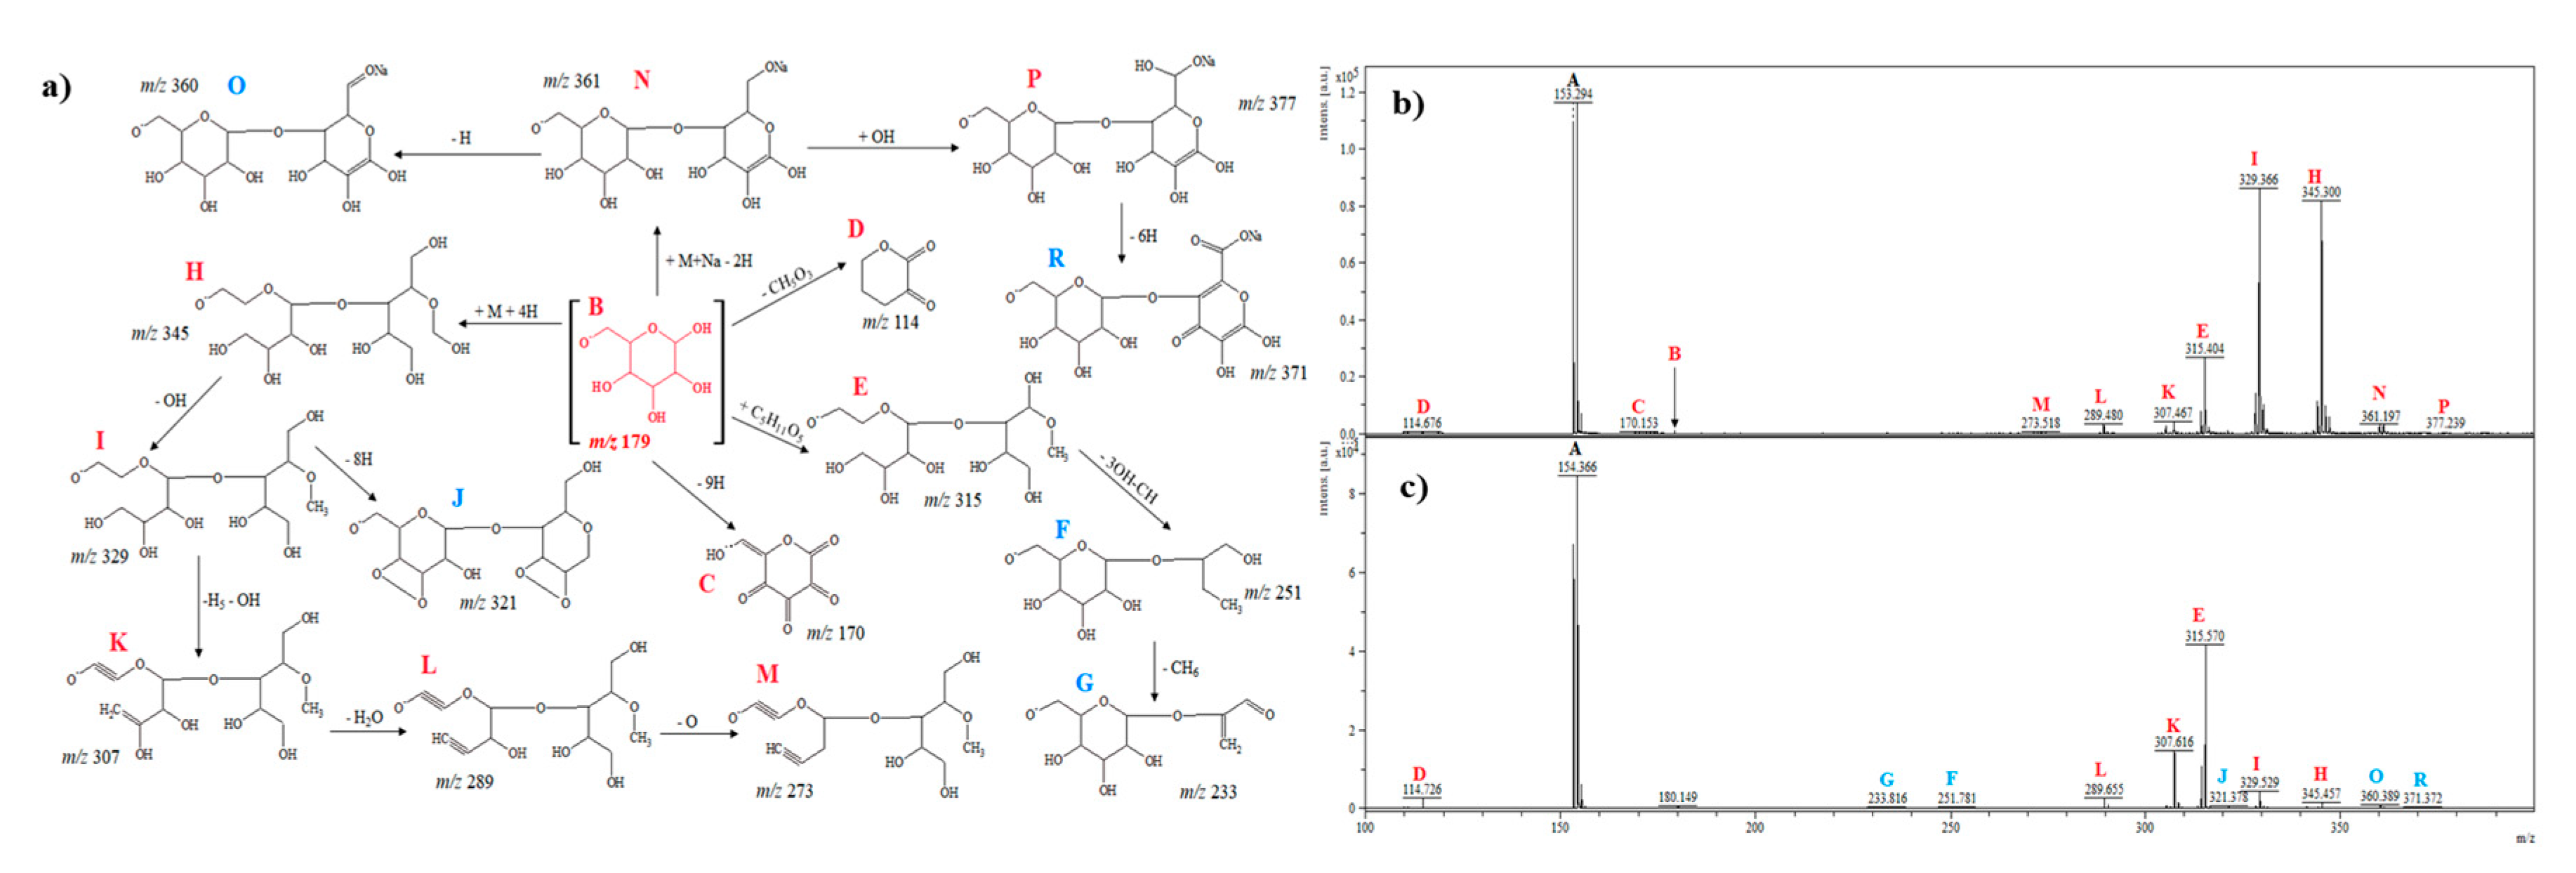
2.2.6. D-Galactose
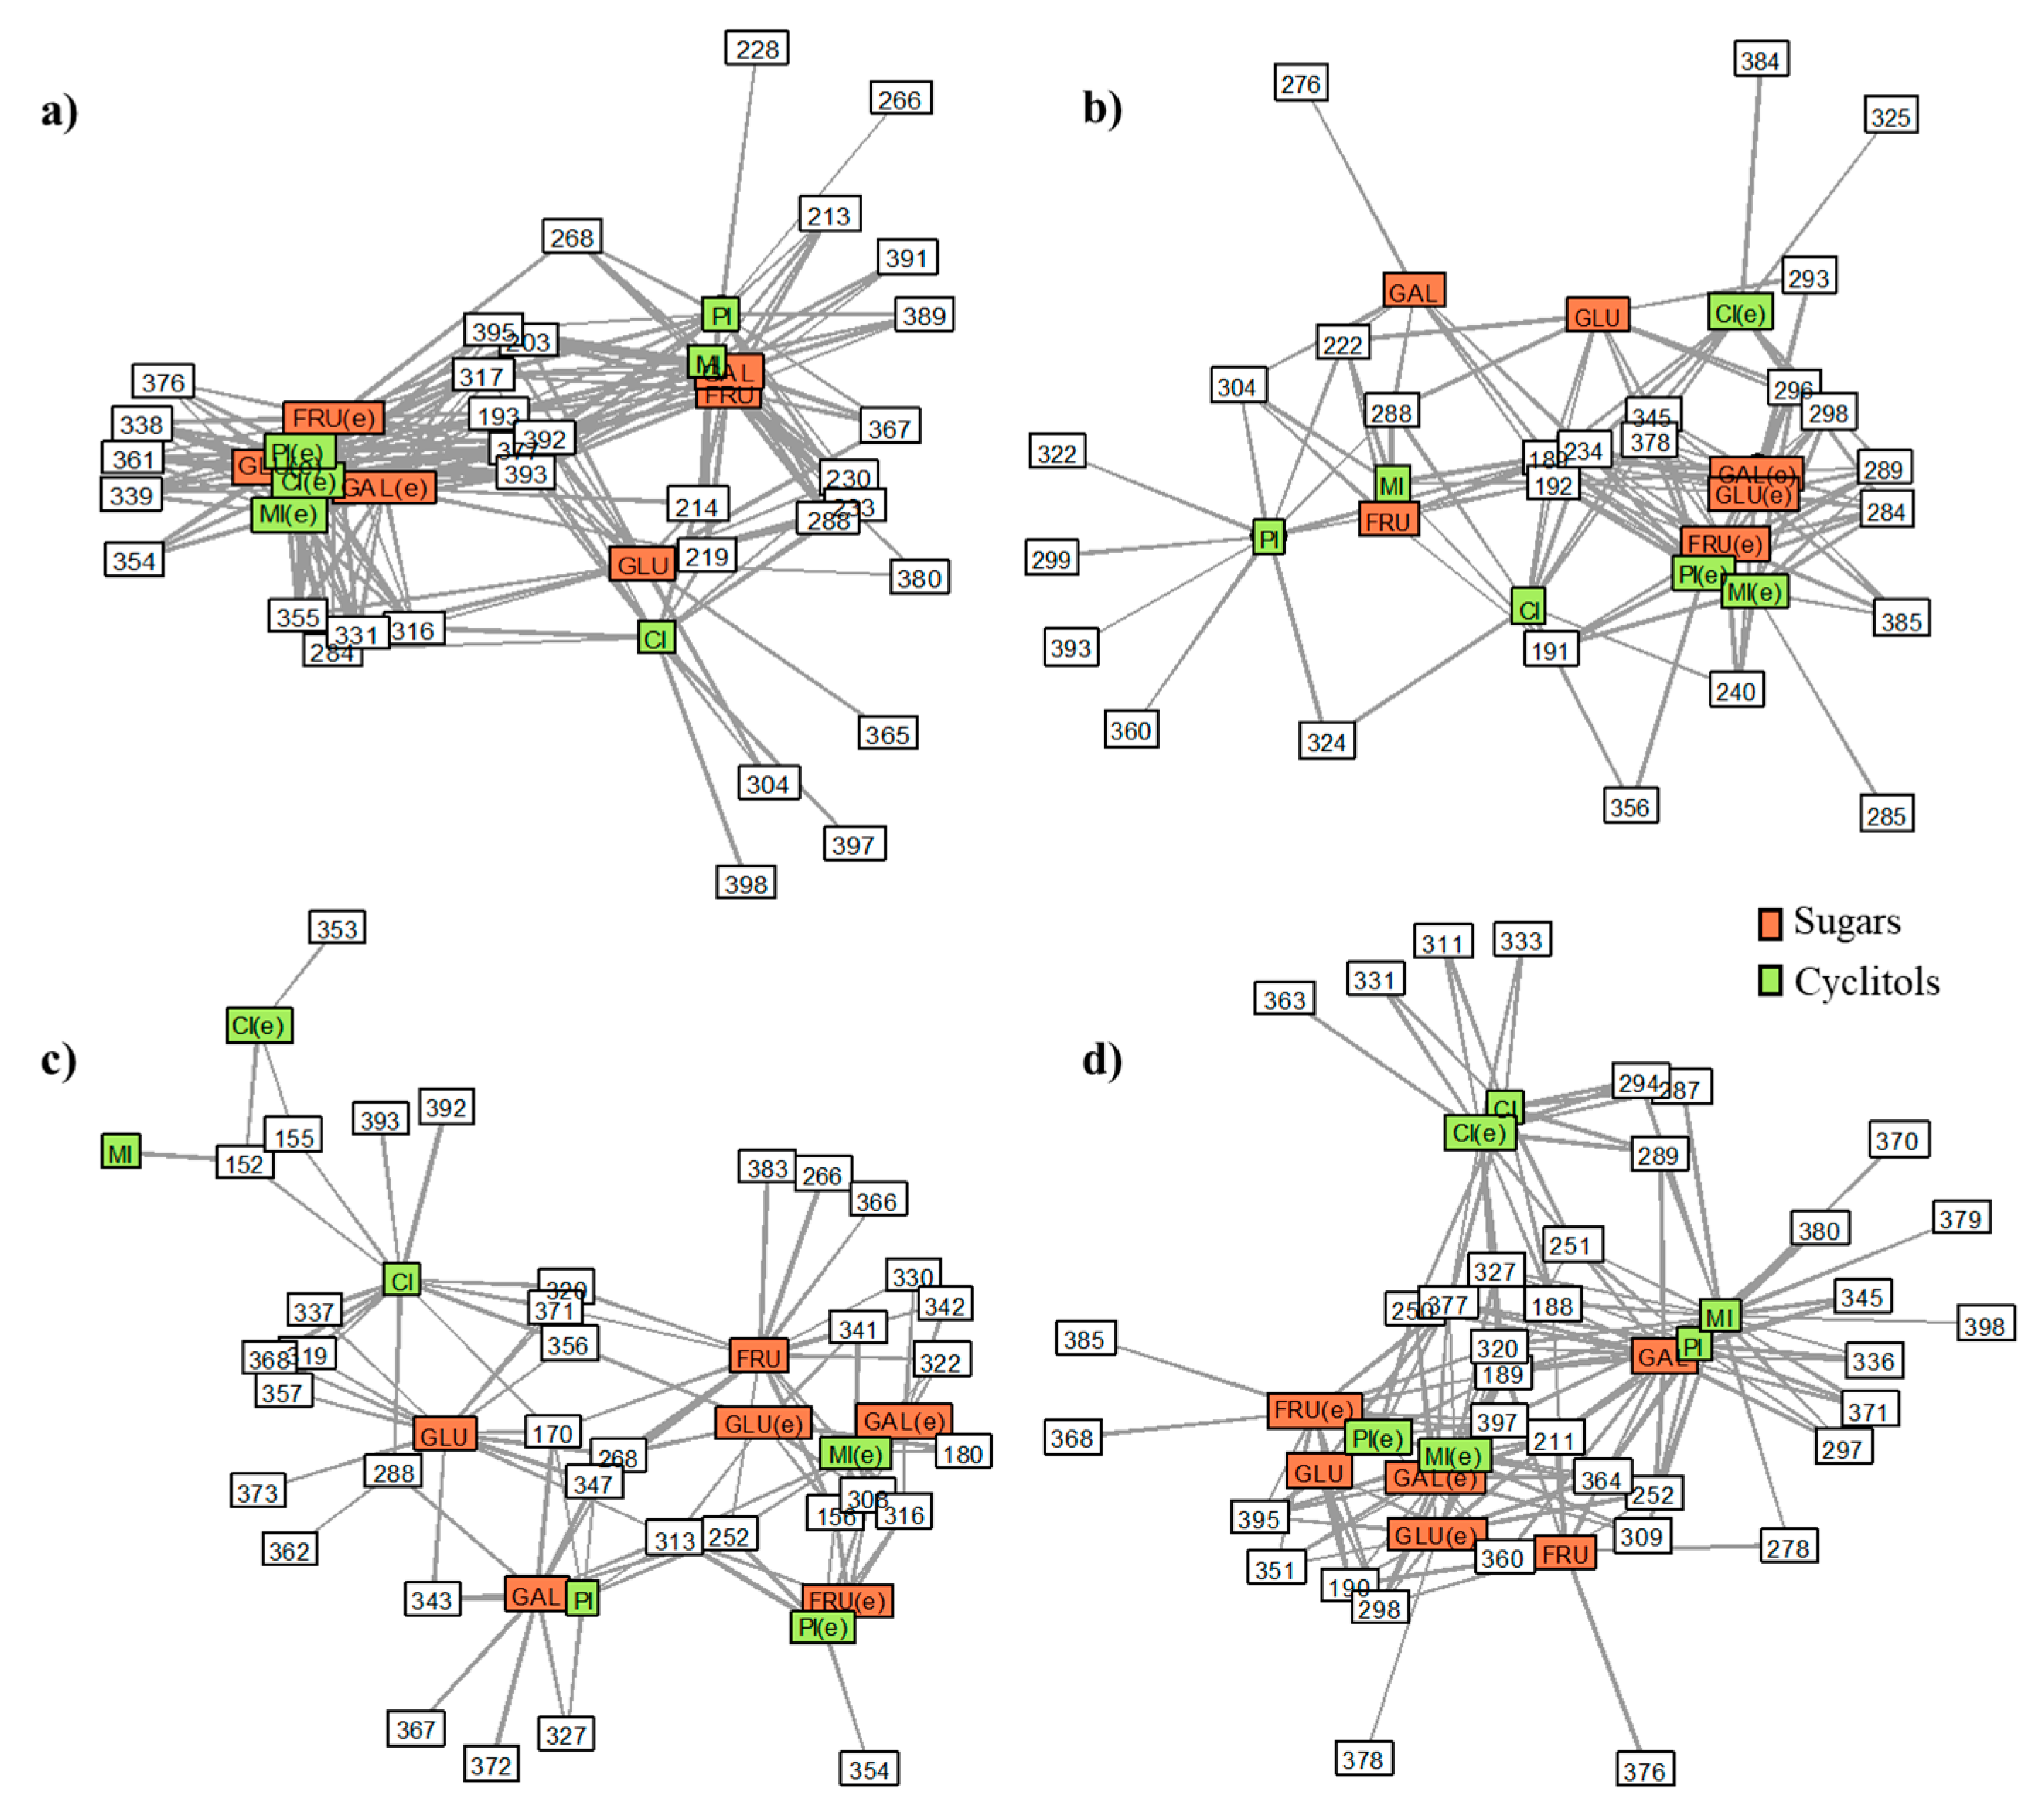
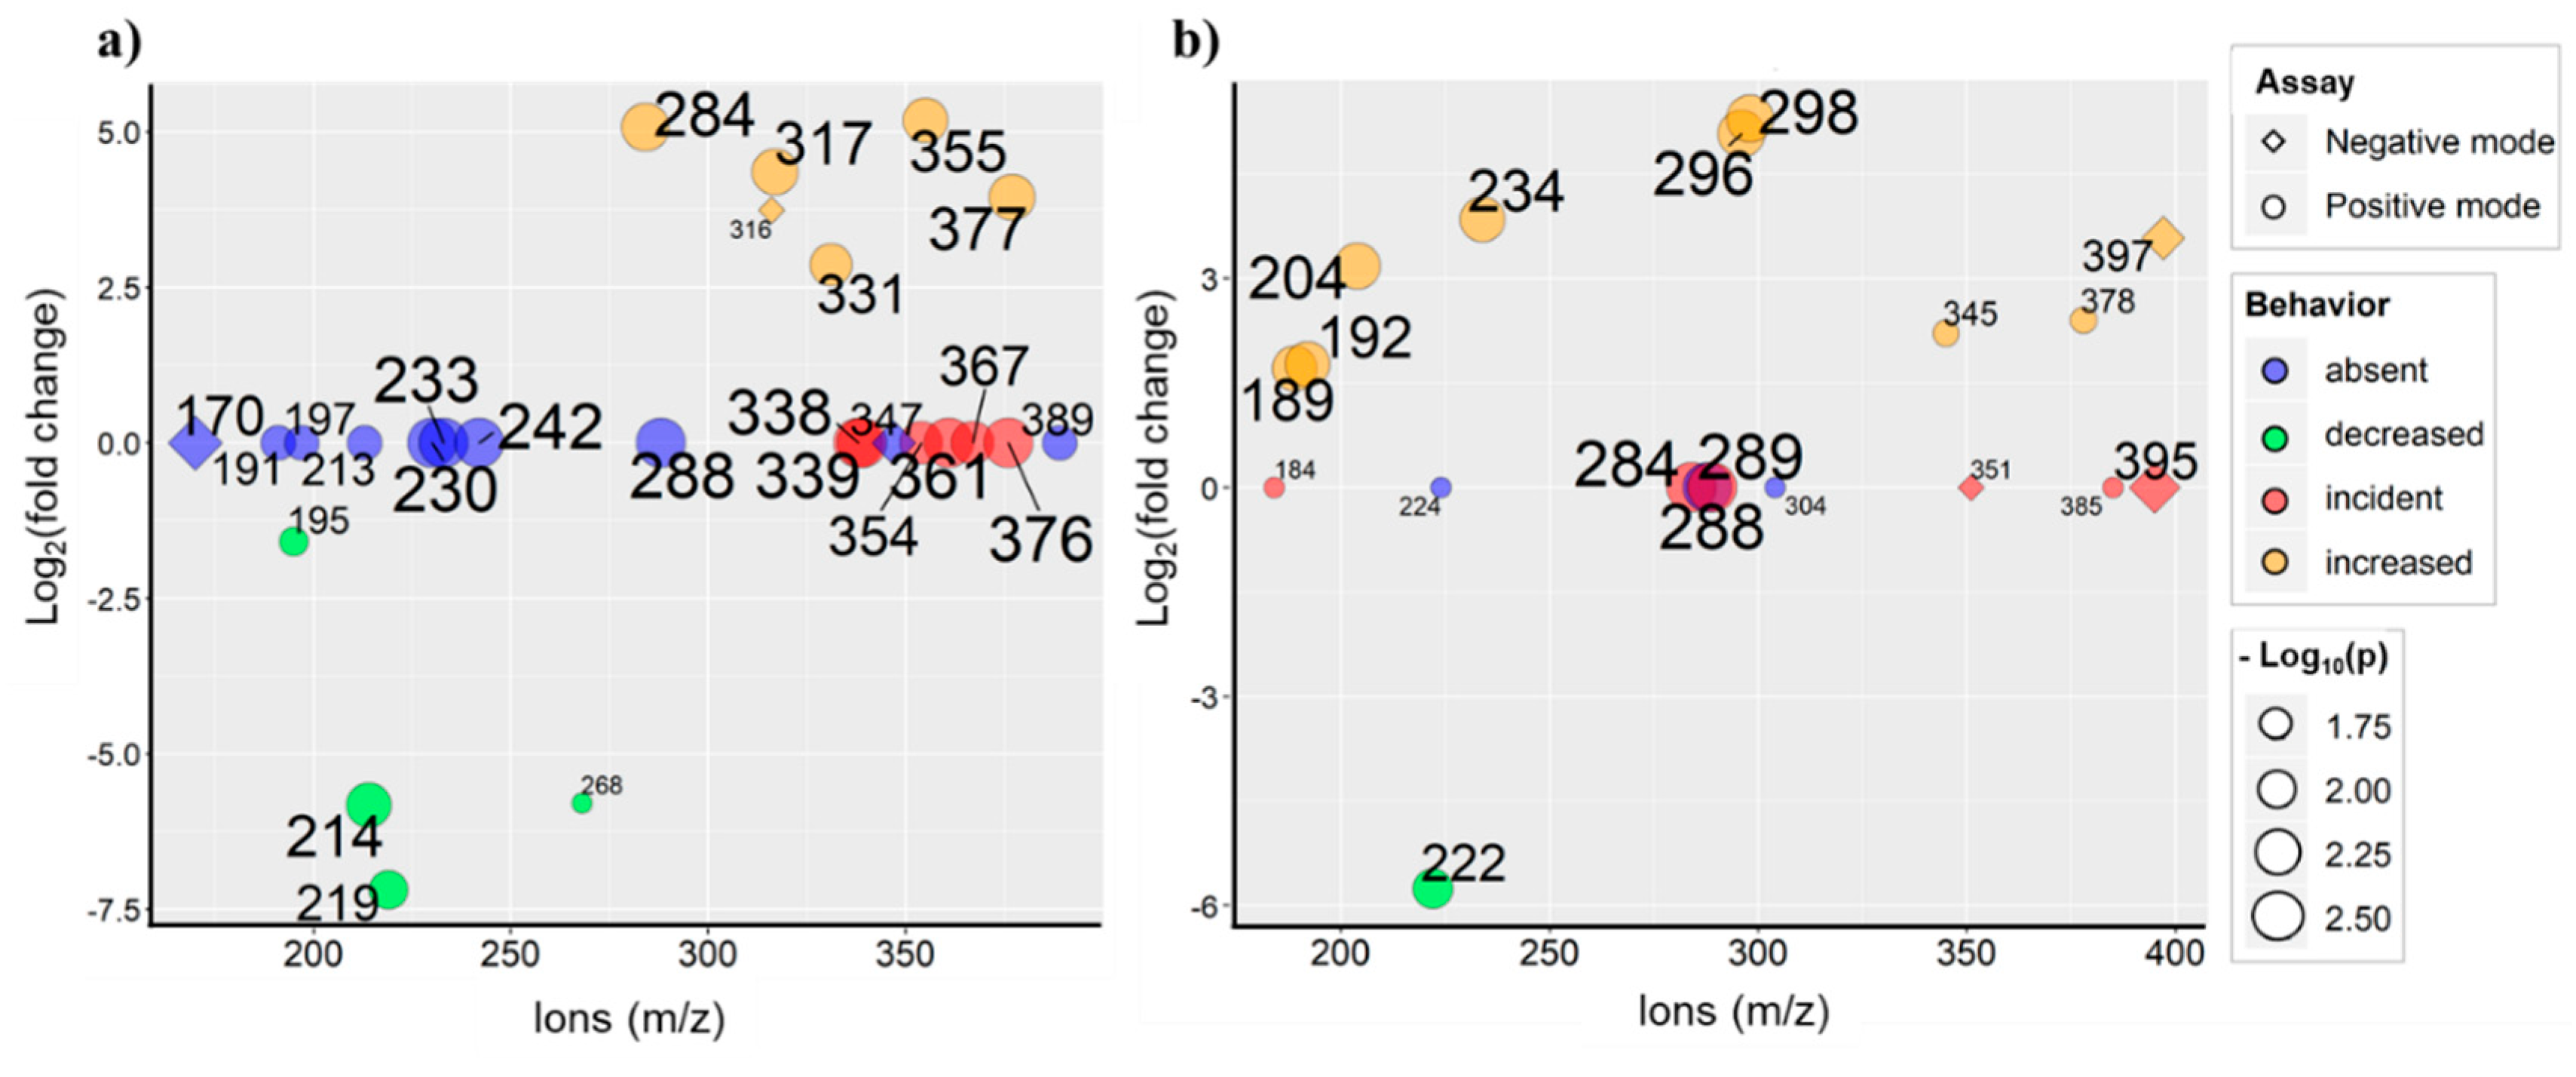
2.3. Data Analysis Approaches
3. Materials and Methods
3.1. Chemicals and Reagents
3.2. Sample Preparation
3.3. Instrumentation
3.4. MALDI-TOF-MS
3.5. Exploratory Data Analysis
4. Conclusions
Author Contributions
Funding
Conflicts of Interest
References
- Ratiu, I.A.; Al-Suod, H.; Ligor, M.; Ligor, T.; Krakowska, A.; Górecki, R.; Buszewski, B. Simultaneous Determination of Cyclitols and Sugars Following a Comprehensive Investigation of 40 Plants. Food Anal. Methods 2019, 12, 1466–1478. [Google Scholar] [CrossRef] [Green Version]
- Evans, C.E.L. Sugars and health: A review of current evidence and future policy. Proc. Nutr. Soc. 2017, 76, 400–407. [Google Scholar] [CrossRef]
- Al-Suod, H.; Ratiu, I.-A.; Górecki, R.; Buszewski, B. Pressurized liquid extraction of cyclitols and sugars: Optimization of extraction parameters and selective separation. J. Sep. Sci. 2019, 42, 1265–1272. [Google Scholar] [CrossRef]
- Ratiu, I.-A.; Al-Suod, H.; Bukowska, M.; Ligor, M.; Buszewski, B. Correlation Study of Honey Regarding their Physicochemical Properties and Sugars and Cyclitols Content. Molecules 2019, 25, 34. [Google Scholar] [CrossRef] [Green Version]
- Al-Suod, H.; Ligor, M.; Ratiu, I.-A.; Rafińska, K.; Górecki, R.; Buszewski, B. A window on cyclitols: Characterization and analytics of inositols. Phytochem. Lett. 2017, 20, 507–519. [Google Scholar] [CrossRef]
- Al-Suod, H.; Ratiu, I.-A.; Ligor, M.; Ligor, T.; Buszewski, B. Determination of sugars and cyclitols isolated from various morphological parts of Medicago sativa L. J. Sep. Sci. 2018, 41, 1118–1128. [Google Scholar] [CrossRef] [PubMed]
- Atanasov, A.G.; Waltenberger, B.; Pferschy-Wenzig, E.-M.; Linder, T.; Wawrosch, C.; Uhrin, P.; Temml, V.; Wang, L.; Schwaiger, S.; Heiss, E.H.; et al. Discovery and resupply of pharmacologically active plant-derived natural products: A review. Biotechnol. Adv. 2015, 33, 1582–1614. [Google Scholar] [CrossRef] [Green Version]
- Wang, H.-Y.; Zhao, Z.; Guo, Y. Chemical and Biochemical Applications of MALDI TOF-MS Based on Analyzing the Small Organic Compounds. Top. Curr. Chem. 2012, 331, 165–192. [Google Scholar] [CrossRef]
- Chakraborty, P.; Pradeep, T. The emerging interface of mass spectrometry with materials. NPG Asia Mater. 2019, 11, 1–22. [Google Scholar] [CrossRef] [Green Version]
- Weidner, S.M.; Falkenhagen, J.; Maltsev, S.; Sauerland, V.; Rinken, M. A novel software tool for copolymer characterization by coupling of liquid chromatography with matrix-assisted laser desorption/ionization time-of-flight mass spectrometry. Rapid Commun. Mass Spectrom. 2007, 21, 2750–2758. [Google Scholar] [CrossRef]
- Clark, A.E.; Kaleta, E.J.; Arora, A.; Wolk, D.M. Matrix-Assisted Laser Desorption Ionization-Time of Flight Mass Spectrometry: A Fundamental Shift in the Routine Practice of Clinical Microbiology. Clin. Microbiol. Rev. 2013, 26, 547–603. [Google Scholar] [CrossRef] [PubMed] [Green Version]
- Heap, R.E.; Segarra-Fas, A.; Blain, A.P.; Findlay, G.M.; Trost, M. Profiling embryonic stem cell differentiation by MALDI TOF mass spectrometry: Development of a reproducible and robust sample preparation workflow. Analyst 2019, 144, 6371–6381. [Google Scholar] [CrossRef] [PubMed] [Green Version]
- Clark, C.M.; Costa, M.S.; Sanchez, L.M.; Murphy, B.T. Coupling MALDI-TOF mass spectrometry protein and specialized metabolite analyses to rapidly discriminate bacterial function. Proc. Natl. Acad. Sci. USA 2018, 115, 4981–4986. [Google Scholar] [CrossRef] [PubMed] [Green Version]
- Bronzel, J.L.; Milagre, C.D.; Milagre, H.M.; Jr, J.L.B. Analysis of low molecular weight compounds using MALDI- and LDI-TOF-MS: Direct detection of active pharmaceutical ingredients in different formulations. J. Mass Spectrom. 2017, 52, 752–758. [Google Scholar] [CrossRef] [PubMed]
- Calvano, C.D.; Monopoli, A.; Cataldi, T.R.I.; Palmisano, F. MALDI matrices for low molecular weight compounds: An endless story? Anal. Bioanal. Chem. 2018, 410, 4015–4038. [Google Scholar] [CrossRef] [PubMed]
- Enomoto, H.; Sato, K.; Miyamoto, K.; Ohtsuka, A.; Yamane, H. Distribution Analysis of Anthocyanins, Sugars, and Organic Acids in Strawberry Fruits Using Matrix-Assisted Laser Desorption/Ionization-Imaging Mass Spectrometry. J. Agric. Food Chem. 2018, 66, 4958–4965. [Google Scholar] [CrossRef] [PubMed]
- Mechref, Y.; Novotny, M.V.; Krishnan, C. Structural Characterization of Oligosaccharides Using Maldi-TOF/TOF Tandem Mass Spectrometry. Anal. Chem. 2003, 75, 4895–4903. [Google Scholar] [CrossRef]
- Grant, D.C.; Helleur, R. Rapid screening of anthocyanins in berry samples by surfactant-mediated matrix-assisted laser desorption/ionization time-of-flight mass spectrometry. Rapid Commun. Mass Spectrom. 2007, 22, 156–164. [Google Scholar] [CrossRef] [Green Version]
- Morisasa, M.; Sato, T.; Kimura, K.; Mori, T.; Goto-Inoue, N. Application of Matrix-Assisted Laser Desorption/Ionization Mass Spectrometry Imaging for Food Analysis. Foods 2019, 8, 633. [Google Scholar] [CrossRef] [Green Version]
- Portychová, L.; Schug, K.A. Instrumentation and applications of electrochemistry coupled to mass spectrometry for studying xenobiotic metabolism: A review. Anal. Chim. Acta 2017, 993, 1–21. [Google Scholar] [CrossRef]
- Adams, K.L.; Puchades, M.A.; Ewing, A.G. In Vitro Electrochemistry of Biological Systems. Annu. Rev. Anal. Chem. 2008, 1, 329. [Google Scholar] [CrossRef] [PubMed] [Green Version]
- Szultka-Młyńska, M.; Buszewski, B. Electrochemical oxidation of selected immunosuppressants and identification of their oxidation products by means of liquid chromatography and tandem mass spectrometry (EC-HPLC-MS/MS). J. Pharm. Biomed. Anal. 2019, 176, 112799. [Google Scholar] [CrossRef] [PubMed]
- Szultka-Młyńska, M.; Bajkacz, S.; Kaca, M.; Baranowska, I.; Buszewski, B. Electrochemical simulation of three novel cardiovascular drugs phase I metabolism and development of a new method for determination of them by liquid chromatography coupled with tandem mass spectrometry. J. Chromatogr. B 2018, 100–112. [Google Scholar] [CrossRef]
- Bruins, A.P. An overview of electrochemistry combined with mass spectrometry. TrAC Trends Anal. Chem. 2015, 70, 14–19. [Google Scholar] [CrossRef]
- Potęga, A.; Garwolińska, D.; Nowicka, A.M.; Fau, M.; Kot-Wasik, A.; Mazerska, Z. Phase I and phase II metabolism simulation of antitumor-active 2-hydroxyacridinone with electrochemistry coupled on-line with mass spectrometry. Xenobiotica 2019, 49, 922–934. [Google Scholar] [CrossRef] [PubMed]
- Lecours, M.-A.; Eysseric, E.; Yargeau, V.; Lessard, J.; Brisard, G.; Segura, P.A. Electrochemistry-High Resolution Mass Spectrometry to Study Oxidation Products of Trimethoprim. Environments 2018, 5, 18. [Google Scholar] [CrossRef] [Green Version]
- Guo, Z.; Zhang, Q.; Zou, H.; Guo, B.; Ni, J. A Method for the Analysis of Low-Mass Molecules by MALDI-TOF Mass Spectrometry. Anal. Chem. 2002, 74, 1637–1641. [Google Scholar] [CrossRef]
- Thomas, M.P.; Mills, S.J.; Potter, B.V.L. ChemInform Abstract: The “Other” Inositols and Their Phosphates: Synthesis, Biology, and Medicine (with Recent Advances in myo-Inositol Chemistry). Angew. Chem. Int. Ed. 2016, 47, 1614–1650. [Google Scholar] [CrossRef]
- Harvey, D.J. Analysis of carbohydrates and glycoconjugates by matrix-assisted laser desorption/ionization mass spectrometry: An update for the period 2005–2006. Mass Spectrom. Rev. 2010, 30, 1–100. [Google Scholar] [CrossRef]
- Al-Suod, H.; Pomastowski, P.; Ligor, M.; Railean-Plugaru, V.; Buszewski, B. New approach for fast identification of cyclitols by MALDI-TOF mass spectrometry. Phytochem. Anal. 2018, 29, 528–537. [Google Scholar] [CrossRef]
- Gil, J.H.; Seo, J.; Kim, K.-J.; Jung, J.H.; Jung, O.-S.; Kim, M.-S.; Hong, J. Structural determination of cyclitol derivatives by fast-atom bombardment tandem mass spectrometry. Rapid Commun. Mass Spectrom. 2006, 20, 1253–1256. [Google Scholar] [CrossRef]
- Calvano, C.D.; Cataldi, T.R.I.; Kögel, J.F.; Monopoli, A.; Palmisano, F.; Sundermeyer, J. Structural Characterization of Neutral Saccharides by Negative Ion MALDI Mass Spectrometry Using a Superbasic Proton Sponge as Deprotonating Matrix. J. Am. Soc. Mass Spectrom. 2017, 28, 1666–1675. [Google Scholar] [CrossRef] [PubMed]
- He, Q.; Chen, S.; Wang, J.; Hou, J.; Wang, J.; Xiong, S.; Nie, Z. 1-Naphthylhydrazine hydrochloride: A new matrix for the quantification of glucose and homogentisic acid in real samples by MALDI-TOF MS. Clin. Chim. Acta 2013, 420, 94–98. [Google Scholar] [CrossRef] [PubMed]
- Bald, I.; Flosadottir, H.D.; Kopyra, J.; Illenberger, E.; Ingolfsson, O. Fragmentation of deprotonated d-ribose and d-fructose in MALDI—Comparison with dissociative electron attachment. Int. J. Mass Spectrom. 2009, 280, 190–197. [Google Scholar] [CrossRef]
- Erra-Balsells, R.; Nonami, H. UV-MALDI-TOF MS Analysis of Carbohydrates. Reviewing Comparative Studies Performed Using nor-Harmane and Classical UV-MALDI Matrices. Environ. Control. Biol. 2008, 46, 65–90. [Google Scholar] [CrossRef]


| Compounds | Fragment | m/z | Ionization | Proposed Reaction |
|---|---|---|---|---|
| D-pinitol | C7H6O5 | 172.1 | + | OH − 7H loss (dehydroxylation/dehydrogenation) |
| * C6H12O8 | 212.1 | + | CH3 loss − 2 OH gain (hydroxylation) | |
| C13H16O7 | 284.3 | + | CH3 loss − Benzaldehyde gain | |
| C13H17O10 | 333.0 | + | Cyclohexane + H2O + 3O gain (hydration/reduction) | |
| C13H16NaO9 | 339.0 | + | CH3 loss − DHB + Na gain (adduct with matrix and metal) | |
| C13H14O11 | 346.9 | + | Cyclohexane + 5O gain (reduction) | |
| C13H22O11 | 354.9 | + | Cyclohexane + 4OH + O gain (hydroxylation/reduction) | |
| C13H23NaO10 | 361.9 | + | D-pinitol + Na gain − OH − CH3 loss (dimerization/adduct with metal/dehydroxylation) | |
| C14H26O11 | 370.9 | + | D-pinitol gain (dimerization) | |
| C15H27O11 | 383.9 | + | D-pinitol + =CH2 gain (dimerization) | |
| C13H22NaO10 | 360.3 | − | D-pinitol + Na gain − OH − CH3 loss (dimerization/adduct with metal/dehydroxylation) | |
| C20H36O12 | 467.1 | − | D-pinitol + phenol gain (dimerization) | |
| C20H35NaO12 | 490.2 | − | D-pinitol + phenol + Na gain (dimerization/adduct with metal) | |
| C20H35NaO14 | 522.9 | − | D-pinitol + phenol + Na + 2OH gain (dimerization/adduct with metal/hydroxylation) | |
| C27H48O18 | 660.0 | − | 2D-pinitol + phenol + OH gain (dimerization/hydroxylation) | |
| L-chiro-inositol | C6H4O6 | 172.0 | + | 8H loss (dehydrogenation) |
| C6H8NaO6 | 199.0 | + | Na gain − 4H loss (adduct with metal/dehydrogenation) | |
| C13H16O7 | 284.3 | + | Benzaldehyde gain | |
| C13H17O9 | 317.0 | + | DHB gain (adduct with matrix) | |
| C13H15O10 | 331.0 | + | DHB + OH gain (adduct with matrix/hydroxylation) | |
| C13H16NaO9 | 339.0 | + | DHB + Na gain (adduct with matrix and metal) | |
| C13H7NaO10 | 346.9 | + | DHB + Na + OH gain − 10H loss (adduct with matrix and metal/hydroxylation/ dehydrogenation) | |
| C13H15NaO10 | 354.8 | + | DHB + Na + OH gain (adduct with matrix and metal/hydroxylation) | |
| C13H21NaO10 | 360.9 | + | DHB + Na + OH gain + 4H (adduct with matrix and metal/hydroxylation/hydrogenation) | |
| C14H26O11 | 370.9 | + | L-chiro-inositol + 2CH3 gain (dimerization) | |
| C13H21NaO11 | 376.9 | + | DHB + Na + 2OH gain − 4H (adduct with matrix and metal/hydroxylation/ dehydrogenation) | |
| C14H23O12 | 383.9 | + | L-chiro-inositol + C2H4 + =O gain (dimerization/reduction) | |
| * C6H10O6∙ | 178.8 | − | H loss (dehydrogenation) | |
| C12H15O6 | 255.9 | − | Benzene gain | |
| C12H15O7 | 271.9 | − | Benzene + OH gain (hydroxylation) | |
| C12H15O10 | 319.9 | − | Benzene + 4OH gain (hydroxylation) | |
| C18H31O13 | 455.9 | − | L-chiro-inositol + phenol + OH gain (dimerization/hydroxylation) | |
| C24H37O19 | 629.0 | − | 2L-chiro-inositol + phenol + 2O gain (dimerization/reduction) | |
| C24H41O20 | 649.0 | − | 2L-chiro-inositol + phenol + 3OH gain (dimerization/hydroxylation) | |
| Myo-inositol | C6H4O6 | 172.0 | + | 8H loss (dehydrogenation) |
| C6H8NaO6 | 199.0 | + | Na gain − 4H loss (adduct with metal/dehydrogenation) | |
| * C6H12O8 | 212.1 | + | 2OH gain (hydroxylation) | |
| C13H16O7 | 284.3 | + | Benzaldehyde gain | |
| C13H15O8 | 299.0 | + | Benzene + OH + C=O gain (hydroxylation/reduction) | |
| C13H12O10 | 328.9 | + | DHB + OH gain − 4H loss (hydroxylation/dehydrogenation) | |
| C12H19O11 | 339.0 | + | Cyclohexane + 2OH + =2O + H2O gain (hydroxylation/reduction/hydration) | |
| C13H7NaO10 | 346.9 | + | DHB + Na + OH gain − 10H loss (adduct with matrix and metal/hydroxylation/ dehydrogenation) | |
| C13H21NaO10 | 360.9 | + | DHB + Na + OH gain + 4H (adduct with matrix and metal/hydroxylation/ hydrogenation) | |
| C12H21O6 | 261.7 | − | Cyclohexane gain | |
| C12H21O10 | 325.5 | − | Cyclohexane + 4OH gain (hydroxylation) | |
| C18H31O13 | 455.2 | − | Myo-inositol + Cyclohexane + 2OH gain (dimerization/hydroxylation) | |
| C18H31O16 | 503.2 | − | 2Myo-inositol gain (dimerization) | |
| C24H40NaO18 | 639.0 | − | 2Myo-inositol + Cyclohexane + 2OH + Na gain (dimerization/hydroxylation/adduct with metal) | |
| C24H39Na2O18 | 661.0 | − | 2Myo-inositol + Cyclohexane + 2OH + 2Na gain (dimerization/hydroxylation/adduct with metal) | |
| D-glucose | * C7H13O6 | 193.0 | + | =CH2 gain |
| * C6H12O8 | 212.9 | + | 2OH gain (hydroxylation) | |
| C12H16O8 | 288.3 | + | Benzene + 2OH gain (hydroxylation) | |
| C12H22O9 | 310.0 | + | Cyclohexane + 3OH gain (hydroxylation) | |
| C12H22NaO8 | 317.0 | + | Cyclohexane + H2O + Na + O gain (hydration/adduct with metal/oxidation) | |
| C12H20NaO9 | 331.9 | + | Cyclohexane + H2O + Na + 2O gain (hydration/adduct with metal/oxidation) | |
| C13H23O10 | 339.0 | + | Cyclohexane + 3OH + H2O + CH2 gain (hydroxylation/hydration) | |
| * C7H13O8 | 225.0 | − | CH + 2OH gain (hydroxylation) | |
| C10H19O11 | 315.4 | − | D-glucose gain − 2CH2 (dimerization, cross-ring cleavage) | |
| C12H17O10 | 321.4 | − | D-glucose gain − OH − 3H loss (dimerization/dehydroxylation/dehydrogenation) | |
| C18H31O13 | 455.1 | − | D-glucose + Cyclohexane + 2OH gain (dimerization/hydroxylation) | |
| C24H31O21 | 655.9 | − | 3D-glucose gain − 10H loss (dimerization/dehydrogenation) | |
| C24H35O21 | 659.9 | − | 3D-glucose gain − 6H loss (dimerization/dehydrogenation) | |
| C24H41O21 | 665.9 | − | 3D-glucose gain (dimerization) | |
| D-fructose | * C6H8O3 | 128.1 | + | 3OH − 4H loss (dehydroxylation /dehydrogenation) |
| C6H4O6 | 172.0 | + | 8H loss (dehydrogenation) | |
| * C7H13O6 | 193.0 | + | CH2 gain | |
| C10H18O7 | 250.9 | + | Tetrahydrofuran gain | |
| C11H20O7 | 264.0 | + | Tetrahydrofuran + CH3 gain | |
| C11H20O8 | 280.0 | + | Tetrahydrofuran + CH2OH gain | |
| C11H20O9 | 296.0 | + | Tetrahydrofuran + CH2OH + OH gain (hydroxylation) | |
| C12H18O11 | 338.0 | + | D-fructose gain − 4H loss (dimerization/dehydrogenation) | |
| C12H18O13 | 370.9 | + | D-fructose + 2OH gain − 4H loss (dimerization/hydroxylation/dehydrogenation) | |
| C17H29O13 | 441.2 | − | 3D-fructose gain − 3OH − C loss (dimerization/dehydroxylation) | |
| C17H29O14 | 457.1 | − | 3D-fructose gain − 2OH − C loss (dimerization/dehydroxylation) | |
| C18H27O15 | 483.1 | − | 3D-fructose gain − OH − 4H loss (dimerization/dehydroxylation/dehydrogenation) | |
| C23H38NaO18 | 625.0 | − | 4D-fructose + Na gain − 3OH − CH2 loss (dimerization/adduct with metal/ dehydroxylation) | |
| C24H38NaO19 | 653.0 | − | 4D-fructose + Na gain − 2OH loss (dimerization/adduct with metal/ dehydroxylation) | |
| C24H37O21 | 661.9 | − | 4D-fructose gain − 4H loss (dimerization/ dehydrogenation) | |
| D-galactose | C6H4O6 | 172.0 | + | 8H loss (dehydrogenation) |
| C12H22O6 | 262.0 | + | Cyclohexane gain | |
| C12H18O8 | 284.3 | + | Benzene + 2OH gain − 10H loss (hydroxylation/dehydrogenation) | |
| C12H22O8 | 294.0 | + | Cyclohexane + 2OH gain (hydroxylation) | |
| C12H22O9 | 310.0 | + | Cyclohexane + 3OH gain (hydroxylation) | |
| C12H20NaO9 | 331.0 | + | Cyclohexane + H2O + Na + O gain (hydration/adduct with metal/reduction) | |
| C13H23O10 | 339.0 | + | Cyclohexane + 3OH + H2O + CH2 gain (hydroxylation/hydration) | |
| * C9H13O7 | 233.8 | − | C3HOH gain | |
| * C10H19O7 | 251.7 | − | C4H7OH gain (cross-ring cleavage) | |
| C12H17O10 | 321.3 | − | D-galactose gain − OH − 4H loss (dimerization/dehydroxylation/dehydrogenation) | |
| C12H12NaO12 | 371.3 | − | D-galactose + Na + O gain − 6H loss (dimerization/adduct with metal/reduction/ dehydrogenation) | |
| C18H31O13 | 455.2 | − | D-galactose + Cyclohexane + 2OH gain (dimerization/hydroxylation) | |
| C18H32O14 | 472.2 | − | D-galactose + Cyclohexane + 3OH gain (dimerization/hydroxylation) | |
| C24H31O21 | 655.1 | − | 3D-galactose gain − 10H loss (dimerization/dehydrogenation) | |
| C24H37O21 | 661.1 | − | 3D-galactose gain − 4H loss (dimerization/dehydrogenation) | |
| C24H41O21 | 665.0 | − | 3D-galactose gain (dimerization) |
© 2020 by the authors. Licensee MDPI, Basel, Switzerland. This article is an open access article distributed under the terms and conditions of the Creative Commons Attribution (CC BY) license (http://creativecommons.org/licenses/by/4.0/).
Share and Cite
Sagandykova, G.; Walczak-Skierska, J.; Monedeiro, F.; Pomastowski, P.; Buszewski, B. New Methodology for the Identification of Metabolites of Saccharides and Cyclitols by Off-Line EC-MALDI-TOF-MS. Int. J. Mol. Sci. 2020, 21, 5265. https://0-doi-org.brum.beds.ac.uk/10.3390/ijms21155265
Sagandykova G, Walczak-Skierska J, Monedeiro F, Pomastowski P, Buszewski B. New Methodology for the Identification of Metabolites of Saccharides and Cyclitols by Off-Line EC-MALDI-TOF-MS. International Journal of Molecular Sciences. 2020; 21(15):5265. https://0-doi-org.brum.beds.ac.uk/10.3390/ijms21155265
Chicago/Turabian StyleSagandykova, Gulyaim, Justyna Walczak-Skierska, Fernanda Monedeiro, Paweł Pomastowski, and Bogusław Buszewski. 2020. "New Methodology for the Identification of Metabolites of Saccharides and Cyclitols by Off-Line EC-MALDI-TOF-MS" International Journal of Molecular Sciences 21, no. 15: 5265. https://0-doi-org.brum.beds.ac.uk/10.3390/ijms21155265