1. Introduction
The presence of senile plaques made by amyloid-β (Aβ) fibrils in the brain is one of the hallmarks of the Alzheimer’s disease [
1,
2,
3]. Aβ fibrils are composed by monomers of 40–42 amino acids that, under normal conditions, have an unfolded and disordered structure without toxic effects. However, under pathological conditions, the Aβ monomers self-associate to form larger aggregates such as oligomers and fibrils. The self-aggregation process is composed by several steps, of which the first step is the primary nucleation. At the beginning, the disordered monomers fold themselves into nuclei, i.e., aggregates where the monomer addiction is faster than its dissociation with a consequent growth in size and length, which is called elongation [
4]. However, these oligomers are temporary, and they undergo to other aggregation steps that result in larger and longer fibrils. One of the most promising way to treat Alzheimer’s is to inhibit the first aggregation step using natural compounds [
5,
6]. The aggregation pathway of aberrant proteins and the mechanism to inhibit the aggregation are of fundamental importance to the development of more effective drugs [
7].
One of the promising approaches is to inhibit the amyloid folding before the formation of β-sheet-rich aggregates characteristic of mature folded amyloids.
In the last years, epidemiological studies on the effects of the diet against AD and dementia suggested that the high intake of flavonoids and polyphenols found in fruits and vegetables [
8], such as in the Mediterranean diet, reduces the risk of AD and cognitive impairments [
9,
10]. Several natural molecules have been identified to promote cognitive health and to interfere with the amyloidogenic activity in AD [
11,
12].
A detailed knowledge of how natural compounds interact with Aβ fibrils is a prerequisite for the rationalization of their antiaggregating activity. Unfortunately, despite intensive research, the experimental characterization remains a great challenge.
Computer simulations have been extensively used to provide atomistic-level information on the molecular mechanisms of the interaction of the amyloid oligomer with ligands [
7,
13,
14].
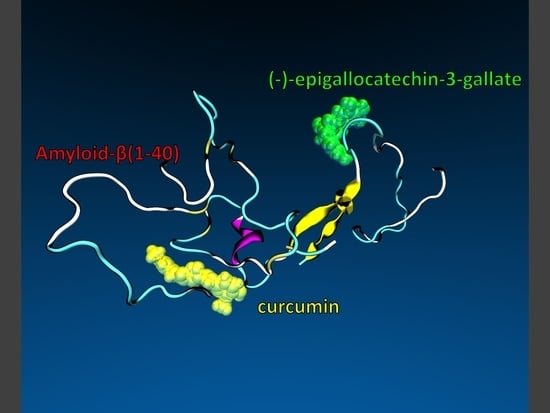
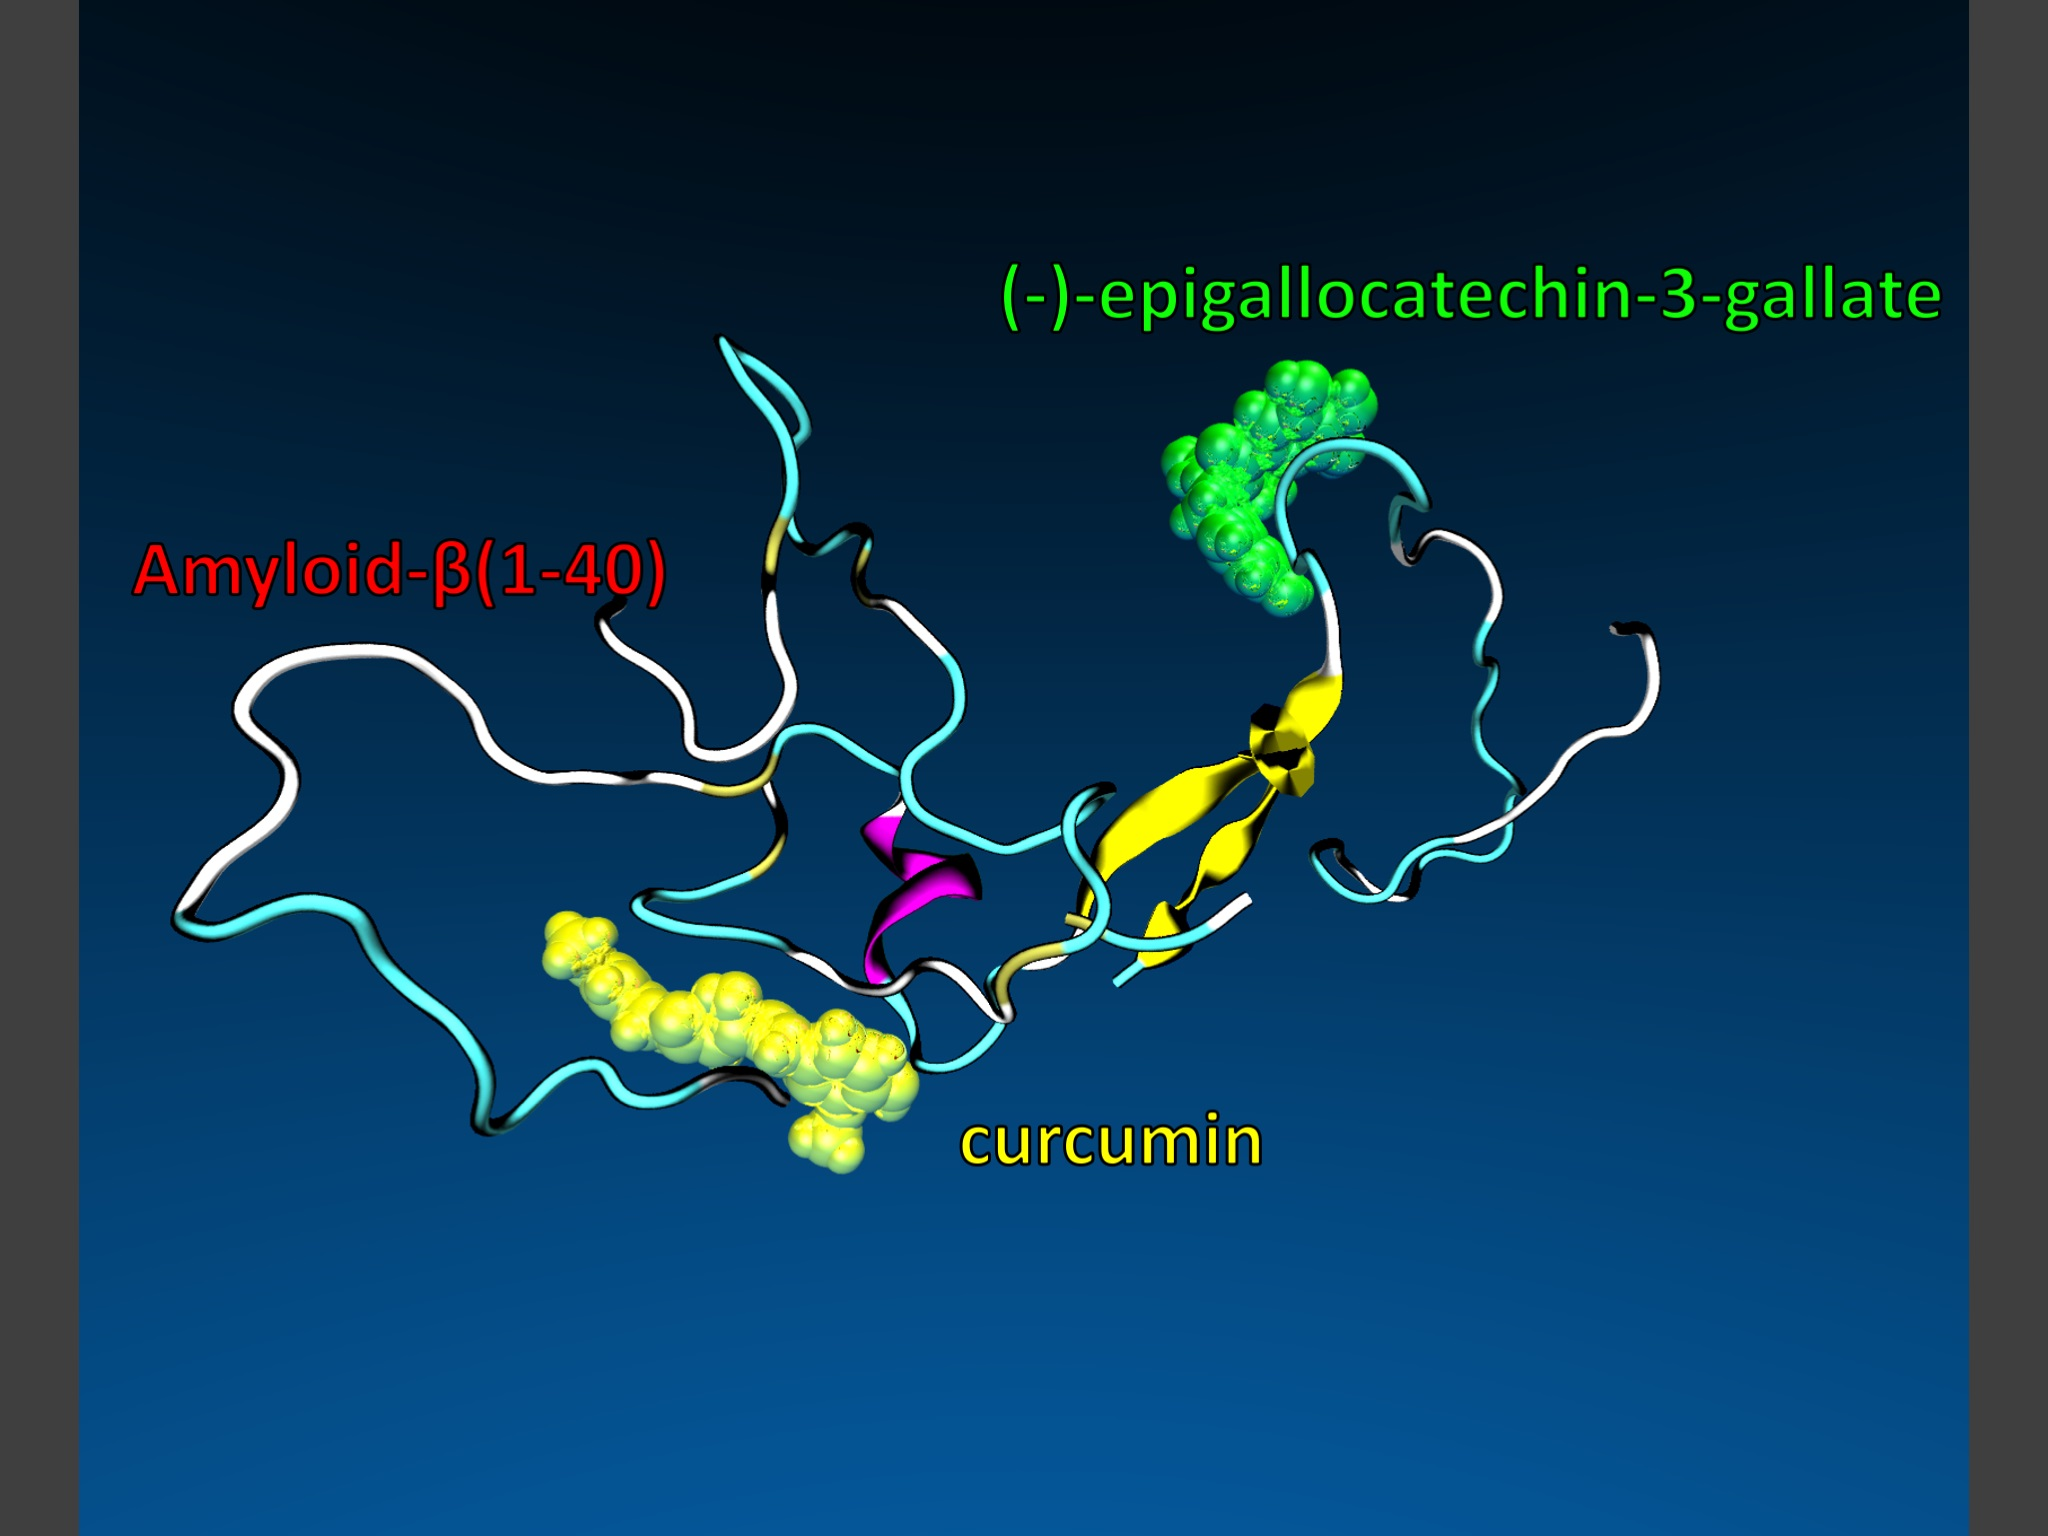
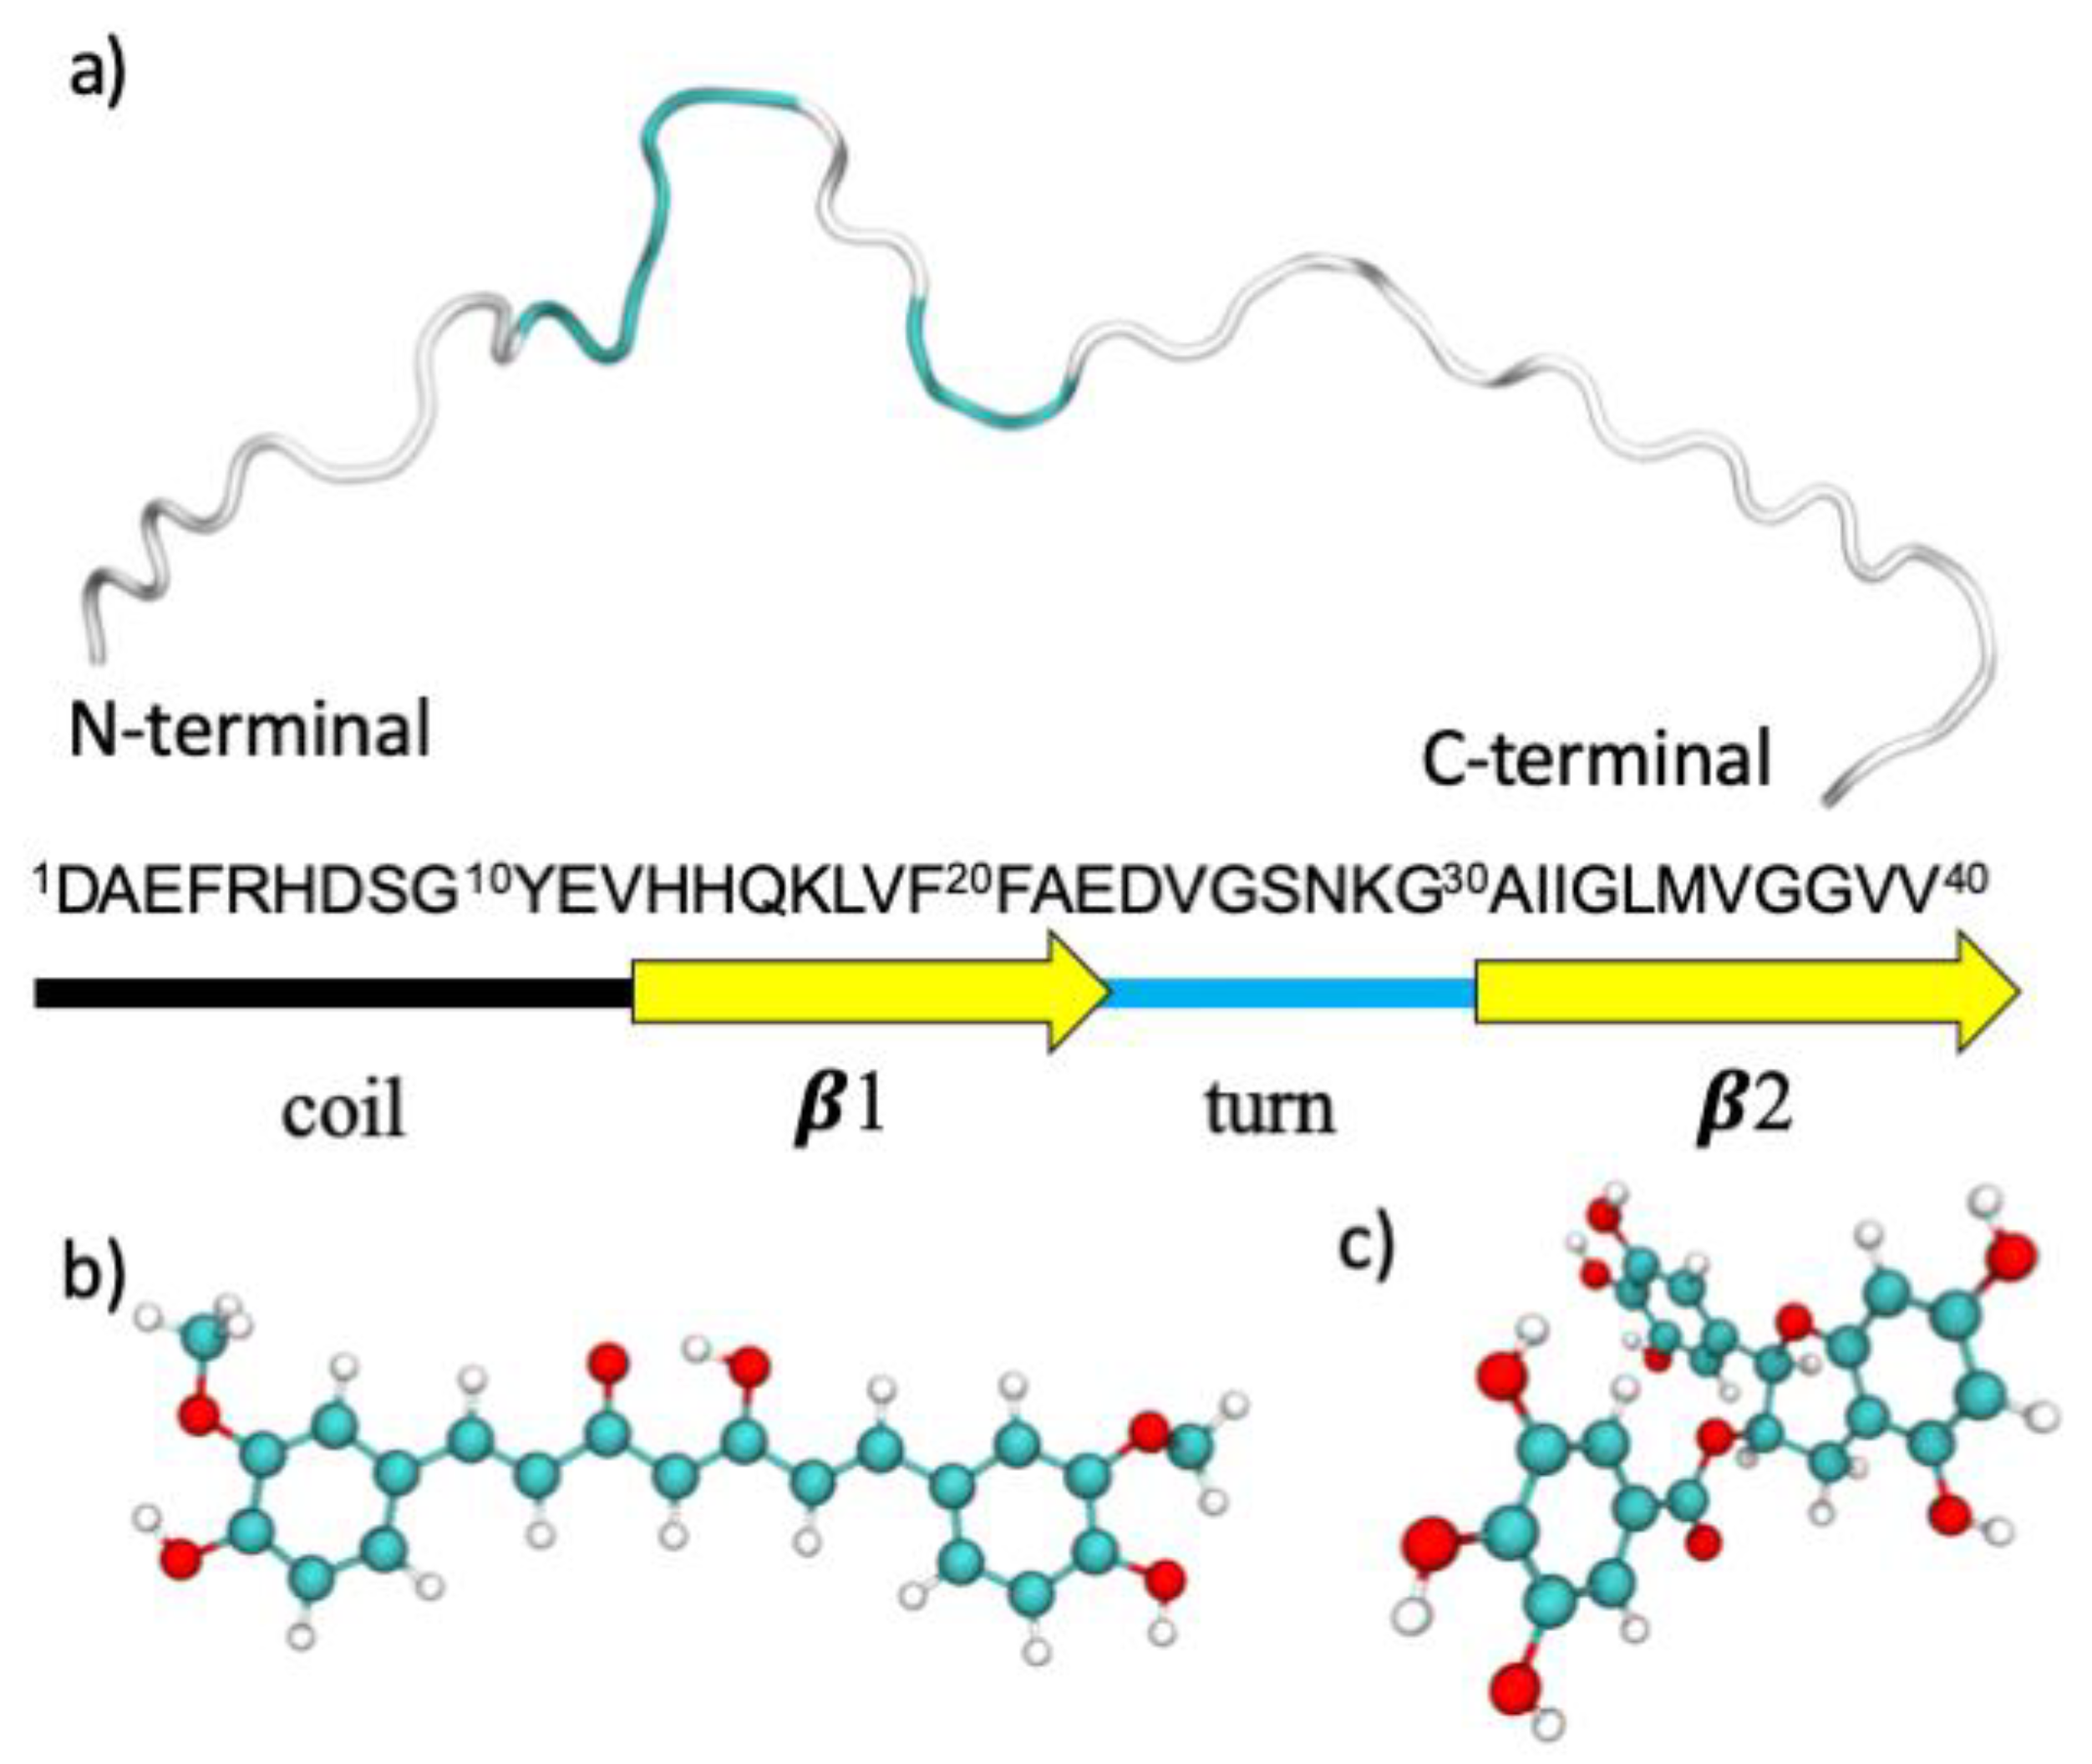
In this study, the effect of some natural compounds on the early step of Aβ(1–40) fibril nucleation will be studied at the atomic level by means of molecular simulations. Two widely studied molecules with known anti-amyloidogenic activity have been chosen. Curcumin (CUR) is a well-known bio phenol, found in the rhizome of turmeric (
Curcuma longa), with anti-inflammatory and antioxidants activity, and recently, it has been demonstrated that it is able to bind to small amyloid-protofibrils and to block the aggregation and formation of fibrils in vitro and in vivo [
5,
8]. (–)-epigallocatechin-3-gallate (EGCG) is a flavonoid, found in green tea (
Camellia sinensis), with the inhibition of α-synuclein and Aβ fibrillogenesis [
15,
16]. At the best of our knowledge, this is the first study on the interaction of the full-length unfolded Aβ(1–40) fibril in interactions with CUR and EGCG at different fibril/ligand ratios performed by extensive replica exchange solute tempering molecular dynamics simulations in an explicit solvent.
2. Results
2.1. Structural Analysis of Monomers in the Solution
2.1.1. Secondary Structures
Starting from the unstructured Aβ(1–40) monomeric unit, the time evolution of the secondary structures for monomeric, dimeric and trimeric peptides has been followed during the interval 100–800 ns of replica exchange solute tempering (REST) simulations. In general, the formation of α-helix and β-strands localized in different regions of the Aβ monomers can be observed after 10–20 ns (see
Figure S1).
A more detailed analysis is provided by the secondary structure propensity for each amino acid of the Aβ monomers in water solution and has been computed for the Aβ monomeric, dimeric or trimeric models.
2.1.2. Aβ Monomeric Model
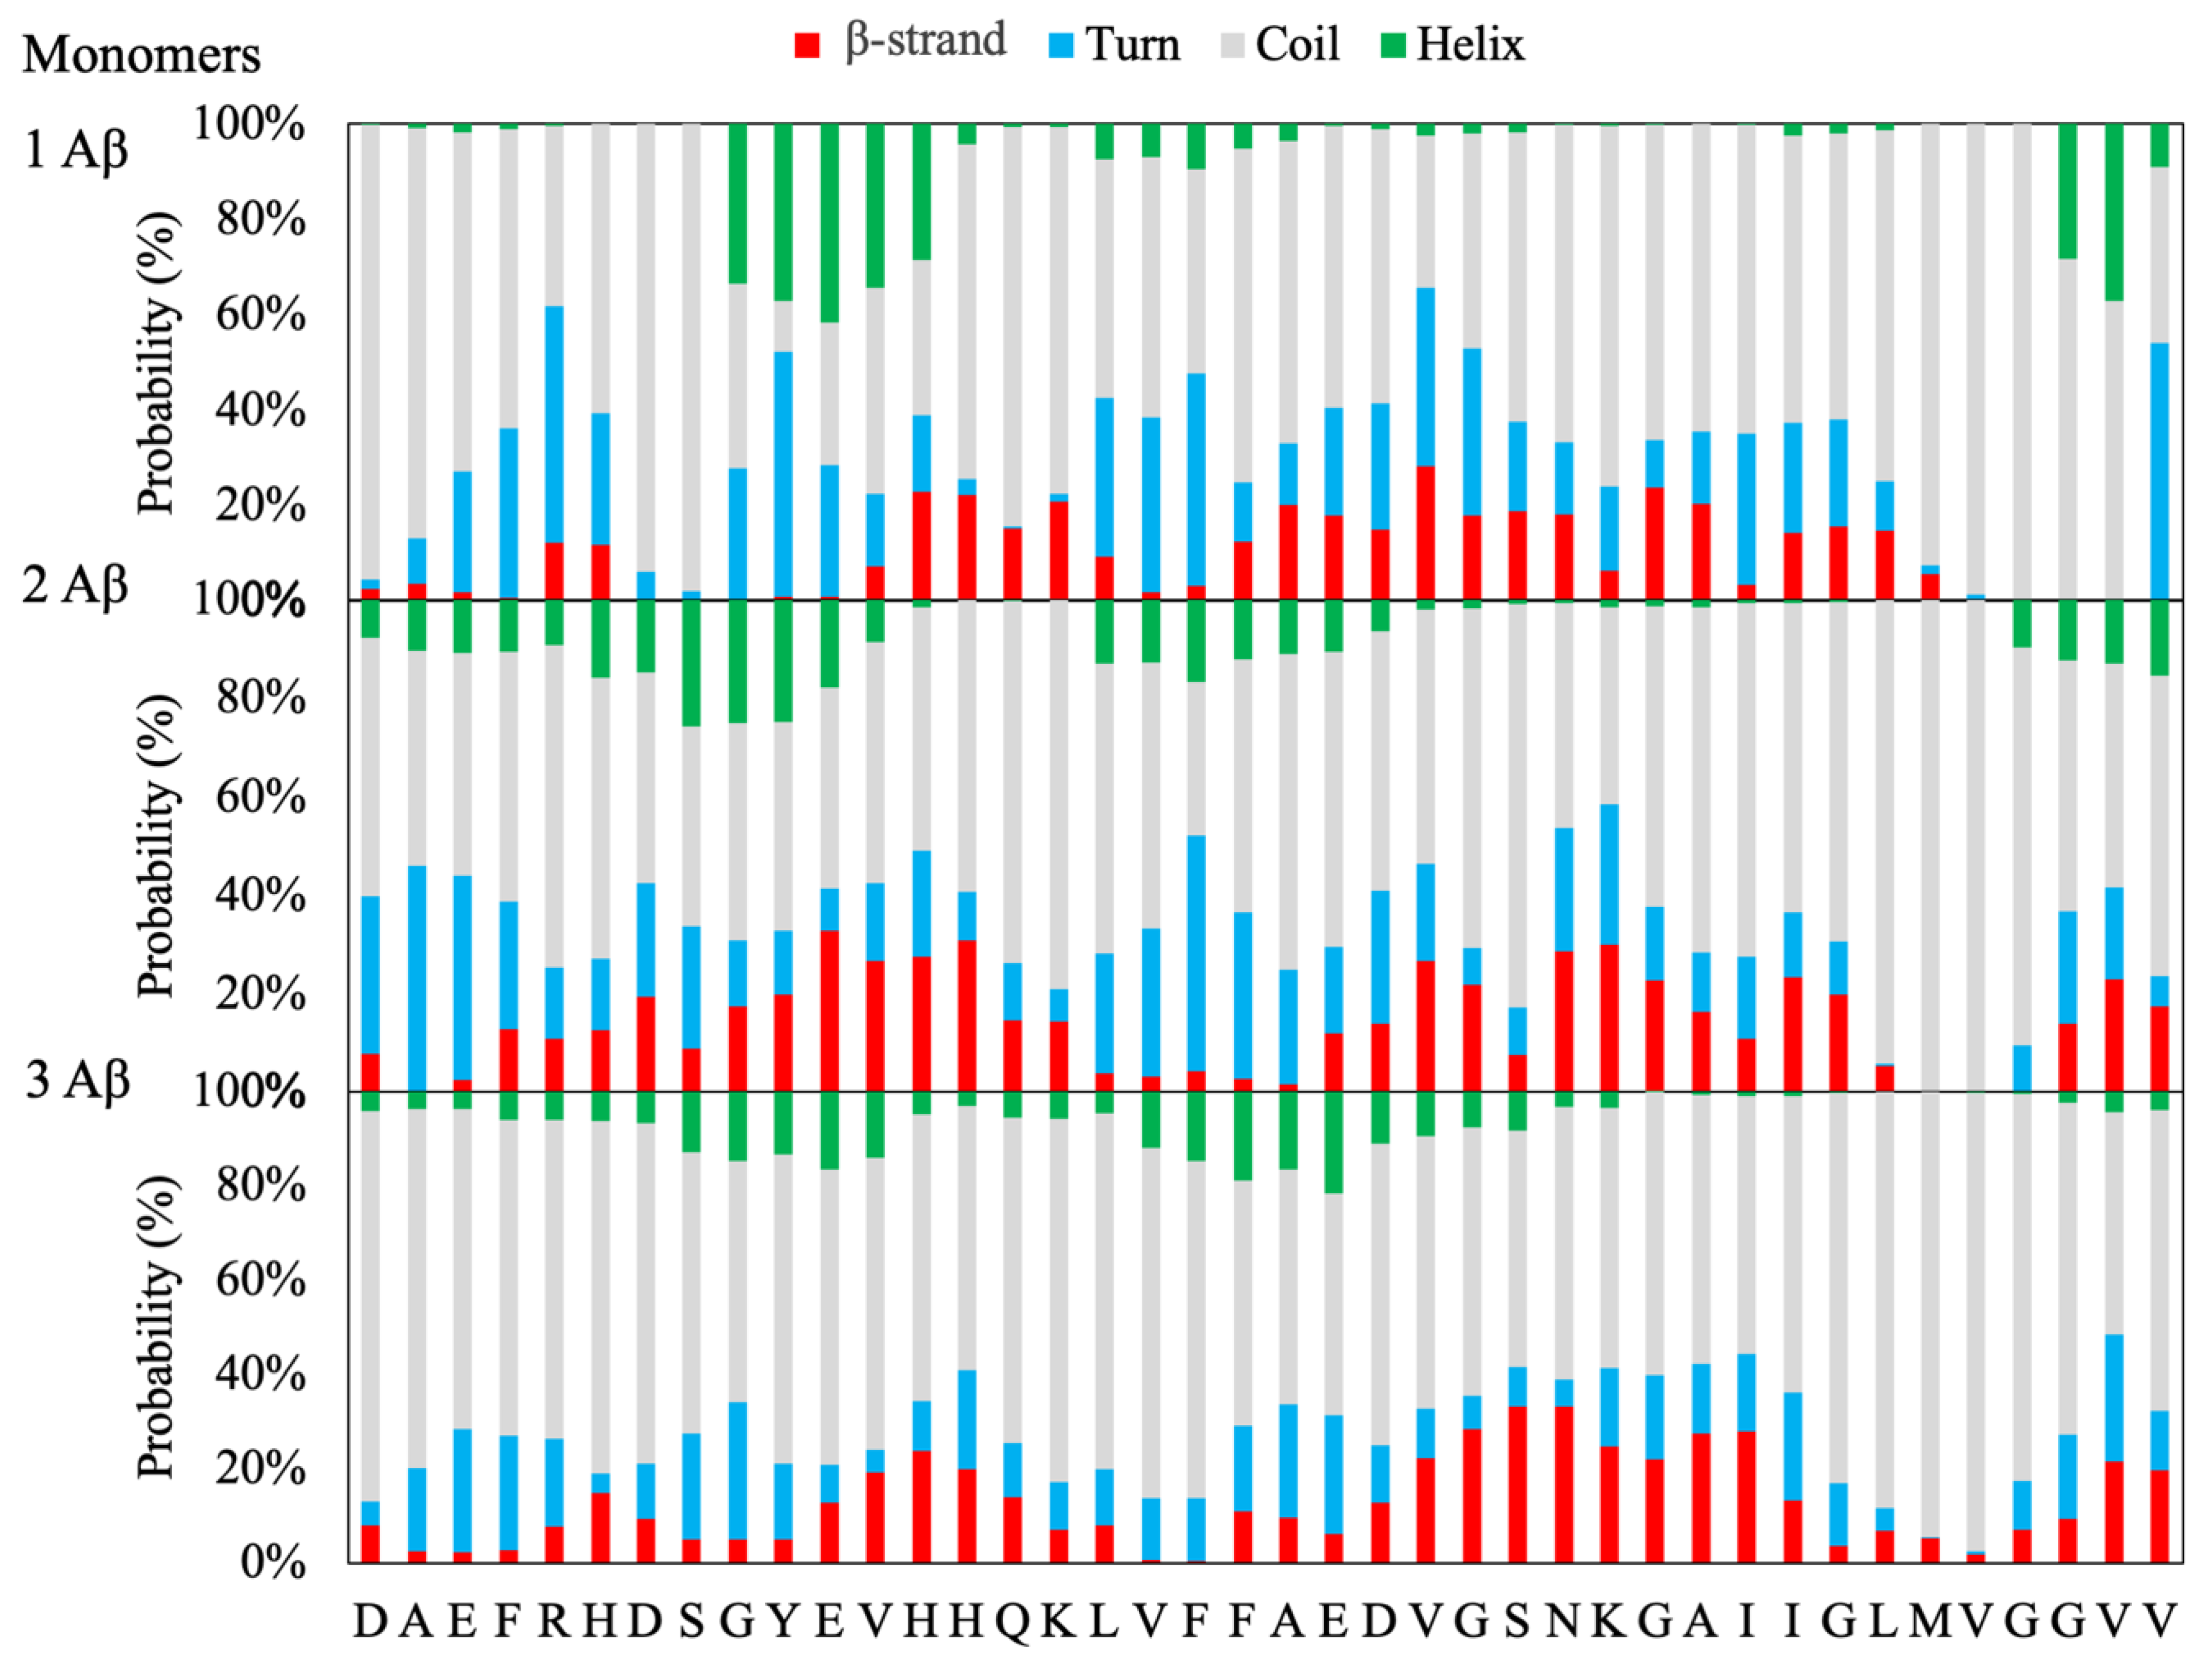
The results of the REST simulation for the Aβ monomeric model (
Figure 1) show a preference for the
9GYEVHH
14 stretch of amino acids to fold in a helix structure (helical propensity around 40%) in substantial agreement with the NMR structure of the Aβ-(1–42) peptide in a water solution in which the helix spans the whole stretch from Tyr10 to Asp22 [
17]. In addition, a moderate strand propensity of around 20% for the single Aβ monomer is observed for the stretch of amino acids
13HHQK
16 and D22–L34. A central role as a promoter of β conformational transition has been recently recognized for the 25–35 sequence, as a function of the polarity of the environment [
18]. It is worth recalling that mature Aβ fibrils have a common structure characterized by a β-sheet formed by two antiparallel β-strands located at residues
15QKLVFFA
21 and
30AIIGLMVGGV
39, while the amino acids close to the N-terminal are unfolded [
19,
20,
21,
22] (see the Methods section). Therefore, in view of the observed secondary structure propensity, the
13HHQK
16 and D22–L34 stretch of amino acids may be considered to constitute peptide regions that seed the conformational transitions to the characteristic β-folding.
2.1.3. Aβ Dimeric and Trimeric Models
Interestingly, by increasing the number of peptides in the simulation box, a significant increase of the β-strands propensity, both in terms of the number of amino acids and probability, is observed at the expenses of the helical propensity, which decreases dramatically for the dimeric model and almost disappears in the trimeric model (
Figure 1). Moreover, a shift of the two putative β-strands towards the N-terminal (
9GYEVHHQ
15) and C-terminals (
24VGSNKGAII
32) is observed. This behavior supports the hypothesis that the increased number of monomeric peptides in solution results in the formation of β-rich structures similar to that of the mature fibril [
22,
23].
2.1.4. Aβ Monomeric, Dimeric and Trimeric Models with Ligands
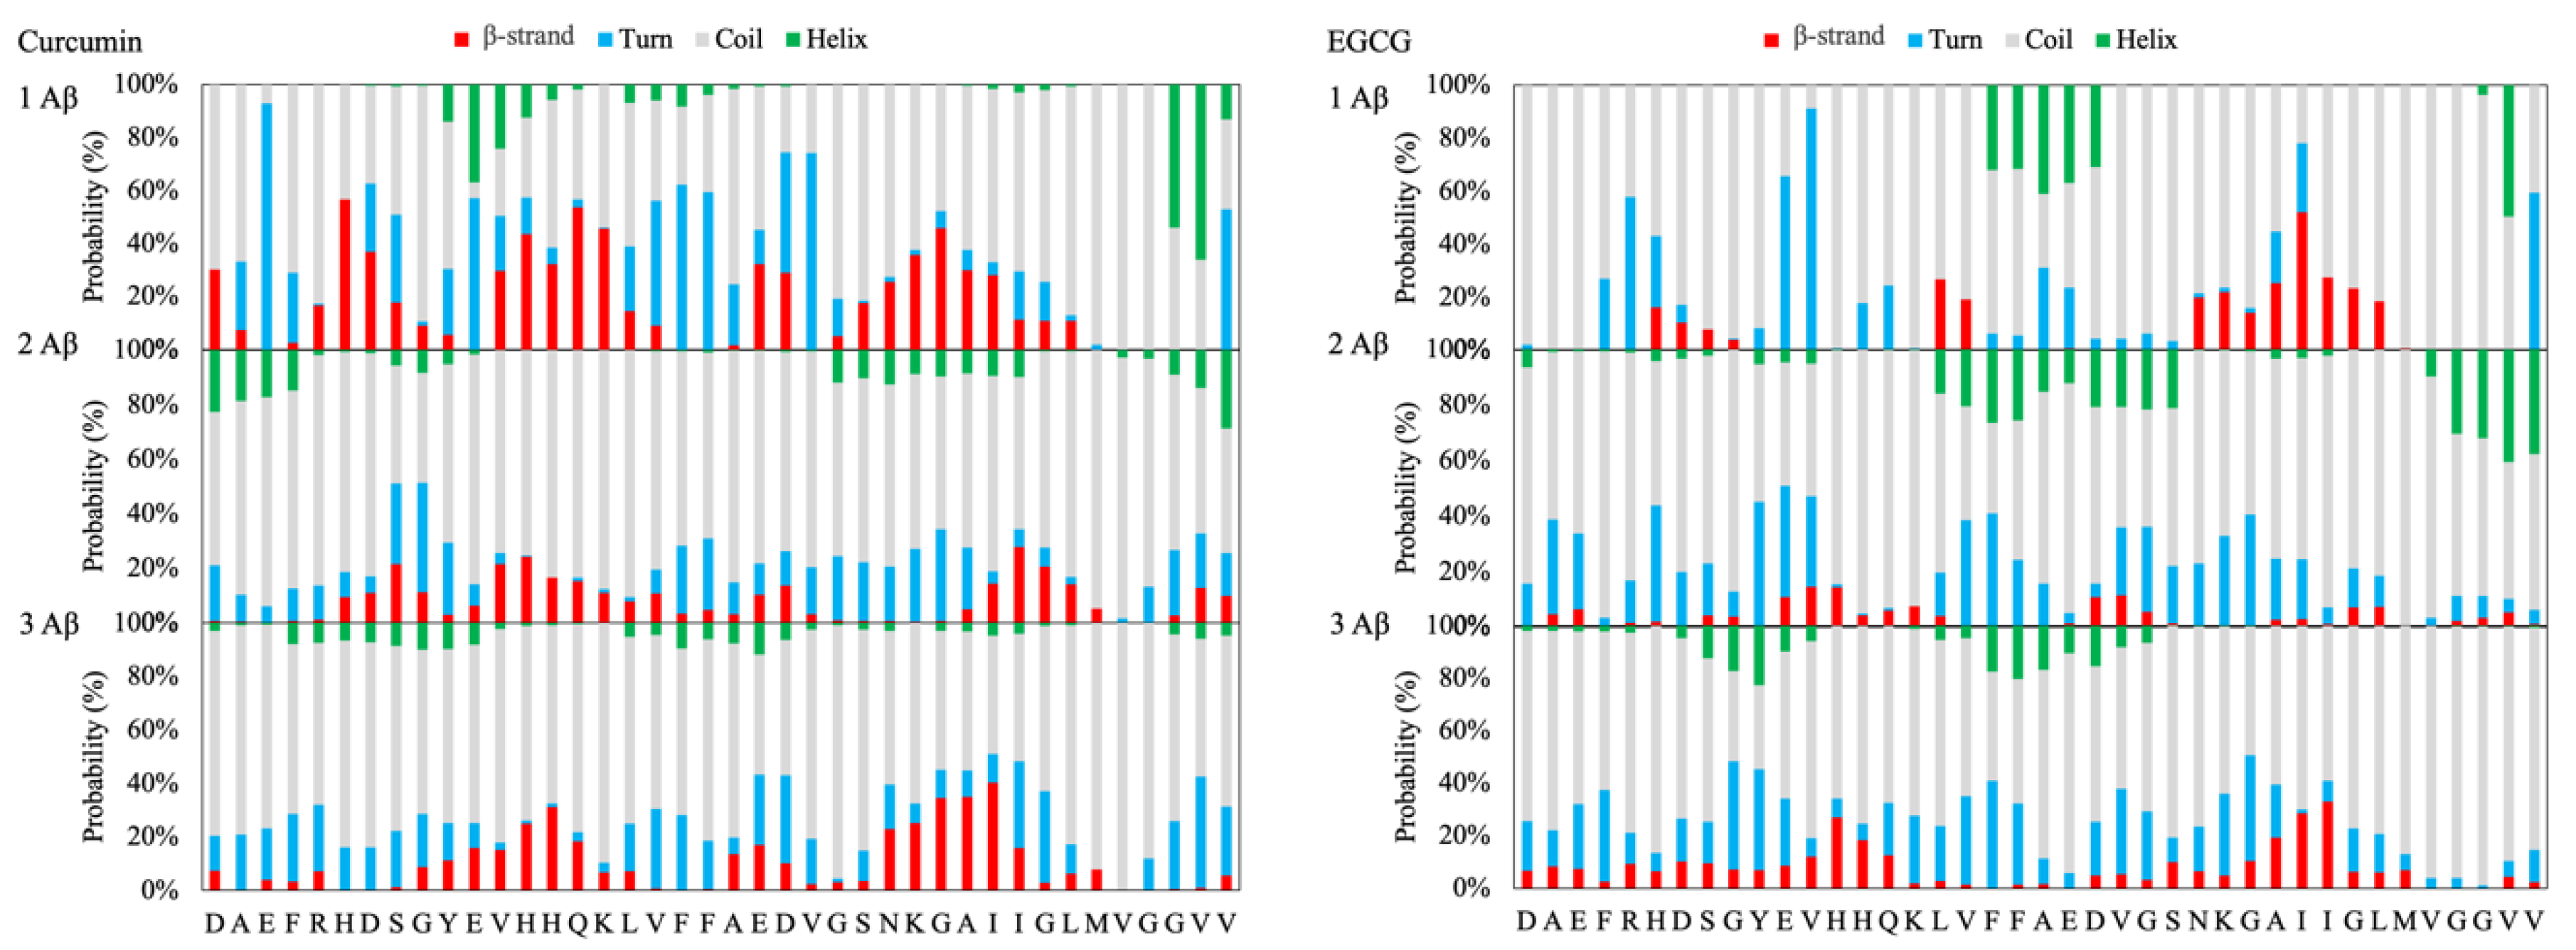
The insertion of CUR in the simulation box has a significative influence on the folding of the Aβ peptides. In fact, a substantial decrease in the propensity of the monomeric peptide to adopt an α-helix conformation is observed (see
Figure S2). Moreover, the increasing of the number of monomers and ligands in the simulation boxes results in a dramatic reduction in the propensity of both strands and helices in favor of random coil, as shown in
Figure 2 and in the
Supplementary Information.
In the case of EGCG, the strand’s propensity is consistently lowered and is observed almost only in the region
27KGAIIGLM
35 for the monomeric model, while there is a slight tendency to form a helix-turn in the region
19FFAED
23 (see
Figure 2 and
Figure S3), which, in mature fibrils, corresponds to the end of the β-1 β-strand and the beginning of the turn connecting to the β-1 and β-2 β-strands. These findings agree with the results of a structural characterization of EGCG-induced Aβ oligomers employing solution states and magic angle spinning (MAS) solid-state NMR techniques, which showed that the C-terminal part of the Aβ peptide (residues 22–39) adopts a β-sheet conformation, whereas the N-terminus (residues 1–20) is unstructured [
24].
In summary, the results support the hypothesis that both CUR and EGCG reduce the formation of the β-strand structure’s characteristics of mature Aβ(1–40) fibrils (see
Figures S4–S9).
2.1.5. Radius of Gyration
The radius of gyration (R
g) for Aβ monomers in a solution gives an estimation of the compactness of the protein. According to Kolinski and Skolnick [
25], the mean squared radius of gyration <
Rg> for single domain globular proteins is given by: <
Rg> = 0.22
n0.38, where n is the number of residues. Therefore, for a globular protein of 40 amino acid residues, a Rg of 0.89 nm should be expected. Higher values correspond to more extended structures.
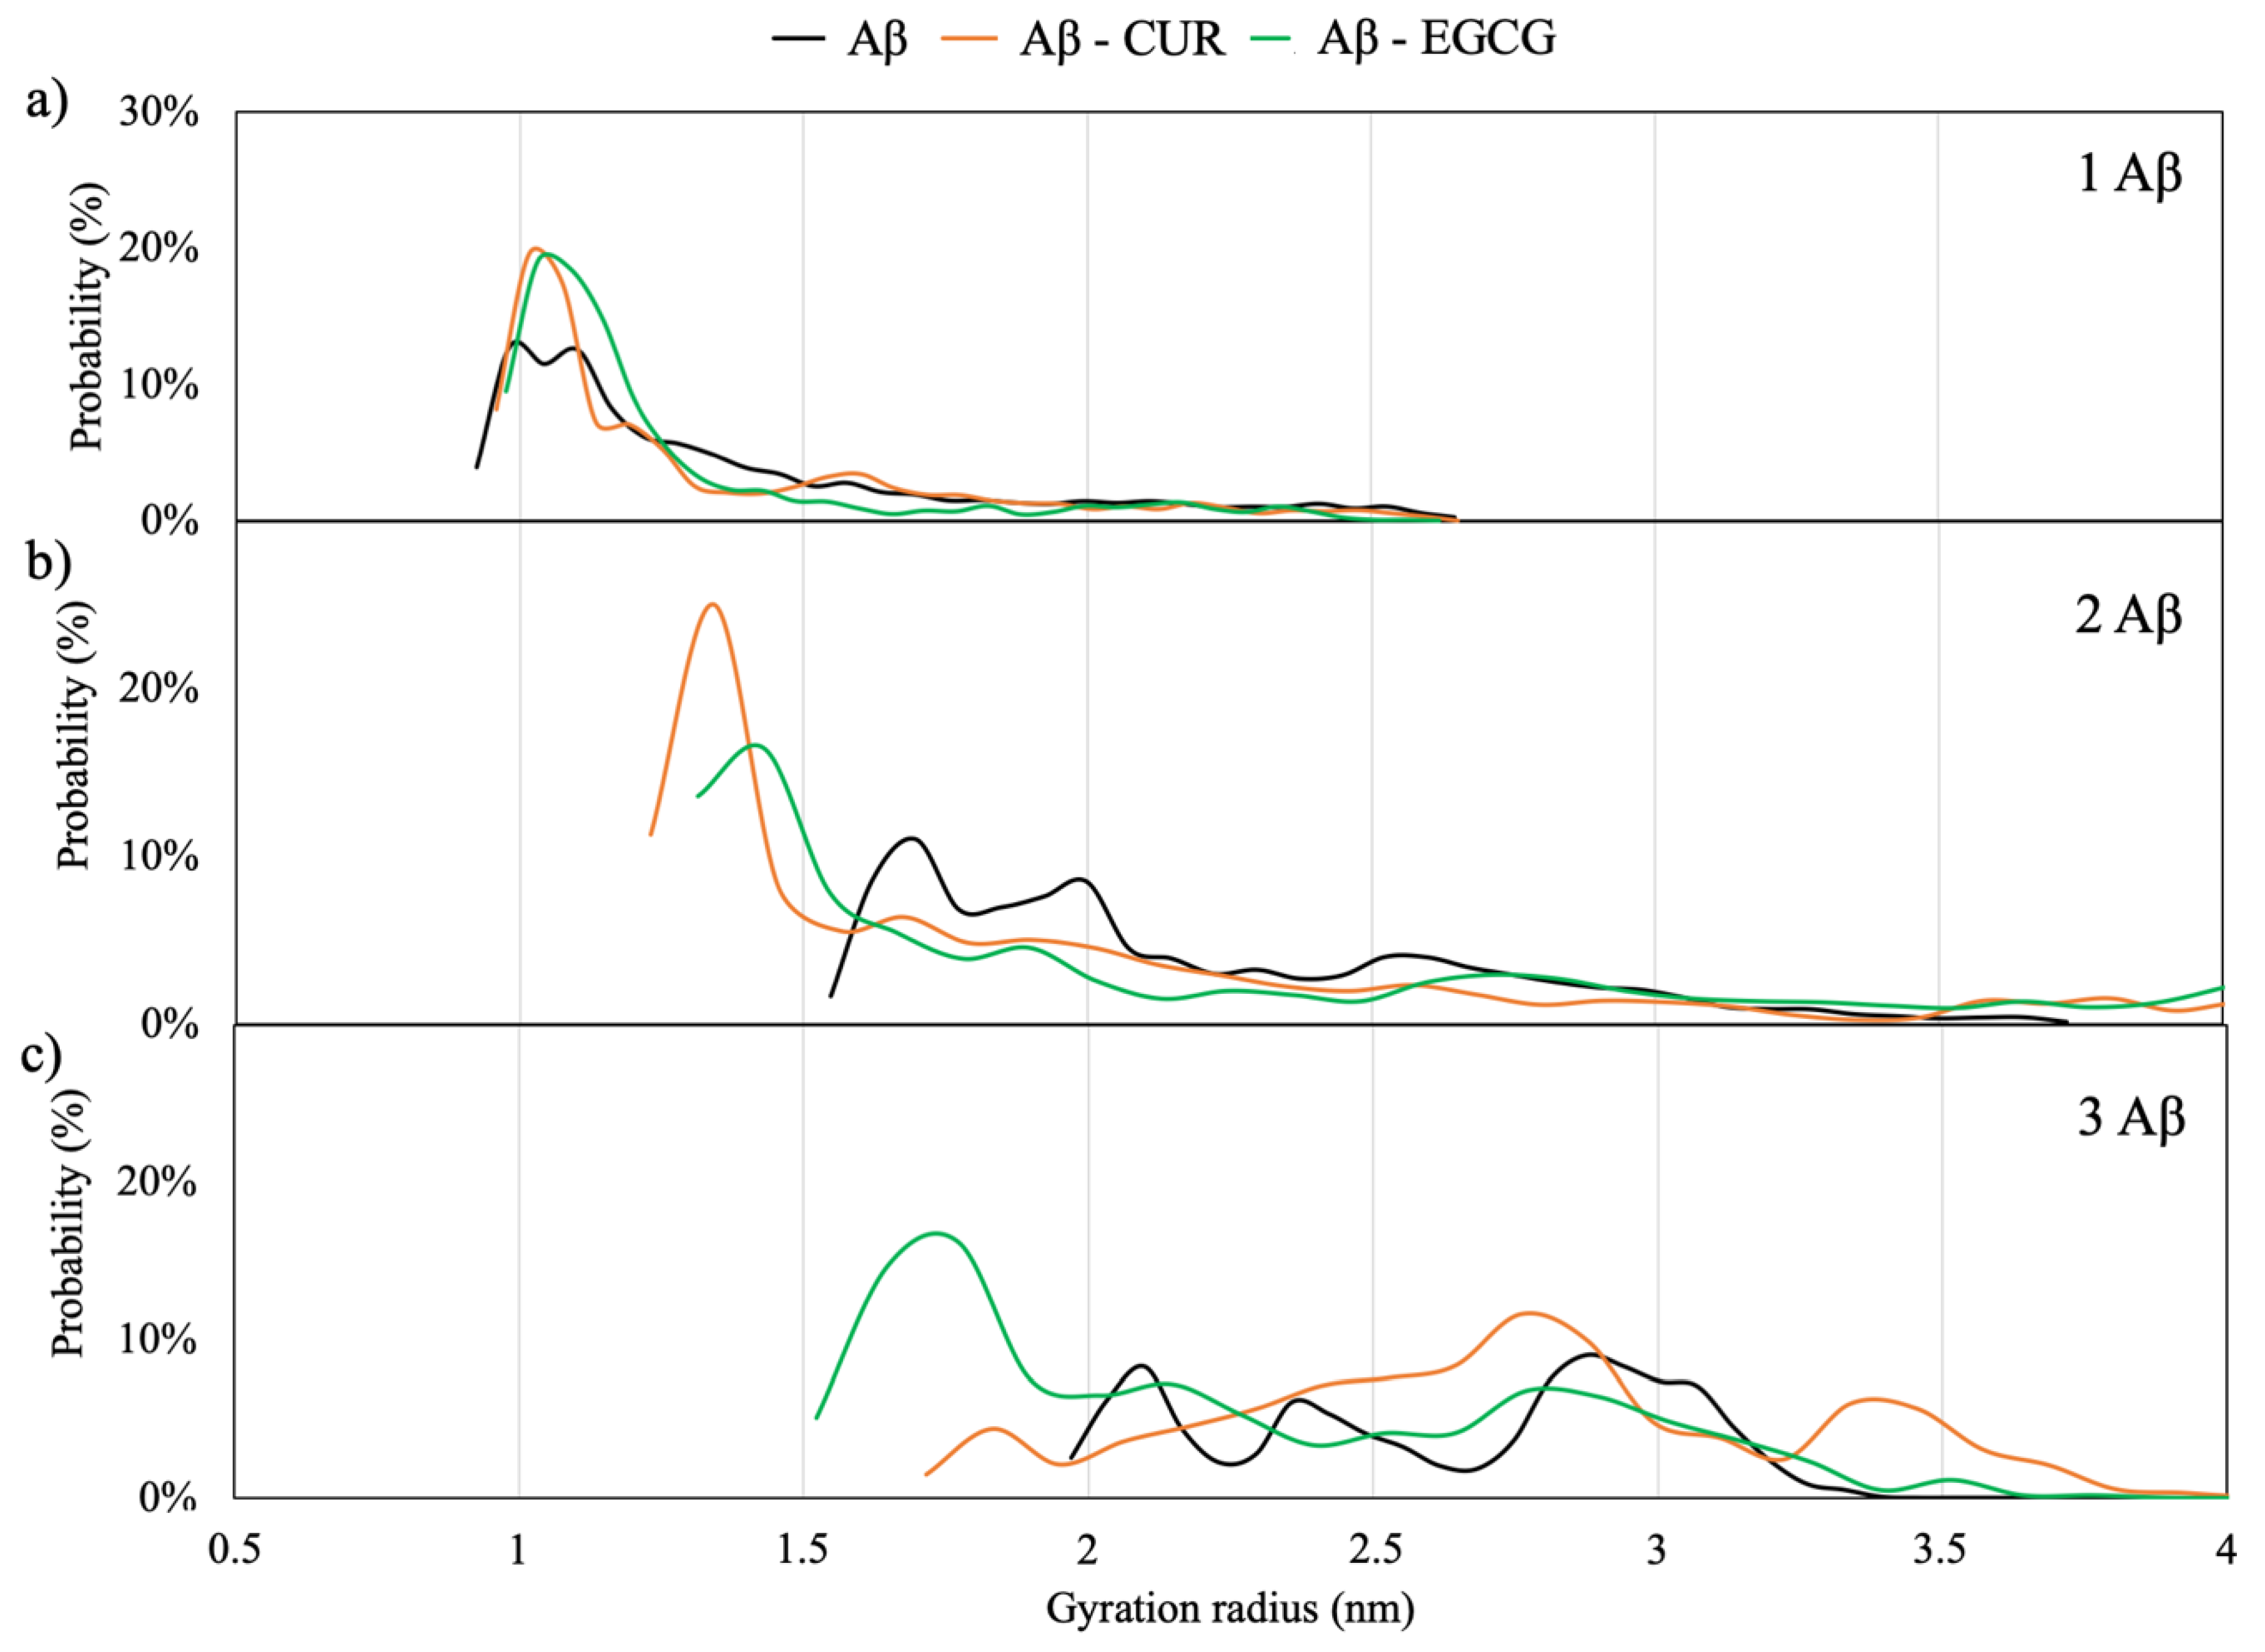
Figure 3 shows the probability distribution of R
g for the Aβ monomers in the solution and the effects of EGCG and CUR additions on the distribution. It can be observed that the single Aβ monomer adopts a radius of gyration from 0.9–1.2 nm characteristic of a collapsed, almost globular, protein. This value well agrees with single-molecule-level fluorescence values for monomeric Aβ42 (Rg 0.9 ± 0.1 nm) peptides [
26]. The almost spherical aggregation of the monomers is enhanced by the presence of the two ligands.
By increasing the number of Aβ monomers, the maximum in the R
g distribution is shifted to higher values, corresponding to a more extended structure, of 1.7 nm for the dimeric model and 2–3 nm for the trimeric model, in agreement with the values of 1.5–2.3 nm found for small oligomers by means of a fluorescence correlation spectroscopy of wild-type and mutated Aβ40 peptides [
27]. The elongation of the structures is in-line with the first step of the self-aggregation process of the Aβ monomers, called primary nucleation, proposed by Arosio et al. [
4]. Interestingly, the insertion of CUR and EGCG in the simulation box of the dimeric and trimeric peptides shifts the maximum in the R
g distribution to lower values corresponding to about 1.4 nm and 1.7 nm, respectively. The ability of EGCG to convert Aβ fibrils into small spherical oligomers has been also demonstrated by means of NMR [
16,
26] and combined electron microscopy, circular dichroism and thioflavin T-binding assay studies [
15]. Indeed, the profile of the R
g distribution for the CUR and EGCG-trimeric Aβ peptide indicates that CUR has a smaller influence on the monomer’s elongation with respect to EGCG.
2.2. Intra-and Inter-Monomer Contacts
2.2.1. Intra-Monomer Contacts
Specific interactions between amino acids of the Aβ (1–40) and Aβ (1–42) monomers have been identified by means of low-resolution solid–state NMR, site-specific mutagenesis studies, electron paramagnetic resonance data, tip-enhanced Raman spectroscopy and other experimental techniques. These interactions are achieved during the intermediate steps of monomer folding and are considered to act as seminal internal constraints for amyloid formation [
13,
28].
In particular, the salt bridge between the amino acid residues D23 and K28 stabilizes the turn that builds the cross-β structure [
21,
28,
29], and the hydrophobic contact between F19 and L34 are considered to constitute the first interaction between the two hydrophobic stretches of amino acids that build the β structure in mature fibrils [
30,
31,
32].
Therefore, though the Aβ peptides adopt highly heterogeneous ensembles, monitoring the trajectories of these couple of amino acids during dynamics enables considerations on the correct folding process to be done.
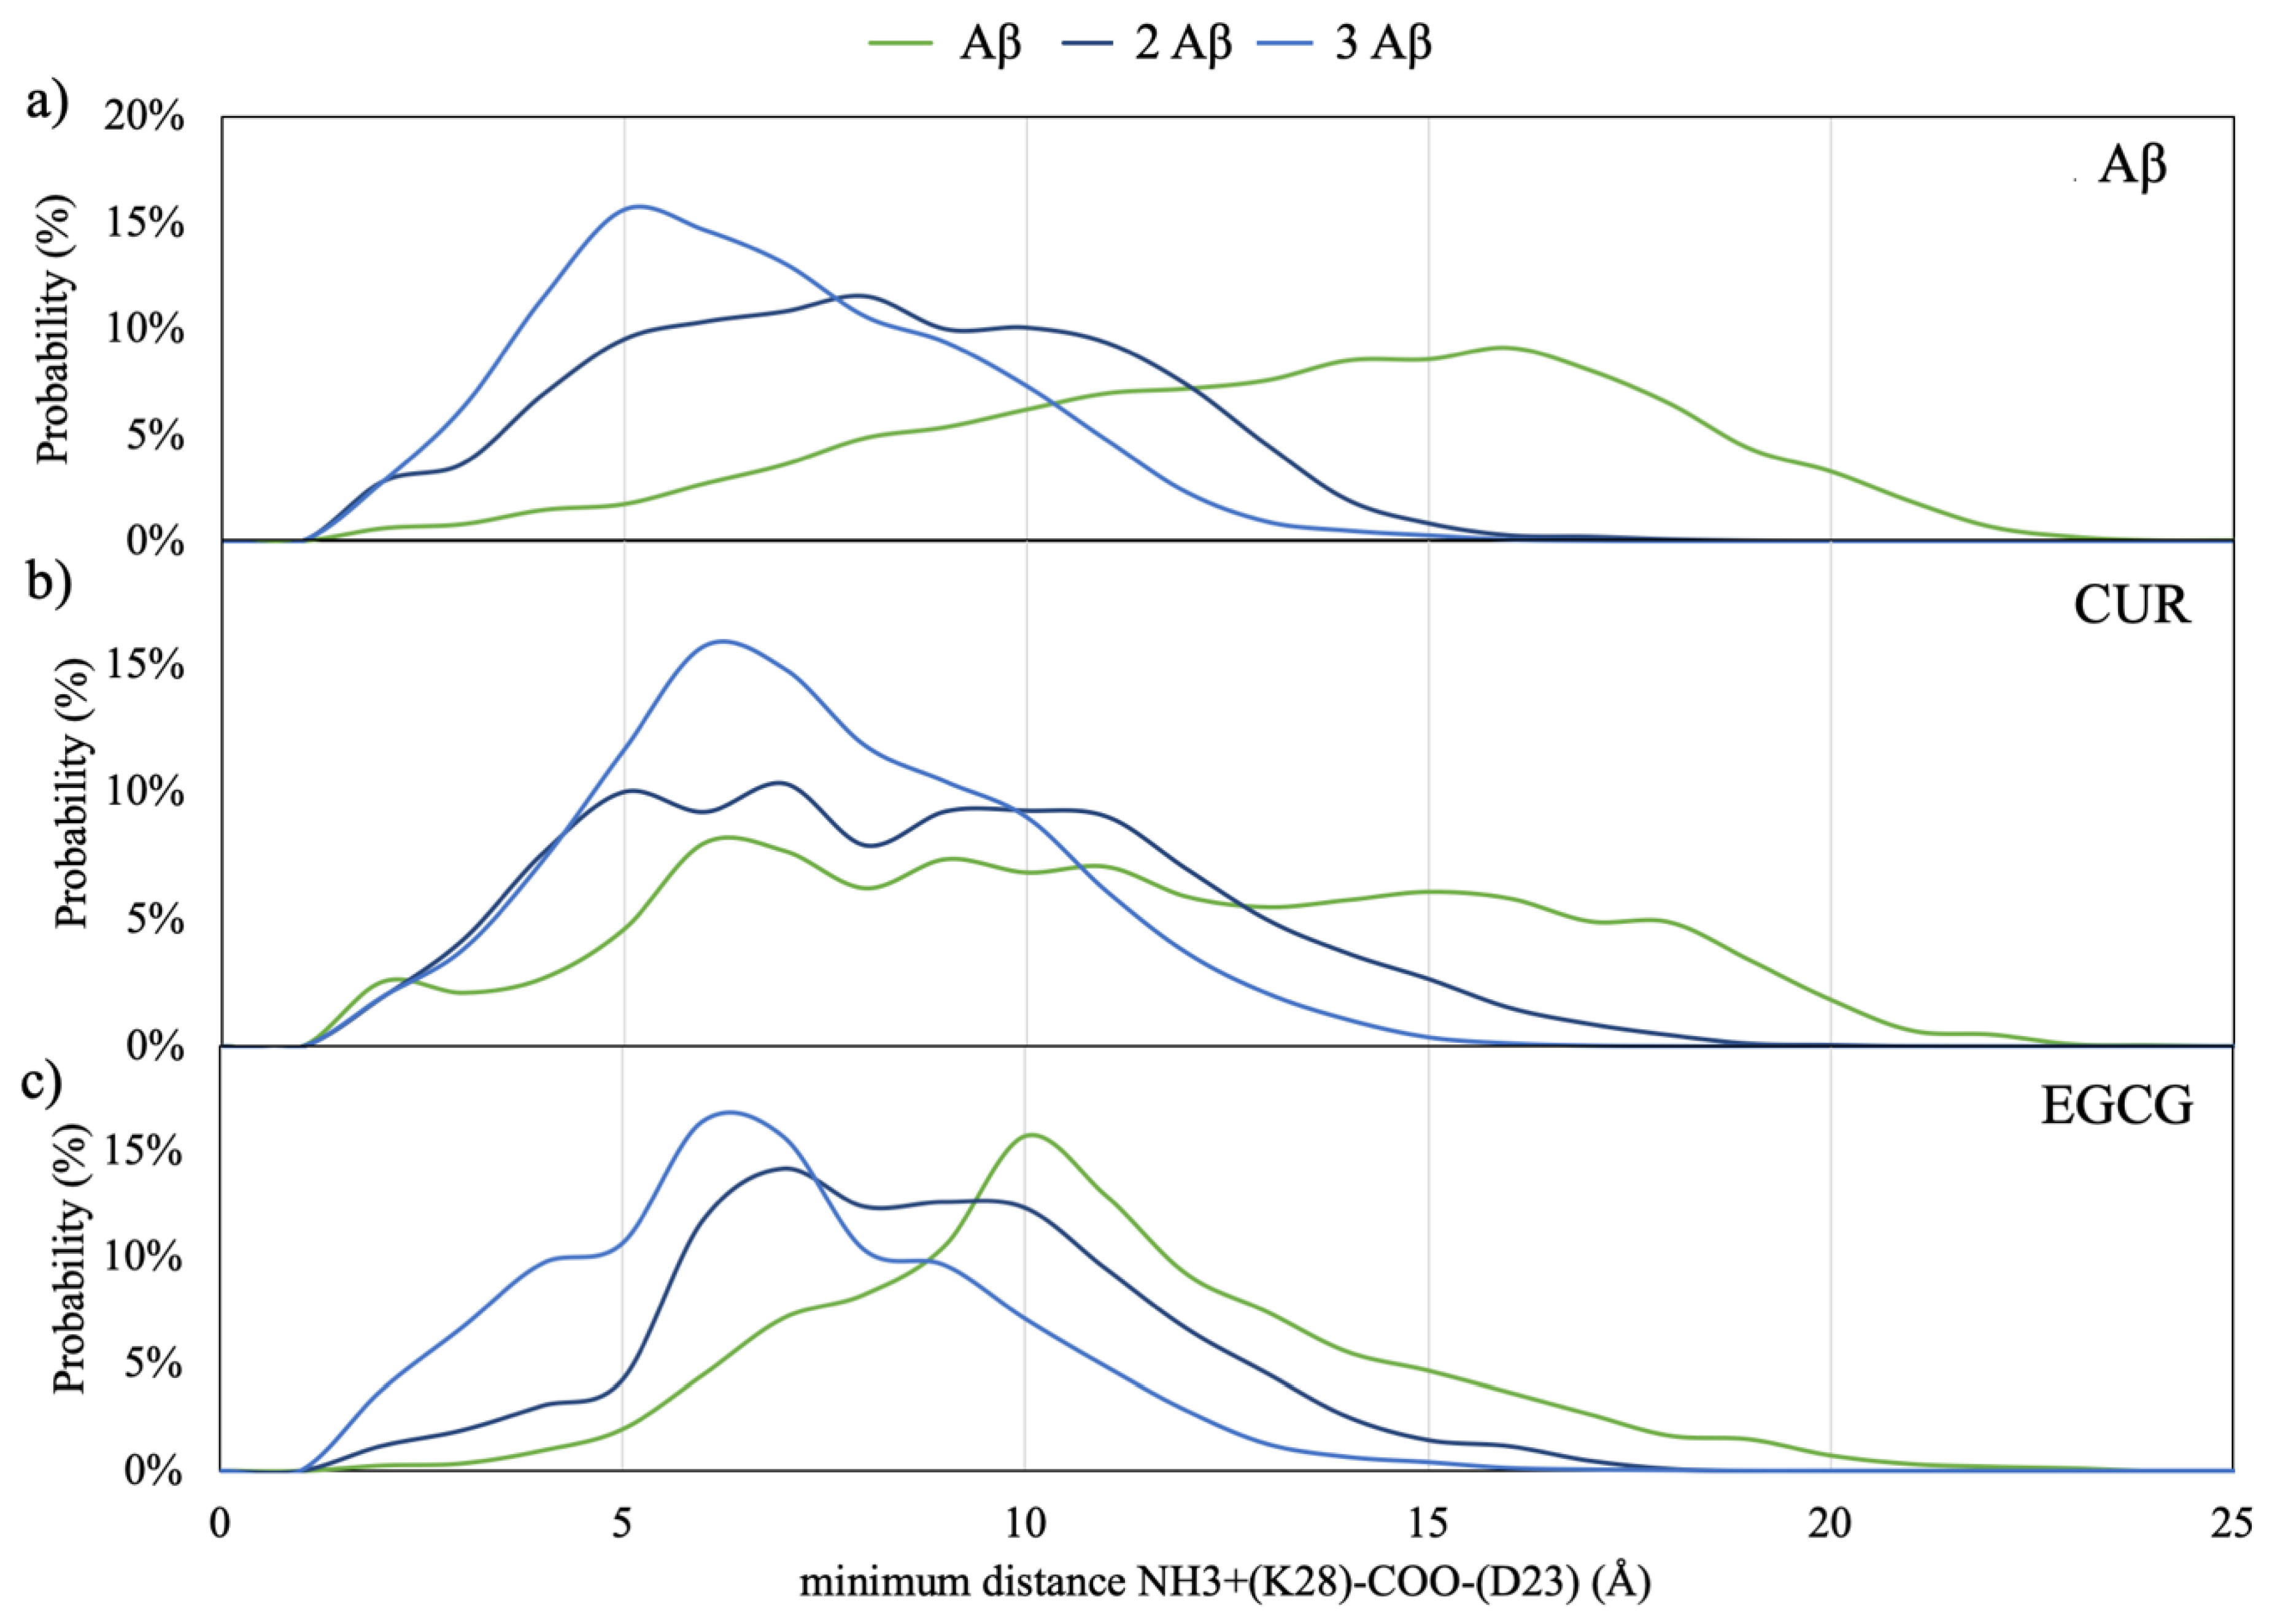
The distribution of the minimum distances between D23 and K28 in Aβ monomers in the solution is reported in
Figure 4. By taking into account that structural constraints from solid-state NMR and electron microscopy suggest an average distance between the NH
3+ of K28 and the COO
– of D23 of 3.7Å in the folded Aβ peptides [
22] but electrostatic interactions between charged residues are still significant at longer distances, a substantial increased propensity to form this salt bridge is manifested by the dimeric and trimeric Aβ models with respect to the monomeric (
Figure 4a).
The insertion of CUR and EGCG in the simulations box (
Figure 4b,c) does not perturb this behavior but slightly shifts the maximum of the distance probability to higher distances.
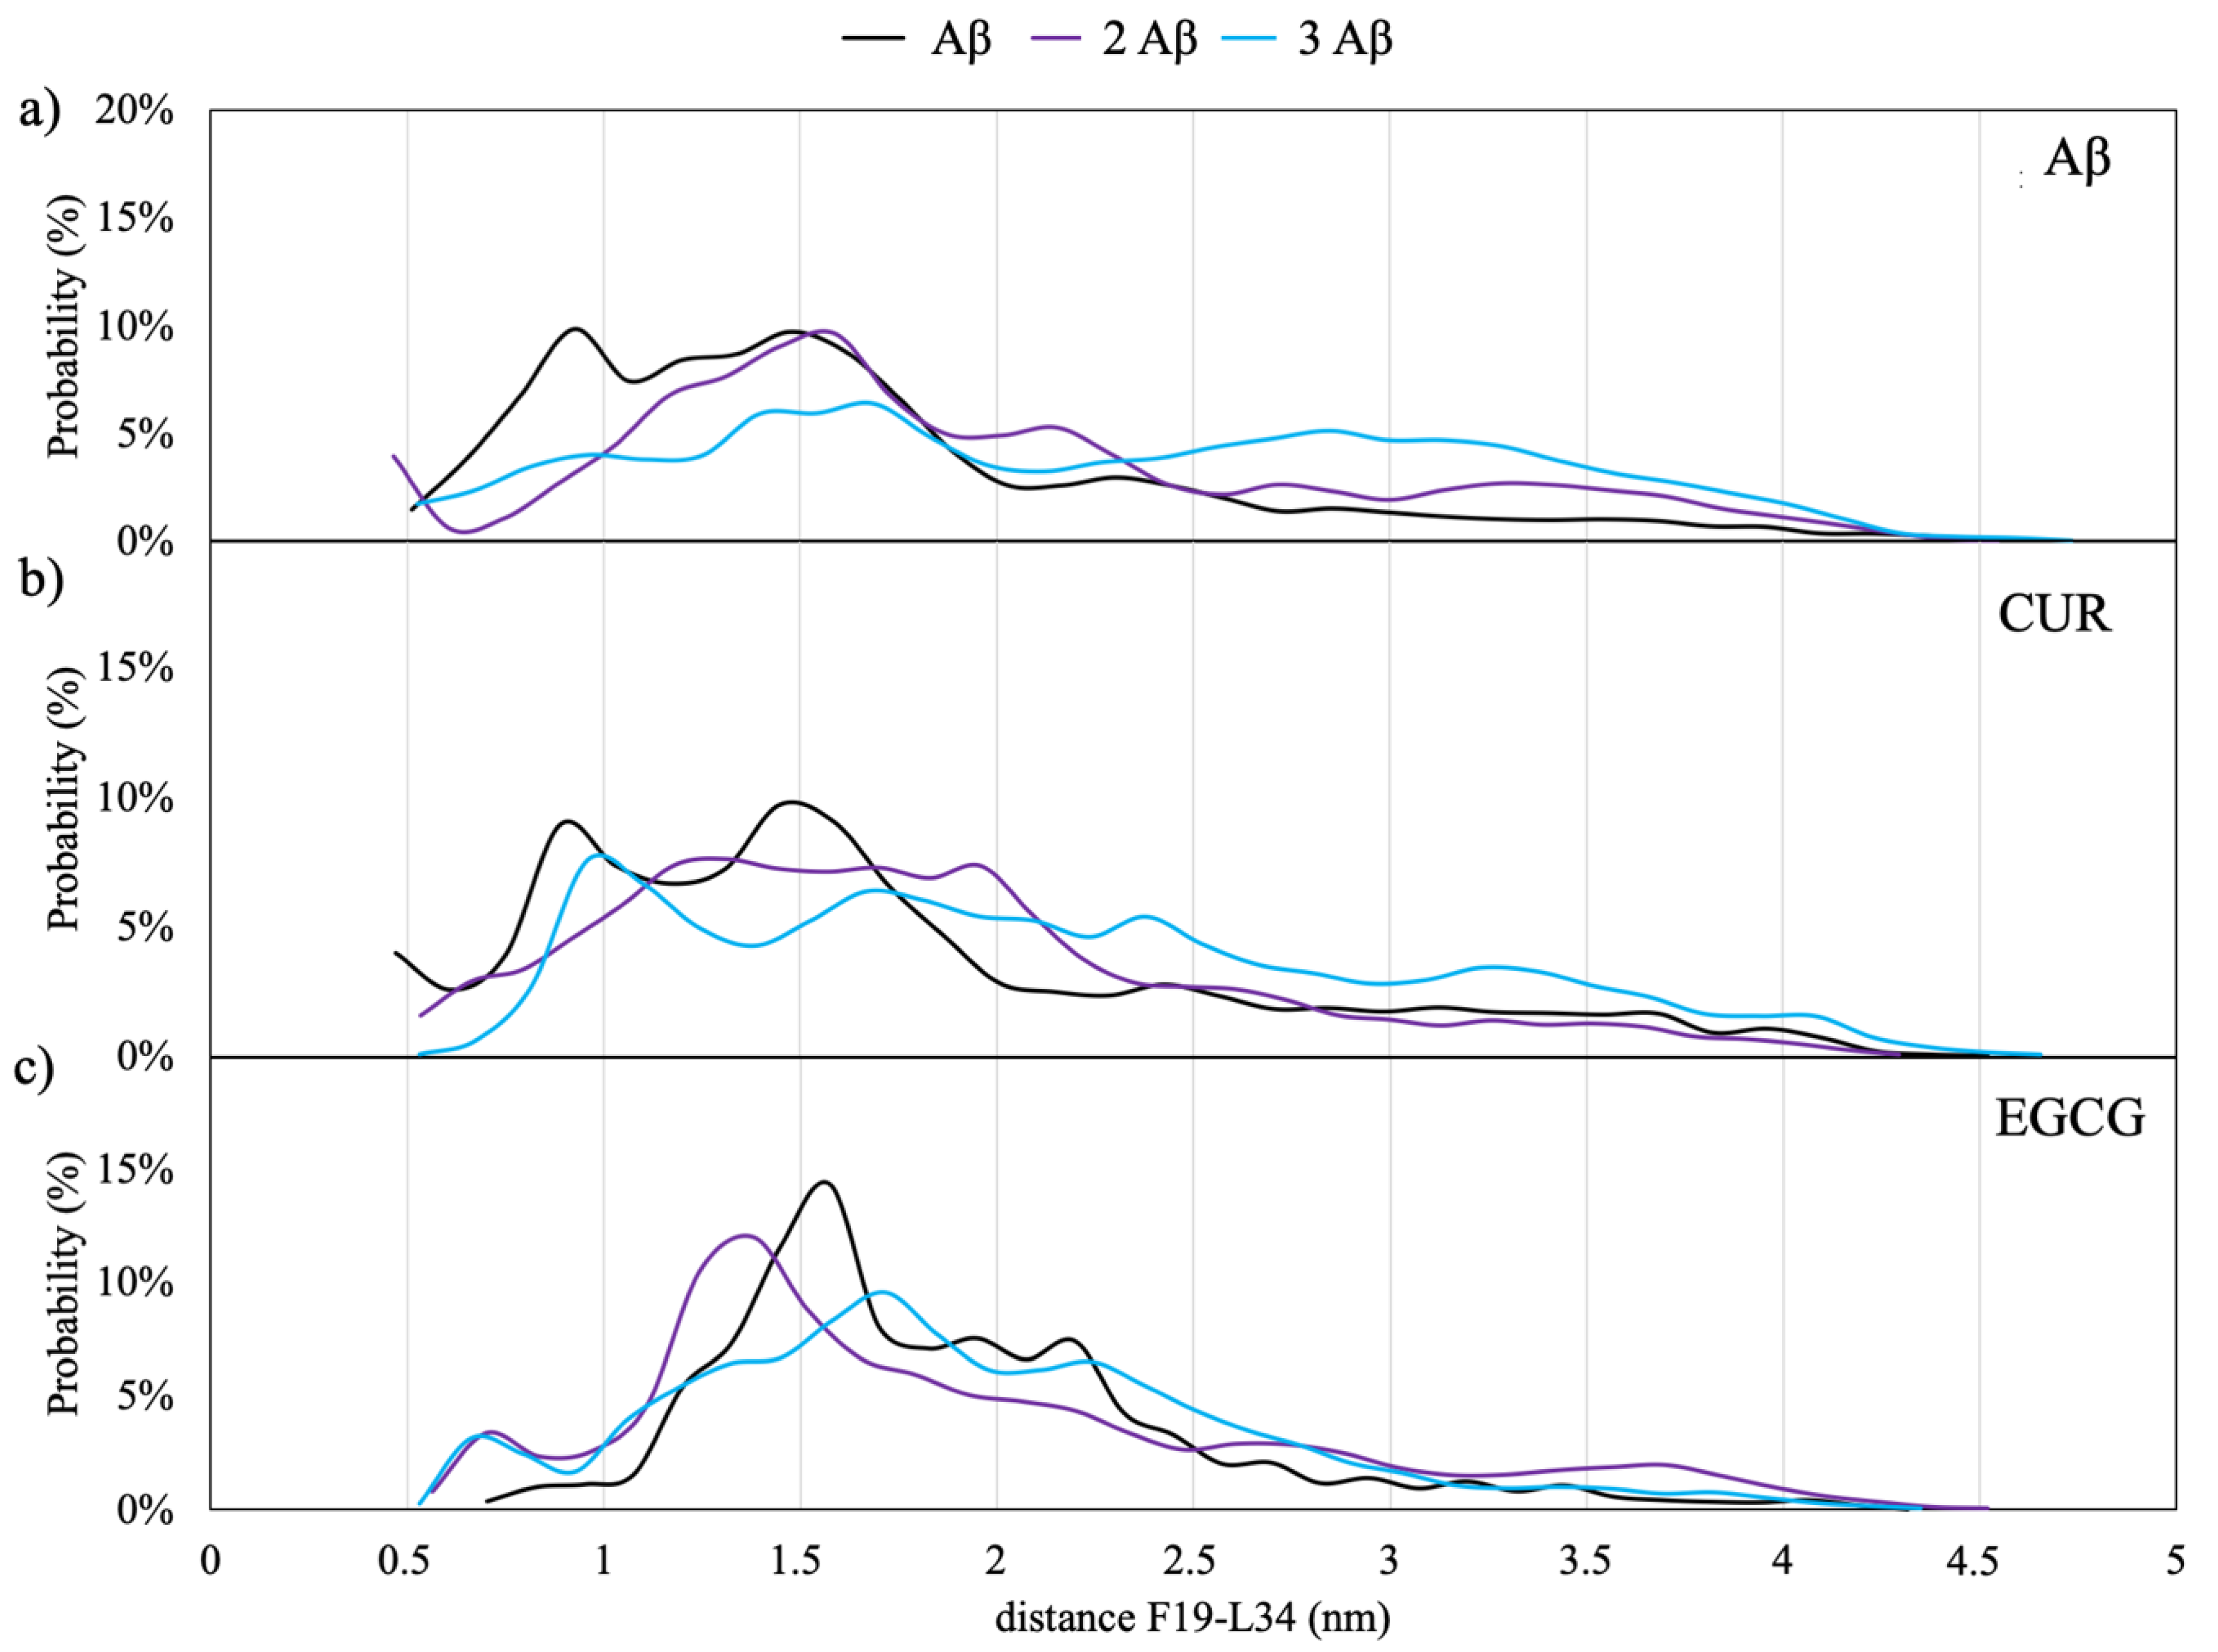
Figure 5a shows the distribution of minimum distances between F19 and L34; the average distance value between the Cα of F19 and L34 found in mature fibrils by means of solid-state NMR is 9.5 ± 1 Å [
20,
22,
23].
The results of the REST simulations of Aβ monomers in the solution seem to indicate that a close contact between the two amino acids is more probable for the monomeric model; in this case, there is a 10% of probability of occurrence of a distance of 9 Å, which allows the establishment of Van der Waals interactions between the side chains of F19 and L34.
A similar behavior is observed for the models with CUR, as shown in
Figure 5b. On the contrary, in the case of EGCG (
Figure 5c), the maximum in the distance distributions are shifted to higher values between 12 and 20 Å, indicating that this molecule is able to inhibit the formation of the hydrophobic contacts between F19 and L34. This finding agrees with a very recent saturation transfer difference NMR study [
33], which showed that EGCG dramatically remodels the contacts between Ab monomers and the oligomer surface.
2.2.2. Inter-Monomer Contacts
Several topologies of the inter-protofilament interface in Aβ40 fibrils have emerged by solid-state NMR experiments, differences being dictated by experimental conditions.
The organization of Aβ monomers into agglomerates composed by two (two-fold topology) [
20,
22,
34,
35] or three (three-fold topology) [
36] protofilaments in different arrangements have been obtained.
Contacts that provide direct constraints on the quaternary structure of the protofibrils and are shared by all the arrangements have been identified experimentally as established mainly by the side chains of M35 [
22,
35,
37] and one or more of the residues I31, I32 and M35 of one monomer/protofilament with one or more of residue G37, G39 and V29 of a second one [
20,
22,
35,
36].
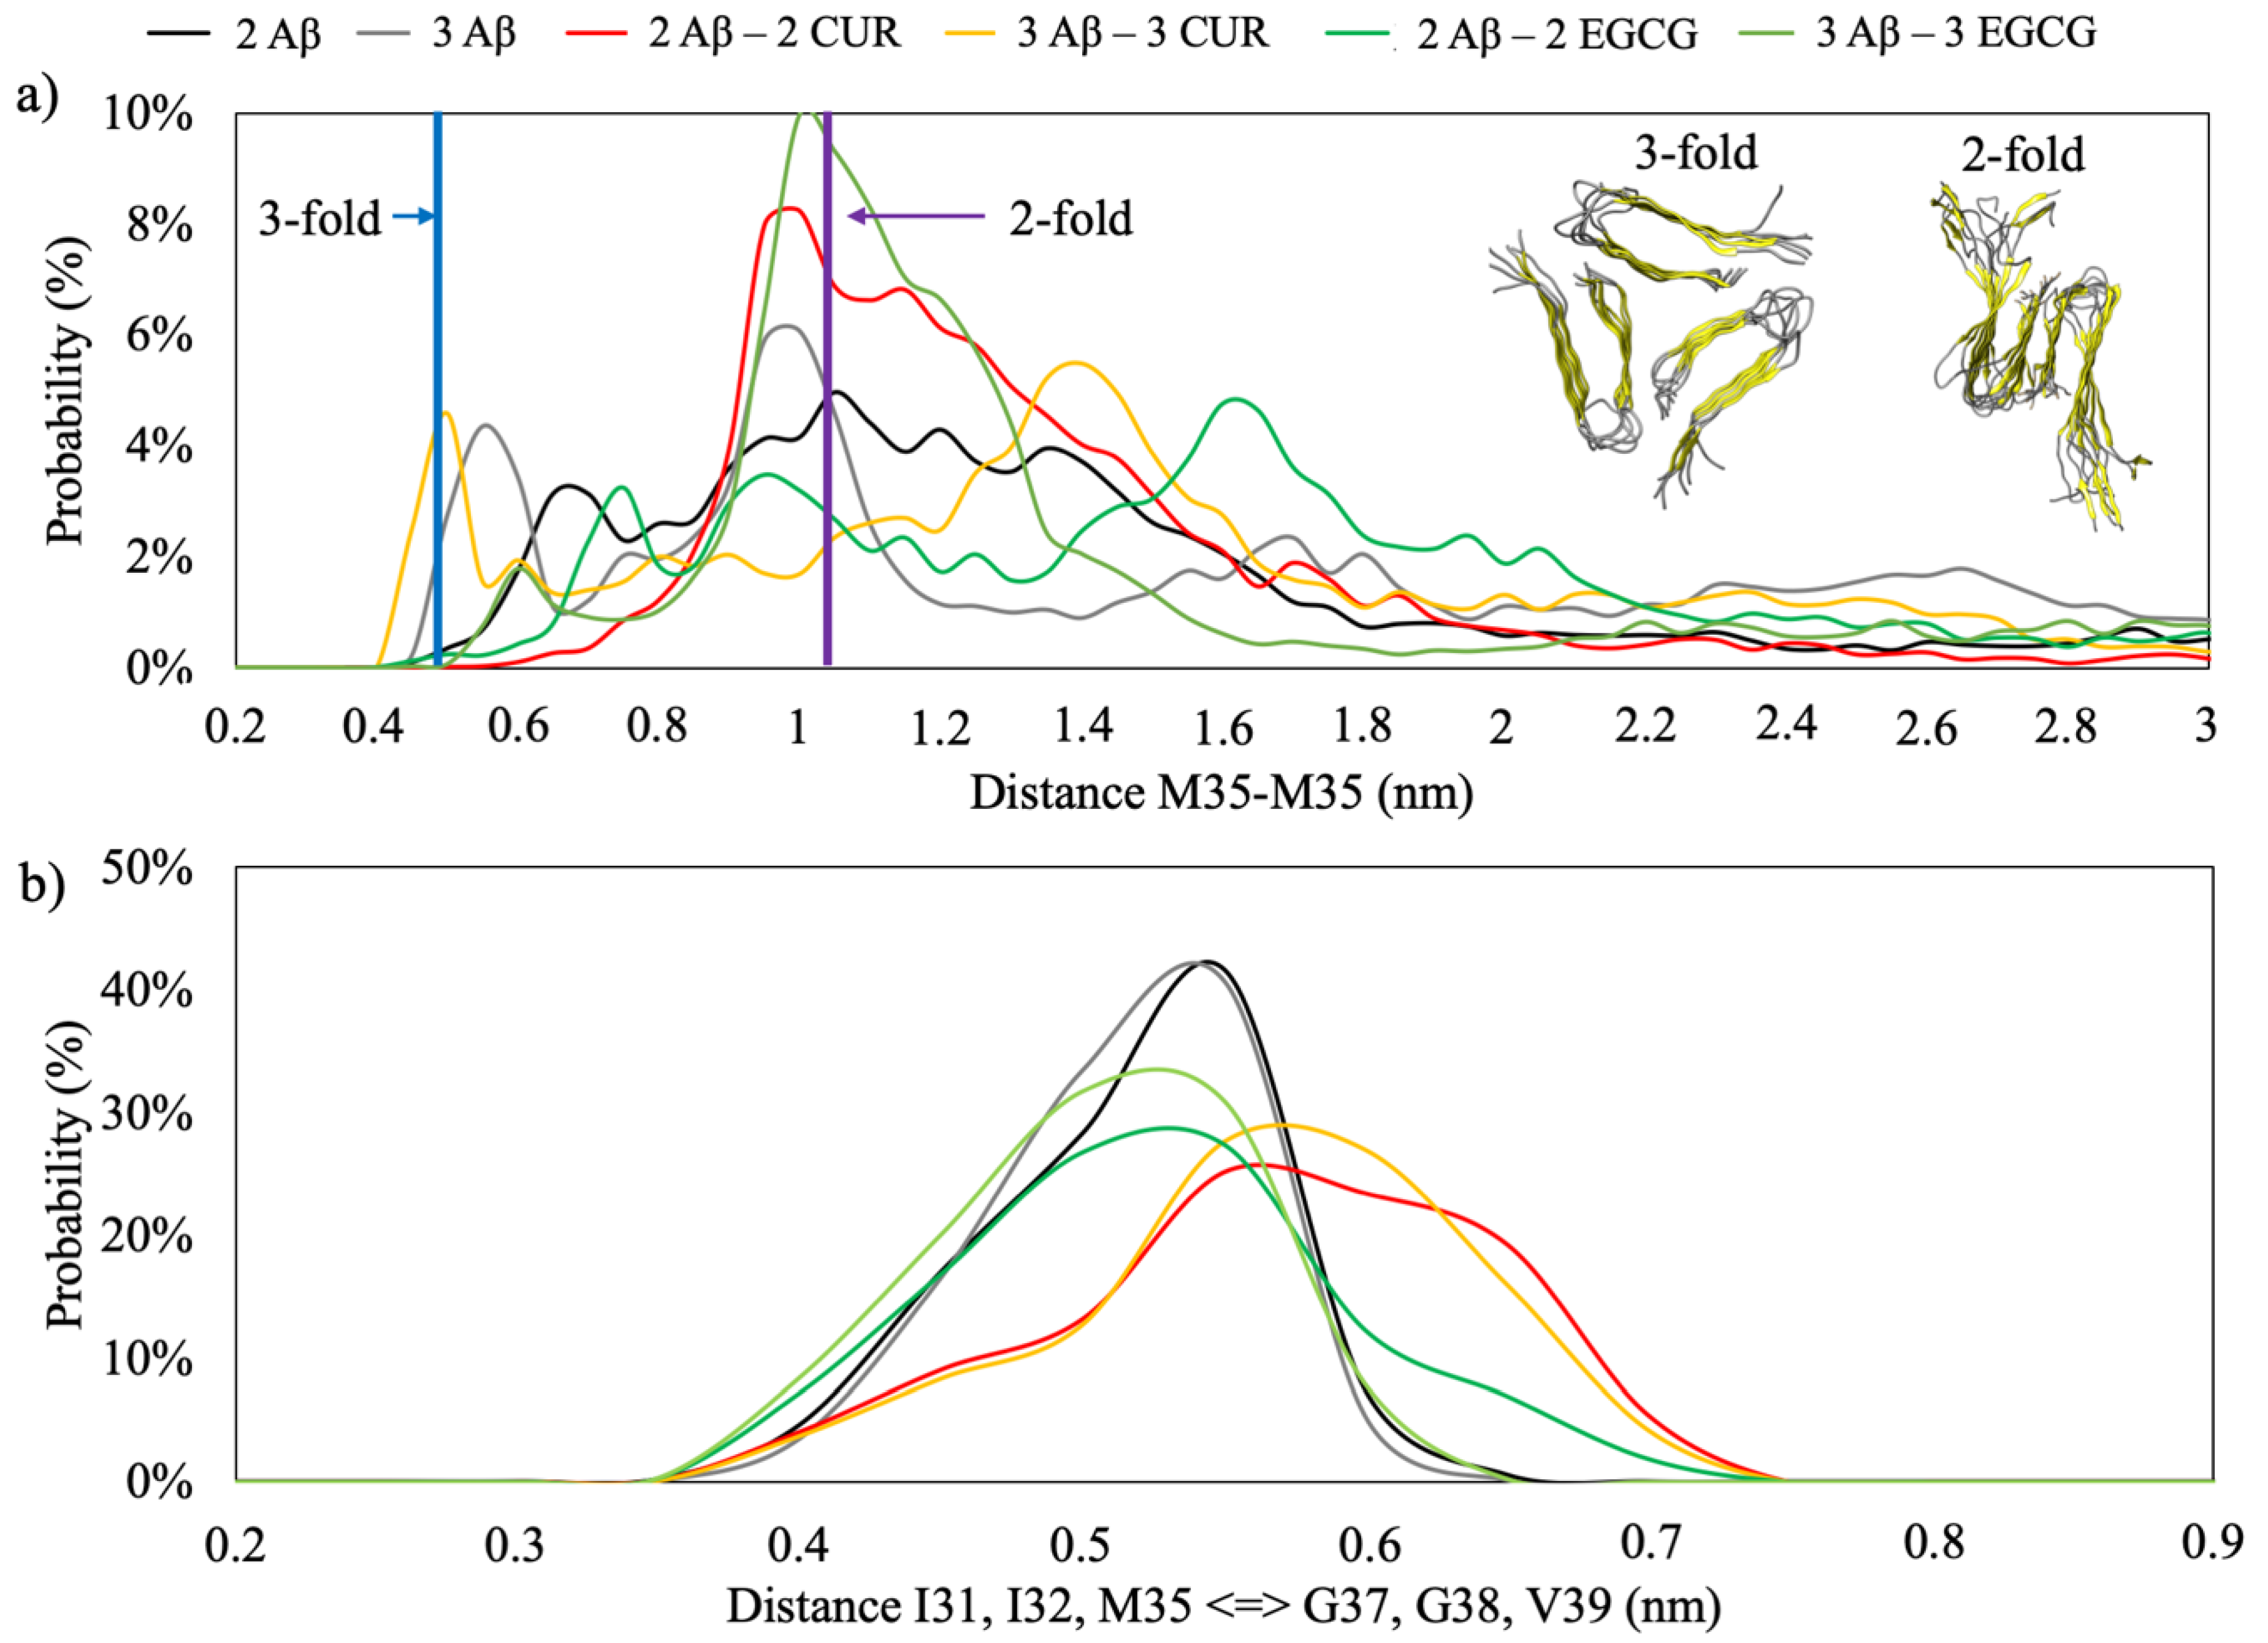
The MD simulation of the two-fold topology of the Aβ(1–40) fibril with the β2 β-sheets facing each other shows an inter-monomeric distance between the Cα of M35 in the order of 1.1 nm, while, in the three-fold topology, the distance is reduced to 0.5 nm.
Figure 6a shows the distribution of the M35-M35 distances in the REMD simulations. A marked trend to assume a configuration similar to the two-fold topology is observed. Moreover, the profile of the minimum distance between the Cα of amino acids I31, I33 and M35 versus G37, G38 and V39 (
Figure 6b) has a distribution centred at 5.5Å, which is consistent with the shortest distance between I31 of G37 of 5.2Å found by NMR experiments [
22].
These results indicate that the first step of fibril recognition necessary for primary nucleation is reached during the simulation time.
It is interesting to note that in the simulation CUR acts as an inhibitor of the aggregation; in fact, the presence of two or three molecules of CUR shifts the distance distribution towards higher values (
Figure 6b).
2.3. Ligand–Aβ Monomer Interactions
The estimation of the binding free energy of the ligand-Aβ40 oligomer interactions provides quantitative information on the binding determinants.
Table 1 shows the binding free energy Δ
obtained using the molecular mechanic-Poisson-Boltzmann surface area (MM-PBSA) method. The analysis of the energy components clearly indicates that the VdW term is the principal actor in the interaction of both EGCG and CUR, whereas the nonpolar term, Δ
, furnishes a negligible contribution. Moreover, in all cases, the EGCG binds stronger than CUR to Aβ, with an average value of 30 kcal/mol, while the strength of the CUR-Aβ interaction decreases when dimeric and trimeric models are considered going from –25 kcal/mol for the monomer to –18 kca/mol for the trimer.
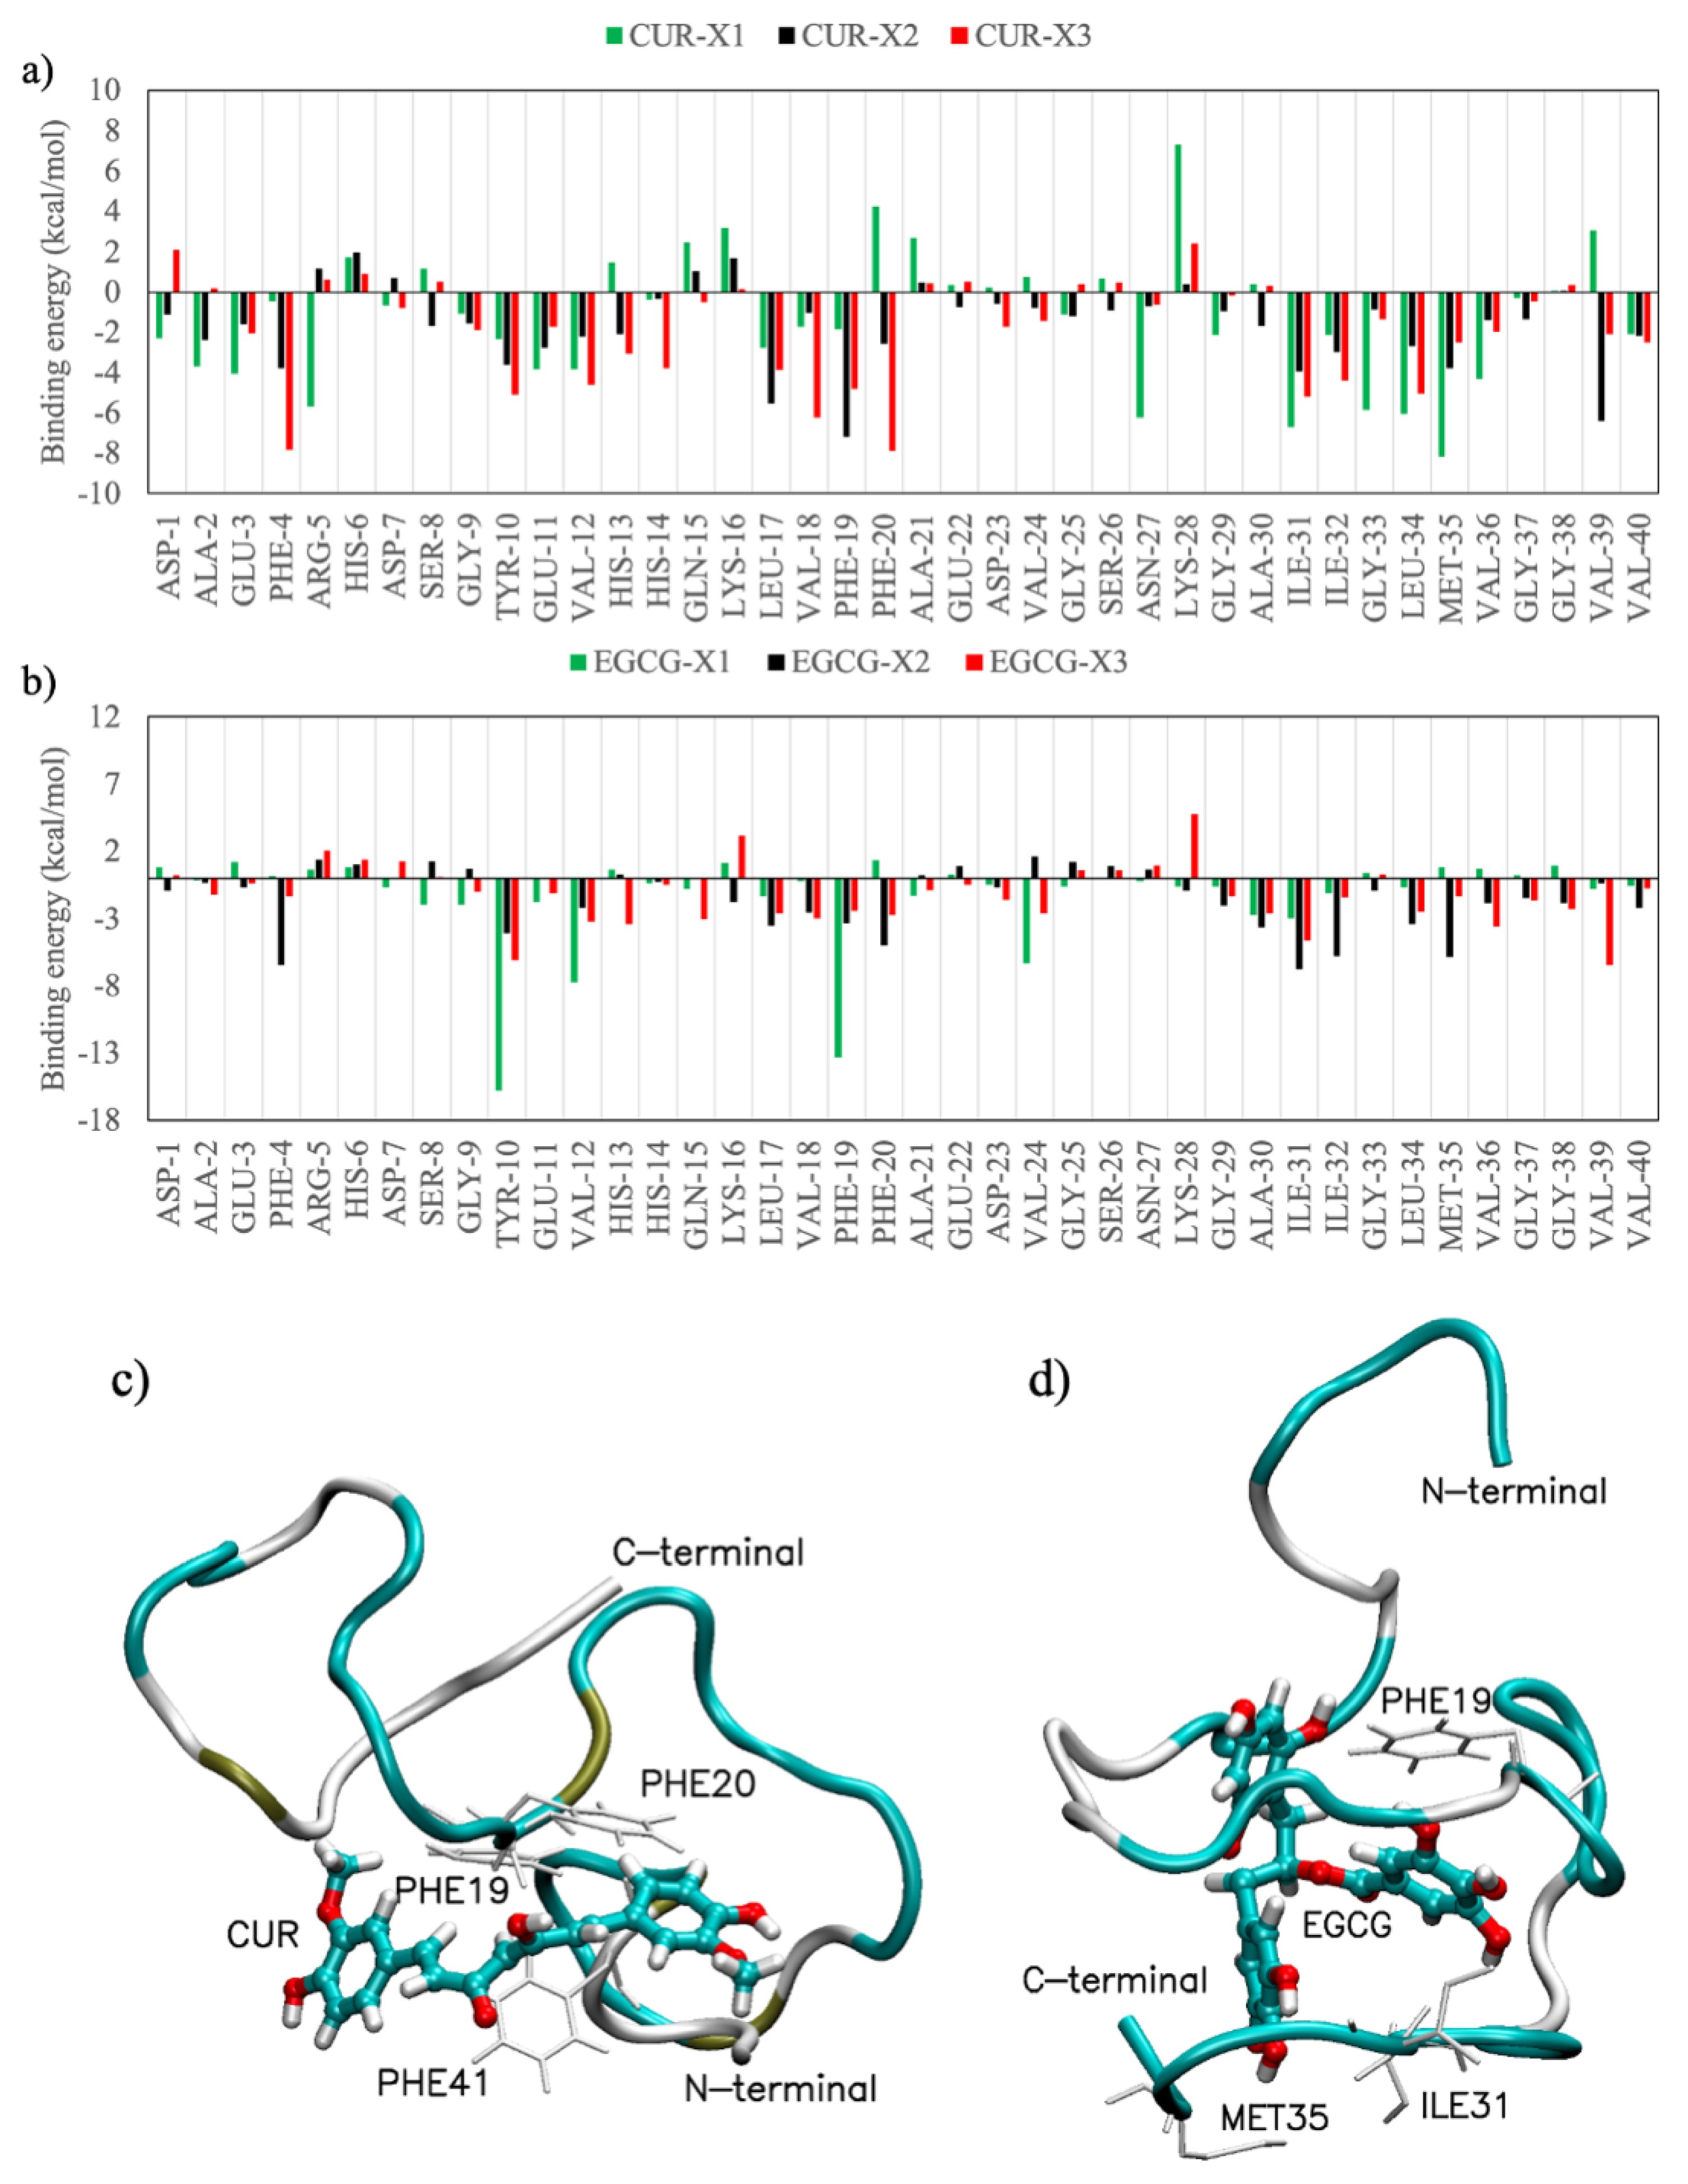
Figure 7 shows the contribution of each residue to the binding energy with ligands. The data values are mediated over all the computational simulations obtained by the MM-PBSA analysis. It can be noted that both CUR and EGCG interact mainly with hydrophobic amino acids such as F4, Y10, V12, L17, V18, F19, F20, I31, I32, L34, M35, V36 and V39 [
38], where in bold are highlighted the amino acids that strongly interact both with CUR and with EGCG. The 2M9R PDB structure is a complex between the amyloid-beta peptide (1–40) and the polyphenol epsilon-viniferin glucoside ligand. This ligand is similar in the size and number of π-rings to EGCG and, in agreement with our finding, gives rise to a coulombic interaction with the amine group of Q15 and to the π-π interaction with F19. Overall, the results confirm the nonspecificity of the CUR and EGCG binding previously observed by both experimental [
24,
33,
39] and computational studies [
40].
3. Discussion
In this work, extensive replica exchange solute tempering molecular dynamic simulations of Aβ(1–40) monomers, dimers and trimers interacting with natural polyphenols curcumin and (–)-epigallocatechin-3-gallate have been performed. The results clearly indicate that the tendency to form β-sheet-rich structures, characteristic of amyloid fibrils, in dimeric and trimeric models is reduced by the addition of both ligands, whereas an increase of turn and helical structures is observed. However, CUR has a smaller influence on the perturbation of monomer elongations with respect to EGCG, as also detected by the results obtained by monitoring the radius of the gyration profiles and the distributions of the F19-L34 distances, which can be considered first marks of the interaction between the two hydrophobic regions of the Aβ(1–40) peptide. The central hydrophobic core of Aβ, which is responsible for the inter- and intra-molecular contacts in folded fibrils, is found to provide important interacting sites for both ligands, with Van der Waals interactions being the main driving forces for ligand binding.
Overall, the results indicate that EGCG and CUR have two different inhibition mechanisms, but EGCG seems to be the most efficient of the two natural compounds in preventing early nucleation, precluding toxic effects associated with the fibril growth process. This study paves the way for further investigations of other potential effective natural compounds to inhibit the amyloid-β aggregation and to prevent Alzheimer’s disease.
4. Materials and Methods
4.1. Molecular Dynamics Simulations
The GROMOS 54a7 force field [
41] was used to perform the molecular dynamics simulations, since it has been shown to stabilize the secondary structure elements in close agreement with the experimental observations [
42]. The protonation state of the ligands at pH 7 was considered, and the relative force field parameters in the Gromacs format [
43,
44] were assigned using the Automated Topology Builder [
45,
46] web server, as previously done [
14,
46].
The structural model of the amyloid monomer in its unfolded state was retrieved from the Protein Data Bank [
47]. The NMR structure of a complex between the amyloid-beta peptide (1–40) and the polyphenol epsilon-viniferin glucoside was retrieved from the PDB (PDB ID: 2M9R [
48]). A representative structure of the unfolded state was selected, as shown in
Figure 8, and, after removing the ligands, standard protonation states corresponding to pH 7 were assigned to ionizable amino acids. The tautomeric state of the histidine residues in the Aβ42 peptide is (εεε). The role of the tautomeric state of the histidine residues in the aggregation properties of the Aβ40 and of the Aβ42 monomers was studied by Brännström et al. [
49] and by Lee and coworkers [
50,
51], respectively. Their results show a preference of the (εεε) isomer of the H6-H13-H14 residues to trigger β-sheet-folding.
The side of the simulation box (8.175 × 8.175 × 8.175 nm) was chosen in order to include the full-length monomer in its unfolded state. For each model (Aβ-amyloid with no ligands, Aβ-amyloid with curcumin molecule, CUR and Aβ-amyloid with (–)-epigallocatechin-3-gallate (EGCG)), three simulation boxes were built containing one (i.e., BOX_1), two (i.e., BOX_2) and three (i.e., BOX_3) monomers, respectively. In each simulation box, the ratio of Aβ-amyloid peptide:ligand is 1:1, as shown in
Table 2.
Each box contains about 17,000 simple point charge water molecules [
52]. Counter ions (Na
+ and Cl
−) were added at random locations to neutralize the systems, considering an ion concentration of 150 mM, close to the physiological value.
Each system was first minimized, until the maximum force applied to each atom was smaller than 1 kJ/(mol nm). Then, the system was equilibrated for 2 ns in the NVT ensemble where the temperature was controlled using a velocity-rescaling thermostat with a coupling time of 0.1 ps. Then an NPT equilibration of 2 ns was performed using the Berendsen barostat. Lastly, the production run was performed using the Parrinello–Rhaman barostat with a coupling time of 2 ps and an isothermal compressibility of 4.5 × 10
−5 bar
−1 with a timestep of 2.0 fs. The particle-mesh Ewald algorithm was used to calculate long-range electrostatics [
53], with a fourth-order cubic interpolation, a grid spacing of 0.16 nm and a real space cut-off of 1 nm [
54]. Both Van der Waals and neighbor list cut-offs describing short-range interactions were set to 1.0 nm. Data analysis was performed using the Gromacs package [
44].
4.2. REST Simulations
Replica exchange solute tempering (REST) [
55] was used in order to efficiently sample the protein configurations of the monomeric, dimeric and trimeric models of the Aβ peptide with and without the ligands.
In REST simulations, several replicas of the system are built by setting different temperatures to the solute, keeping the solvent at a constant temperature. REST simulations follow the same rules of standard REMD simulations, where, in each given timestep, the replicas are exchanged in temperatures if they satisfy the detailed balance condition, which preserves the Boltzmann distribution at each temperature. REST has the advantage, with respect to REMD, to employ less replicas (four to five times less) without compromising the temperature range or the efficiency of the random walk [
40,
46].
Eight replicas with temperatures ranging from 300 K to 440 K by steps of 20 K were simulated; replica exchanges were attempted each 2 ps, and the acceptance ratio of 20% was chosen [
14,
16]. Each replica in the REST simulations is 100-ns-long, for a total of 800 ns for each system and for a total simulation time of 2.4 µs; replicas were exchanged each 500 steps, corresponding to 1 ps [
14,
16].
4.3. MM-PBSA
The molecular mechanic-Poisson-Boltzmann surface area (MM-PBSA) method calculates the binding free energy of a ligand with a protein [
56]. The last 10ns of each simulation were used to perform the calculation, in order to have a stable binding of Aβ with the ligand.
The binding free energy (ΔG
binding) is the difference between the free energy of the complex, G
complex, and the summation of the free energy of the protein, G
protein, and ligand, G
ligand:
Each term of the free energy is defined as:
where the mechanical energy, E
MM, of the solute in the gas phase is given by the summation of the bonds, angles, dihedrals, Van der Waals and electrostatic terms:
The solvation energy, G
solvation, is described by the sum of nonpolar and electrostatic contributions:
while T and S represent the temperature and entropy, respectively. The entropic term, TΔS, is computed using the Quasi-harmonic formula [
57].
The nonpolar solvation term, G
surf, was approximated on the solvent-accessible surface area (SASA) derived from the Shrake–Rupley numerical method [
58]:
with γ = 0.0072 kcal/mol Å
2 and β = 0 [
59,
60].
The term comprising the electrostatic potential between the solute and the solvent, G
PB, is calculated using the continuum solvent approximation [
61] by the APBS package [
56].
4.4. Secondary Structure Calculation
The content of secondary structures for Aβ has been computed using the DSSP algorithm [
62] by performing the average on the overall simulation time for each replica.
Author Contributions
F.T. performed the simulations and data analysis. A.P., M.C.M. and F.T. planned the computational experiments and discussed the results. The manuscript was written through contributions of all the authors. All authors have read and agreed to the published version of the manuscript.
Funding
This work has been supported by the UNIMORE FAR Junior Grant 2018 “Computer–aided Rational Design of Functionalized Gold Nanoparticles as Inhibitors of Amyloid-β Oligomerization for Alzheimer’s Disease Treatment”.
Conflicts of Interest
The authors declare no conflict of interest.
References
- Hardy, J.; Selkoe, D.J. The amyloid hypothesis of Alzheimer’s disease: Progress and problems on the road to therapeutics. Science 2002, 297, 353–356. [Google Scholar] [CrossRef] [PubMed] [Green Version]
- Tanzi, R.E.; Bertram, L. Twenty Years of the Alzheimer’s Disease Amyloid Hypothesis: A Genetic Perspective. Cell 2005, 120, 545–555. [Google Scholar] [CrossRef] [PubMed]
- Karran, E.; Mercken, M.; Strooper, B. De The amyloid cascade hypothesis for Alzheimer’s disease: An appraisal for the development of therapeutics. Nat. Rev. Drug Discov. 2011, 19, 698–712. [Google Scholar] [CrossRef] [PubMed]
- Arosio, P.; Knowles, T.P.J.; Linse, S. On the lag phase in amyloid fibril formation. Phys. Chem. Chem. Phys. 2015, 17, 7606–7618. [Google Scholar] [CrossRef] [Green Version]
- Landau, M.; Sawaya, M.R.; Faull, K.F.; Laganowsky, A.; Jiang, L.; Sievers, S.A.; Liu, J.; Barrio, J.R.; Eisenberg, D. Towards a {Pharmacophore} for {Amyloid}. PLoS Biol. 2011, 9, e1001080. [Google Scholar] [CrossRef]
- Williams, P.; Sorribas, A.; Howes, M.-J.R. Natural products as a source of Alzheimer’s drug leads. Nat. Prod. Rep. 2011, 28, 48–77. [Google Scholar] [CrossRef]
- Carballo–Pacheco, M.; Strodel, B. Advances in the Simulation of Protein Aggregation at the Atomistic Scale. J. Phys. Chem. B 2016, 120, 2991–2999. [Google Scholar] [CrossRef]
- Hamaguchi, T.; Ono, K.; Yamada, M. Curcumin and Alzheimer’s disease. CNS Neurosci. Ther. 2010, 16, 285–297. [Google Scholar] [CrossRef]
- Scarmeas, N.; Stern, Y.; Mayeux, R.; Luchsinger, J.A. Mediterranean diet, alzheimer disease, and vascular mediation. Arch. Neurol. 2006, 63, 1709–1711. [Google Scholar] [CrossRef] [Green Version]
- Scarmeas, N.; Luchsinger, J.A.; Schupf, N.; Brickman, A.M.; Cosentino, S.; Tang, M.X.; Stern, Y. Physical activity, diet, and risk of Alzheimer disease. JAMA—J. Am. Med. Assoc. 2009, 302, 627–637. [Google Scholar] [CrossRef] [Green Version]
- Velander, P.; Wu, L.; Henderson, F.; Zhang, S.; Bevan, D.R.; Xu, B. Natural product–based amyloid inhibitors. Biochem. Pharmacol. 2017, 139, 40–55. [Google Scholar] [CrossRef] [PubMed] [Green Version]
- Omar, S.H. Biophenols pharmacology against the amyloidogenic activity in Alzheimer’s disease. Biomed. Pharmacother. 2017, 89, 396–413. [Google Scholar] [CrossRef] [PubMed]
- Nasica-Labouze, J.; Nguyen, P.H.; Sterpone, F.; Berthoumieu, O.; Buchete, N.V.; Coté, S.; De Simone, A.; Doig, A.J.; Faller, P.; Garcia, A.; et al. Amyloid β Protein and Alzheimer’s Disease: When Computer Simulations Complement Experimental Studies. Chem. Rev. 2015, 115, 3518–3563. [Google Scholar]
- Tavanti, F.; Pedone, A.; Menziani, M.C. Computational Insight into the Effect of Natural Compounds on the Destabilization of Preformed Amyloid–β(1–40) Fibrils. Molecules 2018, 23, 1320. [Google Scholar] [CrossRef] [Green Version]
- Bieschke, J.; Russ, J.; Friedrich, R.P.; Ehrnhoefer, D.E.; Wobst, H.; Neugebauer, K.; Wanker, E.E. EGCG remodels mature α–synuclein and amyloid–β fibrils and reduces cellular toxicity. Proc. Natl. Acad. Sci. USA 2010, 107, 7710–7715. [Google Scholar] [CrossRef] [Green Version]
- Ngo, S.T.; Truong, D.T.; Tam, N.M.; Nguyen, M.T. EGCG inhibits the oligomerization of amyloid beta (16–22) hexamer: Theoretical studies. J. Mol. Graph. Model. 2017, 76, 1–10. [Google Scholar] [CrossRef]
- Tomaselli, S.; Esposito, V.; Vangone, P.; van Nuland, N.A.J.; Bonvin, A.M.J.J.; Guerrini, R.; Tancredi, T.; Temussi, P.A.; Picone, D. The α–to–β Conformational Transition of Alzheimer’s Aβ–(1–42) Peptide in Aqueous Media is Reversible: A Step by Step Conformational Analysis Suggests the Location of β Conformation Seeding. ChemBioChem 2006, 7, 257–267. [Google Scholar] [CrossRef] [Green Version]
- D’Ursi, A.M.; Armenante, M.R.; Guerrini, R.; Salvadori, S.; Sorrentino, G.; Picone, D. Solution structure of amyloid β–peptide (25–35) in different media. J. Med. Chem. 2004, 47, 4231–4238. [Google Scholar] [CrossRef]
- Tycko, R. Molecular structure of amyloid fibrils: Insights from solid–state NMR. Q. Rev. Biophys. 2006, 39, 1. [Google Scholar] [CrossRef]
- Paravastu, A.K.; Leapman, R.D.; Yau, W.-M.; Tycko, R. Molecular structural basis for polymorphism in Alzheimer’s β–amyloid fibrils. Proc. Natl. Acad. Sci. USA 2008, 105, 18349–18354. [Google Scholar] [CrossRef] [Green Version]
- Qiang, W.; Yau, W. –M.; Luo, Y.; Mattson, M.P.; Tycko, R. Antiparallel β–sheet architecture in Iowa–mutant β–amyloid fibrils. Proc. Natl. Acad. Sci. USA 2012, 109, 4443–4448. [Google Scholar] [CrossRef] [PubMed] [Green Version]
- Petkova, A.T.; Yau, W.-M.; Tycko, R. Experimental Constraints on Quaternary Structure in Alzheimer’s β–Amyloid Fibrils. Biochemistry 2006, 45, 498–512. [Google Scholar] [CrossRef] [PubMed] [Green Version]
- Lu, J.-X.; Qiang, W.; Yau, W.-M.; Schwieters, C.D.; Meredith, S.C.; Tycko, R. Molecular Structure of β–Amyloid Fibrils in Alzheimer’s Disease Brain Tissue. Cell 2013, 154, 1257–1268. [Google Scholar] [CrossRef] [PubMed] [Green Version]
- Lopez del Amo, J.M.; Fink, U.; Dasari, M.; Grelle, G.; Wanker, E.E.; Bieschke, J.; Reif, B. Structural Properties of EGCG–Induced, Nontoxic Alzheimer’s Disease Aβ Oligomers. J. Mol. Biol. 2012, 421, 517–524. [Google Scholar] [CrossRef] [PubMed]
- Kolinski, A.; Skolnick, J. Determinants of secondary structure of polypeptide chains: Interplay between short range and burial interactions. J. Chem. Phys. 1997, 107, 953. [Google Scholar] [CrossRef] [Green Version]
- Nag, S.; Sarkar, B.; Bandyopadhyay, A.; Sahoo, B.; Sreenivasan, V.K.A.; Kombrabail, M.; Muralidharan, C.; Maiti, S. Nature of the amyloid–β monomer and the monomer–oligomer equilibrium. J. Biol. Chem. 2011, 286, 13827–13833. [Google Scholar] [CrossRef] [Green Version]
- Adler, J.; Baumann, M.; Voigt, B.; Scheidt, H.A.; Bhowmik, D.; Häupl, T.; Abel, B.; Madhu, P.K.; Balbach, J.; Maiti, S.; et al. A Detailed Analysis of the Morphology of Fibrils of Selectively Mutated Amyloid β (1–40). ChemPhysChem 2016, 17, 2744–2753. [Google Scholar] [CrossRef]
- Gu, L.; Tran, J.; Jiang, L.; Guo, Z. A new structural model of Alzheimer’s Aβ42 fibrils based on electron paramagnetic resonance data and Rosetta modeling. J. Struct. Biol. 2016, 194, 61–67. [Google Scholar] [CrossRef] [Green Version]
- Paparcone, R.; Pires, M.A.; Buehler, M.J. Mutations alter the geometry and mechanical properties of Alzheimer’s Aβ(1–40) amyloid fibrils. Biochemistry 2010, 49, 8967–8977. [Google Scholar] [CrossRef]
- Adler, J.; Scheidt, H.A.; Krüger, M.; Thomas, L.; Huster, D. Local interactions influence the fibrillation kinetics, structure and dynamics of Aβ(1–40) but leave the general fibril structure unchanged. Phys. Chem. Chem. Phys. 2014, 16, 7461–7471. [Google Scholar] [CrossRef] [Green Version]
- Korn, A.; McLennan, S.; Adler, J.; Krueger, M.; Surendran, D.; Maiti, S.; Huster, D. Amyloid β (1–40) Toxicity Depends on the Molecular Contact between Phenylalanine 19 and Leucine 34. ACS Chem. Neurosci. 2018, 9, 790–799. [Google Scholar] [CrossRef] [PubMed]
- Bonhommeau, S.; Talaga, D.; Hunel, J.; Cullin, C.; Lecomte, S. Tip–Enhanced Raman Spectroscopy to Distinguish Toxic Oligomers from Aβ1–42Fibrils at the Nanometer Scale. Angew. Chem.—Int. Ed. 2017, 56, 1771–1774. [Google Scholar] [CrossRef] [PubMed]
- Ahmed, R.; Melacini, G. A solution NMR toolset to probe the molecular mechanisms of amyloid inhibitors. Chem. Commun. 2018, 54, 4644–4652. [Google Scholar] [CrossRef] [PubMed]
- Petkova, A.T.; Ishii, Y.; Balbach, J.J.; Antzutkin, O.N.; Leapman, R.D.; Delaglio, F.; Tycko, R. A structural model for Alzheimer’s β–amyloid fibrils based on experimental constraints from solid state NMR. Proc. Natl. Acad. Sci. USA 2002, 99, 16742–16747. [Google Scholar] [CrossRef] [PubMed] [Green Version]
- Bertini, I.; Gonnelli, L.; Luchinat, C.; Mao, J.; Nesi, A. A new structural model of Aβ 40 fibrils. J. Am. Chem. Soc. 2011, 133, 16013–16022. [Google Scholar] [CrossRef]
- Paravastu, A.K.; Petkova, A.T.; Tycko, R. Polymorphic fibril formation by residues 10–40 of the Alzheimer’s β–amyloid peptide. Biophys. J. 2006, 90, 4618–4629. [Google Scholar] [CrossRef] [Green Version]
- Friedemann, M.; Helk, E.; Tiiman, A.; Zovo, K.; Palumaa, P.; Tõugu, V. Effect of methionine–35 oxidation on the aggregation of amyloid–β peptide. Biochem. Biophys. Rep. 2015, 3, 94–99. [Google Scholar] [CrossRef] [Green Version]
- Liu, F.-F.; Dong, X.-Y.; He, L.; Middelberg, A.P.J.; Sun, Y. Molecular Insight into Conformational Transition of Amyloid β–Peptide 42 Inhibited by (−)–Epigallocatechin-3-gallate Probed by Molecular Simulations. J. Phys. Chem. B 2011, 115, 11879–11887. [Google Scholar] [CrossRef]
- Ahmed, R.; VanSchouwen, B.; Jafari, N.; Ni, X.; Ortega, J.; Melacini, G. Molecular Mechanism for the (−)–Epigallocatechin Gallate–Induced Toxic to Nontoxic Remodeling of Aβ Oligomers. J. Am. Chem. Soc. 2017, 139, 13720–13734. [Google Scholar] [CrossRef]
- Orteca, G.; Tavanti, F.; Bednarikova, Z.; Gazova, Z.; Rigillo, G.; Imbriano, C.; Basile, V.; Asti, M.; Rigamonti, L.; Saladini, M.; et al. Curcumin derivatives and Aβ–fibrillar aggregates: An interactions’ study for diagnostic/therapeutic purposes in neurodegenerative diseases. Bioorganic Med. Chem. 2018, 26, 4288–4300. [Google Scholar] [CrossRef]
- Schmid, N.; Eichenberger, A.P.; Choutko, A.; Riniker, S.; Winger, M.; Mark, A.E.; van Gunsteren, W.F. Definition and testing of the GROMOS force–field versions 54A7 and 54B7. Eur. Biophys. J. 2011, 40, 843–856. [Google Scholar] [CrossRef] [PubMed]
- Somavarapu, A.K.; Kepp, K.P. The Dependence of Amyloid–β Dynamics on Protein Force Fields and Water Models. ChemPhysChem 2015, 16, 3278–3289. [Google Scholar] [CrossRef] [PubMed]
- Toxvaerd, S.; Heilmann, O.J.; Dyre, J.C.; Abraham, M.J.; Murtola, T.; Schulz, R.; Páll, S.; Smith, J.C.; Hess, B.; Lindah, E. Gromacs: High performance molecular simulations through multi–level parallelism from laptops to supercomputers. SoftwareX 2012, 1–2, 19–25. [Google Scholar] [CrossRef] [Green Version]
- Abraham, M.; Van Der Spoel, D.; Lindahl, E.; Hess, B.; van der Spoel, D.; Lindahl, E. GROMACS User Manual Version 5.0.4. Available online: www.Gromacs.Org (accessed on 1 June 2019).
- Malde, A.K.; Zuo, L.; Breeze, M.; Stroet, M.; Poger, D.; Nair, P.C.; Oostenbrink, C.; Mark, A.E. An Automated Force Field Topology Builder (ATB) and Repository: Version 1.0. J. Chem. Theory Comput. 2011, 7, 4026–4037. [Google Scholar] [CrossRef]
- Koziara, K.B.; Stroet, M.; Malde, A.K.; Mark, A.E. Testing and validation of the Automated Topology Builder (ATB) version 2.0: Predict. of hydration free enthalpies. J. Comput.—Aided Mol. Des. 2014, 28, 221–233. [Google Scholar] [CrossRef]
- Berman, H.M.; Westbrook, J.; Feng, Z.; Gilliland, G.; Bhat, T.N.; Weissig, H.; Shindyalov, I.N.; Bourne, P.E. The Protein Data Bank. Nucleic Acids Res. 2000, 28, 235–242. [Google Scholar] [CrossRef] [Green Version]
- Richard, T.; Papastamoulis, Y.; Waffo-Teguo, P.; Monti, J.-P. 3D NMR structure of a complex between the amyloid beta peptide (1–40) and the polyphenol ε–viniferin glucoside: Implications in Alzheimer’s disease. Biochim. Et Biophys. Acta (BBA)—Gen. Subj. 2013, 1830, 5068–5074. [Google Scholar] [CrossRef]
- Brännström, K.; Islam, T.; Sandblad, L.; Olofsson, A. The role of histidines in amyloid β fibril assembly. FEBS Lett. 2017, 591, 1167–1175. [Google Scholar] [CrossRef] [Green Version]
- Xing, X.; Zhao, W.; Hu, D.; Kang, B.; Shi, H.; Lee, J.Y.; Ai, H. Tautomerization Effect of Histidines on Oligomer Aggregation of β–Amyloid(1–40/42) during the Early Stage: Tautomerism Hypothesis for Misfolding Protein Aggregation. ACS Chem. Neurosci. 2019, 10, 2602–2608. [Google Scholar] [CrossRef]
- Shi, H.; Lee, J.Y. Tautomeric Effect of Histidine on the Monomeric Structure of Amyloid β–Peptide(1–42). ACS Chem. Neurosci. 2017, 8, 669–675. [Google Scholar] [CrossRef]
- Berendsen, H.J.C.; Postma, J.P.M.; van Gunsteren, W.F.; Hermans, J. Interaction Models for Water in Relation to Protein Hydration. In Intermolecular Forces; Pullman, B., Ed.; Springer: Berlin/Heidelberg, Germany, 1981; pp. 331–342. ISBN 978-90-481-8368-5. [Google Scholar]
- Darden, T.; York, D.; Pedersen, L. Particle mesh Ewald: An N·log(N) method for Ewald sums in large systems. J. Chem. Phys. 1993, 98, 10089–10092. [Google Scholar] [CrossRef] [Green Version]
- Lee, H.; Pedersen, L.G.; Essmann, U.; Darden, T.; Perera, L.; Berkowitz, M.L. A smooth particle mesh Ewald method. J. Chem. Phys. 2002, 103, 8577–8593. [Google Scholar] [CrossRef] [Green Version]
- Liu, P.; Kim, B.; Friesner, R.A.; Berne, B.J. Replica exchange with solute tempering: A method for sampling biological systems in explicit water. Proc. Natl. Acad. Sci. USA 2005, 102, 13749–13754. [Google Scholar] [CrossRef] [PubMed] [Green Version]
- Kumari, R.; Kumar, R.; Lynn, A. G–mmpbsa –A GROMACS tool for high–throughput MM–PBSA calculations. J. Chem. Inf. Modeling 2014, 54, 1951–1962. [Google Scholar] [CrossRef]
- Baron, R.; Hünenberger, P.H.; McCammon, J.A. Absolute single–molecule entropies from quasi–harmonic analysis of microsecond molecular dynamics: Correction terms and convergence properties. J. Chem. Theory Comput. 2009, 59, 2859–2870. [Google Scholar] [CrossRef]
- Shrake, A.; Rupley, J.A. Environment and exposure to solvent of protein atoms. Lysozyme and insulin. J. Mol. Biol. 1973, 79, 351–371. [Google Scholar] [CrossRef]
- Sitkoff, D.; Sharp, K.A.; Honig, B. Accurate calculation of hydration free energies using macroscopic solvent models. J. Phys. Chem. 1994, 98, 1978–1988. [Google Scholar] [CrossRef]
- Tavanti, F.; Pedone, A.; Matteini, P.; Menziani, M.C.M.C. Computational Insight into the Interaction of Cytochrome C with Wet and PVP–Coated Ag Surfaces. J. Phys. Chem. B 2017, 121, 9532–9540. [Google Scholar] [CrossRef]
- Sharp, K.A.; Honig, B. Electrostatic interactions in macromolecules: Theory and applications. Annu. Rev. Biophys. Biophys. Chem. 1990, 19, 301–332. [Google Scholar] [CrossRef]
- Joosten, R.P.; Te Beek, T.A.H.; Krieger, E.; Hekkelman, M.L.; Hooft, R.W.W.; Schneider, R.; Sander, C.; Vriend, G. A series of PDB related databases for everyday needs. Nucleic Acids Res. 2011, 39, D411–D419. [Google Scholar] [CrossRef] [Green Version]
© 2020 by the authors. Licensee MDPI, Basel, Switzerland. This article is an open access article distributed under the terms and conditions of the Creative Commons Attribution (CC BY) license (http://creativecommons.org/licenses/by/4.0/).


