Review

Current Methods of Magnetic Resonance for Noninvasive Assessment of Molecular Aspects of Pathoetiology in Multiple Sclerosis

1
Biomedical Center Martin, Jessenius Faculty of Medicine in Martin, Comenius University in Bratislava, 036 01 Martin, Slovakia
2
Clinic of Neurology, Jessenius Faculty of Medicine in Martin, Comenius University in Bratislava, 036 01 Martin, Slovakia
3
Clinic of Radiology, Jessenius Faculty of Medicine in Martin, Comenius University in Bratislava, 036 01 Martin, Slovakia
*
Author to whom correspondence should be addressed.
Int. J. Mol. Sci. 2020, 21(17), 6117; https://0-doi-org.brum.beds.ac.uk/10.3390/ijms21176117
Submission received: 19 June 2020 / Revised: 13 August 2020 / Accepted: 21 August 2020 / Published: 25 August 2020

Abstract

:
Multiple sclerosis (MS) is an autoimmune disease with expanding axonal and neuronal degeneration in the central nervous system leading to motoric dysfunctions, psychical disability, and cognitive impairment during MS progression. The exact cascade of pathological processes (inflammation, demyelination, excitotoxicity, diffuse neuro-axonal degeneration, oxidative and metabolic stress, etc.) causing MS onset is still not fully understood, although several accompanying biomarkers are particularly suitable for the detection of early subclinical changes. Magnetic resonance (MR) methods are generally considered to be the most sensitive diagnostic tools. Their advantages include their noninvasive nature and their ability to image tissue in vivo. In particular, MR spectroscopy (proton 1H and phosphorus 31P MRS) is a powerful analytical tool for the detection and analysis of biomedically relevant metabolites, amino acids, and bioelements, and thus for providing information about neuro-axonal degradation, demyelination, reactive gliosis, mitochondrial and neurotransmitter failure, cellular energetic and membrane alternation, and the imbalance of magnesium homeostasis in specific tissues. Furthermore, the MR relaxometry-based detection of accumulated biogenic iron in the brain tissue is useful in disease evaluation. The early description and understanding of the developing pathological process might be critical for establishing clinically effective MS-modifying therapies.

1. Introduction

Multiple sclerosis (MS) is a multifactorial neurodegenerative disease that affects over 2.5 million individuals worldwide [1,2]. It is the most common cause of neurologic disability in young adults [3,4]. The traditional “outside-in” hypothesis of MS etiology is based on an autoimmune provenance whereby dysregulated auto-reactive T cells in the periphery cross into the central nervous system (CNS) and, together with macrophages and B cells, proceed to attack predominantly myelin elements [1,5,6]. Ongoing inflammation then results in a relapsing–remitting clinical course and fundamentally contributes to comprehensive CNS injury [4,7]. However, in recent years, an alternative “inside-out” MS-caused hypothesis that proposes initial multifunctional failures within the CNS has come to the fore. MS is suspected of being a primary degenerative disease linked with local inflammation, leading to the release of antigenic cell components such as myelin oligodendrocyte glycoprotein, myelin basic protein, and proteolipid protein [6,8,9]. However, its diagnosis and treatment strategies are complicated by the presence of disease heterogeneity with distinct courses and diverse therapy responses. Patients are diagnosed as having early MS (formerly clinicaly isolated syndrome suspected of being MS (CIS)), clinicaly definite multiple sclerosis (CDMS), relapsing-remitting multiple sclerosis (RRMS), progressive-relapsing MS (PRMS), and primary- and secondary-progressive multiple sclerosis (PPMS, SPMS) [2,4,10]. Moreover, the disease causes variable degrees of motor, sensory, behavioral, mental, emotional, and cognitive impairment [11,12,13].
MS is predominately characterized as an inflammatory disease of the CNS involving the initiation of myelin loss and of axonal and neuronal damage leading to progressive neurological dysfunction [8,14]. However, recent research has shown that the neurodegenerative process is not clearly related to inflammatory lesions but is instead associated with diffuse neuro-axonal loss caused by various pathological phenomena [9,14]. Some authors have suggested that a cell-mediated autoimmune response occurs against extraneous or even the body’s own components, with the consequent damage of oligodendrocytes and progressive axonal degeneration [10,15]. One mechanism of this neurodegeneration might be associated with the production of reactive oxygen species from activated microglia and macrophages with a subsequent inadequate energy supply to the CNS [9,16]. Morphological and biochemical changes have been described in the tissue in conjunction with an intracellular accumulation of iron ions suggesting the occurrence of programmed cell death-apoptosis [17,18]. Moreover, ferroptosis as non-apoptotic and iron-dependent programmed cell death is now being considered, since inflammatory demyelination is consistent with ferroptotic damage [19]. The excessive iron accumulation might be caused by slowing intracellular metabolism and by the aggravation of waste product removal [2,12]. However, whether the iron accumulation is the initial cause or a result of the pathology remains unknown. Neuronal dysfunction might also be initiated by enhanced glutamate neuro-excitation, so-called glutamate excitotoxicity [13,20]. In these specific circumstances, glutamate, an essential mediator of excitation, might be a co-founder of oxidative and metabolic stress and then contribute to neuronal damage in MS [12,21]. Furthermore, gray matter (GM) changes have been found to have a higher impact on the progression, physical disability, and cognitive impairment of MS in comparison with white matter (WM) demyelination [9,14,22]. Nevertheless, initial injuries to GM have been proposed to extend strongly in the early stage of MS [12,14]. In recent years, disease progression markers have been researched, particularly those suitable for the detection of early subclinical changes [18,23,24].
To date, magnetic resonance (MR) methods are considered to be the most sensitive and crucial in the diagnosis of MS [2,14,25]. In particular, MR spectroscopy (MRS) allows the noninvasive quantification of biomedically relevant metabolites, amino acids, and bioelements and their metabolic alternations in tissue in vivo [25,26]. Increasing importance has also been attached to MR imaging (MRI) techniques that have been shown to be highly sensitive in evaluating disease burden. Notably, iron accumulation can be detected in brain tissue based on altered T2 relaxation times [18,27]. In view of the expansion of new disease-modifying therapies available for MS treatment, an understanding of the pathological processes associated with disease progression has become important, as has the identification of new meaningful noninvasive radiological biomarkers for evaluating the clinical efficacy of treatments.

2. General MRI Techniques

For the clinical prognosis of MS, MR imaging techniques have an undisputed contribution, especially as a diagnostic tool for the visualization of MS lesions [28,29,30]. The gold standard for the detection of lesion load is T2-weighted MRI and fluid-attenuated inversion recovery (FLAIR) sequences. Currently, the preferable FLAIR provides a suppression of the signal from the cerebrospinal fluid and thus enables the better delineation of the periventricular and cortical/juxtacortical lesions at the expense of decreased lesion conspicuity in the posterior fossa or spinal cord compared with T2-weighted spin-echo sequences [28,29,30]. Furthermore, an excellent method suitable for the monitoring of disease activity manifesting as the appearance, recurrence, or extension of MS lesions is T1-weighed MRI after the intravenous injection of contrast medium, i.e., gadolinium (Gd)-enhanced MRI. Whereas the Gd-based contrast agents have revealed the breakdown of the blood–brain barrier in acute inflammatory lesions such as T1-hypointense (precontrast images)/T1-hyperintense (Gd-enhanced lesion) areas, the T2-hyperintense areas might indicate edema, gliosis, or axonal demyelination [28,31]. The evaluation of the contrast enhancement of T1-hypointensities enables pathological severity to be assessed [28,30]. Focal acute inflammatory regions are visible, which resolve over six months, in addition to persistent chronic lesions representing irreversible demyelination and axonal loss [28,30]. In the case of MS, such an assessment might be helpful for evaluating brain and spinal cord atrophy, which is usually quantified on T1-weighted images [29]. However, the annual rate of MS brain tissue loss is around 0.5–1% [28,29] and can vary during various destructive pathological processes, including demyelination, edema, neuro-axonal destruction, inflammation, or a reduction in water content. Generally, GM atrophy is more associated with MS progression and physical and cognitive disability than WM loss [28,29]. Furthermore, several adapted MRI techniques exist that allow a weighted MR-signal to be obtained that is based on disturbances in the structure (magnetization transfer MRI) and movements (diffusion MRI) of molecules or changes in the local tissue environment (susceptibility-weighted MRI), blood flow (perfusion MRI), and oxygenation (functional MRI), which can improve MS assessment (Table 1).
-
Magnetization transfer MRI is based on the interactions that occur between free-water protons and protons bound to macromolecules and that are typically evaluated as their quantitative ratio/magnetization transfer ratio [29,32]. This technique reveals subtle brain tissue integrity loss during MS progression better than conventional MRI [28]. The magnetization transfer ratio has been demonstrated continuously to decrease in MS lesions and normal-appearing WM (NAWM) and has been related to the percentage of residual axons and the degree of myelin content [28,31].
-
Diffusion-weighted MRI is a suitable method for the measurement of the water molecule motion in tissue, especially in the WM, in which water diffusion is preferably oriented along the axons and thus follows the WM tracts [29]. Any neuronal tract failure or axonal membrane permeability disruption should lead to an increase in the mean diffusivity (the averaged molecular motion) and to a decrease in the fractional anisotropy (the directional preponderance), as reported in chronic MS lesions and NAWM [28,31,33].
-
Susceptibility-weighted MRI enhances the inhomogeneity of the magnetic field caused by the paramagnetic properties of venous deoxygenated hemoglobin and other nonheme iron, all of which affect the local magnetic susceptibility in the MS brain [29]. The highest potential of this technique is in the long-term monitoring of the disturbed microenvironment of MS lesions and veins, showing an increasing trend in the accumulation of iron deposits in these areas [28].
-
Cerebral perfusion MRI provides information on capillary microcirculation in the tissue based on generating a blood flow contrast between multiple images by using a wide variety of blood-labeling methods such as exogenous tracers (Gd-contrast agent) or water protons from the arterial blood (arterial spin labeling) [32]. Perfusion studies reveal increased perfusion in acute inflammatory MS lesions, and thus vasodilation and decreased cerebral blood flow in non-enhancing persisting MS lesions [28,32]. Perfusion is also altered in NAWM and in cortical and subcortical GM, reflecting not only microvascular abnormalities, but also tissue degradation and blood–brain barrier permeability failure [28].
-
Functional MRI enables the assessment of brain activation manifesting as differences in the deoxyhemoglobin concentration in the blood in activated brain areas, in response to the applied motor or visual stimuli [30,32]. Observed abnormalities in MS patients usually occur in the visual, cognitive, and motor systems with early manifestation, and tend to vary throughout the disease [28].

Limitations of General MRI Techniques

Generally, MRI diagnostic techniques have a high sensitivity for MS lesion detection; however, they have a relatively poor pathological specificity and prognostic value [29,30]. Despite the T2-hyperintense lesion load and Gd-enhanced lesions being the cornerstones of MS diagnosis, they show only a weak correlation with clinical status, cognitive dysfunction, or neurological impairment [29,34]. Furthermore, the primary MRI diagnostic efficacy depends on precise image analysis and careful clinical presentation, utilizing the increasingly stringent MRI criteria for MS staging. Moreover, health risks have to be taken into account when using Gd-based contrast agents (i.e., nephrogenic systemic fibrosis, retention of Gd). Even though these materials are beneficial in MS diagnosis, a trend is apparent to introduce novel contrast agents (e.g., ultrasmall superparamagnetic particles of iron oxide, myeloperoxidase, gadofluorine M [29,32]). However, appropriate validation and safety guarantees have to be ascertained before their clinical application. Many methods other than conventional MRI techniques are being investigated in order to obtain a better correlation with the clinical course of the disease and a more detailed quantification of MS pathological mechanisms.

3. Magnetic Resonance Spectroscopy
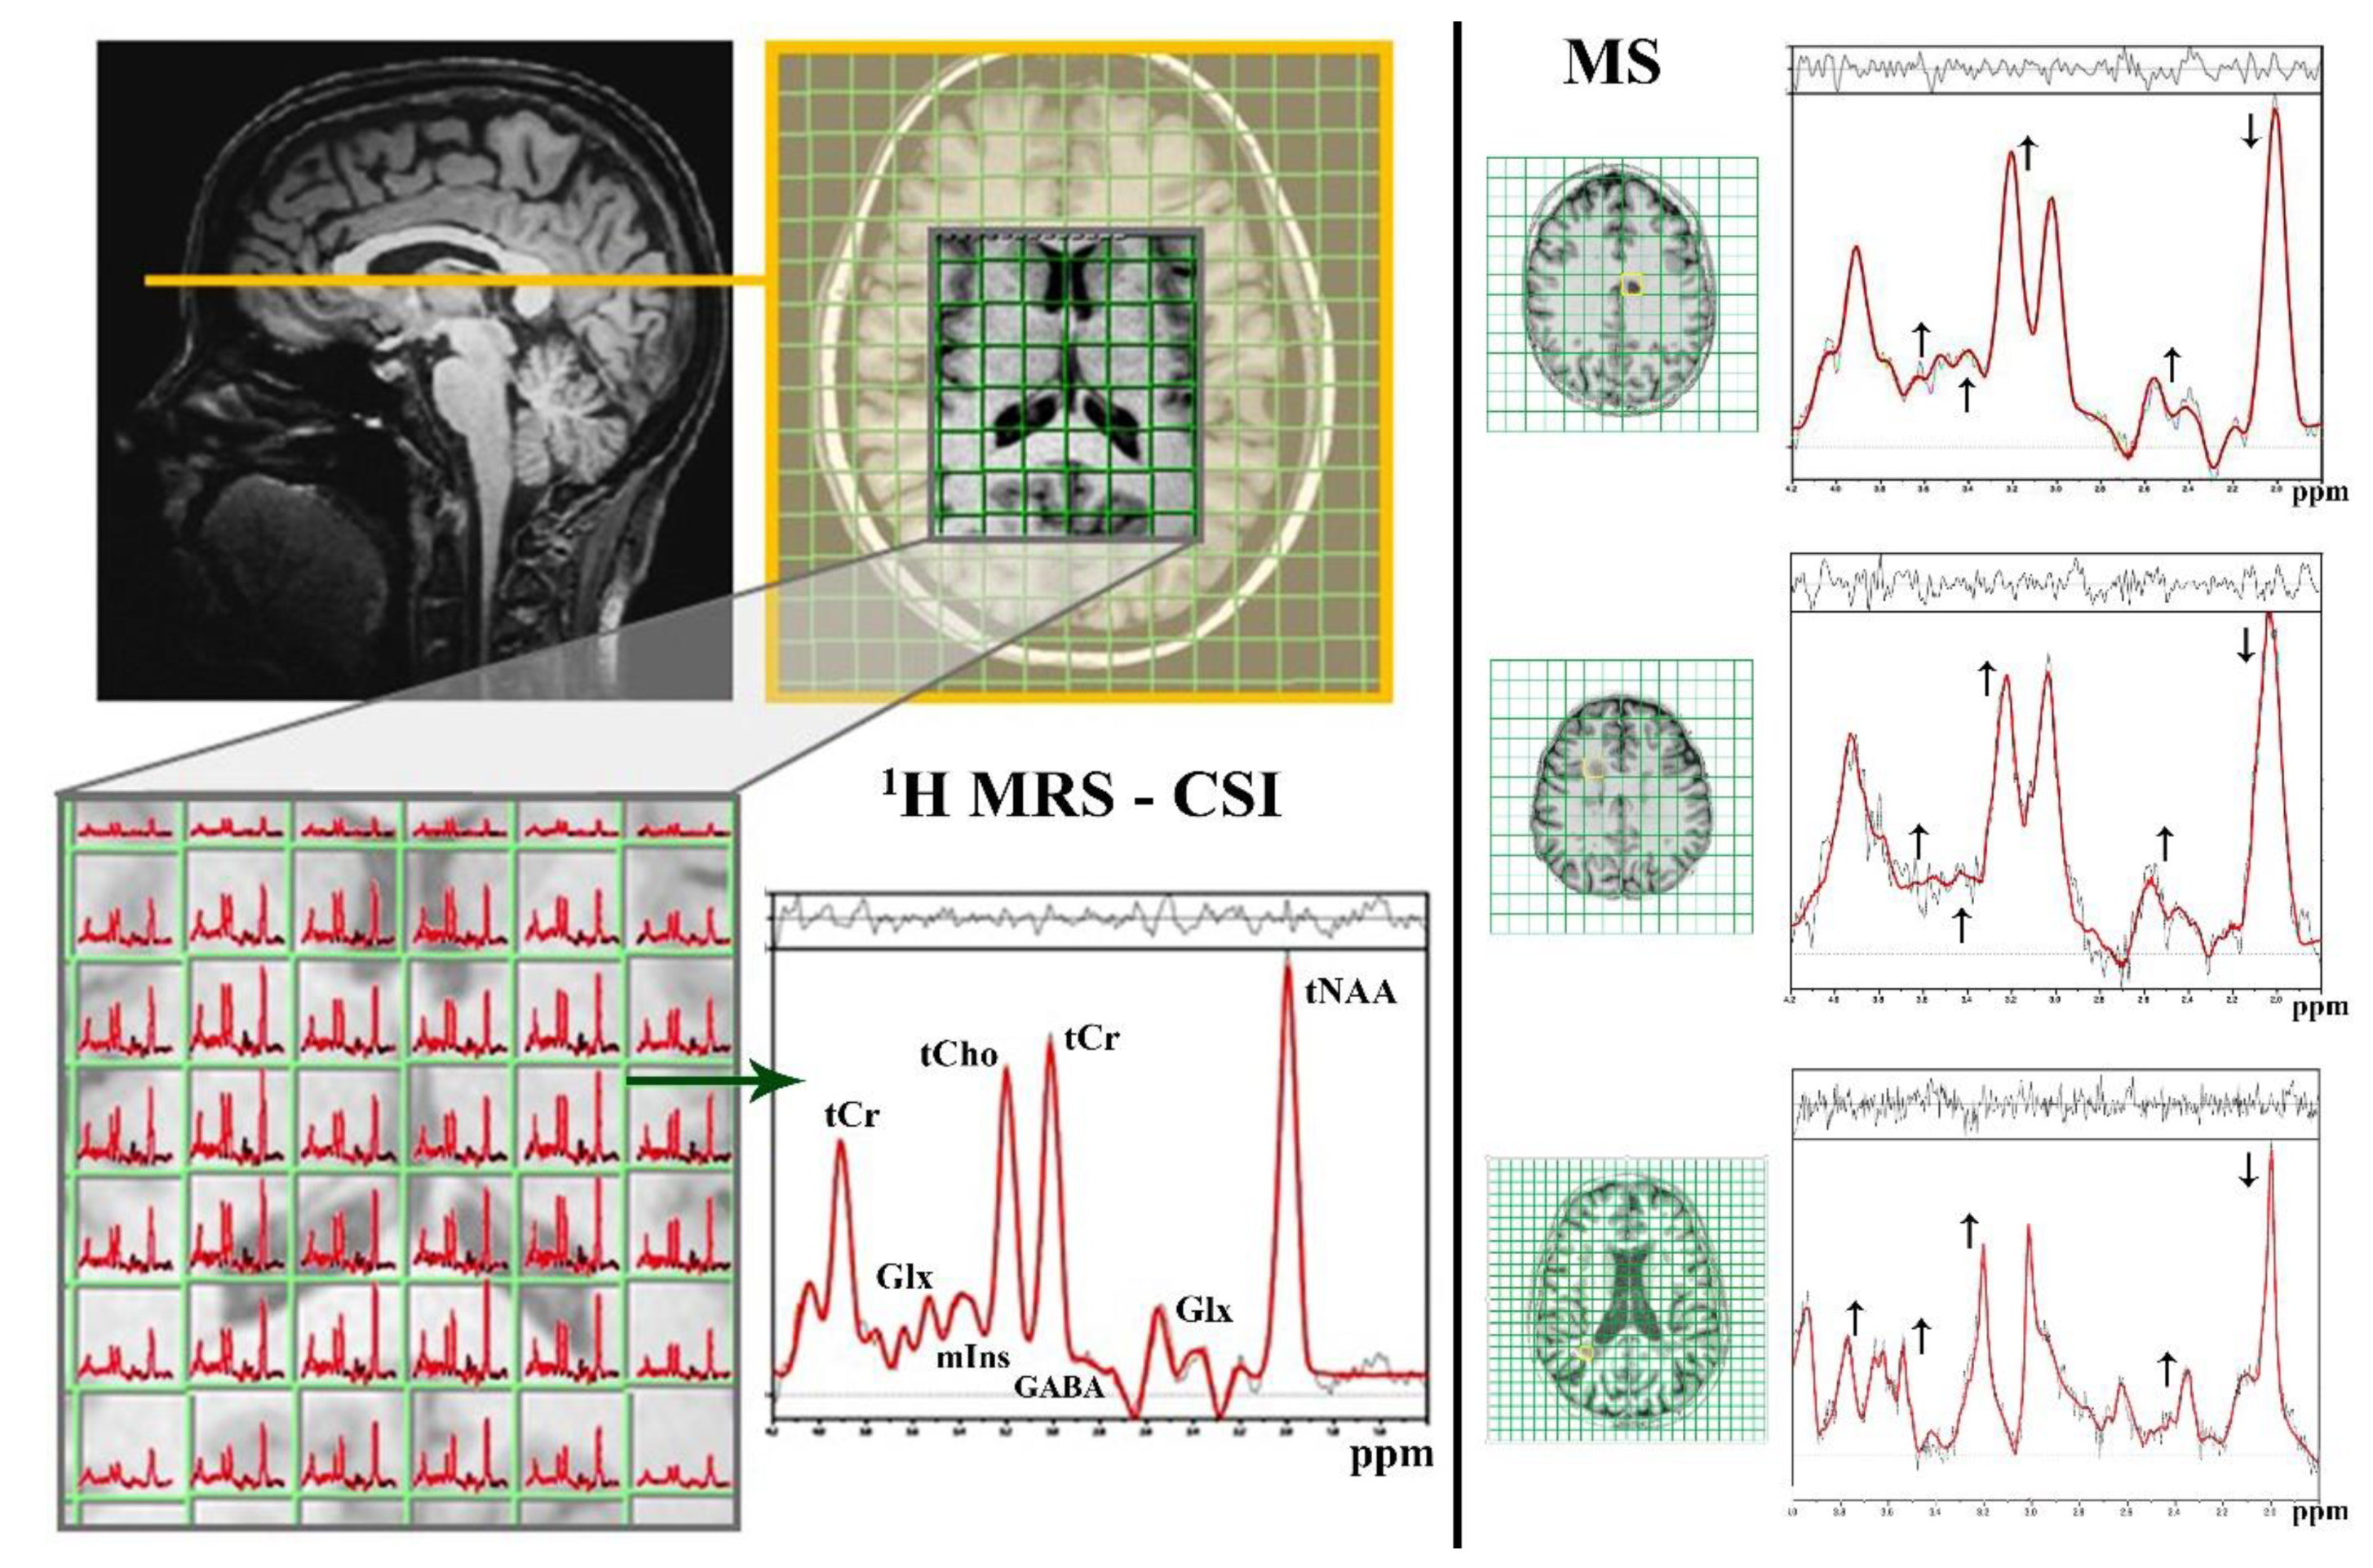
MRS is a noninvasive alternative MR technique that enables characteristic tissue biomarkers to be explored in vivo without the need for a biopsy [25,26]. The MR phenomenon is based on the magnetic nature of atoms and their behavior in magnetic fields. The nuclei of atoms with an odd mass number possess the quantum property of “spin”, which can be understood as the nucleus spinning around its own axis, always aligning along the axis of a constant magnetic field [26,35]. The application of an electromagnetic impulse at a suitable “resonance” frequency causes nuclear excitation, i.e., stimulates transitions between the high and low energy states of nuclei. During the subsequent relaxation, radiofrequency signals are generated that can be expressed as a frequency spectrum [11,35]. Signals from individual metabolites, whose molecules contain MR-visible nuclei, appear as spectral peaks resonating at discrete frequencies shown in parts per million (ppm). The clinical applicability of MRS is given mainly by its detection sensitivity for the measured nucleus and by its biological occurrence in the tissue [11,26]. Therefore, proton (1H) and phosphorus (31P) MRS are the most useful MRS methods for brain examinations. When an MRS measurement is being planned, one of the fundamental decisions is whether to acquire data from a single voxel (so-called single-voxel spectroscopy (SVS) or localized spectroscopy) or multiple voxels (so-called chemical shift imaging (CSI) or magnetic resonance spectroscopic imaging (MRSI)). Whereas the SVS method relatively easily acquires data from a small, well-shimmed, and compact region in a relatively short scan time, providing spectra with a high signal-to-noise ratio, CSI collects spectroscopic data from multiple, much smaller, individual voxels, covering a larger, heterogeneous tissue mass in a single measurement [26,35,36,37].

3.1. 1H MRS

Various signals can be detected based on 1H MRS (Figure 1): the signal attributable to N-acetyl-aspartate (NAA) and N-acetyl-aspartyl-glutamate (NAAG), usually evaluated as the joint tNAA peak; the signal for creatine-containing compounds (i.e., creatine and phosphocreatine) referred as tCr; the signal from molecules contributing to the total choline (tCho) peak (i.e., phosphatidylcholine, glycerophosphatidylcholine, acetylcholine, and choline); the signal from myoInositol (mIns); the signals from neurotransmitters such as glutamate and glutamine (usually evaluated as one-peak Glx); and the signal from γ-aminobutyric acid (GABA) [11,13,25]. In general, approximately 25 additional compounds can be assessed throughout the brain: aspartate, glutathione, taurine, ethanolamine, histidine, glycogen, lactate (detectable only during pathological increment), or mobile lipids (i.e., triacylglycerol and cholesterol esters accumulated in lipid droplets) [26,37,38,39,40]. These are difficult to detect routinely; furthermore, only rarely are they suggestive of MS manifestations [3,41].

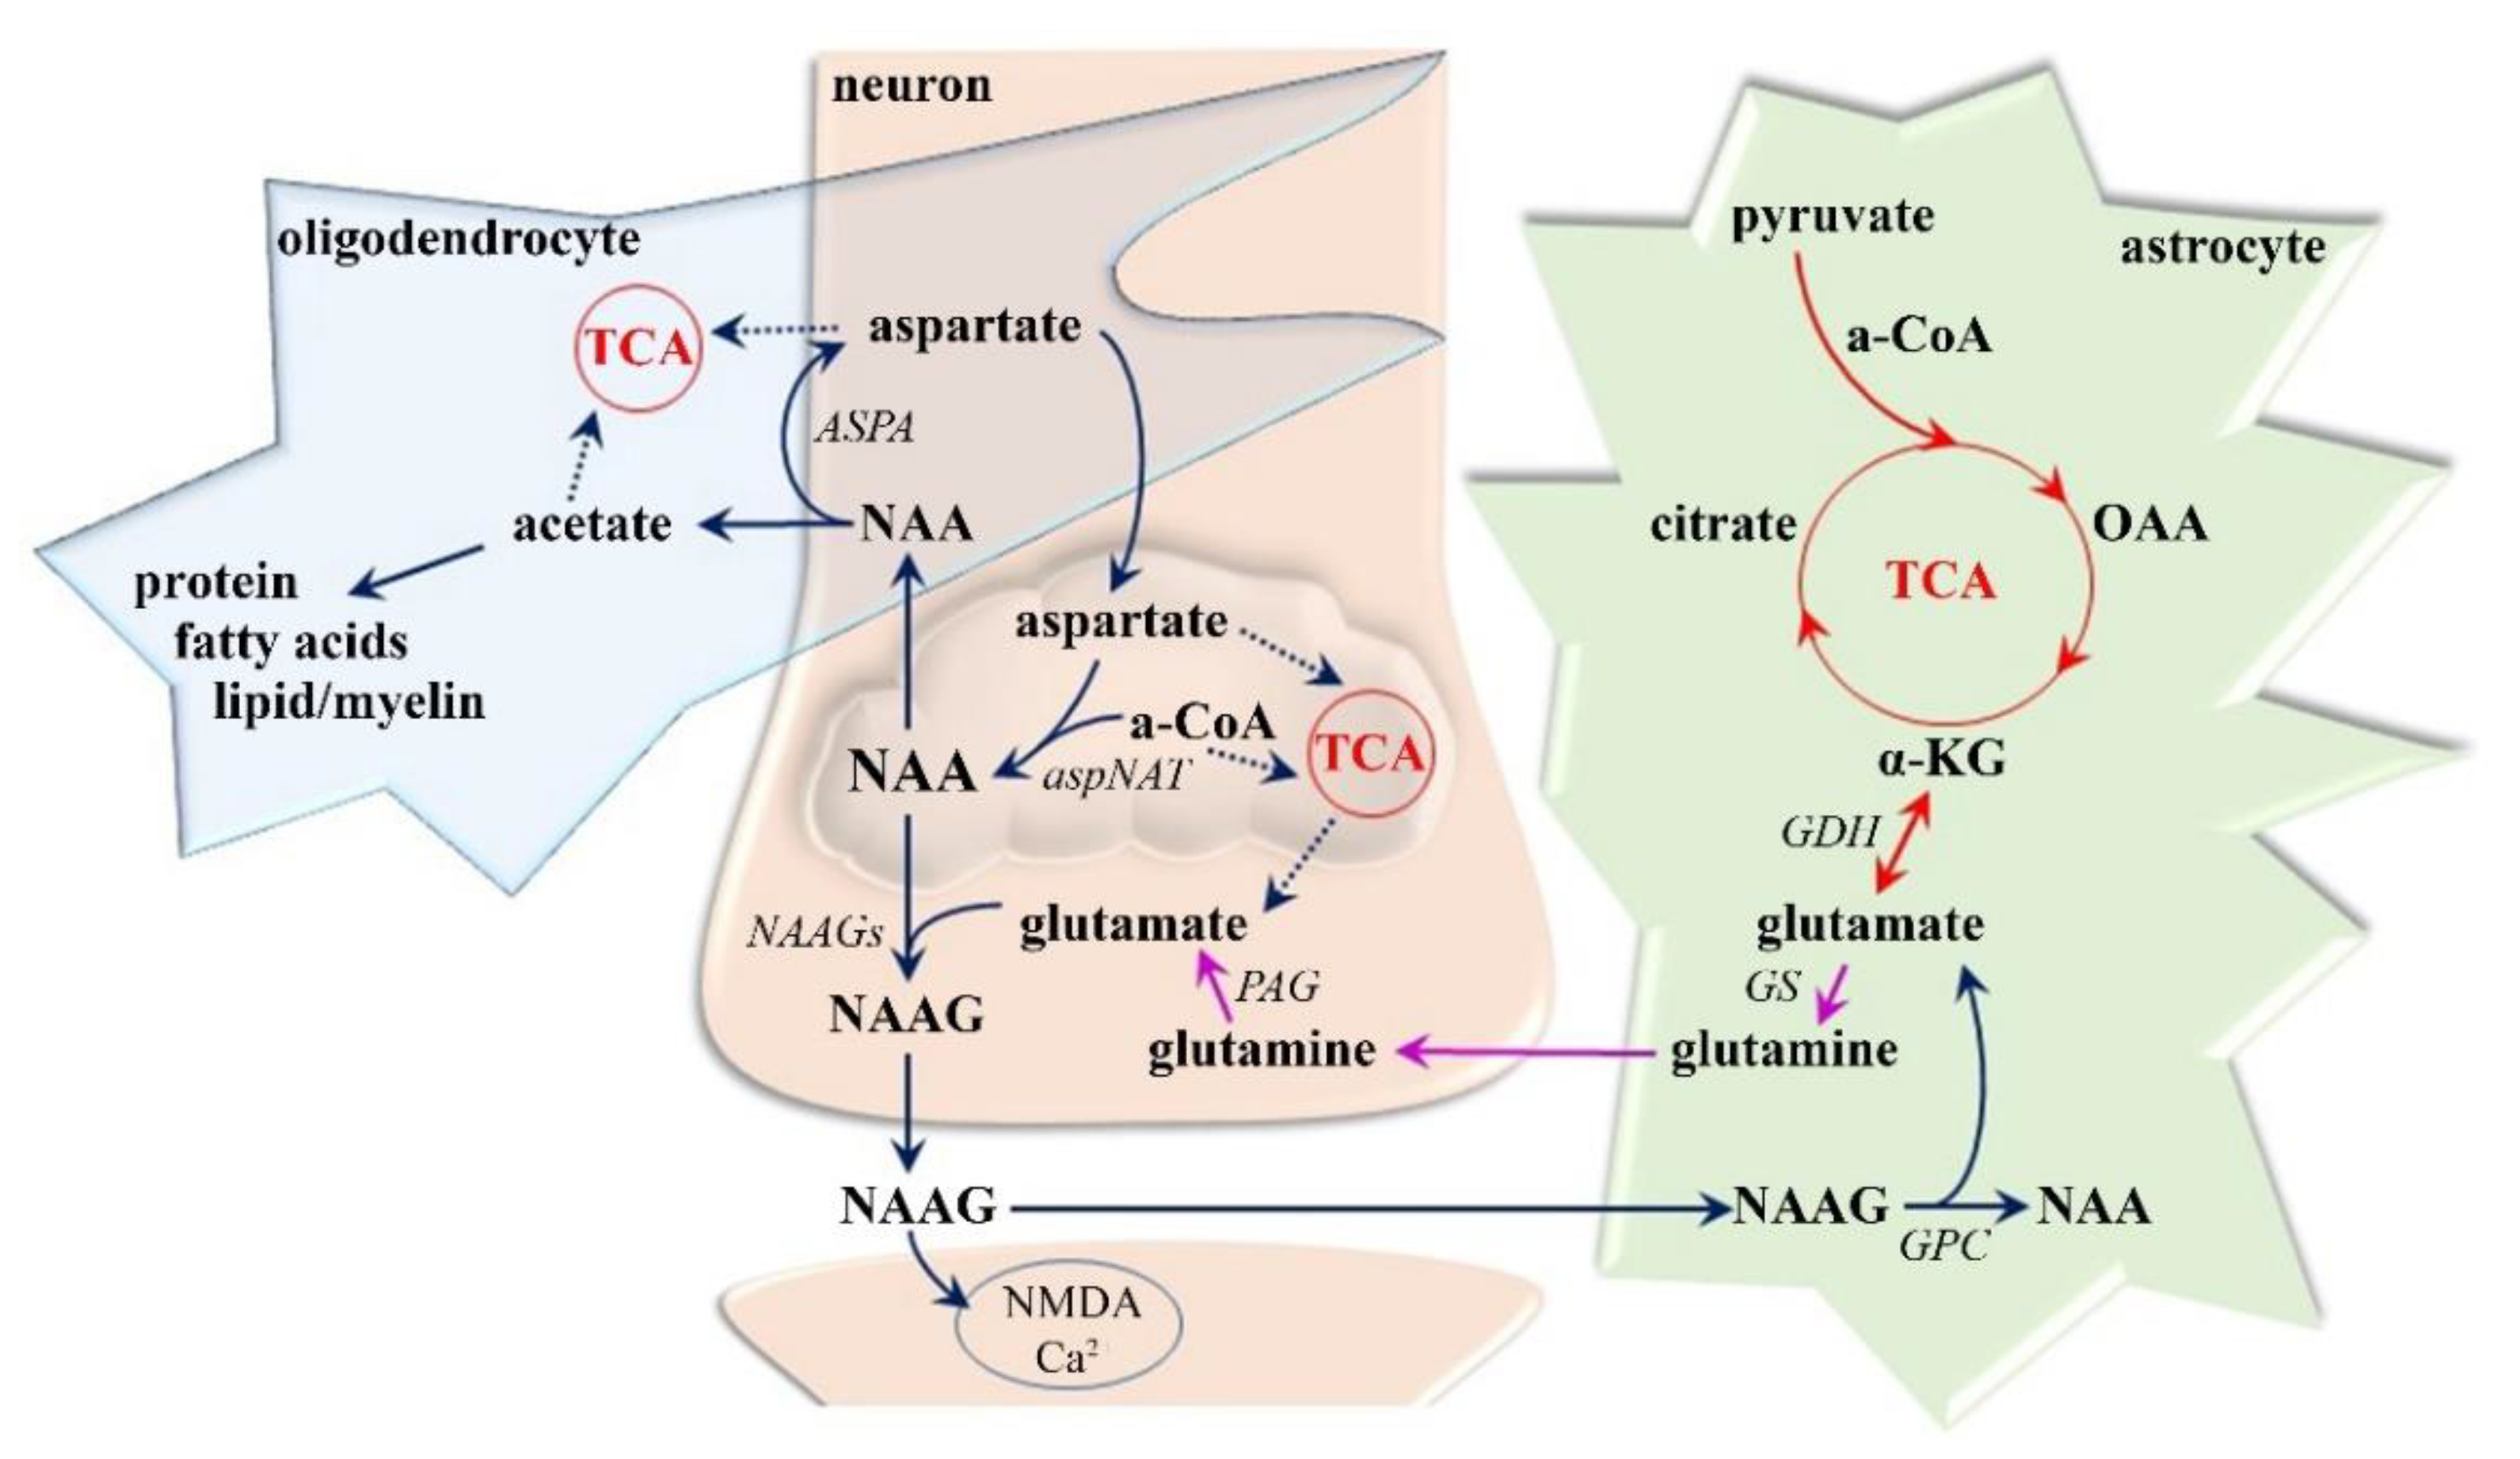
3.1.1. Neuro-Axonal Degradation

Despite NAA being one of the most concentrated (10–20 mM [42,43]) molecules in the CNS and despite its having been studied for more than five decades, its neurochemical functions, especially under pathological conditions, remain unclear [42,44]. As previously determined (Figure 2), NAA synthesis (via aspartate N-acetyltransferase) occurs exclusively in neuronal mitochondria, whereas NAA breakdown (via aspartoacylase) is a membrane-associated process localized predominantly in the oligodendrocytes [42,43,45]. Among its many biochemical features, NAA, is particularly important for the maintenance of neuro-glial signaling [42,44,46]. NAA has been proposed to be an intermediate metabolite in the formation of the not fully elucidated neurotransmitter NAAG [42,44,47], although NAAG reaches maximally 10% of the NAA concentration [43,46]. Therefore, NAA is thought to have a more crucial function as a reservoir for glutamate [43,47], which is the most abundant neurotransmitter in the human brain [12,13]. In particular, in times of dynamic glutamate replenishment, NAA can be converted to glutamate via dipeptide NAAG transformation (by carboxypeptidase expressed on the extracellular surface of astrocytes) [47,48] and an energetically favorable set of tricarboxylic acid (TCA cycle) reactions (α-ketoglutarate in neuronal mitochondria) [42,46]. Paradoxically, both NAA and NAAG are defined as (low affinity) agonists and antagonists at the main glutamate receptors, suggesting a primary role of NAA in avoiding myelin loss induced by glutamate overloading [48,49]. Moreover, NAA probably plays essential roles in neuronal osmoregulation, the secondary nitrogen removal system, mitochondrial bioenergetics maintenance, TCA cycle intermediate replacement, and lipid and protein synthesis including myelin formation in oligodendrocytes [41,43]. Given that NAA is considered to occur almost exclusively within neurons, axons, and dendrites [42,50], its peak in 1H MRS of the brain (Figure 1) is assumed to be a crucial biomarker of neuronal density and viability, a determinant of neuro-axonal functionality, and possibly an essential sign of irreversible disease progression [51,52].
The highest tNAA loss has been demonstrated to be the most marked in those patient groups with the most considerable neurological disability [25,50]. Furthermore, histopathology on biopsied brain tissues has confirmed reduced tNAA levels, notably in the acute phase of the disease [52,53]. Several MRS studies have reported a reduction in tNAA not only in acute MS lesions [50,51], but also in chronic MS lesions [25,54], indicating that axonal loss is characteristic in all types of MS lesions. However, decreased NAA levels have also been shown in other non-lesion brain areas such as NAWM and cortical GM in early RRMS [50,54], in the basal ganglia and thalamus in RRMS [55,56], and in the thalamus and hippocampus in PPMS [54,57]. Furthermore, a decline in tNAA ratios has been found in the hypothalamus of RRMS and SPMS and in early MS patients [24,52,58]. This is in agreement with observations of the cortical and subcortical demyelination that occurs during disease progression in GM structures, especially in the hippocampus, hypothalamus, thalamus, caudate, putamen, globus pallidus, and other structures of the basal ganglia [59,60,61]. Moreover, GM demyelination has recently been observed in biopsy material of an early MS patient, even before disseminated WM lesions become visible by MRI [5,7]. GM atrophy has been postulated to represent one of the earlier markers of degeneration in MS [62,63,64] and even seems to be a better marker of disease progression compared with whole-brain or the WM fraction [65,66,67], although factors other than demyelination might be responsible for GM atrophy. Axonal transection and neuronal, glial, and synaptic loss are also believed to be present in cortical GM lesions and might be responsible for cortical thinning in MS [9,60]. Furthermore, GM involvement has been demonstrated to precede WM damage and is associated with physical disability and cognitive impairment [22,64,65].
Based on 1H MRS, correlations have also been made between tNAA concentration and accompanying signs of the disease [50,68]. In particular, the reduction in tNAA in the frontal cingulate gyrus has been found to correlate with global memory functions in a group of early MS patients [60,69]. Lower tNAA in the tegmental pons of patients with RRMS has been associated with higher fatigue [70]. An inverse correlation of tNAA to disability has been observed in chronic lesions of RRMS, SPMS, and PPMS patients [25] and in the hypothalamus of patients in early MS stages [24]. Taken together, these data suggest that even a partial recovery of NAA levels can improve neuronal energetics, instigate remyelination, and support neuro-axonal integrity, thus relieving MS-associated symptoms. However, NAA-influencing medicaments (e.g., interferon beta-1b [71], glatiramer acetate [72], fluoxetine [73,74]) are still under examination.

3.1.2. Demyelization and Reactive Gliosis

The altered mIns and tCho signals in 1H MRS throughout the brain (Figure 1) are associated with cell membrane pathophysiology, ongoing inflammation processes, and disrupted neuroglial connections, which are all essential signs of MS progression [24,50]. Variations in both peaks are often reported in progressive MS stages [25,51,75] but are not limited to MS lesions; they involve NAWM [76,77] and deep GM, particularly in the thalamus and hippocampus [52,57].

tCho—Cell Membrane Predictor
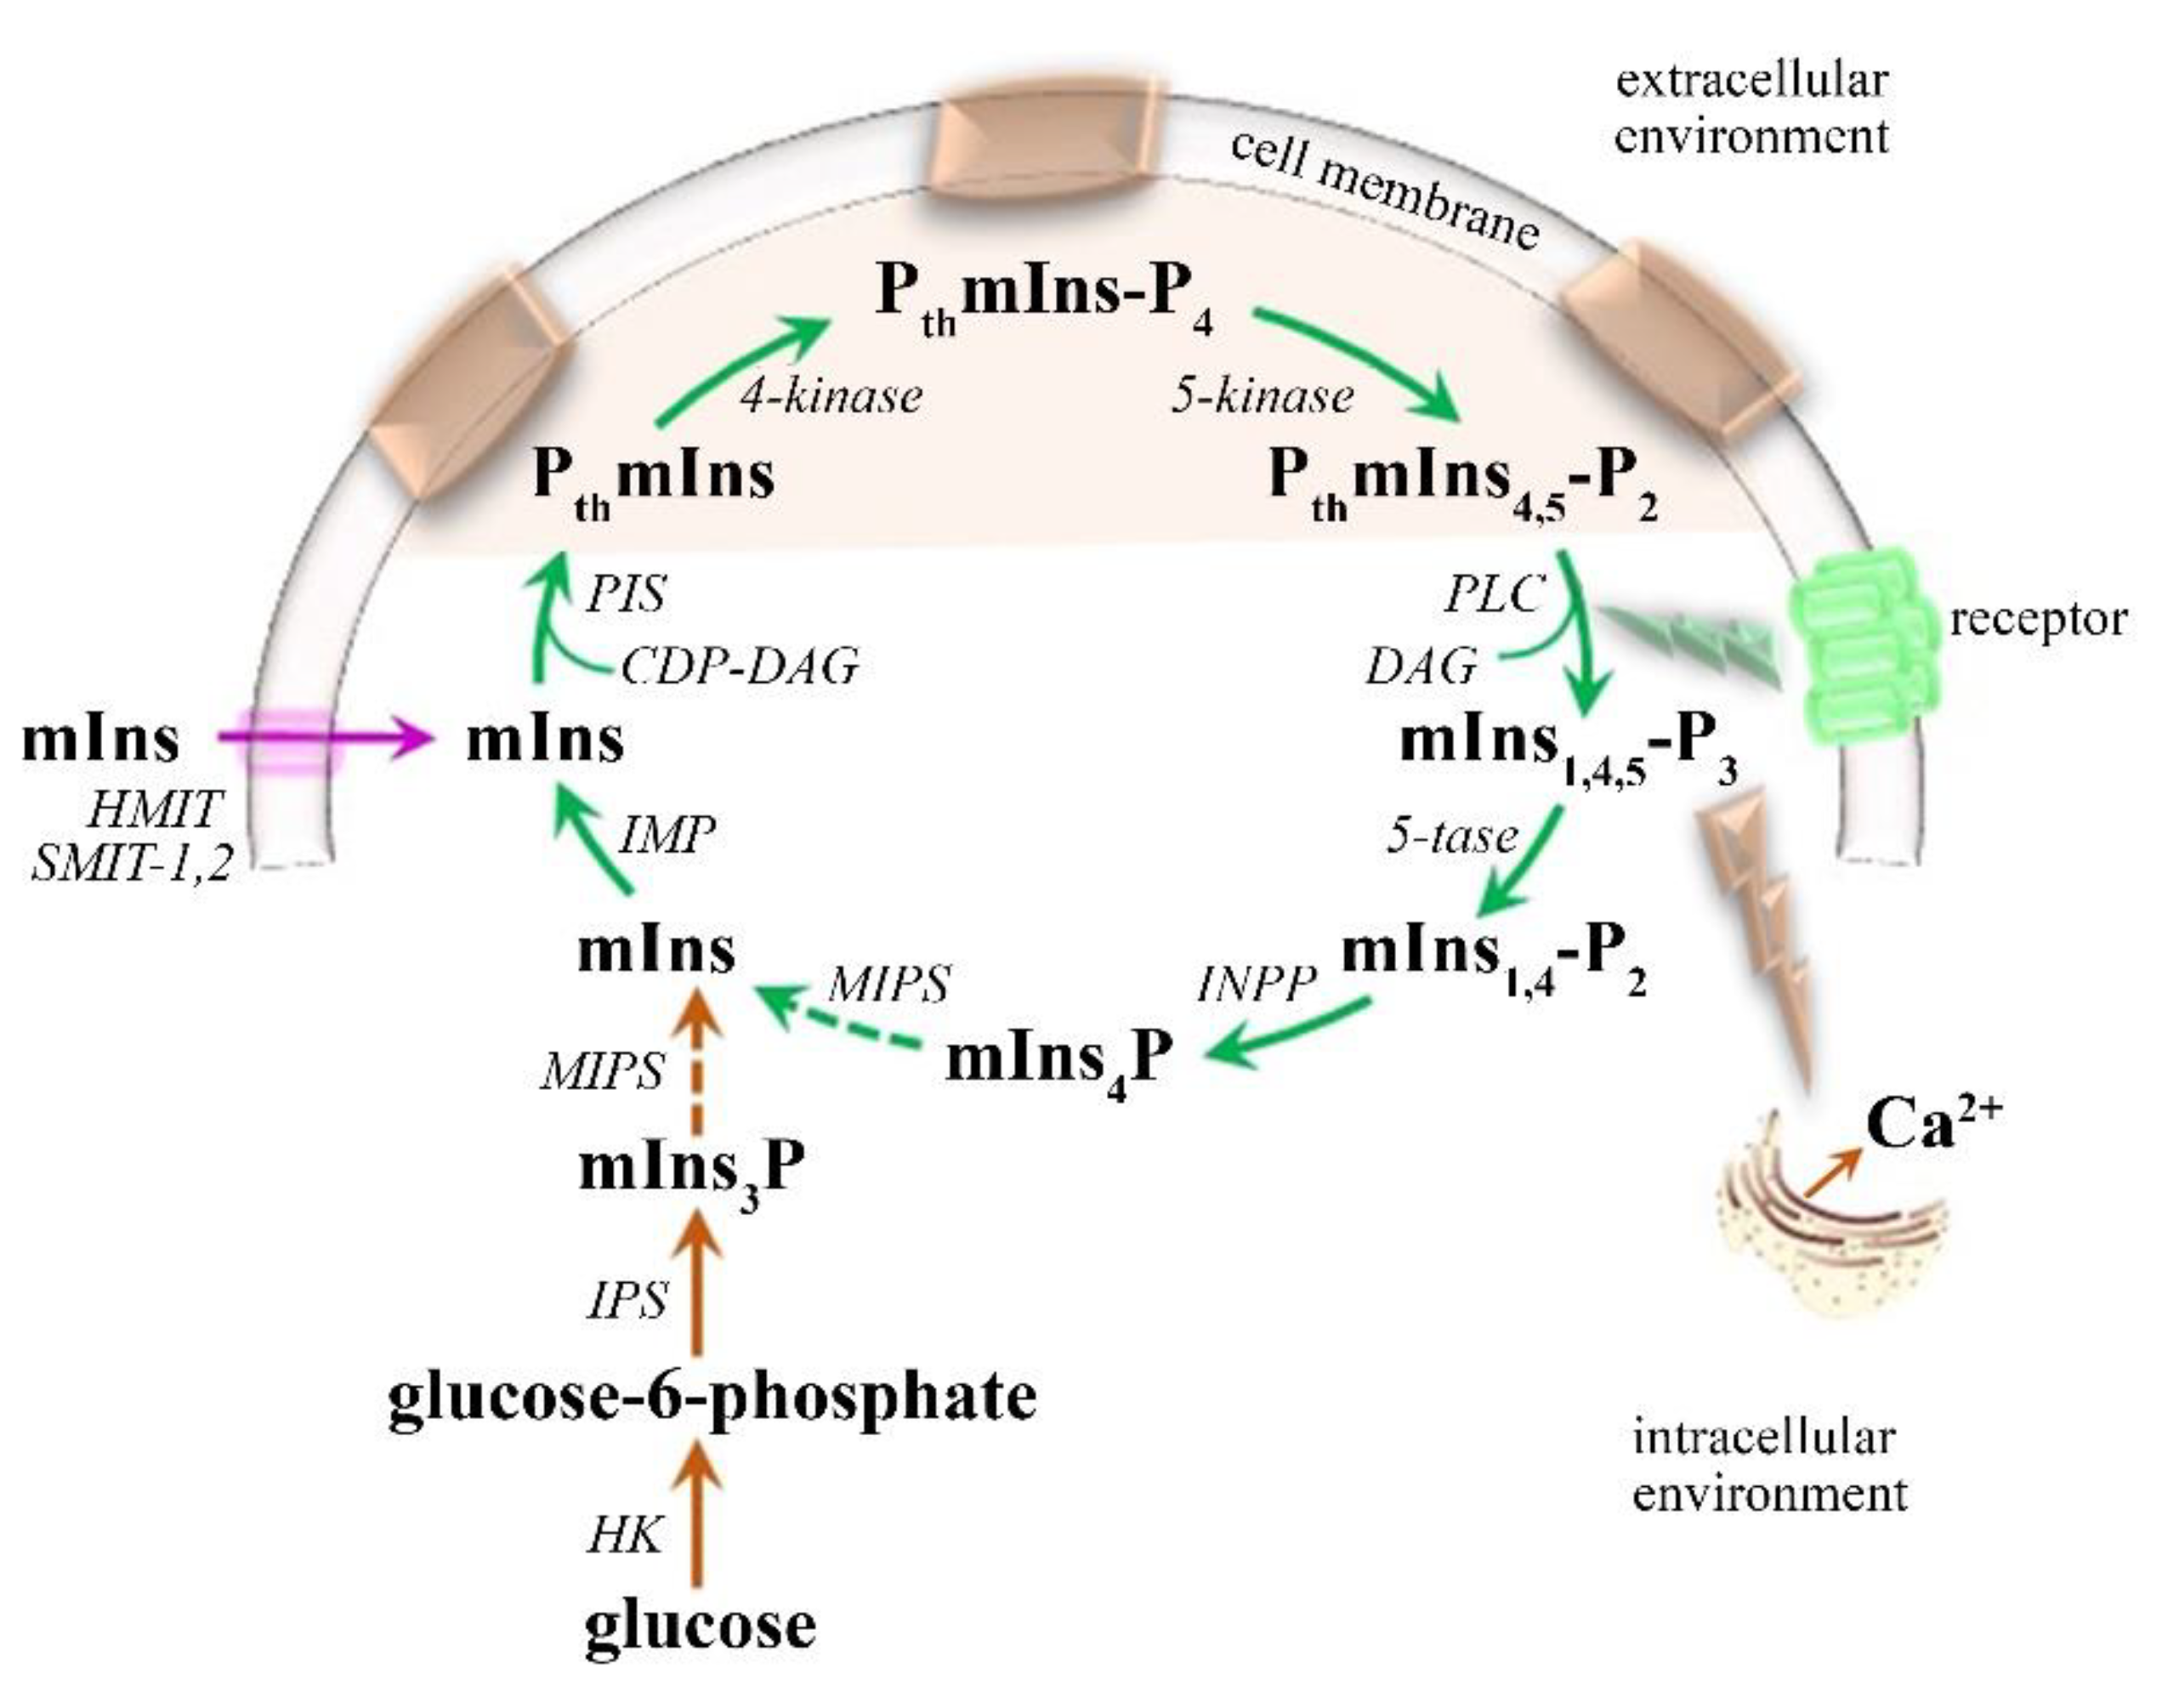
Whereas most of the tCho signals result from precursors (mainly phosphatidylcholine) and degradation products (mainly glycerophosphatidylcholine) of cell membrane phospholipids (especially the myelin sheet), tCho is generally recognized as a biomarker of cellular membrane integrity [24,78,79]. Studies focusing on MS have demonstrated increased tCho levels as a characteristic manifestation of demyelination or remyelination and as an accompanying sign during inflammation and gliosis in both WM and GM structures [67,79,80]. Elevated tCho values have been confirmed, especially in acute lesions, and also in the NAWM of progressive MS patients [78]. Furthermore, active demyelination, which is associated with profound acute axonal injury in all progressive MS forms (acute MS, RRMS, SPMS, PPMS), has been observed in deep GM structures (thalamus, hypothalamus, caudate nucleus, pallidum, and putamen) [9,63,81]. Membrane breakdown products themselves have, moreover, been postulated to complicate the regeneration of the impaired GM tissue and thus to worsen the MS manifestation [24,25]. However, the GM areas have revealed lower tCho overloading in RRMS and SPMS patients than in CIS and CDMS patients [51,52,54]. The initial active GM demyelination is, therefore, thought to be suppressed in progressive MS stages [24]. This idea explains the lack of differences in tCho throughout GM regions (i.e., thalamus, hippocampus, cortical GM) in RRMS patients or even the decreased tCho levels in progressive MS stages [56,58,82].

mIns—Glial Marker

The level of mIns in the brain is primarily maintained (Figure 3) by the recycling of inositol-containing phospholipids that are tightly linked to the phosphatidylinositol pathway cycle (PIP cycle) [83,84,85], although, a small amount of brain mIns can be synthesized not only from glycolysis through glucose-6-phosphate (by inositol synthase and phosphatase) [83,84,85], but also by reuptake from the extracellular fluid (3% of mIns levels) via three specialized mIns transporters (Na+-dependent myoInositol cotransporters-1 and 2; H+-dependent myoInositol cotransporter) [84,85,86]. Among its important roles in CNS, the most prominent mIns functions are reported to be the synthesis of inositol-containing membrane phospholipids, protein phosphorylation, cellular osmoregulation, and glucose homeostasis maintenance [83,85,86]. Furthermore, mIns has been established as an important growth-promoting factor and co-factor of enzymes and as a messenger molecule in signal transduction [83]. Not only mIns, but also other components of the PIP cycle might be involved in a potential signaling mechanism influencing several cellular functions [85,86]. In particular, mIns is responsible for Ca2+ release from the endoplasmic reticulum and mitochondria, thereby raising the cytosolic Ca2+ concentration [83,86]. Furthermore, the bilateral functional relationship between inositol-1,4,5-triphosphate and the main neuronal glutamate receptors [85,86] have been declared to be responsible for enhanced excitatory neurotransmission and thus the depolarization-induced intracellular Ca2+ increase. This synergic depolarization might lead to a persistent increase in protein kinase activation, oncogene activity, and other plasticity changes in the CNS [85,87]. Moreover, PIP cycle modulation has been found to regulate several membrane transport proteins (e.g., voltage-gated K+ and Ca2+ channels, ion channels that mediate sensory and nociceptive responses, epithelial transport proteins, and ionic exchangers) [85,88]. Therefore, altered mIns levels might be partially responsible for the cellular ion dysregulation seen in many neurodegenerative conditions [89].
With respect to its brain distribution, mIns is predominantly localized in astrocytes (~6 mM [84]), and not in neuronal cells (less than 0.5 mM [84]) [70,78,84], suggesting that mIns can be stored and regulated in glial cells before their utilization in the PIP cycle [84]. During glial proliferation, mIns levels have been shown to rise, making mIns a useful glial marker [25,79,84]. Elevated mIns has been observed in almost all studies of MS patients [78], not only in the active MS phase [25,90], but also in the non-active MS phase [52,91], and even in the early stages of the disease [24,92]. Elevated mIns has been observed in NAWM of RRMS, SPMS, and PPMS patients [51,54,77], in NAWM of CIS patients [78,93,94], in the cortical GM area of RRMS patients [51], and in the thalamus and hippocampus in RRMS, SPMS, and PPMS patients [56]. Higher mIns/tNAA has been found not only in the hypothalamus of patients with RRMS and SPMS [52], but also in early MS stages [24], suggesting that reactive gliosis appears from early to progressive MS manifestation. Furthermore, the same studies have determined a positive correlation of hypothalamic mIns/tNAA and patient disability, even in the early MS stage. In another study focusing on NAWM, mIns/NAA in WM has been suggested as a predictor of clinical disability in progressive MS [67,75]. In general, increased mIns in NAWM has been reported to precede axonal damage in MS [58,77,95], although the type and location of an MS lesion might influence the level of the immune response [9,22,25]. A typical, less prominent influx of immune cells attributable to the blood–brain barrier leakage has been detected in GM lesions compared with WM lesions [82,96,97]. However, deep GM lesions (in all MS stages) are associated with perivascular and parenchymal lymphocytic infiltration and are generally more sensitive with regard to inflammatory CNS reactions than those in the cortex [9]. Nevertheless, several studies have established that the neuro-axonal damage in WM might be at least partially reversible [8,51,93]. This is in agreement with the theory of the dual role of astrocytes that both contribute to axon demyelination and support their remyelination [58,98,99]. This means that an early glial response might inhibit cell death pathways via the triggering of neurotrophic factor expression [8,58]. Finally, given the predominant source of mIns is the PIP cycle, its astrocytic receptors are possible target regulators for the therapeutic action of mIns, although its exact involvement in MS progression is still not clear [84]. Some evidence suggests that the mIns level in the brain is associated with changes in mood state [83]. Administration of mIns has been found to be therapeutic for obsessive–compulsive and panic disorders [83,84], depression [84,85], bipolar disorders, and concomitant sleep symptoms [100,101].

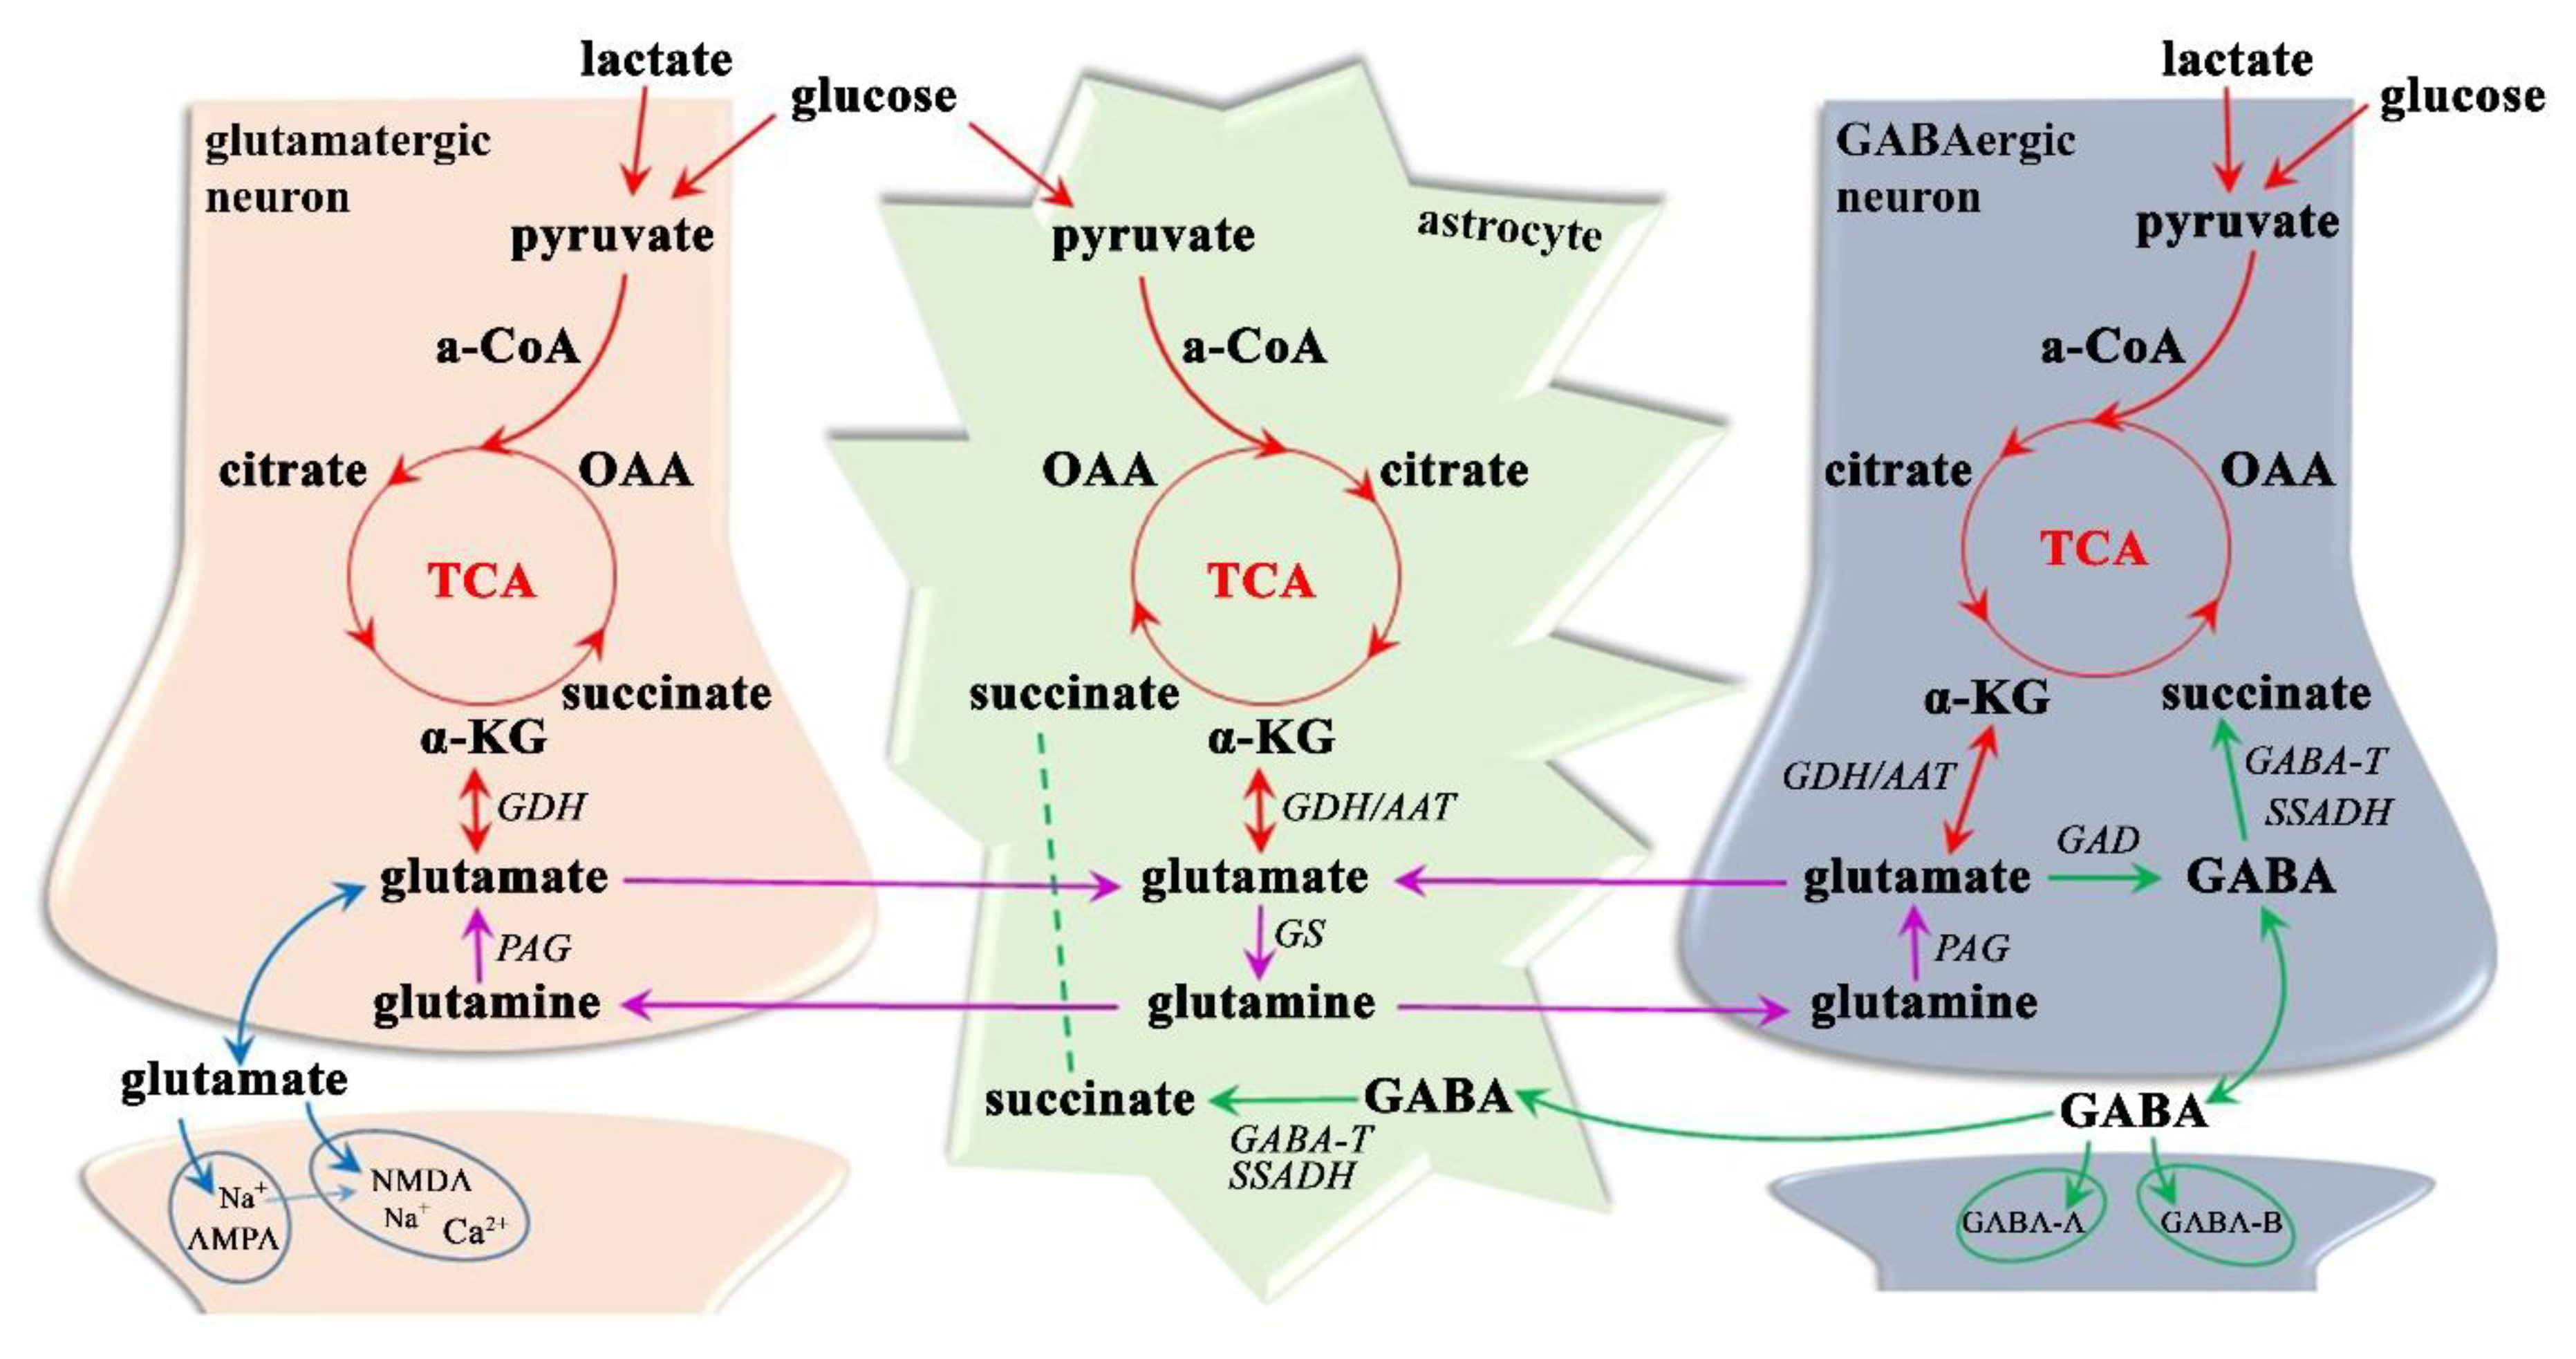
3.1.3. Neurotransmitter Dysregulation–Glx Excitotoxicity

Despite glutamate not crossing the blood–brain barrier [102,103,104], it shows appreciable concentrations throughout the CNS (5–10 mM [104]), suggesting that it has metabolic importance. Although it can be found in all brain cells, its highest levels are reached in the synaptic vesicles of nerve terminals, from where it can be released into the synaptic cleft [104,105]. Glutamate is physiologically taken back up into neurons and astrocytes but can be synthesized (Figure 4) from glucose or pyruvate (through the TCA cycle and α-ketoglutarate, which receives an amino group by the activity of aminotransferase in astrocytes) or from glutamine (by phosphate-activated glutaminase in neurons), in addition to being formed from α-ketoglutarate (by glutamate dehydrogenase in astrocytes or neurons) [87,102,106]. Given that the glutamate pool is maintained in equilibrium, it is predominantly accumulated in neuronal synaptic vesicles (based on vesicular glutamate transporters-1, 2, and 3) but can also be reconverted back to α-ketoglutarate and metabolized through the TCA cycle in both astroglia and neurons and transformed to GABA (by glutamate decarboxylase in GABAergic neurons) or glutamine (by glutamine synthetase in astrocytes) [103,105,106]. In particular, the glutamate-glutamine cycle between neurons and astroglia is highly active, representing approximately 85% of the glutamate turnover rate [106]. This neuroglial transmitter recycling is an essential transporting system to ensure not only the astrocytic release of glutamine (Na+-dependent neutral amino acid transporters-3 and 5) and its neural uptake (Na+-dependent neutral amino acid transporters-1,2, and 7; slc38-family; alanine-serine-cysteine transporter-2) [87,105], but also the neuronal leakage of glutamate (vesicular exocytosis; anion channels; reversed glutamate transport proteins, glutamate/cystine exchanger) and its ingestion into astrocytes (glutamate transporter-1; glutamate aspartate transporter; excitatory amino acid transporters-1 and 2) and neurons (Excitatory amino acid transporter-3, ionotropic and metabotropic glutamate receptors) [87,104,105].
Glutamate has a myriad of functions in the CNS with key roles in protein synthesis, ammonia fixation, and nitrogen and energy metabolism, and in the establishment of the complex communication networks (synapse formation, dendrite pruning, cell migration, and differentiation) between neurons, astrocytes, oligodendrocytes, and endothelial and immune cells [20,107]. Taking into account that approximately 85% of cortical neurons are glutamatergic [12,103], glutamate is considered as the most important excitatory neurotransmitter; it is involved in the regulation of circadian rhythms, sensory-motoric coordination, and emotional and cognitional functions, including memory formation and retrieval [11,103]. Typical glutamate (Figure 4) post-synaptic activity influences three types of ionotropic glutamate receptors, namely α-amino-3-hydroxy-5-methyl-4-isoxazole propionic acid (AMPA), N-methyl-D-aspartate (NMDA), and kainate receptors [87,105]. Whereas AMPA is permeable to Na+ ions, its activation causes the depolarization of the postsynaptic membrane and is thought to be responsible for the majority of fast glutamate-mediated neurotransmission [87,104]. Depolarization might remove the voltage-dependent Mg2+ ion bound from the NMDA receptor, allowing an influx of both Na+ and Ca2+ to the dendrite and enabling activation during high-frequency stimulation (i.e., memory formation, synaptic plasticity) [21,104]. The numerous triggers, such as energy depletion and mitochondrial dysfunction [8,20,107], decrease the activity of mitochondrial respiratory chain complexes I and III [8], calcium overload [107], oxidative stress [21], and higher microvascular permeability [108], activate microglia, dendritic cells, and macrophages [21,107], and upregulate glutamate transporters and receptors causing a disturbance in glutamate homeostasis that leads to neural hyperexcitability [20,21,108]. Glutamate excitotoxicity is principally mediated by the excessive influx of Ca2+ via NMDA receptors [102,104,105] and leads to multiple adverse effects including the impairment of intracellular Ca2+ homeostasis, the dysfunction of mitochondria and endoplasmic reticulum, an increase in free radicals, the persistent activation of phospholipases, proteases, endonucleases, and kinases, and an increase in the expression of pro-death transcription factors and immediate early genes ultimately leading to neuronal and glial cell apoptosis [13,50,109]. Microglial activation and subsequent reactive gliosis both precede and follow the final stages of neurodegeneration caused by glutamate excitotoxicity [21,108].
Recently developed radiological and biochemical methods have provided evidence that excessive activation of the glutamatergic pathway plays an important role in MS pathophysiology [20,107,108]. Since previous research has shown that glutamate occurs in the brain at approximately 10-times higher concentrations than glutamine [110], the Glx peak (Figure 1) is thought to be primarily driven by the glutamate signal. Furthermore, the glutamate level has been found to be elevated, whereas the glutamine concentration persists unchanged in the MS brain [51,90]. Elevated Glx, as measured by MRS, has been reported in various CNS structures: in NAWM and in active (but not in chronic) WM lesions of RRMS [70,111], SPMS, and PPMS patients [77], and in NAWM and the thalamus in CDMS patients [51]. Therefore, glutamate has been proposed as a predictive marker for WM pathology [51,70]. The findings in GM are contradictory: Glx is elevated in cortical GM and hypothalamus in RRMS and SPMS [52,70], is unchanged in the thalamus, hippocampus, and cortical GM in RRMS, SPMS, and PPMS [56], or declines in cortical GM [1] and in the hippocampus, thalamus, cingulate, and parietal cortices in RRMS [111]. Altered Glx metabolism in the hypothalamus has previously been shown, in RRMS and SPMS, to correlate with disease severity [52,58] and in the early MS state suggesting a positive correlation to disability in MS patients [24]. This indicates that Glx in the hypothalamus of RRMS/SPMS patients is associated with MS manifestations (disease duration, depression, fatigue), even when no MR-visible lesions are detectable in the GM [52]. Elevated glutamate has further been demonstrated to lead to the destruction of oligodendrocytes, a characteristic that is directly related to disease progression [112,113]. The increase in glutamatergic transmission observed in the GM of MS patients has been clearly shown to result in cognitive impairments, even in the early phase of MS pathogenesis before the appearance of severe motor impairments [24,108]. In summary, Glx has the potential to be used as a biomarker of the progression and severity of MS and should be evaluated in WM and GM brain areas [21,24,58].

3.1.4. Neurotransmitter Dysregulation–GABA Inhibition

Because 25–45% of neurons of the CNS are GABAergic [12,114], GABA is considered as a major inhibitory neurotransmitter that is essential for neuronal plasticity, i.e., for the formation of action potentials during learning and memory formation, offensive-defensive behavior and sensory-motoric control [11,23]. Its physiological levels inhibit neuronal hyper-excitability that can manifest as irritability, seizures, headaches, movement disorders, tics, epilepsy, anxiety, insomnia, fatigue, or psychiatric disorders such as depression and focus and attention difficulties [12,13]. However, excessive levels of GABAergic activity can cause sedation, sleepiness, and lethargy [11,115].
The maintenance of suitable GABA levels is dependent on the GABA reuptake rate by transporter proteins (GABA transporter-1 in presynaptic nerve terminals, GABA transporter-3 in glial cells) and on the ability of the brain to form glutamate as the main precursor of GABA synthesis and to degrade GABA via the TCA cycle [23,87]. For GABA synthesis (Figure 4), the essential glutamate decarboxylase enzyme is expressed solely in GABAergic neurons, whereas key roles during GABA catabolism are played by the mitochondrial enzymes GABA-transaminase and succinate semialdehyde dehydrogenase, which are localized in astroglial and neural cells [13,23,87]. In both enzymatic processes, mitochondria are critical and sensitive to changes in nutrient and oxygen supplementation and to the loss of the trophic support of incoming and outgoing fibers, as occurs in the brain of MS patients [8,16,116]. GABA transmission (Figure 4) itself is based on Ca2+-dependent GABA release during the depolarization of the presynaptic membrane and on ionotropic GABA-A (activates the rapid and transient opening of Cl channels) and metabotropic GABA-B (activates, via coupled G-protein, inwardly rectifying K+ channels and inhibits voltage-activated Ca2+ channels) receptors causing the hyperpolarization of the neuron and the inhibition of neurotransmission [87,117]. Since both types of receptors have been found not only post- but also pre-synaptically on GABAergic neurons, GABA is thought to regulate their release via voltage-activated Ca2+ channels [117,118].
In MS, the brain has been demonstrated to exhibit both reduced GABA-related gene transcripts [8] and a decline in the density of GABAergic neurons or GABA receptors [119,120,121]. This might lead to a topographic variation in GABA levels (Figure 1) in patients with progressive MS, with decreases in key brain regions, including the posterior cingulate cortex (containing WM and GM) [121], the sensorimotor cortex, and the hippocampus [23,119,122]. Interestingly, inflammation rather than demyelination, being present in both active and inactive MS lesion types, is thought to be involved in the regulation of GABA transmission [120]. A decline in GABA inhibition might result in higher energetic demands and, in the case of energetic misbalance (i.e., insufficient adenosine triphosphate (ATP) production by mitochondria, a reduction in respiratory chain complexes I and III), might cause the degeneration of chronically demyelinated axons in MS, as is supported by the disruption in ion homeostasis (impaired voltage-gated ion channels, Na+/K+-ATPase, Na+/Ca2+ exchanger) along the demyelinated axolemma [8,23]. These processes might further lead to neuroaxonal degeneration and, finally, the loss of compensatory mechanisms that maintain physiological functions [23,72]. In support of this assumption, a worsening of MS manifestations associated with GABA decrements has been observed in several studies, i.e., lower GABA in the hippocampus and the sensorimotor cortex has been correlated with a decrease in grip and muscle strength [23] and reduced motor performance [121]; in SPMS; GABA decrements in the sensorimotor cortex have been associated with the deterioration of fine-motor coordination in RRMS [119]; decreased hippocampal GABA has been connected to distinct memory deficits in RRMS [122]; and reduced GABA in the posterior cingulate cortex and hippocampus has been associated with cognitive impairment in RRMS [123]. Furthermore, a decreased GABA concentration in the hippocampus and the sensorimotor cortex of SPMS patients has been proposed as a predictive marker of physical disability in MS progression [23]. These reports suggest that GABA modulation and neurotransmission represent a critical neuroprotective approach in MS management. Moreover, based on animal studies, selective GABA-A receptor agonists or positive allosteric modulators have been established to increase the GABA concentration and to block Ca2+ channels, thereby enhancing the potential of this methodology for MS treatment [117].

3.1.5. Limitations of 1H MRS

Despite the evidence that 1H MRS reveals numerous affected biomarkers for the evaluation of MS progression, this radiological technique is still not routinely used as MS diagnostic tool. The reason is apparent, namely missing unambiguous predictive or distinguishable biomarkers. Furthermore, some technical weaknesses of this method are still awaiting fine-tuning. One persisting 1H MRS issue is the presence of an unwanted signal, namely the strong signal of water and subcutaneous lipids or signal contamination from adjacent tissue. Since the abundant cerebellar water signal (~80 M) covers the peaks of other metabolites (~10 mM), techniques such as chemical shift selective water suppression, variable pulse power, and optimized relaxation delays, and relaxation time manipulations are routinely applied to suppress its peak [26,37,124]. Analytical software such as LCModel can also distinguish and eliminate the residual water signal [37,125]. Furthermore, pericranial fat contains high concentrations of lipids that can also strongly contaminate 1H MRS [26,37]. Similarly, the proximity of bone structures and air-tissue interfaces (e.g., the paranasal sinuses, inferior and anterior temporal cortices, orbitofrontal regions) can result in spectral line broadening and homogeneity and susceptibility artifacts [37,124]. Therefore, the positioning of measured voxels away from these unwanted areas is essential. Furthermore, the application of outer-volume suppression also helps to avoid signal contamination [37,124]. The potential pitfall of CSI is the occurrence of signal spreading from adjacent voxels (the so-called point-of-spread function or voxel bleeding), which is commonly reduced by k-space filtering methods [124]. Another technical issue is the quantification of the absolute metabolite concentration in 1H MRS. The integral of tCr is widely used to evaluate relative metabolites ratios [37,41]; nevertheless, inconsistencies in the reported increased, decreased, and absent tCr alternations in the lesions and NAWM of MS patients are apparent [25,51]. Therefore, one technique increasingly being used for absolute metabolite quantification employs the water peak as a standard of known concentration [3,26]. Another challenge is the evaluation of several small molecules that, by standard 1H MRS examination, are difficult to distinguish in MR spectra, although they might be clinically useful as diagnostic biomarkers. This is the case for GABA, whose accurate quantification is complicated because of the interaction between adjacent nuclei in the same molecule (J-coupling) causing multiplets (at 1.88, 2.28, and 3.02 ppm) and the overlapping by other metabolite resonances (tCr, Glx, tNAA, and macromolecules) [38,39]. Thus, several MRS-editing techniques have been evaluated for GABA quantification (e.g., Mescher–Garwood editing [38,39], 2D localized correlation spectroscopy [121], homonuclear J-difference editing, and multiple quantum filtering [12]). Likewise, the separation of glutamate and glutamine is challenging because of their structural similarities and J-coupling interactions [11,115]; however, several specific MR sequences are being developed specifically for this task (e.g., the spectrally selective refocusing method [126] and the point-resolved spectroscopy asymmetry method [127]). Obviously, higher field (≥3 T) MR scanners offer a higher spectral quality and spatial resolution (a higher signal-to-noise-ratio, decreased transverse relaxation times and increased magnetic susceptibility effects) but are also somewhat limited (e.g., localization and phase artifacts, chemical shift errors, and B1 inhomogeneities) [38]. The remaining challenge is the whole-brain coverage during one investigative procedure, which is highly desirable in most clinical applications. The use of SVS is possible to measure volumes within the 3–8 cm3 voxel size [37,125,128], whereas CSI enables the minimalization of the individual voxel size to 0.5–1.5 cm3 [128,129,130] in one or several slices (single-slice two-dimensional (2D) CSI; multi-slice three-dimensional (3D) CSI) [37,125,128]. Furthermore, whole-brain CSI sequences based on time-sufficient echo-planar CSI [37,129,131], parallel- or spiral-encoded CSI [37,129], or free induction decay CSI [131] have been achieved; however, these methods are also still limited.

3.2. 31P MRS

In general, 31P MRS has excellent potential for clinical neurological practice (Table 2) because of its noninvasive in vivo assessment of cellular energy metabolism and the indirect evaluation of the phospholipid composition of the cell membrane, intracellular pH, and intracellular Mg2+ concentration [132,133,134].

3.2.1. Phospholipids Metabolism

The synaptic strength and plasticity of neuronal networks are dependent upon the composition and properties of cell membranes comprising a phospholipid double-layer with immersed proteins responsible for cellular membrane fluidity and permeability, intracellular homeostasis, actin cytoskeleton maintenance, channel and receptor formation, signal transduction, and the regulation of various enzymatic reactions including cellular metabolism, proliferation, and cell death [132,133,134,135].
Although the 31P MRS (Figure 5) does not enable the direct measurement of membrane phospholipids because of their fixed membrane integration [41,135], it is suitable (even at lower magnetic fields such as 1.5T) for detecting phospholipid precursors, namely phosphomonoesters (PME, i.e., phosphocholine, phosphoethanolamine), and their degradation products, namely phosphodiesters (PDE, i.e., glycerophosphocholine, glycerophosphoethanolamine) [132,133,134]. The separation of peak sub-contributor signals (at >3T) increases the diagnostic accuracy of a 31P MRS examination [132,133,136]. Nevertheless, increased PME might suggest membrane proliferation, whereas increased PDE might reflect cell membrane breakdown [134,137,138]. Moreover, the metabolic ratio of PME/PDE is generally considered to be an appropriate indicator of cell membrane turnover and to be representative of changes in the phospholipid double layer [139,140]. Both PME and PDE (slightly PDE > PME) peaks are detectable physiologically in WM and in GM (and are generally higher in WM) [140,141], with a gradual increase in PDE and a reduction in PME during aging, probably reflecting the cell membrane condition [142,143,144]. In the acute MS lesions of CDMS, PPMS, and SPMS patients, increased PDE concentrations (mainly attributable to the glycerophosphocholine) have been found [145,146], confirming higher myelin phospholipid degradation. Discrepancies have been perceived in the NAWM of MS patients, showing not only increased PDE levels in CDMS patients [147], but also decreased levels in SPMS and RRMS patients [137,148], supporting the hypothesis of the impact of lesion localization and of neuro-axonal tracking failure in MS patients. Moreover, a higher PME and increased PME/PDE ratio have previously been suggested to result from reactive astrogliosis [137]. Astrocytes actively participate in MS progression by means of their ability to inhibit remyelination and axonal regeneration not only by forming a glial scar, but also by supporting MS lesion formation via the production of cytotoxic factors and by contributing to mitochondrial dysfunction [98,99,137]. Therefore, an increased PME/PDE ratio is thought to provide an early indication of both demyelination and remyelination in MS patients [140,146].

3.2.2. Cellular Energy Metabolism

Cellular energy metabolism is crucial for most cellular processes and functions, including the maintenance of ionic gradients (mainly NA+/K+-ATPase), the activation of protein and lipid biosynthesis, and phosphorylation, cell proliferation, neurotransmitter metabolism, and transport, plus signal transduction [135,137,138]. Therefore, 31P MRS (Figure 5) is regarded as a useful clinical tool for the noninvasive evaluation of brain tissue energetic processes by means of peaks of adenosine triphosphate (ATP, i.e., α-, β-, γ-ATP), phosphocreatine (PCr), and inorganic phosphate (Pi) [132,149,150]. Their metabolic pathways are tightly coupled via the enzyme creatine kinase-B (CK-B; the cytosolic isoform expressed highly in astrocytes, but to a lower extent in neurons [116,151]), which generates ATP by the transfer of a phosphate Pi group from PCr to adenosine diphosphate (ADP) under conditions of higher energy demands and/or insufficient ATP production through cytosolic glycolysis and mitochondrial oxidative phosphorylation [16,73,132]. The result of such a transfer is the decline of cellular PCr and the relative increase in ATP and Pi [137]. However, during ATP hydrolysis (via the mitochondrial CK-B isoform distributed in glial and neural cells [116,151]), PCr and ADP are formed, and the energy from the high-energy phosphoanhydridic bonds is released [41,149,152]. In this regard, ATP is considered as a biomarker of the momentary energetic state of the cell [134,153].
Under physiological conditions in brain cells, the majority of glucose is metabolized oxidatively, leading to a steady PCr-ATP-Pi (stable concentration ~3 mM ATP, ~4 mM PCr, ~1 mM Pi [154]) chemical exchange system [135,152,155]. In particular, PCr is considered as a stable compound in healthy brain tissue. However, higher PCr levels have been found in GM compared with WM [132,142], showing physiologically higher ATP consumption in GM. Nevertheless, PCr is usually taken as a reference for relative MRS quantification [134,141,142], although it is rapidly utilized for fast ATP recovery in the case of higher energetic demands [142,149,153]. In these cases, the mitochondrial compensation mechanisms physiologically increase the effectiveness and/or amount of CK-B for the maintenance of cellular energetic stability [16,142]. Nevertheless, in a postmortem study of progressive MS subjects, a reduced count and activity of CK-B was found in WM astrocytes, suggesting the probable cause of the disrupted PCr levels in NAWM of these patients [16]. Changes in CK-B throughout the cerebral WM of MS patients has been defined both as reduced transcription and as post-translational enzyme modification, probably because of the increased production of reactive oxygen species in MS [137,156]. In agreement with this finding, dysfunctional astrocytes in MS have previously been stated to influence axonal mitochondria causing their energetic failure, and thus they might contribute to axonal degeneration [16,116,156]. In general, PCr is considered as a sensitive marker for mitochondrial rather than for CK-B or astrocytic efficiency, because its increase usually reflects mitochondrial dysfunction and/or tissue excessive requirements [134,137,138]. Indeed, mitochondria contain the energy-dependent respiratory chain [8,157]. In several MS studies, PCr has been found to be elevated in acute MS lesions [137,148] and in NAWM of RRMS, SPMS, and PPMS patients [16,137,147], suggesting the low metabolic state of the brain tissue, even before WM lesions are formed. Furthermore, the increase in PCr has been established to be correlated with the severity of disability and is higher in patients with a more progressive course [148]. Similarly, the NAWM of RRMS and SPMS patients exhibits a negative correlation of β-ATP and disease severity [137], suggesting that a more progressed disease involves lower ATP production.
The inflammatory environment in MS has also been suggested to cause a decrease in mitochondrial activity and ATP production [158]. Based on the disrupted NA+/K+-ATPase in the cells, intracellular Na+ accumulation followed by the reversed activity of NA+/Ca2+ transporters potentially leads to increasing Ca2+ and glutamate concentrations in cells, with neuro-axonal degenerative consequences [73,137]. Moreover, in the NAWM of RRMS patients, a higher PCr/β-ATP level has been found compared with that in SPMS patients [156]. These observations suggest a defective energetic metabolism in MS and a higher compensatory mechanism during the remyelination phase of the disease [137,150]. Finally, the β-ATP level and PCr/β-ATP ratio have been suggested as candidates for biomarkers in the assessment of MS disease severity [116,137,156]. The indicated putative mitochondrial disorders in MS manifestation indicate that a therapeutic approach focusing on mitochondria impairment (e.g., biotin, prucalopride, fluoxetine) will probably play an important role in MS treatment; however, their effects are still under consideration [73,94,146].

3.2.3. Intracellular pH

Intracellular pH can be evaluated non-invasively by 31P MRS (Figure 5) based on the chemical shift of endogenous Pi from the PCr peak [134,154,159]. The Pi position is determined by its form of a conjugated pair of anions, namely H2PO4 and HPO42−, which change rapidly depending on the relevant dissociation reactions [160,161]. The following formula is used for pH evaluation:
p H = pKa + log δ P i δ a δ b   δ P i
where the anion deprotonation constant (pKa = 6.73) and the 31P-limiting shifts for H2PO4 (δa = 3.275 ppm) and HPO42− (δb = 5.685 ppm) are used in the data analysis [154]. The modulation of human brain pH is achieved by osmotic and metabolic regulatory actions that are related to the transport and diffusion of ions, buffer systems, the activity of carbonic anhydrase, and energy consumption [132,159,162]. Several studies have reported intracellular pH levels in the healthy human brain in the range of 7.01–7.07 [161,163], with (approximately) a 0.5% decrement per decade [142]. A relatively stable intracellular pH in brain tissue is important because its change can affect several cellular processes (i.e., cellular enzyme activity, ion channel/transporter efficiency) and thus have an impact on many cell functions (e.g., neuronal activity, synaptic transmissions, mitochondrial functions, pathway regulation) ultimately leading to cell life or death [135,155,159]. In acute MS, lesions have been found with unchanged or slightly alkaline [145,146,148] intracellular pH values compared with healthy brain tissue, suggesting the occurrence of various metabolic processes in the observed brain tissue.

3.2.4. Intracellular Mg2+

The indirect 31P MRS measurement of free cytosolic Mg2+ is based on its correlation to the chemical shift of the β-ATP signal from α-ATP (Figure 5), taking into account that most cytosolic phosphate compounds bind Mg2+ [132,154,164]. For [Mg2+] evaluation, this is mostly applied in the following formula:
[ M g 2 + ] = k d δ A T P δ α β δ α β δ M g A T P
where the MgATP effective disassociation constant (kd = 0.05 mM) and the limiting shifts for ATP (δATP = 10.82 ppm), MgATP (δMgATP = 8.32 ppm), and α-, β-ATP (measured δα−β in ppm) are used in the data analysis [154]. The noninvasive examination of the in vivo intracellular [Mg2+] in the CNS provides a unique possibility for assessing Mg2+ homeostasis and its implementation in brain pathophysiological processes.
Magnesium is involved in a myriad of biochemical processes including the activation of more than 300 enzymes [165,166,167] and, thus, is essential for the regulation of ion channels and signaling pathways [95,168], the synthesis of proteins, macromolecules, and DNA, oxidative phosphorylation, cell membrane remodeling, and stabilization, cell growth and proliferation, and immune responses [95,164,169]. Although approximately 24 Mg2+ transport mechanisms and homeostatic factors have been identified [168,170]), the most essential eukaryotic homologs of the Mg2+ transporter are widely accepted to be CorA–Mrs2 proteins operating in the inner mitochondrial membrane [95]. Furthermore, mitochondria have been established as the cellular organelles with the highest [Mg2+] (0.2–1.5 mM) [95,164]. Therefore, mitochondria are considered to be the main sites of storage of cellular Mg2+ [95,109]. On this basis, the evaluation of intracellular [Mg2+] has been suggested to be particularly important in neurological diseases in which energetic mitochondrial dysfunction is probably the primary causative or putative pathogenic factor (including mitochondrial cytopathies, migraines, multiple system failures such as MS, Parkinson’s disease, etc.) [164,171]. However, the mechanisms of Mg2+ decline in pathological conditions and the availability of this ion in the neural tissue after its administration are still unclear [170,172]. Nevertheless, magnesium therapy has been successfully utilized in the treatment of symptoms that usually occur in MS, including depression [173], anxiety [174], sleep disorders, insomnia, chronic fatigue [175], pain [176], and constipation [177]. In experimental traumatic brain injuries in rats, a decline has been observed in intracellular [Mg2+], correlating with motor deficits [178] that show a significant improvement after magnesium supplementation [179].
Magnesium has been established to reduce brain edema and cerebral vasospasms, to restore blood–brain barrier effectiveness [109,180], and to ensure neuro-axonal protection against nitric oxide and superoxide radicals attributable to the direct inhibition of nitric oxide synthase by Mg2+ [167]. These radicals might promote oligodendrocyte injury, demyelination, and axonal damage caused by the inhibition of mitochondrial respiration and intra-axonal Na+ and Ca2+ accumulation [109,181]. Further protective Mg2+ mechanisms might include the inhibition of the release and uptake of glutamate through the NMDA receptor and the blockade of Ca2+ channels [182,183], causing the hyper-excitability of neurons and leading to cell death [109,184]. Extracellular Mg2+ deficiency might also induce the apoptotic process, mainly through increased oxidative stress (i.e., inflammation, cytokine and phagocyte activation and oxidative DNA damage [109,185]), accompanied by the intracellular Mg2+ mobilization from mitochondrial stores that is necessary for stimulating the activity of Ca2+/Mg2+-dependent endonucleases acting in nucleosomal DNA fragmentation [109]. From this point of view, magnesium supplementation should, in principle, be considered as an anti-apoptotic factor [182,183]. This is supported by the evidently better clinical condition of RRMS patients who attain a healthy Mg serum content after dietary supplementation compared with patients with MS-typical serologically inadequate Mg levels [166]. Alternations in the brain [Mg2+] might be regarded as a possible mechanism contributing to synaptic strength or neuronal plasticity (with no WM-GM differences in magnesium content [132]). Consequently, they might alter memory capacities or affect cognitive ability during aging [165]. A decline in brain [Mg2+] in traumatic brain injury has been established to be associated with the development of cognitive deficits [109]. In MS progression, an inverse association has been confirmed between Mg2+ intake and tissue damage throughout WM lesions [167]. This is in agreement with a postmortem study focusing on CNS in MS patients showing a significant decline in [Mg2+], with the most marked reduction occurring in demyelinated WM plaques [186]. In principle, abnormal [Mg2+] in MS patients should be monitored (e.g., serum level, 31P MRS in the brain) and eventually corrected, as this may at least moderate MS manifestations [166].

3.2.5. Limitations of 31P MRS

Although 31P MRS is a modern noninvasive MR technique providing useful in vivo assessment of pathophysiological brain conditions, it is currently not accepted as a diagnostic tool in clinical practice. One reason is the gyromagnetic ratio (a physical characteristic expressing the interaction between nuclei and magnetic field) of 31P nuclei, which is approximately 2.5 times lower than for 1H, resulting in lower resonance frequency and much lower detection sensitivity [125,132]. These factors imply that, in order to obtain a satisfactory 31P spectrum, it is necessary to apply special MR equipment (special radiofrequency channel, additional radiofrequency coils) able to work at the resonance frequency of the 31P nuclei [118,120,148]. However, with progressive technical and software improvements, 31P MRS has become more easily implemented [140,162]. Moreover, because of the short transverse relaxation time of the 31P metabolites, it is not advisable to use common in-built scanner sequences for 1H MRS such as stimulated echo acquisition mode (STEAM) and point-resolved spectroscopy (PRESS), but it is recommended to apply rarely implemented techniques such as image-selected in vivo spectroscopy (ISIS) or pulse acquire techniques [26,132,161]. Furthermore, most of the 31P MRS metabolites are in a spectral curve presented as double, triple, or multiple peaks because of J-coupling, which needs to be correctly fitted or, even better, reduced by decoupling techniques [132,141]. Another possible reason for this method not being considered in the medical field is that its applicability, chiefly on lower magnetic field MR scanners (<3T), is limited by the insufficient spectral resolution and its lower signal-to-noise-ratio [134,138], resulting in relatively long acquisition times or larger measurement volumes (typically ~ 40–100 cc; rarely ~ 20 cc [132,162]). Patients do not ideally tolerate such drawbacks [136,161]. Furthermore, more substantial volumes, in turn, make it a challenge to study tissue heterogeneity (e.g., MS lesions). Generally, 31P MRS examinations under higher magnetic fields (ideally 3T or 7T) provide a better spectral resolution, higher repeatability, and signal improvements that enable the measurement of an extended range of biomarkers (i.e., phosphocholine, phosphoethanolamine; glycerophosphocholine, glycerophosphoethanolamine; Figure 5), and the examination of smaller volumes and/or the use of shorter data collection times to monitor dynamic disease within one integrative study [132,134,136].

4. Parametric T2-Relaxation Mapping

T2-weighted MRIs are often used as a supporting clinical tool for the diagnosis of various brain pathologies, including MS [28,29,33,41]. The distinguishing of brain tissue alterations on these scans is based on the different T2 relaxation times (Figure 6) that reflect the exchange of energy between spins on a molecular scale [26,187]. The widely used T2 relaxometry method is the multiple spin echo sequence (usually the Carr–Purcell–Meiboom–Gill sequence) exploiting the phase coherence of nuclear spins after a 90° radiofrequency pulse followed by a series of 180° refocusing pulses [188,189]. This arrangement is gradually lost because of the spin–spin interactions and magnetic field inhomogeneities, which manifest as the gradual decay of the transverse magnetization [187,188,190]. For T2 relaxation measurement, single/multi-slice images that are repeatedly collected at several echo times are usually suitable, enabling the exponential loss of the signal to be fitted at each image pixel [188,189,190]. Thus, T2 is the time required for the transverse magnetization to fall to approximately 37% of its initial value [188,189].

4.1. Myelin Water Mapping

Substantially longer T2 relaxation times are exhibited by small, free, and fast-moving molecules, unlike the more efficient T2 relaxation of larger macromolecules with a stable molecular structure supporting the existence of strong local magnetic fields [191,192]. Several studies suggest that the T2 relaxation time is a potential biological parameter enabling the noninvasive in vivo evaluation of changes in tissue composition, chemical environment, or interactions [187,193,194]. In general, T2 relaxation times in healthy brain tissue (Figure 6) have been demonstrated to vary depending on the ratio of WM (~75 ms at 1.5T/~60 ms at 3T) to GM (~95 ms at 1.5T/~80 ms at 3T) or cerebrospinal fluid (~220 ms at 1.5T/~200 ms at 3T) [192,195,196]. The typical finding in MS, namely myelin loss, can be observed in T2-weighted MRI scans as hyperintense areas (lesions, plaques) that are characterized by prolonged T2 relaxation times [3,197,198]. The prolongation of T2 relaxation in MS lesions is thought to be caused by increased extracellular space and by larger cellular water intake in the less hydrophobic environment triggered by demyelination in WM [3,27]. Although prolonged T2 relaxation times have been found in several CNS regions, including the NAWM of MS patients [198,199,200], other research reports indicate that NAWM water T2 relaxation times are correlated with the tNAA concentration in RRMS patients [198,201], suggesting that an increase in lesion water reflects the degree of local demyelination, even before MS lesions are formed.

4.2. Iron Mapping Quantification

Several studies have shown that T2 relaxation is also affected (shortened T2 relaxation time, hypointensities on T2-weighted MRI) by iron accumulation [3,9,202]. In principle, MRI techniques are sensitive to local magnetic field variations caused by iron compounds that affect MR-relaxation parameters [203]. In the human brain, the following four main iron particles are found: hemoglobin-bound iron, which is present in the blood and which exhibits nearly paramagnetic behavior; magnetite- or maghemite-bound ion; iron bound to transferrin (the main iron transporter protein in the brain [204,205]) or ferroportin; and iron stores such as ferritin (the main intracellular iron storage protein in the brain [11,18,206]) or hemosiderin [203,207].
Cerebral iron ions released from oligodendrocytes and myelin fibers during demyelination is thus physiologically amplified in the healthy aging human brain [205,208,209]. Under physiological conditions, the elevated iron concentrations are found in the GM of the midbrain, especially in the basal ganglia [9,208]. Iron ions are required in the production of neurotransmitters to preserve the generation of signals [17,208]. Increased iron levels (attributable to age pathology) have been connected to the disruption of the brain iron homeostasis leading to neurodegeneration, including MS [9,202]. MS patients have further been shown to exhibit increased levels of soluble transferrin (main iron transporter protein in the brain [204,205]) receptor associated with reinforced iron turnover [10,205,210]. Another study has reported an increased level of ferritin in the cerebrospinal fluid and serum of SPMS patients [211], providing the possible reason for extra iron delivery, since the H-ferritin receptor in neurons and oligodendrocytes is transferrin [205,212]. Additionally, inflammation has been established rapidly to increase the synthesis of the iron regulatory hormone hepcidin [213], which inhibits the iron receptor ferroportin and thus controls the exclusion and tissue distribution of iron [10,204]. Moreover, other proteins involved in iron transportation or metabolism have been identified as being upregulated in and around WM lesions (e.g., divalent cation transporter 1, scavenger receptor class A, solute carrier family 11) [205,210]. In particular, transferrin and ferroportin binding are impaired, with more toxic hemosiderin and ferritin deposits having been detected, in the brains of MS patients [18,206,214]. The most important source of iron-related signals in cerebral T2-weighted MRI is thought to come from the ferric oxyhydroxide particles formed only in ferritin and hemosiderin [215].
However, iron is essential for physiological neuronal metabolism, including brain oxygen transport, electron transfer, neurotransmitter synthesis, and myelin production and maturation; its excessive accumulation, especially in pathologically affected brain tissue, is however harmful [17,208]. Poorly liganded iron generates free radicals via the Fenton reaction and thus catalyzes the increased production of reactive oxygen species leading to the oxidative damage of demyelinated axons [10,167,208]. This destruction is exacerbated by activated macrophages and microglia that release an excessive amount of pro-inflammatory mediators and cytokines (e.g., matrix metalloproteinases-9, tumor necrosis factor-α, interleukin-1β, interleukin-6) that can affect excitatory and inhibitory neurotransmission [17,120,210]. Thus, chronic inflammation can be invoked accompanied by oligodendrocytes apoptosis, lipid peroxidation, endothelial and blood–brain barrier damage, and further immune cell activation [10]. These features are present in MS, suggesting ferroptotic cell death, so-called ferroptosis, which is characterized by the presence of smaller mitochondria with ruptured membranes, reduced cristae, and the accumulation of lipid peroxidation products [19]. The hypothesis concerning the impact of iron deposits on MS progression is supported by an autopsy study in which an elevated iron accumulation in deep GM has been determined among various forms of MS (acute MS, RRMS, SPMS, and PPMS) [209]. Iron deposits occur in and around GM lesions [216,217] and in subcortical and deep GM of RRMS, SPMS, and PPMS patients [17,18,210]. However, iron accumulation has also been observed in deep GM (e.g., caudate nucleus, globus pallidus, and putamen) of early CIS patients [217,218], and increasing iron levels have been reported in the advancing stages of MS (CIS vs. RRMS [18], SPMS vs. RRMS [206]). Some studies have established that, although the basal ganglia have the highest iron content in healthy CNS [9,208], these iron deposits are significantly enlarged in MS [18,219]. If a higher iron accumulation is a sign of diffuse neurodegeneration, which is the cause of motor and cognitive dysfunction [18,206,209], then the consequent shortened T2 relaxation times of CNS structures can be considered as a biomarker of MS progression. Moreover, T2 shortening throughout the T2-hypointensities in GM has been shown to be more closely associated with neurologic status and cognitive impairment [217,220] than conventional MRI lesion assessment by means of lesion amount and volume [28,206]. This suggests that the evaluation of the T2-hypointensities in GM is the best predictor of whole-brain atrophy [18,28]. These data taken together indicate that iron chelation therapy could be applied in MS management [17,209,210]; however, many findings warn of its non-effectiveness [10]. Paradoxically, the cerebrospinal fluid and serum levels of iron are not elevated at all in MS patients [10,205,221]. As iron is indispensable for myelin synthesis (cofactor for enzymes enrolled in lipid biosynthesis), its deficiency may worsen the myelin regeneration that is so important for MS remission [204,221]. Furthermore, iron might paradoxically prevent oxidative damage via antioxidants such as cytochrome P450 or catalase (which contain iron-dependent heme groups) and nicotinamide adenine dinucleotide phosphate (NADPH; its synthesis requires iron-dependent ATP production) [10,222]. Therefore, iron supplementation or chelation should be critically evaluated based not only during MRI examination, but also during genetic and biochemical determinations.

4.3. Limitations of Parametric MR-Relaxation Mapping

Even though several assessment MR parameters (T2, T2*, T2’, T2 rho, R2 = 1/T2, R2* = 1/T2*, R2’= R2* − R2 [215]) have been used to improve the specificity and sensitivity of iron detection, only a weak correlation has been observed for WM iron accumulation [18,223,224]. This is most likely because of the influence of WM tissue water content (8–13% [193]), which moreover increases during various pathologic processes (i.e., inflammation, gliosis, edema, axonal demyelination) [17]. Furthermore, the decay of the MR visible proton signal in multi-echo T2 relaxation measurements is in general multiexponential, consisting of a very long relaxation associated with the free water in cerebrospinal fluid (T2 relaxation time >2000 ms), intermediate relaxation attributable to intra- and extracellular water (T2 relaxation time ~80 ms), and short relaxation typical for the water trapped between the myelin bilayers (T2 relaxation time ~30 ms) [27,225]. For in vivo tissue examination, a monoexponential fit of the signal decay is preferably used, resulting in a much easier evaluation of alterations in the brain tissue [193,199]. Moreover, several studies have reported limitations attributed to local changes in magnetic susceptibilities, magnetic field variation, and inhomogeneities that reduce the specificity for iron acquisition [18,208,226]. Unfortunately, despite the continuing development of MR relaxometry techniques (rotating frame and application of adiabatic pulses [227], gradient echo sampling of free induction decay and echo [228], asymmetric spin echoes [226], phase imaging [208], susceptibility-weighted imaging [18,205], magnetic field correlation imaging, and quantitative susceptibility mapping [215]), no consensus of one universal relaxometry method exists that enables the reliable quantification of iron in the brain without limitations [17]. In principle, this is because MR techniques do not detect iron directly, but only its manifestations, which might vary depending upon the surroundings and the magnetic state of the iron. This results in an increase in uncertainties and artifacts [17,208]. Theoretically, these difficulties can be suppressed by using complementary MR protocols [215,226,227,228], which are, however, time consuming, and require advanced data processing, which prevents their use in clinical practice.

Funding

This work was supported by grants from The Slovak Research and Development Agency (VEGA 1/0301/19) and by the Ministry of Health of the Slovak Republic (2018/11-UKMT-7), co-funded from EU sources.

Acknowledgments

This work was supported by grants from The Slovak Research and Development Agency (VEGA 1/0301/19) and by the Ministry of Health of the Slovak Republic (2018/11-UKMT-7), co-funded from EU sources. We would like to extend our thanks to Theresa Jones for the language editing of the manuscript.

Conflicts of Interest

The authors declare no conflict of interest.

References

  1. Haussleiter, I.S.; Brune, M.; Juckel, G. Psychopathology in multiple sclerosis: Diagnosis, prevalence and treatment. Ther. Adv. Neurol. Disord. 2009, 2, 13–29. [Google Scholar] [CrossRef] [PubMed] [Green Version]
  2. Jafari, N. Risk Factors in Cause and Course of Multiple Sclerosis. Ph.D. Thesis, Erasmus University Rotterdam, Rotterdam, The Netherlands, 2012. [Google Scholar]
  3. Swanberg, K.M.; Landheer, K.; Pitt, D.; Juchem, C. Quantifying the Metabolic Signature of Multiple Sclerosis by in vivo Proton Magnetic Resonance Spectroscopy: Current Challenges and Future Outlook in the Translation From Proton Signal to Diagnostic Biomarker. Front. Neurol. 2019, 10, 1173. [Google Scholar] [CrossRef]
  4. Kantarci, O.H. Phases and Phenotypes of Multiple Sclerosis. Continuum 2019, 25, 636–654. [Google Scholar] [CrossRef] [PubMed]
  5. Hauser, S.L.; Oksenberg, J.R. The neurobiology of multiple sclerosis: Genes, inflammation, and neurodegeneration. Neuron 2006, 52, 61–76. [Google Scholar] [CrossRef] [PubMed] [Green Version]
  6. Stys, P.K.; Tsutsui, S. Recent advances in understanding multiple sclerosis. F1000Research 2019, 8. [Google Scholar] [CrossRef] [Green Version]
  7. Popescu, B.F.; Bunyan, R.F.; Parisi, J.E.; Ransohoff, R.M.; Lucchinetti, C.F. A case of multiple sclerosis presenting with inflammatory cortical demyelination. Neurology 2011, 76, 1705–1710. [Google Scholar] [CrossRef] [PubMed] [Green Version]
  8. Dutta, R.; McDonough, J.; Yin, X.; Peterson, J.; Chang, A.; Torres, T.; Gudz, T.; Macklin, W.B.; Lewis, D.A.; Fox, R.J.; et al. Mitochondrial dysfunction as a cause of axonal degeneration in multiple sclerosis patients. Ann. Neurol. 2006, 59, 478–489. [Google Scholar] [CrossRef]
  9. Haider, L.; Simeonidou, C.; Steinberger, G.; Hametner, S.; Grigoriadis, N.; Deretzi, G.; Kovacs, G.G.; Kutzelnigg, A.; Lassmann, H.; Frischer, J.M. Multiple sclerosis deep grey matter: The relation between demyelination, neurodegeneration, inflammation and iron. J. Neurol. Neurosurg. Psychiatry 2014, 85, 1386–1395. [Google Scholar] [CrossRef] [Green Version]
  10. van Rensburg, S.J.; Kotze, M.J.; van Toorn, R. The conundrum of iron in multiple sclerosis—Time for an individualised approach. Metab. Brain Dis. 2012, 27, 239–253. [Google Scholar] [CrossRef] [Green Version]
  11. Zhang, J.M. Human Brain Glutamate, Glutamine, γ-Aminobutyric Acid Proton Magnetic Resonance Spectral Quantification with the Fast Pade Transform. Ph.D. Thesis, The University of California, Los Angeles, CA, USA, 2013. [Google Scholar]
  12. Puts, N.A.; Edden, R.A. In vivo magnetic resonance spectroscopy of GABA: A methodological review. Prog. Nucl. Magn. Reson. Spectrosc. 2012, 60, 29–41. [Google Scholar] [CrossRef] [Green Version]
  13. Agarwal, N.; Renshaw, P.F. Proton MR spectroscopy-detectable major neurotransmitters of the brain: Biology and possible clinical applications. AJNR Am. J. Neuroradiol. 2012, 33, 595–602. [Google Scholar] [CrossRef] [PubMed]
  14. Messina, S.; Patti, F. Gray matters in multiple sclerosis: Cognitive impairment and structural MRI. Mult. Scler. Int. 2014, 2014, 609694. [Google Scholar] [CrossRef] [PubMed]
  15. Hohlfeld, R. ‘Gimme five’: Future challenges in multiple sclerosis. ECTRIMS Lecture 2009. Mult. Scler. 2010, 16, 3–14. [Google Scholar] [CrossRef] [PubMed] [Green Version]
  16. Steen, C.; Wilczak, N.; Hoogduin, J.M.; Koch, M.; De Keyser, J. Reduced creatine kinase B activity in multiple sclerosis normal appearing white matter. PLoS ONE 2010, 5, e10811. [Google Scholar] [CrossRef] [PubMed] [Green Version]
  17. Stankiewicz, J.; Panter, S.S.; Neema, M.; Arora, A.; Batt, C.E.; Bakshi, R. Iron in chronic brain disorders: Imaging and neurotherapeutic implications. Neurother. J. Am. Soc. Exp. Neurother. 2007, 4, 371–386. [Google Scholar] [CrossRef] [PubMed] [Green Version]
  18. Khalil, M.; Enzinger, C.; Langkammer, C.; Tscherner, M.; Wallner-Blazek, M.; Jehna, M.; Ropele, S.; Fuchs, S.; Fazekas, F. Quantitative assessment of brain iron by R2* relaxometry in patients with clinically isolated syndrome and relapsing-remitting multiple sclerosis. Mult. Scler. 2009, 15, 1048–1054. [Google Scholar] [CrossRef] [PubMed]
  19. Hu, C.L.; Nydes, M.; Shanley, K.L.; Morales Pantoja, I.E.; Howard, T.A.; Bizzozero, O.A. Reduced expression of the ferroptosis inhibitor glutathione peroxidase-4 in multiple sclerosis and experimental autoimmune encephalomyelitis. J. Neurochem. 2019, 148, 426–439. [Google Scholar] [CrossRef]
  20. Stojanovic, I.R.; Kostic, M.; Ljubisavljevic, S. The role of glutamate and its receptors in multiple sclerosis. J. Neural Transm. 2014, 121, 945–955. [Google Scholar] [CrossRef]
  21. Azevedo, C.J.; Kornak, J.; Chu, P.; Sampat, M.; Okuda, D.T.; Cree, B.A.; Nelson, S.J.; Hauser, S.L.; Pelletier, D. In vivo evidence of glutamate toxicity in multiple sclerosis. Ann. Neurol. 2014, 76, 269–278. [Google Scholar] [CrossRef]
  22. Zivadinov, R.; Pirko, I. Advances in understanding gray matter pathology in multiple sclerosis: Are we ready to redefine disease pathogenesis? BMC Neurol. 2012, 12, 9. [Google Scholar] [CrossRef] [Green Version]
  23. Cawley, N.; Solanky, B.S.; Muhlert, N.; Tur, C.; Edden, R.A.; Wheeler-Kingshott, C.A.; Miller, D.H.; Thompson, A.J.; Ciccarelli, O. Reduced gamma-aminobutyric acid concentration is associated with physical disability in progressive multiple sclerosis. Brain J. Neurol. 2015, 138, 2584–2595. [Google Scholar] [CrossRef] [PubMed] [Green Version]
  24. Hnilicova, P.; Kantorova, E.; Polacek, H.; Grendar, M.; Bittsansky, M.; Cierny, D.; Sivak, S.; Zelenak, K.; Lehotsky, J.; Dobrota, D.; et al. Altered hypothalamic metabolism in early multiple sclerosis—MR spectroscopy study. J. Neurol. Sci. 2019, 407, 116458. [Google Scholar] [CrossRef] [PubMed]
  25. Sajja, B.R.; Wolinsky, J.S.; Narayana, P.A. Proton magnetic resonance spectroscopy in multiple sclerosis. Neuroimaging Clin. N. Am. 2009, 19, 45–58. [Google Scholar] [CrossRef] [PubMed] [Green Version]
  26. Barker, P.B. Fundamentals of MR spectroscopy. In Clinical MR Neuroimaging: Physiological and Functional Techniques; Gillard, J.H., Waldman, A.D., Barker, P.B., Eds.; Cambridge University Press: Cambridge, UK, 2010. [Google Scholar]
  27. Baranovicova, E.; Mlynarik, V.; Kantorova, E.; Hnilicova, P.; Dobrota, D. Quantitative evaluation of cerebral white matter in patients with multiple sclerosis using multicomponent T2 mapping. Neurol. Res. 2016, 38, 389–396. [Google Scholar] [CrossRef] [PubMed]
  28. Filippi, M.; Rocca, M.A.; De Stefano, N.; Enzinger, C.; Fisher, E.; Horsfield, M.A.; Inglese, M.; Pelletier, D.; Comi, G. Magnetic resonance techniques in multiple sclerosis: The present and the future. Arch. Neurol. 2011, 68, 1514–1520. [Google Scholar] [CrossRef] [PubMed] [Green Version]
  29. Hemond, C.C.; Bakshi, R. Magnetic Resonance Imaging in Multiple Sclerosis. Cold Spring Harb. Perspect. Med. 2018, 8, a028969. [Google Scholar] [CrossRef]
  30. Napoli, S.Q.; Bakshi, R. Magnetic resonance imaging in multiple sclerosis. Rev. Neurol. Dis. 2005, 2, 109–116. [Google Scholar]
  31. MacKay, A.; Laule, C.; Li, D.K.; Meyers, S.M.; Russell-Schulz, B.; Vavasour, I.M. Magnetic Resonance Techniques for Investigation of Multiple Sclerosis. In Proceedings of the XIII Mexican Symposium on Medical Physics; American Institute of Physics Publishing LLC: New York, NY, USA, 2014; pp. 22–35. [Google Scholar] [CrossRef]
  32. Bakshi, R.; Thompson, A.J.; Rocca, M.A.; Pelletier, D.; Dousset, V.; Barkhof, F.; Inglese, M.; Guttmann, C.R.; Horsfield, M.A.; Filippi, M. MRI in multiple sclerosis: Current status and future prospects. Lancet Neurol. 2008, 7, 615–625. [Google Scholar] [CrossRef] [Green Version]
  33. Trip, S.A.; Miller, D.H. Imaging in multiple sclerosis. J. Neurol. Neurosurg. Psychiatry 2005, 76, 11–18. [Google Scholar] [CrossRef] [Green Version]
  34. McFarland, H.F. Examination of the role of magnetic resonance imaging in multiple sclerosis: A problem-orientated approach. Ann. Indian Acad. Neurol. 2009, 12, 254–263. [Google Scholar] [CrossRef]
  35. Tognarelli, J.M.; Dawood, M.; Shariff, M.I.; Grover, V.P.; Crossey, M.M.; Cox, I.J.; Taylor-Robinson, S.D.; McPhail, M.J. Magnetic Resonance Spectroscopy: Principles and Techniques: Lessons for Clinicians. J. Clin. Exp. Hepatol. 2015, 5, 320–328. [Google Scholar] [CrossRef] [PubMed] [Green Version]
  36. Jagannathan, N.R. Role of Magnetic Resonance Imaging and in vivo MR Spectroscopy in Clinical, Experimental and Biological Research. Proc. Indian Natl. Sci. Acad. 2003, B69, 423–446. [Google Scholar]
  37. Zhu, H.; Barker, P.B. MR spectroscopy and spectroscopic imaging of the brain. Methods Mol. Biol. 2011, 711, 203–226. [Google Scholar] [CrossRef] [PubMed] [Green Version]
  38. Bogner, W.; Gagoski, B.; Hess, A.T.; Bhat, H.; Tisdall, M.D.; van der Kouwe, A.J.W.; Strasser, B.; Marjanska, M.; Trattnig, S.; Grant, E.; et al. 3D GABA imaging with real-time motion correction, shim update and reacquisition of adiabatic spiral MRSI. Neuroimage 2014, 103, 290–302. [Google Scholar] [CrossRef] [PubMed] [Green Version]
  39. Hnilicova, P.; Povazan, M.; Strasser, B.; Andronesi, O.C.; Gajdosik, M.; Dydak, U.; Ukropec, J.; Dobrota, D.; Trattnig, S.; Bogner, W. Spatial variability and reproducibility of GABA-edited MEGA-LASER 3D-MRSI in the brain at 3 T. NMR Biomed. 2016, 29, 1656–1665. [Google Scholar] [CrossRef]
  40. Opstad, K.S.; Bell, B.A.; Griffiths, J.R.; Howe, F.A. An investigation of human brain tumour lipids by high-resolution magic angle spinning 1H MRS and histological analysis. NMR Biomed. 2008, 21, 677–685. [Google Scholar] [CrossRef]
  41. Soares, D.P.; Law, M. Magnetic resonance spectroscopy of the brain: Review of metabolites and clinical applications. Clin. Radiol. 2009, 64, 12–21. [Google Scholar] [CrossRef]
  42. Moffett, J.R.; Ross, B.; Arun, P.; Madhavarao, C.N.; Namboodiri, A.M. N-Acetylaspartate in the CNS: From neurodiagnostics to neurobiology. Prog. Neurobiol. 2007, 81, 89–131. [Google Scholar] [CrossRef] [Green Version]
  43. Clark, J.F.; Doepke, A.; Filosa, J.A.; Wardle, R.L.; Lu, A.; Meeker, T.J.; Pyne-Geithman, G.J. N-acetylaspartate as a reservoir for glutamate. Med. Hypotheses 2006, 67, 506–512. [Google Scholar] [CrossRef]
  44. Ledeen, R.W.; Wang, J.; Wu, G.; Lu, Z.H.; Chakraborty, G.; Meyenhofer, M.; Tyring, S.K.; Matalon, R. Physiological role of N-acetylaspartate: Contribution to myelinogenesis. Adv. Exp. Med. Biol. 2006, 576, 131–143. [Google Scholar] [CrossRef]
  45. Madhavarao, C.N.; Moffett, J.R.; Moore, R.A.; Viola, R.E.; Namboodiri, M.A.; Jacobowitz, D.M. Immunohistochemical localization of aspartoacylase in the rat central nervous system. J. Comp. Neurol. 2004, 472, 318–329. [Google Scholar] [CrossRef]
  46. Baslow, M.H. Functions of N-acetyl-L-aspartate and N-acetyl-L-aspartylglutamate in the vertebrate brain: Role in glial cell-specific signaling. J. Neurochem. 2000, 75, 453–459. [Google Scholar] [CrossRef]
  47. Nguyen, T.; Kirsch, B.J.; Asaka, R.; Nabi, K.; Quinones, A.; Tan, J.; Antonio, M.J.; Camelo, F.; Li, T.; Nguyen, S.; et al. Uncovering the Role of N-Acetyl-Aspartyl-Glutamate as a Glutamate Reservoir in Cancer. Cell Rep. 2019, 27, 491–501. [Google Scholar] [CrossRef] [PubMed] [Green Version]
  48. Kolodziejczyk, K.; Hamilton, N.B.; Wade, A.; Karadottir, R.; Attwell, D. The effect of N-acetyl-aspartyl-glutamate and N-acetyl-aspartate on white matter oligodendrocytes. Brain J. Neurol. 2009, 132, 1496–1508. [Google Scholar] [CrossRef] [PubMed]
  49. Bergeron, R.; Coyle, J.T.; Tsai, G.; Greene, R.W. NAAG reduces NMDA receptor current in CA1 hippocampal pyramidal neurons of acute slices and dissociated neurons. Neuropsychopharmacology 2005, 30, 7–16. [Google Scholar] [CrossRef] [PubMed]
  50. Ruiz-Pena, J.L.; Pinero, P.; Sellers, G.; Argente, J.; Casado, A.; Foronda, J.; Ucles, A.; Izquierdo, G. Magnetic resonance spectroscopy of normal appearing white matter in early relapsing-remitting multiple sclerosis: Correlations between disability and spectroscopy. BMC Neurol. 2004, 4, 8. [Google Scholar] [CrossRef] [Green Version]
  51. Tisell, A.; Leinhard, O.D.; Warntjes, J.B.; Lundberg, P. Procedure for quantitative (1) H magnetic resonance spectroscopy and tissue characterization of human brain tissue based on the use of quantitative magnetic resonance imaging. Magn. Reson. Med. 2013, 70, 905–915. [Google Scholar] [CrossRef]
  52. Kantorova, E.; Polacek, H.; Bittsansky, M.; Baranovicova, E.; Hnilicova, P.; Cierny, D.; Sivak, S.; Nosal, V.; Zelenak, K.; Kurca, E. Hypothalamic damage in multiple sclerosis correlates with disease activity, disability, depression, and fatigue. Neurol. Res. 2017, 39, 323–330. [Google Scholar] [CrossRef]
  53. Quarantelli, M. MRI/MRS in neuroinflammation: Methodology and applications. Clin. Transl. Imaging 2015, 3, 475–489. [Google Scholar] [CrossRef] [Green Version]
  54. De Stefano, N.; Bartolozzi, M.L.; Guidi, L.; Stromillo, M.L.; Federico, A. Magnetic resonance spectroscopy as a measure of brain damage in multiple sclerosis. J. Neurol. Sci. 2005, 233, 203–208. [Google Scholar] [CrossRef]
  55. Inglese, M.; Liu, S.; Babb, J.S.; Mannon, L.J.; Grossman, R.I.; Gonen, O. Three-dimensional proton spectroscopy of deep gray matter nuclei in relapsing-remitting MS. Neurology 2004, 63, 170–172. [Google Scholar] [CrossRef]
  56. Wylezinska, M.; Cifelli, A.; Jezzard, P.; Palace, J.; Alecci, M.; Matthews, P.M. Thalamic neurodegeneration in relapsing-remitting multiple sclerosis. Neurology 2003, 60, 1949–1954. [Google Scholar] [CrossRef] [PubMed] [Green Version]
  57. Geurts, J.J.; Reuling, I.E.; Vrenken, H.; Uitdehaag, B.M.; Polman, C.H.; Castelijns, J.A.; Barkhof, F.; Pouwels, P.J. MR spectroscopic evidence for thalamic and hippocampal, but not cortical, damage in multiple sclerosis. Magn. Reson. Med. 2006, 55, 478–483. [Google Scholar] [CrossRef]
  58. Polacek, H.; Kantorova, E.; Hnilicova, P.; Grendar, M.; Zelenak, K.; Kurca, E. Increased glutamate and deep brain atrophy can predict the severity of multiple sclerosis. Biomed. Pap. 2019, 163, 45–53. [Google Scholar] [CrossRef] [PubMed] [Green Version]
  59. Calabrese, M.; Mattisi, I.; Rinaldi, F.; Favaretto, A.; Atzori, M.; Bernardi, V.; Barachino, L.; Romualdi, C.; Rinaldi, L.; Perini, P.; et al. Magnetic resonance evidence of cerebellar cortical pathology in multiple sclerosis. J. Neurol. Neurosurg. Psychiatry 2010, 81, 401–404. [Google Scholar] [CrossRef] [PubMed]
  60. Geurts, J.J.; Stys, P.K.; Minagar, A.; Amor, S.; Zivadinov, R. Gray matter pathology in (chronic) MS: Modern views on an early observation. J. Neurol. Sci. 2009, 282, 12–20. [Google Scholar] [CrossRef]
  61. Minagar, A.; Barnett, M.H.; Benedict, R.H.; Pelletier, D.; Pirko, I.; Sahraian, M.A.; Frohman, E.; Zivadinov, R. The thalamus and multiple sclerosis: Modern views on pathologic, imaging, and clinical aspects. Neurology 2013, 80, 210–219. [Google Scholar] [CrossRef] [Green Version]
  62. Calabrese, M.; Rinaldi, F.; Mattisi, I.; Grossi, P.; Favaretto, A.; Atzori, M.; Bernardi, V.; Barachino, L.; Romualdi, C.; Rinaldi, L.; et al. Widespread cortical thinning characterizes patients with MS with mild cognitive impairment. Neurology 2010, 74, 321–328. [Google Scholar] [CrossRef]
  63. Houtchens, M.K.; Benedict, R.H.; Killiany, R.; Sharma, J.; Jaisani, Z.; Singh, B.; Weinstock-Guttman, B.; Guttmann, C.R.; Bakshi, R. Thalamic atrophy and cognition in multiple sclerosis. Neurology 2007, 69, 1213–1223. [Google Scholar] [CrossRef]
  64. Pirko, I.; Lucchinetti, C.F.; Sriram, S.; Bakshi, R. Gray matter involvement in multiple sclerosis. Neurology 2007, 68, 634–642. [Google Scholar] [CrossRef]
  65. Fisher, E.; Lee, J.C.; Nakamura, K.; Rudick, R.A. Gray matter atrophy in multiple sclerosis: A longitudinal study. Ann. Neurol. 2008, 64, 255–265. [Google Scholar] [CrossRef] [PubMed]
  66. Rudick, R.A.; Lee, J.C.; Nakamura, K.; Fisher, E. Gray matter atrophy correlates with MS disability progression measured with MSFC but not EDSS. J. Neurol. Sci. 2009, 282, 106–111. [Google Scholar] [CrossRef] [PubMed] [Green Version]
  67. Tedeschi, G.; Lavorgna, L.; Russo, P.; Prinster, A.; Dinacci, D.; Savettieri, G.; Quattrone, A.; Livrea, P.; Messina, C.; Reggio, A.; et al. Brain atrophy and lesion load in a large population of patients with multiple sclerosis. Neurology 2005, 65, 280–285. [Google Scholar] [CrossRef] [PubMed]
  68. Elahy, M.; Jackaman, C.; Mamo, J.C.; Lam, V.; Dhaliwal, S.S.; Giles, C.; Nelson, D.; Takechi, R. Blood-brain barrier dysfunction developed during normal aging is associated with inflammation and loss of tight junctions but not with leukocyte recruitment. Immun. Ageing 2015, 12, 2. [Google Scholar] [CrossRef] [PubMed] [Green Version]
  69. Staffen, W.; Zauner, H.; Mair, A.; Kutzelnigg, A.; Kapeller, P.; Stangl, H.; Raffer, E.; Niederhofer, H.; Ladurner, G. Magnetic resonance spectroscopy of memory and frontal brain region in early multiple sclerosis. J. Neuropsychiatry Clin. Neurosci. 2005, 17, 357–363. [Google Scholar] [CrossRef]
  70. Zaini, W.H.; Giuliani, F.; Beaulieu, C.; Kalra, S.; Hanstock, C. Fatigue in Multiple Sclerosis: Assessing Pontine Involvement Using Proton MR Spectroscopic Imaging. PLoS ONE 2016, 11, e0149622. [Google Scholar] [CrossRef] [PubMed] [Green Version]
  71. Narayanan, S.; De Stefano, N.; Francis, G.S.; Arnaoutelis, R.; Caramanos, Z.; Collins, D.L.; Pelletier, D.; Arnason, B.G.W.; Antel, J.P.; Arnold, D.L. Axonal metabolic recovery in multiple sclerosis patients treated with interferon beta-1b. J. Neurol. 2001, 248, 979–986. [Google Scholar] [CrossRef]
  72. Khan, O.; Shen, Y.; Caon, C.; Bao, F.; Ching, W.; Reznar, M.; Buccheister, A.; Hu, J.; Latif, Z.; Tselis, A.; et al. Axonal metabolic recovery and potential neuroprotective effect of glatiramer acetate in relapsing-remitting multiple sclerosis. Mult. Scler. 2005, 11, 646–651. [Google Scholar] [CrossRef]
  73. Cambron, M.; Reynders, T.; Debruyne, J.; Reyngoudt, H.; Ribbens, A.; Achten, E.; Laureys, G. Targeting phosphocreatine metabolism in relapsing-remitting multiple sclerosis: Evaluation with brain MRI, (1)H and (31)P MRS, and clinical and cognitive testing. J. Neurol. 2018, 265, 2614–2624. [Google Scholar] [CrossRef]
  74. Mostert, J.P.; Sijens, P.E.; Oudkerk, M.; De Keyser, J. Fluoxetine increases cerebral white matter NAA/Cr ratio in patients with multiple sclerosis. Neurosci. Lett. 2006, 402, 22–24. [Google Scholar] [CrossRef]
  75. Llufriu, S.; Kornak, J.; Ratiney, H.; Oh, J.; Brenneman, D.; Cree, B.A.; Sampat, M.; Hauser, S.L.; Nelson, S.J.; Pelletier, D. Magnetic resonance spectroscopy markers of disease progression in multiple sclerosis. JAMA Neurol. 2014, 71, 840–847. [Google Scholar] [CrossRef] [PubMed] [Green Version]
  76. Bagory, M.; Durand-Dubief, F.; Ibarrola, D.; Comte, J.C.; Cotton, F.; Confavreux, C.; Sappey-Marinier, D. Implementation of an absolute brain 1H-MRS quantification method to assess different tissue alterations in multiple sclerosis. IEEE Trans. Biol. Med. Eng. 2012, 59, 2687–2694. [Google Scholar] [CrossRef]
  77. Kirov, I.I.; Tal, A.; Babb, J.S.; Herbert, J.; Gonen, O. Serial proton MR spectroscopy of gray and white matter in relapsing-remitting MS. Neurology 2013, 80, 39–46. [Google Scholar] [CrossRef] [Green Version]
  78. Chang, L.; Munsaka, S.M.; Kraft-Terry, S.; Ernst, T. Magnetic resonance spectroscopy to assess neuroinflammation and neuropathic pain. J. Neuroimmune Pharmacol. 2013, 8, 576–593. [Google Scholar] [CrossRef] [PubMed]
  79. Narayana, P.A. Magnetic resonance spectroscopy in the monitoring of multiple sclerosis. J. Neuroimaging 2005, 15, 46S–57S. [Google Scholar] [CrossRef] [PubMed]
  80. He, J.; Inglese, M.; Li, B.S.; Babb, J.S.; Grossman, R.I.; Gonen, O. Relapsing-remitting multiple sclerosis: Metabolic abnormality in nonenhancing lesions and normal-appearing white matter at MR imaging: Initial experience. Radiology 2005, 234, 211–217. [Google Scholar] [CrossRef]
  81. Neema, M.; Arora, A.; Healy, B.C.; Guss, Z.D.; Brass, S.D.; Duan, Y.; Buckle, G.J.; Glanz, B.I.; Stazzone, L.; Khoury, S.J.; et al. Deep gray matter involvement on brain MRI scans is associated with clinical progression in multiple sclerosis. J. Neuroimaging 2009, 19, 3–8. [Google Scholar] [CrossRef] [Green Version]
  82. Hulst, H.E.; Geurts, J.J. Gray matter imaging in multiple sclerosis: What have we learned? BMC Neurol. 2011, 11, 153. [Google Scholar] [CrossRef] [Green Version]
  83. Chhetri, D.R. Myo-Inositol and Its Derivatives: Their Emerging Role in the Treatment of Human Diseases. Front. Pharmacol. 2019, 10, 1172. [Google Scholar] [CrossRef] [Green Version]
  84. Kim, H.; McGrath, B.M.; Silverstone, P.H. A review of the possible relevance of inositol and the phosphatidylinositol second messenger system (PI-cycle) to psychiatric disorders--focus on magnetic resonance spectroscopy (MRS) studies. Hum. Psychopharmacol. 2005, 20, 309–326. [Google Scholar] [CrossRef]
  85. Rango, M.; Cogiamanian, F.; Marceglia, S.; Barberis, B.; Arighi, A.; Biondetti, P.; Priori, A. Myoinositol content in the human brain is modified by transcranial direct current stimulation in a matter of minutes: A 1H-MRS study. Magn. Reson. Med. 2008, 60, 782–789. [Google Scholar] [CrossRef] [PubMed]
  86. Croze, M.L.; Soulage, C.O. Potential role and therapeutic interests of myo-inositol in metabolic diseases. Biochimie 2013, 95, 1811–1827. [Google Scholar] [CrossRef] [PubMed]
  87. Hampe, C.S.; Mitoma, H.; Manto, M. GABA and Glutamate: Their Transmitter Role in the CNS and Pancreatic Islets. In GABA and Glutamate: New Developments in Neurotransmission Research; IntechOpen: London, UK, 2017; pp. 65–90. [Google Scholar] [CrossRef] [Green Version]
  88. Gamper, N.; Shapiro, M.S. Regulation of ion transport proteins by membrane phosphoinositides. Nat. Rev. Neurosci. 2007, 8, 921–934. [Google Scholar] [CrossRef]
  89. Banerjee, S.; Hasan, G. The InsP3 receptor: Its role in neuronal physiology and neurodegeneration. Bioessays 2005, 27, 1035–1047. [Google Scholar] [CrossRef]
  90. Srinivasan, R.; Sailasuta, N.; Hurd, R.; Nelson, S.; Pelletier, D. Evidence of elevated glutamate in multiple sclerosis using magnetic resonance spectroscopy at 3 T. Brain J. Neurol. 2005, 128, 1016–1025. [Google Scholar] [CrossRef] [Green Version]
  91. Kirov, I.I.; Patil, V.; Babb, J.S.; Rusinek, H.; Herbert, J.; Gonen, O. MR spectroscopy indicates diffuse multiple sclerosis activity during remission. J. Neurol. Neurosurg. Psychiatry 2009, 80, 1330–1336. [Google Scholar] [CrossRef] [PubMed] [Green Version]
  92. Fernando, K.T.; McLean, M.A.; Chard, D.T.; MacManus, D.G.; Dalton, C.M.; Miszkiel, K.A.; Gordon, R.M.; Plant, G.T.; Thompson, A.J.; Miller, D.H. Elevated white matter myo-inositol in clinically isolated syndromes suggestive of multiple sclerosis. Brain J. Neurol. 2004, 127, 1361–1369. [Google Scholar] [CrossRef] [PubMed] [Green Version]
  93. Moheet, A.; Emir, U.E.; Terpstra, M.; Kumar, A.; Eberly, L.E.; Seaquist, E.R.; Oz, G. Initial experience with seven tesla magnetic resonance spectroscopy of hypothalamic GABA during hyperinsulinemic euglycemia and hypoglycemia in healthy humans. Magn. Reson. Med. 2014, 71, 12–18. [Google Scholar] [CrossRef] [PubMed] [Green Version]
  94. Polman, C.H.; Reingold, S.C.; Banwell, B.; Clanet, M.; Cohen, J.A.; Filippi, M.; Fujihara, K.; Havrdova, E.; Hutchinson, M.; Kappos, L.; et al. Diagnostic criteria for multiple sclerosis: 2010 revisions to the McDonald criteria. Ann. Neurol. 2011, 69, 292–302. [Google Scholar] [CrossRef] [Green Version]
  95. Kolisek, M.; Sponder, G.; Pilchova, I.; Cibulka, M.; Tatarkova, Z.; Werner, T.; Racay, P. Magnesium Extravaganza: A Critical Compendium of Current Research into Cellular Mg(2+) Transporters Other than TRPM6/7. Rev. Physiol. Biochem. Pharmacol. 2019, 176, 65–105. [Google Scholar] [CrossRef]
  96. Horakova, D.; Kalincik, T.; Dusankova, J.B.; Dolezal, O. Clinical correlates of grey matter pathology in multiple sclerosis. BMC Neurol. 2012, 12, 10. [Google Scholar] [CrossRef] [PubMed] [Green Version]
  97. Klaver, R.; De Vries, H.E.; Schenk, G.J.; Geurts, J.J. Grey matter damage in multiple sclerosis: A pathology perspective. Prion 2013, 7, 66–75. [Google Scholar] [CrossRef] [PubMed] [Green Version]
  98. Muhlert, N.; Atzori, M.; De Vita, E.; Thomas, D.L.; Samson, R.S.; Wheeler-Kingshott, C.A.; Geurts, J.J.; Miller, D.H.; Thompson, A.J.; Ciccarelli, O. Memory in multiple sclerosis is linked to glutamate concentration in grey matter regions. J. Neurol. Neurosurg. Psychiatry 2014, 85, 833–839. [Google Scholar] [CrossRef] [PubMed] [Green Version]
  99. Ponath, G.; Park, C.; Pitt, D. The Role of Astrocytes in Multiple Sclerosis. Front. Immunol. 2018, 9, 217. [Google Scholar] [CrossRef]
  100. Shirayama, Y.; Takahashi, M.; Osone, F.; Hara, A.; Okubo, T. Myo-inositol, Glutamate, and Glutamine in the Prefrontal Cortex, Hippocampus, and Amygdala in Major Depression. Biol. Psychiatry Cogn. Neurosci. Neuroimaging 2017, 2, 196–204. [Google Scholar] [CrossRef]
  101. Urrila, A.S.; Hakkarainen, A.; Castaneda, A.; Paunio, T.; Marttunen, M.; Lundbom, N. Frontal Cortex Myo-Inositol Is Associated with Sleep and Depression in Adolescents: A Proton Magnetic Resonance Spectroscopy Study. Neuropsychobiology 2017, 75, 21–31. [Google Scholar] [CrossRef] [Green Version]
  102. Daikhin, Y.; Yudkoff, M. Compartmentation of brain glutamate metabolism in neurons and glia. J. Nutr. 2000, 130, 1026S–1031S. [Google Scholar] [CrossRef]
  103. Hassel, B.; Dingledine, R. Glutamate and Glutamate Receptors. In Basic Neurochemistry; Academic Press, Elsevier Inc.: Oxford, UK, 2012; pp. 342–366. [Google Scholar] [CrossRef]
  104. Shen, J. Glutamate. In Magnetic Resonance Spectroscopy; Academic Press, Elsevier Inc.: Oxford, UK, 2014; pp. 111–121. [Google Scholar] [CrossRef]
  105. Zhou, Y.; Danbolt, N.C. Glutamate as a neurotransmitter in the healthy brain. J. Neural Transm. 2014, 121, 799–817. [Google Scholar] [CrossRef] [Green Version]
  106. Hertz, L. The Glutamate-Glutamine (GABA) Cycle: Importance of Late Postnatal Development and Potential Reciprocal Interactions between Biosynthesis and Degradation. Front. Endocrinol. 2013, 4, 59. [Google Scholar] [CrossRef] [Green Version]
  107. Macrez, R.; Stys, P.K.; Vivien, D.; Lipton, S.A.; Docagne, F. Mechanisms of glutamate toxicity in multiple sclerosis: Biomarker and therapeutic opportunities. Lancet Neurol. 2016, 15, 1089–1102. [Google Scholar] [CrossRef]
  108. Deckx, N.; Lee, W.P.; Berneman, Z.N.; Cools, N. Neuroendocrine immunoregulation in multiple sclerosis. Clin. Dev. Immunol. 2013, 2013, 705232. [Google Scholar] [CrossRef] [PubMed]
  109. Trapani, V.; Mastrototaro, L.; Wolf, F.I. Magnesium and the Yin-Yang interplay in apoptosis. In Magnesium in the Central Nervous System; Vink, R., Nechifor, M., Eds.; University of Adelaide Press: Adelaide, Australia, 2011. [Google Scholar]
  110. Stagg, C.J. Magnetic Resonance Spectroscopy as a tool to study the role of GABA in motor-cortical plasticity. Neuroimage 2014, 86, 19–27. [Google Scholar] [CrossRef] [PubMed]
  111. Khan, O.; Seraji-Bozorgzad, N.; Bao, F.; Razmjou, S.; Caon, C.; Santiago, C.; Latif, Z.; Aronov, R.; Zak, I.; Ashtamker, N.; et al. The Relationship between Brain MR Spectroscopy and Disability in Multiple Sclerosis: 20-Year Data from the U.S. Glatiramer Acetate Extension Study. J. Neuroimaging 2017, 27, 97–106. [Google Scholar] [CrossRef] [PubMed] [Green Version]
  112. Fu, Y.; Sun, W.; Shi, Y.; Shi, R.; Cheng, J.X. Glutamate excitotoxicity inflicts paranodal myelin splitting and retraction. PLoS ONE 2009, 4, e6705. [Google Scholar] [CrossRef] [Green Version]
  113. Matute, C.; Domercq, M.; Sanchez-Gomez, M.V. Glutamate-mediated glial injury: Mechanisms and clinical importance. Glia 2006, 53, 212–224. [Google Scholar] [CrossRef]
  114. Buzsaki, G.; Kaila, K.; Raichle, M. Inhibition and brain work. Neuron 2007, 56, 771–783. [Google Scholar] [CrossRef] [Green Version]
  115. Novotny, E.J., Jr.; Fulbright, R.K.; Pearl, P.L.; Gibson, K.M.; Rothman, D.L. Magnetic resonance spectroscopy of neurotransmitters in human brain. Ann. Neurol. 2003, 54, S25–S31. [Google Scholar] [CrossRef]
  116. Cambron, M.; D’Haeseleer, M.; Laureys, G.; Clinckers, R.; Debruyne, J.; De Keyser, J. White-matter astrocytes, axonal energy metabolism, and axonal degeneration in multiple sclerosis. J. Cereb. Blood Flow Metab. 2012, 32, 413–424. [Google Scholar] [CrossRef]
  117. Gilani, A.A.; Dash, R.P.; Jivrajani, M.N.; Thakur, S.K.; Nivsarkar, M. Evaluation of GABAergic Transmission Modulation as a Novel Functional Target for Management of Multiple Sclerosis: Exploring Inhibitory Effect of GABA on Glutamate-Mediated Excitotoxicity. Adv. Pharmacol. Sci. 2014, 2014, 632376. [Google Scholar] [CrossRef] [Green Version]
  118. Davies, C.H.; Starkey, S.J.; Pozza, M.F.; Collingridge, G.L. GABA autoreceptors regulate the induction of LTP. Nature 1991, 349, 609–611. [Google Scholar] [CrossRef]
  119. Bhattacharyya, P.K.; Phillips, M.D.; Stone, L.A.; Bermel, R.A.; Lowe, M.J. Sensorimotor cortex gamma-aminobutyric acid concentration correlates with impaired performance in patients with MS. AJNR Am. J. Neuroradiol. 2013, 34, 1733–1739. [Google Scholar] [CrossRef] [PubMed] [Green Version]
  120. Kiljan, S.; Prins, M.; Baselmans, B.M.; Bol, J.; Schenk, G.J.; van Dam, A.M. Enhanced GABAergic Immunoreactivity in Hippocampal Neurons and Astroglia of Multiple Sclerosis Patients. J. Neuropathol. Exp. Neurol. 2019, 78, 480–491. [Google Scholar] [CrossRef] [PubMed]
  121. Quadrelli, S.; Ribbons, K.; Arm, J.; Al-Iedani, O.; Lechner-Scott, J.; Lea, R.; Ramadan, S. 2D in-vivo L-COSY spectroscopy identifies neurometabolite alterations in treated multiple sclerosis. Ther. Adv. Neurol. Disord. 2019, 12, 1–16. [Google Scholar] [CrossRef] [PubMed]
  122. Gao, F.; Yin, X.; Edden, R.A.E.; Evans, A.C.; Xu, J.; Cao, G.; Li, H.; Li, M.; Zhao, B.; Wang, J.; et al. Altered hippocampal GABA and glutamate levels and uncoupling from functional connectivity in multiple sclerosis. Hippocampus 2018, 28, 813–823. [Google Scholar] [CrossRef] [PubMed]
  123. Cao, G.; Edden, R.A.E.; Gao, F.; Li, H.; Gong, T.; Chen, W.; Liu, X.; Wang, G.; Zhao, B. Reduced GABA levels correlate with cognitive impairment in patients with relapsing-remitting multiple sclerosis. Eur. Radiol. 2018, 28, 1140–1148. [Google Scholar] [CrossRef]
  124. Bertholdo, D.; Watcharakorn, A.; Castillo, M. Brain proton magnetic resonance spectroscopy: Introduction and overview. Neuroimaging Clin. N. Am. 2013, 23, 359–380. [Google Scholar] [CrossRef]
  125. Buonocore, M.H.; Maddock, R.J. Magnetic resonance spectroscopy of the brain: A review of physical principles and technical methods. Rev. Neurosci. 2015, 26, 609–632. [Google Scholar] [CrossRef]
  126. Choi, I.Y.; Lee, S.P.; Merkle, H.; Shen, J. In vivo detection of gray and white matter differences in GABA concentration in the human brain. Neuroimage 2006, 33, 85–93. [Google Scholar] [CrossRef]
  127. Snyder, J.; Thompson, R.B.; Wilman, A.H. Difference spectroscopy using PRESS asymmetry: Application to glutamate, glutamine, and myo-inositol. NMR Biomed. 2010, 23, 41–47. [Google Scholar] [CrossRef]
  128. Björkman-Burtscher, I.M.; Sundgren, P.C. Metabolic Imaging: MR Spectroscopy. In Neurological Imaging; Radiology Key, WordPress: San Francisco, CA, USA, 2016. [Google Scholar] [CrossRef]
  129. Al-Iedani, O.; Lechner-Scott, J.; Ribbons, K.; Ramadan, S. Fast magnetic resonance spectroscopic imaging techniques in human brain- applications in multiple sclerosis. J. Biomed. Sci. 2017, 24, 17. [Google Scholar] [CrossRef]
  130. Kurhanewicz, J.; Vigneron, D.B.; Nelson, S.J. Three-dimensional magnetic resonance spectroscopic imaging of brain and prostate cancer. Neoplasia 2000, 2, 166–189. [Google Scholar] [CrossRef] [Green Version]
  131. Hingerl, L.; Strasser, B.; Moser, P.; Hangel, G.; Motyka, S.; Heckova, E.; Gruber, S.; Trattnig, S.; Bogner, W. Clinical High-Resolution 3D-MR Spectroscopic Imaging of the Human Brain at 7 T. Investig. Radiol. 2020, 55, 239–248. [Google Scholar] [CrossRef] [PubMed]
  132. Andrade, C.S.; Otaduy, C.G.; Park, E.J.; Leite, C.C. Phosphorus-31 MR spectroscopy of the human brain: Technical aspects and biomedical applications. Int. J. Curr. Res. Rev. 2014, 6, 41–57. [Google Scholar]
  133. Faghihi, R.; Zeinali-Rafsanjani, B.; Mosleh-Shirazi, M.A.; Saeedi-Moghadam, M.; Lotfi, M.; Jalli, R.; Iravani, V. Magnetic Resonance Spectroscopy and its Clinical Applications: A Review. J. Med. Imaging Radiat. Sci. 2017, 48, 233–253. [Google Scholar] [CrossRef] [PubMed] [Green Version]
  134. Wijnen, J.P. Multi-Nuclear Magnetic Resonance Spectroscopy of Human Brain Tumours. Ph.D. Thesis, Radboud University Nijmegen, Nijmegen, The Netherlands, 2010. [Google Scholar]
  135. Marie, S.K.; Shinjo, S.M. Metabolism and brain cancer. Clinics 2011, 66, 33–43. [Google Scholar] [CrossRef] [PubMed] [Green Version]
  136. Qiao, H. High-Field 31P Magnetic Resonance Spectroscopy (MRS) in Human Brain. Ph.D. Thesis, University of Minnesota, Minneapolis, MN, USA, 2010. [Google Scholar]
  137. Kauv, P.; Ayache, S.S.; Creange, A.; Chalah, M.A.; Lefaucheur, J.P.; Hodel, J.; Brugieres, P. Adenosine Triphosphate Metabolism Measured by Phosphorus Magnetic Resonance Spectroscopy: A Potential Biomarker for Multiple Sclerosis Severity. Eur. Neurol. 2017, 77, 316–321. [Google Scholar] [CrossRef] [PubMed]
  138. Solivera, J.; Cerdan, S.; Pascual, J.M.; Barrios, L.; Roda, J.M. Assessment of 31P-NMR analysis of phospholipid profiles for potential differential diagnosis of human cerebral tumors. NMR Biomed. 2009, 22, 663–674. [Google Scholar] [CrossRef] [PubMed]
  139. Komoroski, R.A.; Pearce, J.M.; Mrak, R.E. 31P NMR spectroscopy of phospholipid metabolites in postmortem schizophrenic brain. Magn. Reson. Med. 2008, 59, 469–474. [Google Scholar] [CrossRef] [PubMed]
  140. Puri, B.K.; Treasaden, I.H. A human in vivo study of the extent to which 31-phosphorus neurospectroscopy phosphomonoesters index cerebral cell membrane phospholipid anabolism. Prostaglandins Leukot. Essent. Fat. Acids 2009, 81, 307–308. [Google Scholar] [CrossRef] [PubMed]
  141. Jensen, J.E.; Drost, D.J.; Menon, R.S.; Williamson, P.C. In vivo brain (31)P-MRS: Measuring the phospholipid resonances at 4 Tesla from small voxels. NMR Biomed. 2002, 15, 338–347. [Google Scholar] [CrossRef]
  142. Forester, B.P.; Berlow, Y.A.; Harper, D.G.; Jensen, J.E.; Lange, N.; Froimowitz, M.P.; Ravichandran, C.; Iosifescu, D.V.; Lukas, S.E.; Renshaw, P.F.; et al. Age-related changes in brain energetics and phospholipid metabolism. NMR Biomed. 2010, 23, 242–250. [Google Scholar] [CrossRef] [PubMed]
  143. Kadota, T.; Horinouchi, T.; Kuroda, C. Development and aging of the cerebrum: Assessment with proton MR spectroscopy. AJNR Am. J. Neuroradiol. 2001, 22, 128–135. [Google Scholar]
  144. Moreno-Torres, A.; Pujol, J.; Soriano-Mas, C.; Deus, J.; Iranzo, A.; Santamaria, J. Age-related metabolic changes in the upper brainstem tegmentum by MR spectroscopy. Neurobiol. Aging 2005, 26, 1051–1059. [Google Scholar] [CrossRef] [PubMed]
  145. Cadoux-Hudson, T.A.; Kermode, A.; Rajagopalan, B.; Taylor, D.; Thompson, A.J.; Ormerod, I.E.; McDonald, W.I.; Radda, G.K. Biochemical changes within a multiple sclerosis plaque in vivo. J. Neurol. Neurosurg. Psychiatry 1991, 54, 1004–1006. [Google Scholar] [CrossRef] [PubMed]
  146. Guillevin, C.; Agius, P.; Naudin, M.; Herpe, G.; Ragot, S.; Maubeuge, N.; Philippe Neau, J.; Guillevin, R. (1) H-(31) P magnetic resonance spectroscopy: Effect of biotin in multiple sclerosis. Ann. Clin. Transl. Neurol. 2019, 6, 1332–1337. [Google Scholar] [CrossRef]
  147. Husted, C.A.; Matson, G.B.; Adams, D.A.; Goodin, D.S.; Weiner, M.W. In vivo detection of myelin phospholipids in multiple sclerosis with phosphorus magnetic resonance spectroscopic imaging. Ann. Neurol. 1994, 36, 239–241. [Google Scholar] [CrossRef]
  148. Minderhoud, J.M.; Mooyaart, E.L.; Kamman, R.L.; Teelken, A.W.; Hoogstraten, M.C.; Vencken, L.M.; Gravenmade, E.J.; van den Burg, W. In vivo phosphorus magnetic resonance spectroscopy in multiple sclerosis. Arch. Neurol. 1992, 49, 161–165. [Google Scholar] [CrossRef]
  149. Du, F.; Zhu, X.H.; Zhang, Y.; Friedman, M.; Zhang, N.; Ugurbil, K.; Chen, W. Tightly coupled brain activity and cerebral ATP metabolic rate. Proc. Natl. Acad. Sci. USA 2008, 105, 6409–6414. [Google Scholar] [CrossRef] [Green Version]
  150. Zhu, X.H.; Qiao, H.; Du, F.; Xiong, Q.; Liu, X.; Zhang, X.; Ugurbil, K.; Chen, W. Quantitative imaging of energy expenditure in human brain. Neuroimage 2012, 60, 2107–2117. [Google Scholar] [CrossRef] [Green Version]
  151. Kuiper, J.W.; Oerlemans, F.T.; Fransen, J.A.; Wieringa, B. Creatine kinase B deficient neurons exhibit an increased fraction of motile mitochondria. BMC Neurosci. 2008, 9, 73. [Google Scholar] [CrossRef] [Green Version]
  152. de Souza, A.C.; Justo, G.Z.; de Araujo, D.R.; Cavagis, A.D. Defining the molecular basis of tumor metabolism: A continuing challenge since Warburg’s discovery. Cell. Physiol. Biochem. 2011, 28, 771–792. [Google Scholar] [CrossRef] [Green Version]
  153. Beloueche-Babari, M.; Chung, Y.L.; Al-Saffar, N.M.; Falck-Miniotis, M.; Leach, M.O. Metabolic assessment of the action of targeted cancer therapeutics using magnetic resonance spectroscopy. Br. J. Cancer 2010, 102, 1–7. [Google Scholar] [CrossRef] [PubMed] [Green Version]
  154. Ren, J.; Sherry, A.D.; Malloy, C.R. (31)P-MRS of healthy human brain: ATP synthesis, metabolite concentrations, pH, and T1 relaxation times. NMR Biomed. 2015, 28, 1455–1462. [Google Scholar] [CrossRef] [Green Version]
  155. Hsu, P.P.; Sabatini, D.M. Cancer cell metabolism: Warburg and beyond. Cell 2008, 134, 703–707. [Google Scholar] [CrossRef] [PubMed] [Green Version]
  156. Steen, C.; D’Haeseleer, M.; Hoogduin, J.M.; Fierens, Y.; Cambron, M.; Mostert, J.P.; Heersema, D.J.; Koch, M.W.; De Keyser, J. Cerebral white matter blood flow and energy metabolism in multiple sclerosis. Mult. Scler. 2013, 19, 1282–1289. [Google Scholar] [CrossRef] [PubMed]
  157. Mahad, D.; Ziabreva, I.; Lassmann, H.; Turnbull, D. Mitochondrial defects in acute multiple sclerosis lesions. Brain J. Neurol. 2008, 131, 1722–1735. [Google Scholar] [CrossRef]
  158. Stys, P.K. General mechanisms of axonal damage and its prevention. J. Neurol. Sci. 2005, 233, 3–13. [Google Scholar] [CrossRef]
  159. Chesler, M. Regulation and modulation of pH in the brain. Physiol. Rev. 2003, 83, 1183–1221. [Google Scholar] [CrossRef]
  160. Cichocka, M. Possibilities of phosphorous magnetic resonance spectroscopy (31P MRS) in brain diagnostics. Acta Bio-Opt. Inform. Med. 2017, 23, 246–252. [Google Scholar]
  161. Ha, D.H.; Choi, S.; Oh, J.Y.; Yoon, S.K.; Kang, M.J.; Kim, K.U. Application of 31P MR spectroscopy to the brain tumors. Korean J. Radiol. 2013, 14, 477–486. [Google Scholar] [CrossRef] [Green Version]
  162. Dixon, R.M.; Styles, P. In vivo NMR, Applications, 31P. In Encyclopedia of Spectroscopy and Spectrometry; Lindon, J.C., Tranter, G.E., Koppenaal, D., Eds.; University of Oxford: Oxford, UK, 2017. [Google Scholar]
  163. Maintz, D.; Heindel, W.; Kugel, H.; Jaeger, R.; Lackner, K.J. Phosphorus-31 MR spectroscopy of normal adult human brain and brain tumours. NMR Biomed. 2002, 15, 18–27. [Google Scholar] [CrossRef] [PubMed]
  164. Iotti, S.; Malucelli, E. Free magnesium concentration in the human brain. In Magnesium in the Central Nervous System; Vink, R., Nechifor, M., Eds.; University of Adelaide Press: Adelaide, Australia, 2011. [Google Scholar]
  165. Billard, J.M. Brain free magnesium homeostasis as a target for reducing cognitive aging. In Magnesium in the Central Nervous System; Vink, R., Nechifor, M., Eds.; University of Adelaide Press: Adelaide, Australia, 2011. [Google Scholar]
  166. Karpinska, E.; Socha, K.; Soroczynska, J.; Kochanowicz, J.; Jakoniuk, M.; Mariak, Z.; Borawska, M.H. Concentration of magnesium in the serum and the ability status of patients with relapsing-remitting multiple sclerosis. J. Elem. 2017, 22, 671–679. [Google Scholar] [CrossRef]
  167. Ramsaransing, G.S.; Mellema, S.A.; De Keyser, J. Dietary patterns in clinical subtypes of multiple sclerosis: An exploratory study. Nutr. J. 2009, 8, 36. [Google Scholar] [CrossRef] [PubMed] [Green Version]
  168. Romani, A.M.P. Intracellular magnesium homeostasis. In Magnesium in the Central Nervous System; Vink, R., Nechifor, M., Eds.; University of Adelaide Press: Adelaide, Australia, 2011. [Google Scholar]
  169. Rubin, H. Intracellular free Mg(2+) and MgATP(2-) in coordinate control of protein synthesis and cell proliferation. In Magnesium in the Central Nervous System; Vink, R., Nechifor, M., Eds.; University of Adelaide Press: Adelaide, Australia, 2011. [Google Scholar]
  170. Ghabriel, M.N.; Vink, R. Magnesium transport across the blood-brain barriers. In Magnesium in the Central Nervous System; Vink, R., Nechifor, M., Eds.; University of Adelaide Press: Adelaide, Australia, 2011. [Google Scholar]
  171. Fagan, T.E.; Cefaratti, C.; Romani, A. Streptozotocin-induced diabetes impairs Mg2+ homeostasis and uptake in rat liver cells. Am. J. Physiol. Endocrinol. Metab. 2004, 286, E184–E193. [Google Scholar] [CrossRef] [PubMed] [Green Version]
  172. Vink, R.; Cook, N.L.; van den Heuvel, C. Magnesium in acute and chronic brain injury: An update. Magnes. Res. 2009, 22, 158S–162S. [Google Scholar] [CrossRef] [PubMed]
  173. Eby, G.A.; Eby, K.L. Rapid recovery from major depression using magnesium treatment. Med. Hypotheses 2006, 67, 362–370. [Google Scholar] [CrossRef]
  174. Kara, H.; Sahin, N.; Ulusan, V.; Aydogdu, T. Magnesium infusion reduces perioperative pain. Eur. J. Anaesthesiol. 2002, 19, 52–56. [Google Scholar] [CrossRef]
  175. Takahashi, H.; Imai, K.; Katanuma, A.; Sugaya, T.; Hisano, K.; Motoya, S.; Aoki, S.; Sugiyama, T.; Yachi, A. A case of chronic fatigue syndrome who showed a beneficial effect by intravenous administration of magnesium sulphate. Arerugi Allergy 1992, 41, 1605–1610. [Google Scholar]
  176. Soave, P.M.; Conti, G.; Costa, R.; Arcangeli, A. Magnesium and anaesthesia. Curr. Drug Targets 2009, 10, 734–743. [Google Scholar] [CrossRef]
  177. Guerrera, M.P.; Volpe, S.L.; Mao, J.J. Therapeutic uses of magnesium. Am. Fam. Physician 2009, 80, 157–162. [Google Scholar]
  178. Cernak, I.; Vink, R.; Zapple, D.N.; Cruz, M.I.; Ahmed, F.; Chang, T.; Fricke, S.T.; Faden, A.I. The pathobiology of moderate diffuse traumatic brain injury as identified using a new experimental model of injury in rats. Neurobiol. Dis. 2004, 17, 29–43. [Google Scholar] [CrossRef] [PubMed]
  179. Turner, R.J.; Dasilva, K.W.; O’Connor, C.; van den Heuvel, C.; Vink, R. Magnesium gluconate offers no more protection than magnesium sulphate following diffuse traumatic brain injury in rats. J. Am. Coll. Nutr. 2004, 23, 541S–544S. [Google Scholar] [CrossRef] [PubMed]
  180. Imer, M.; Omay, B.; Uzunkol, A.; Erdem, T.; Sabanci, P.A.; Karasu, A.; Albayrak, S.B.; Sencer, A.; Hepgul, K.; Kaya, M. Effect of magnesium, MK-801 and combination of magnesium and MK-801 on blood-brain barrier permeability and brain edema after experimental traumatic diffuse brain injury. Neurol. Res. 2009, 31, 977–981. [Google Scholar] [CrossRef] [PubMed]
  181. Kapoor, R.; Davies, M.; Blaker, P.A.; Hall, S.M.; Smith, K.J. Blockers of sodium and calcium entry protect axons from nitric oxide-mediated degeneration. Ann. Neurol. 2003, 53, 174–180. [Google Scholar] [CrossRef]
  182. Euser, A.G.; Cipolla, M.J. Magnesium sulfate for the treatment of eclampsia: A brief review. Stroke 2009, 40, 1169–1175. [Google Scholar] [CrossRef]
  183. Johnson, A.C.; Tremble, S.M.; Chan, S.L.; Moseley, J.; LaMarca, B.; Nagle, K.J.; Cipolla, M.J. Magnesium sulfate treatment reverses seizure susceptibility and decreases neuroinflammation in a rat model of severe preeclampsia. PLoS ONE 2014, 9, e113670. [Google Scholar] [CrossRef]
  184. Wang, Y.; Qin, Z.H. Molecular and cellular mechanisms of excitotoxic neuronal death. Apoptosis 2010, 15, 1382–1402. [Google Scholar] [CrossRef]
  185. Nelander, M.; Weis, J.; Bergman, L.; Larsson, A.; Wikstrom, A.K.; Wikstrom, J. Cerebral Magnesium Levels in Preeclampsia; A Phosphorus Magnetic Resonance Spectroscopy Study. Am. J. Hypertens. 2017, 30, 667–672. [Google Scholar] [CrossRef]
  186. Yasui, M.; Yase, Y.; Ando, K.; Adachi, K.; Mukoyama, M.; Ohsugi, K. Magnesium concentration in brains from multiple sclerosis patients. Acta Neurol. Scand. 1990, 81, 197–200. [Google Scholar] [CrossRef]
  187. Fanea, L.; Sfrangeu, S.A. Relaxation times mapping using magnetic resonance imaging. Rom. Rep. Phys. 2011, 63, 456–464. [Google Scholar]
  188. Deoni, S.C. Magnetic resonance relaxation and quantitative measurement in the brain. Methods Mol. Biol. 2011, 711, 65–108. [Google Scholar] [CrossRef] [PubMed]
  189. Hnilicova, P.; Bittsansky, M.; Dobrota, D. Optimization of Brain T2 Mapping using Standard CPMG Sequence in a Clinical Scanner. Meas. Sci. Rev. 2014, 14, 117–125. [Google Scholar] [CrossRef] [Green Version]
  190. Carneiro, A.A.O.; Vilela, G.R.; de Araujo, D.B.; Baffa, O. MRI Relaxometry: Methods and Applications. Braz. J. Phys. 2006, 36, 9–15. [Google Scholar] [CrossRef]
  191. Cudalbu, C.; Mlynarik, V.; Gruetter, R. Handling macromolecule signals in the quantification of the neurochemical profile. J. Alzheimers Dis. JAD 2012, 31, S101–S115. [Google Scholar] [CrossRef] [PubMed] [Green Version]
  192. Stanisz, G.J.; Odrobina, E.E.; Pun, J.; Escaravage, M.; Graham, S.J.; Bronskill, M.J.; Henkelman, R.M. T1, T2 relaxation and magnetization transfer in tissue at 3T. Magn. Reson. Med. 2005, 54, 507–512. [Google Scholar] [CrossRef] [PubMed]
  193. Hasan, K.M.; Walimuni, I.S.; Kramer, L.A.; Frye, R.E. Human brain atlas-based volumetry and relaxometry: Application to healthy development and natural aging. Magn. Reson. Med. 2010, 64, 1382–1389. [Google Scholar] [CrossRef]
  194. Kumar, R.; Delshad, S.; Woo, M.A.; Macey, P.M.; Harper, R.M. Age-related regional brain T2-relaxation changes in healthy adults. J. Magn. Reson. Imaging JMRI 2012, 35, 300–308. [Google Scholar] [CrossRef]
  195. Lu, H.; Nagae-Poetscher, L.M.; Golay, X.; Lin, D.; Pomper, M.; van Zijl, P.C. Routine clinical brain MRI sequences for use at 3.0 Tesla. J. Magn. Reson. Imaging JMRI 2005, 22, 13–22. [Google Scholar] [CrossRef]
  196. Pell, G.S.; Briellmann, R.S.; Waites, A.B.; Abbott, D.F.; Jackson, G.D. Voxel-based relaxometry: A new approach for analysis of T2 relaxometry changes in epilepsy. Neuroimage 2004, 21, 707–713. [Google Scholar] [CrossRef]
  197. Freedman, M.S. Multiple Sclerosis and Demyelinating Diseases; Lippincott Williams & Wilkins: Ottawa, ON, Canada, 2006. [Google Scholar]
  198. West, J.; Aalto, A.; Tisell, A.; Leinhard, O.D.; Landtblom, A.M.; Smedby, O.; Lundberg, P. Normal appearing and diffusely abnormal white matter in patients with multiple sclerosis assessed with quantitative MR. PLoS ONE 2014, 9, e095161. [Google Scholar] [CrossRef]
  199. Stevenson, V.L.; Parker, G.J.; Barker, G.J.; Birnie, K.; Tofts, P.S.; Miller, D.H.; Thompson, A.J. Variations in T1 and T2 relaxation times of normal appearing white matter and lesions in multiple sclerosis. J. Neurol. Sci. 2000, 178, 81–87. [Google Scholar] [CrossRef]
  200. Whittall, K.P.; MacKay, A.L.; Li, D.K.; Vavasour, I.M.; Jones, C.K.; Paty, D.W. Normal-appearing white matter in multiple sclerosis has heterogeneous, diffusely prolonged T(2). Magn. Reson. Med. 2002, 47, 403–408. [Google Scholar] [CrossRef]
  201. Bot, J.C.; Barkhof, F. Spinal-cord MRI in multiple sclerosis: Conventional and nonconventional MR techniques. Neuroimaging Clin. N. Am. 2009, 19, 81–99. [Google Scholar] [CrossRef] [PubMed]
  202. Hocq, A.; Luhmer, M.; Saussez, S.; Louryan, S.; Gillis, P.; Gossuin, Y. Effect of magnetic field and iron content on NMR proton relaxation of liver, spleen and brain tissues. Contrast Media Mol. Imaging 2015, 10, 144–152. [Google Scholar] [CrossRef] [PubMed]
  203. Birkl, C.; Birkl-Toeglhofer, A.M.; Kames, C.; Goessler, W.; Haybaeck, J.; Fazekas, F.; Ropele, S.; Rauscher, A. The influence of iron oxidation state on quantitative MRI parameters in post mortem human brain. Neuroimage 2020, 220, 117080. [Google Scholar] [CrossRef]
  204. Hare, D.; Ayton, S.; Bush, A.; Lei, P. A delicate balance: Iron metabolism and diseases of the brain. Front. Aging Neurosci. 2013, 5, 34. [Google Scholar] [CrossRef] [Green Version]
  205. Williams, R.; Buchheit, C.L.; Berman, N.E.; LeVine, S.M. Pathogenic implications of iron accumulation in multiple sclerosis. J. Neurochem. 2012, 120, 7–25. [Google Scholar] [CrossRef]
  206. Bakshi, R.; Benedict, R.H.; Bermel, R.A.; Caruthers, S.D.; Puli, S.R.; Tjoa, C.W.; Fabiano, A.J.; Jacobs, L. T2 hypointensity in the deep gray matter of patients with multiple sclerosis: A quantitative magnetic resonance imaging study. Arch. Neurol. 2002, 59, 62–68. [Google Scholar] [CrossRef] [Green Version]
  207. Brem, F.; Hirt, A.M.; Winklhofer, M.; Frei, K.; Yonekawa, Y.; Wieser, H.G.; Dobson, J. Magnetic iron compounds in the human brain: A comparison of tumour and hippocampal tissue. J. R. Soc. Interface 2006, 3, 833–841. [Google Scholar] [CrossRef]
  208. Hagemeier, J.; Heininen-Brown, M.; Poloni, G.U.; Bergsland, N.; Magnano, C.R.; Durfee, J.; Kennedy, C.; Carl, E.; Weinstock-Guttman, B.; Dwyer, M.G.; et al. Iron deposition in multiple sclerosis lesions measured by susceptibility-weighted imaging filtered phase: A case control study. J. Magn. Reson. Imaging JMRI 2012, 36, 73–83. [Google Scholar] [CrossRef]
  209. Hametner, S.; Wimmer, I.; Haider, L.; Pfeifenbring, S.; Bruck, W.; Lassmann, H. Iron and neurodegeneration in the multiple sclerosis brain. Ann. Neurol. 2013, 74, 848–861. [Google Scholar] [CrossRef] [PubMed]
  210. Weigel, K.J.; Lynch, S.G.; LeVine, S.M. Iron chelation and multiple sclerosis. ASN Neuro 2014, 6, e00136. [Google Scholar] [CrossRef] [PubMed] [Green Version]
  211. Worthington, V.; Killestein, J.; Eikelenboom, M.J.; Teunissen, C.E.; Barkhof, F.; Polman, C.H.; Uitdehaag, B.M.; Petzold, A. Normal CSF ferritin levels in MS suggest against etiologic role of chronic venous insufficiency. Neurology 2010, 75, 1617–1622. [Google Scholar] [CrossRef] [PubMed]
  212. Li, L.; Fang, C.J.; Ryan, J.C.; Niemi, E.C.; Lebron, J.A.; Bjorkman, P.J.; Arase, H.; Torti, F.M.; Torti, S.V.; Nakamura, M.C.; et al. Binding and uptake of H-ferritin are mediated by human transferrin receptor-1. Proc. Natl. Acad. Sci. USA 2010, 107, 3505–3510. [Google Scholar] [CrossRef] [Green Version]
  213. Ganz, T. Hepcidin and iron regulation, 10 years later. Blood 2011, 117, 4425–4433. [Google Scholar] [CrossRef] [Green Version]
  214. Zecca, L.; Zucca, F.A.; Albertini, A.; Rizzio, E.; Fariello, R.G. A proposed dual role of neuromelanin in the pathogenesis of Parkinson’s disease. Neurology 2006, 67, S8–S11. [Google Scholar] [CrossRef] [Green Version]
  215. Dusek, P.; Dezortova, M.; Wuerfel, J. Imaging of iron. Int. Rev. Neurobiol. 2013, 110, 195–239. [Google Scholar] [CrossRef]
  216. Bakshi, R.; Shaikh, Z.A.; Janardhan, V. MRI T2 shortening (‘black T2′) in multiple sclerosis: Frequency, location, and clinical correlation. Neuroreport 2000, 11, 15–21. [Google Scholar] [CrossRef]
  217. Ceccarelli, A.; Rocca, M.A.; Neema, M.; Martinelli, V.; Arora, A.; Tauhid, S.; Ghezzi, A.; Comi, G.; Bakshi, R.; Filippi, M. Deep gray matter T2 hypointensity is present in patients with clinically isolated syndromes suggestive of multiple sclerosis. Mult. Scler. 2010, 16, 39–44. [Google Scholar] [CrossRef]
  218. Hagemeier, J.; Weinstock-Guttman, B.; Bergsland, N.; Heininen-Brown, M.; Carl, E.; Kennedy, C.; Magnano, C.; Hojnacki, D.; Dwyer, M.G.; Zivadinov, R. Iron deposition on SWI-filtered phase in the subcortical deep gray matter of patients with clinically isolated syndrome may precede structure-specific atrophy. AJNR Am. J. Neuroradiol. 2012, 33, 1596–1601. [Google Scholar] [CrossRef] [Green Version]
  219. Burgetova, A.; Seidl, Z.; Krasensky, J.; Horakova, D.; Vaneckova, M. Multiple sclerosis and the accumulation of iron in the Basal Ganglia: Quantitative assessment of brain iron using MRI t(2) relaxometry. Eur. Neurol. 2010, 63, 136–143. [Google Scholar] [CrossRef] [PubMed]
  220. Brass, S.D.; Benedict, R.H.; Weinstock-Guttman, B.; Munschauer, F.; Bakshi, R. Cognitive impairment is associated with subcortical magnetic resonance imaging grey matter T2 hypointensity in multiple sclerosis. Mult. Scler. 2006, 12, 437–444. [Google Scholar] [CrossRef] [PubMed]
  221. van Rensburg, S.J.; Kotze, M.J.; Hon, D.; Haug, P.; Kuyler, J.; Hendricks, M.; Botha, J.; Potocnik, F.C.; Matsha, T.; Erasmus, R.T. Iron and the folate-vitamin B12-methylation pathway in multiple sclerosis. Metab. Brain Dis. 2006, 21, 121–137. [Google Scholar] [CrossRef]
  222. Alcina, A.; Ramagopalan, S.V.; Fernandez, O.; Catala-Rabasa, A.; Fedetz, M.; Ndagire, D.; Leyva, L.; Arnal, C.; Delgado, C.; Lucas, M.; et al. Hexose-6-phosphate dehydrogenase: A new risk gene for multiple sclerosis. Eur. J. Hum. Genet. EJHG 2010, 18, 618–620. [Google Scholar] [CrossRef] [PubMed] [Green Version]
  223. Neema, M.; Goldberg-Zimring, D.; Guss, Z.D.; Healy, B.C.; Guttmann, C.R.; Houtchens, M.K.; Weiner, H.L.; Horsfield, M.A.; Hackney, D.B.; Alsop, D.C.; et al. 3 T MRI relaxometry detects T2 prolongation in the cerebral normal-appearing white matter in multiple sclerosis. Neuroimage 2009, 46, 633–641. [Google Scholar] [CrossRef] [PubMed] [Green Version]
  224. Wheaton, A.J.; Borthakur, A.; Corbo, M.T.; Moonis, G.; Melhem, E.; Reddy, R. T2rho-weighted contrast in MR images of the human brain. Magn. Reson. Med. 2004, 52, 1223–1227. [Google Scholar] [CrossRef]
  225. Dingwall, N.; Chalk, A.; Martin, T.I.; Scott, C.J.; Semedo, C.; Le, Q.; Orasanu, E.; Cardoso, J.M.; Melbourne, A.; Marlow, N.; et al. T2 relaxometry in the extremely-preterm brain at adolescence. Magn. Reson. Imaging 2016, 34, 508–514. [Google Scholar] [CrossRef]
  226. Jensen, J.H.; Chandra, R.; Ramani, A.; Lu, H.; Johnson, G.; Lee, S.P.; Kaczynski, K.; Helpern, J.A. Magnetic field correlation imaging. Magn. Reson. Med. 2006, 55, 1350–1361. [Google Scholar] [CrossRef]
  227. Michaeli, S.; Oz, G.; Sorce, D.J.; Garwood, M.; Ugurbil, K.; Majestic, S.; Tuite, P. Assessment of brain iron and neuronal integrity in patients with Parkinson’s disease using novel MRI contrasts. Mov. Disord. Off. J. Mov. Disord. Soc. 2007, 22, 334–340. [Google Scholar] [CrossRef]
  228. Hikita, T.; Abe, K.; Sakoda, S.; Tanaka, H.; Murase, K.; Fujita, N. Determination of transverse relaxation rate for estimating iron deposits in central nervous system. Neurosci. Res. 2005, 51, 67–71. [Google Scholar] [CrossRef]
Figure 1. Visualization of proton-1 magnetic resonance spectroscopy (1H MRS). 1H MRS examination of brain tissue by using the multivoxel spectroscopy (1H magnetic resonance spectroscopic imaging (MRSI)–chemical shift imaging (CSI)) approach with the representing spectra (one CSI voxel indicated with the green arrow) containing metabolite peaks for total creatine (tCr), total choline (tCho), total N-acetyl-aspartate (tNAA), glutamate and glutamine (Glx), γ-aminobutyric acid (GABA), and myoInositol (mIns). The 1H MRS spectra for the healthy (on the left) and MS-affected (on the right) brain are also depicted together with the highlight of the typical metabolic peaks changes via small black arrows (↓: decreased, ↑: increased).
Ijms 21 06117 g001
Figure 2. Schematic representation of N-acetyl-aspartate (NAA) metabolism. Acetyl coenzyme A (a-CoA) derived from pyruvate in neuronal mitochondria can be oxidized for adenosine triphosphate (ATP) production in the tricarboxylic acid (TCA) cycle or can be converted to citrate via citrate synthase or to NAA via aspartate N-acetyltransferase (aspNAT) in neuronal mitochondria. On the one hand, NAA is predominantly transported to oligodendrocytes for degradation via aspartoacylase (ASPA) and further use in protein, fatty acid/myelin lipid synthesis, and energy production. On the other hand, neuronal NAA can also combine with glutamate to produce N-acetylaspartylglutamate (NAAG) via NAAG synthetase (NAAGs). The latter is co-released from synaptic vesicles together with several neurotransmitters and can act on the glutamate receptor (N-methyl-D-aspartate (NMDA); presynaptic type 3 metabotropic glutamate receptors) where, via blocking, Ca2+ channels inhibit glutamate function. NAAG can also be hydrolyzed at the surface of astrocytes to NAA and glutamate via carboxypeptidase (GPC). In astrocytes, glutamate can, via glutamate dehydrogenase (GDH), be converted to α-ketoglutarate (α-KG) as part of the TCA cycle. Glutamate can also be combined with ammonia to produce glutamine via glutamine synthase (GS). Neurons can take up glutamine and use it as a source of glutamate via phosphate-activated glutaminase (PAG). Thus, NAA and glutamate can produce their own general circulation.
Ijms 21 06117 g002
Figure 3. Schematic representation of myoInositol (mIns) metabolism. mIns can be incorporated into cytidine diphosphate diacylglycerol (CDP-DAG) via the activity of phosphatidylinositol synthase (PIS) generating phosphatidylmyoInositol (PthmIns). Further phosphorylation of PthmIns by phosphatidylinositol 4-kinase (4-kinase) forms phosphatidylmyoInositol 4-phosphate (PthmInsP4) and subsequently, via phosphatidylinositol 4-phosphate 5-kinase (5-kinase), produces phosphatidyl 4,5-bisphosphate (PthmIns4,5-P2). PthmIns, PthmInsP4 and PthmIns4,5-P2 are incorporated constituents of cell membranes (depicted as blocks in the cell membrane and colorfully highlighted in the intracellular environment). In response to agonists, activated receptors stimulate phospholipase C (PLC), which hydrolyzes PthmIns4,5-P2 to form DAG and myoInositol 1,4,5-trisphosphate (mIns1,4,5-P3). mIns1,4,5-P3 is a soluble molecule capable of binding to membrane receptors on the endoplasmic reticulum causing Ca2+ release into the cytoplasm. mIns1,4,5-P3 may also be dephosphorylated by inositolpolyphosphate 5-phosphatase (5-tase) forming myoInositol 1,4-bisphosphate (mIns1,4-P2) and further by inositol polyphosphate 1-phosphatase (INPP) generating myoInositol 4-monophosphate (mIns4P). The activity of several myoInositol phosphate synthases (MIPS) leads to the production of myoInositol 1-monophosphate (mInsP). The dephosphorylation of mInsP to mIns is catalyzed by inositol monophosphatase (IMP). However, mIns can be reuptaken from the extracellular space via three specialized mIns transporters (Na+-dependent myoInositol cotransporters-1 and 2 (SMIT-1,2); H+-dependent myoInositol cotransporter (HMIT)) or synthesized from glucose via hexokinase (HK) and myoInositol-3-phosphate-synthase (IPS) to myoInositol-3-phosphate (mIns3P) and further catalyzed by MIPS and IMP.
Ijms 21 06117 g003
Figure 4. Schematic representation of glutamate-glutamine and γ-aminobutyric acid (GABA) metabolism. Glucose (optionally lactate) metabolism via pyruvate and acetyl coenzyme A (a-CoA) in neurons and astrocytes leads to the formation of citrate in the tricarboxylic acid (TCA) cycle resulting in the re-formation of oxaloacetate (OAA), ready for another turn of the cycle with a large amount of energy production. Citrate can be metabolized in the TCA cycle to α-ketoglutarate (α-KG), which can leave the cycle to form glutamate catalyzed by aspartate aminotransferase (AAT) or glutamate dehydrogenase (GDH). Glutamate can be combined with ammonia to produce glutamine via glutamine synthase (GS) in astrocytes and transported to neurons (both glutamatergic and GABAergic) where it forms glutamate via phosphate-activated glutaminase (PAG). After its transportation back to the astrocytes, the glutamate-glutamine cycle is complete. In glutamatergic neurons, glutamate can also be accumulated in vesicles and released as a neurotransmitter. Most glutamatergic activity stimulates α-amino-3-hydroxy-5-methyl-4-isoxazole propionic acid (AMPA) receptors, which are permeable to Na+ ions. Under persistent stimulation, the voltage-dependent bound Mg2+ ion is removed from the N-methyl-D-aspartate (NMDA) receptor enabling an influx of both Na+ and Ca2+. However, cytosolic glutamate might be reuptaken by glutamatergic neurons and reconverted to aspartate during the transamination of glutamate to α-KG catalyzed by glutamate dehydrogenase (GDH). Metabolism of α-KG is linked to the TCA cycle. In addition, glutamate is the main precursor of GABA, whose synthesis is based on glutamate decarboxylase (GAD) in GABAergic neurons. In neurons and astrocytes, GABA can be transaminated via GABA-transaminase (GABA-T) to succinic-semialdehyde and further oxidized by succinate semialdehyde dehydrogenase (SSADH) to succinate, which is also an intermediate of the TCA cycle. Moreover, GABA is a major inhibitory neurotransmitter that influences both ionotropic GABA-A and metabotropic GABA-B receptors, causing the inhibition of neurotransmission.
Ijms 21 06117 g004
Figure 5. Visualization of phosphorus-31 magnetic resonance spectroscopy (31H MRS). 31P MRS brain tissue examination represents the measured signal from the voxel depicted on MRI in green square. The following metabolite peaks are shown: phosphoethanolamine (PE), phosphocholine (PC), phosphomonoesters (PME), inorganic phosphate (Pi), glycerophosphoethanolamine (GPE), glycerophosphocholine (GPC), phosphodiesters (PDE), membrane phospholipids (MP), phosphocreatine (PCr), nicotinamide adenine dinucleotide (NAD(H)), and adenosine triphosphates (α-, β-, γ-ATP). Graphical representations of the indirect pH (chemical shift of Pi and PCr depicted as green arrow) and [Mg2+] evaluation (chemical shift of α-ATP and β-ATP depicted as blue arrow) are also indicated in the fitted MR spectra. The 31P MRS spectra for a healthy (at the top) and MS-affected (at the bottom) brain are also depicted together with the highlight of the typical metabolic peaks changes via small black arrows (↓: decreased, ↑: increased).
Ijms 21 06117 g005
Figure 6. Visualization of the T2 relaxation time mapping. T2 relaxation time mapping of the brain tissue showing measured relaxation signal decays (relaxation curves, blue for white matter (WM) and green for gray matter (GM)), including relaxation T2 time values for both WM and GM. The T2 parameter maps for healthy (on the left) and MS-affected (on the right) brain are also depicted.
Ijms 21 06117 g006
Table 1. Summary of general magnetic resonance imaging (MRI) diagnostic tools in multiple sclerosis (MS) assessment. Table summarizing general MRI diagnostic tools suitable for the assessment of MS with typical disease manifestations (marked with the symbol ~).
MRIMS Assessment
T1-weightedbrain and spinal cord atrophy
hypointensities (dark areas) ~ definitive distortion of the axonal structure, demyelination, neuronal loss, and edema
Gd-enhanced T1-weightedhyperintensities (bright areas) ~ active inflammation; blood–brain barrier breakdown; active demyelination
T2-weightedhyperintensities (bright areas) ~ edema, gliosis, demyelination; disease burden or lesion load
FLAIRhyperintensities ~ demyelinated lesions; MS activity by reducing interference from the spinal fluid
Magnetization transfermagnetization transfer ratio ~ degree of demyelination
Diffusionhyperintensities, high diffusibility, low fractional anisotropy ~ demyelinated axons, and damaged nerve tracks
Susceptibility-weightedhyperintensities ~ iron deposits
Perfusionhyperintensities ~ acute inflammatory lesions
hypointensities ~ tissue degradation
Functionalmanifestation of disrupted brain activity
Table 2. Summary of MR techniques in MS assessment. Table summarizing MRS and other MR techniques suitable for MS assessment and typical disease manifestation.
MS ManifestationMRS TechniquesOther MR Techniques
demyelination1H MRS: ↑tCho
31P MRS: ↑PDE, ↓[Mg2+]
↑tCho in DGM
PDE > PME (mainly in WM)
↓[Mg2+] (in MS lesions)
MRI-T2 lesion load
MR-relaxometry: ↑T2
magnetization transfer
remyelination1H MRS: ↑tCho
31P MRS: ↑PME
PME > PDE (mainly in WM)
neuro-axonal loss1H MRS: ↓tNAA, ↑Glx, ↓GABA
31P MRS: ↑PCr, ↓ATP, ↓[Mg2+]
↓tNAA (in MS lesions, NAWM, cortical GM)↑Glx excitotoxicity (mainly in WM)
↓GABA (mainly in the hippocampus and sensorimotor cortex)
↑PCr and ↑PCr/β-ATP
↓[Mg2+] (mainly in WM)
diffusion: ↑ACD, ↓FA
MRI: T1 hypointensities
MRI: T2 hyperintensities
MR-relaxometry: ↑T2
gliosis, inflammation1H MRS: ↑tCho and ↑mIns↑tCho (in MS lesions)
↑mIns (in MS lesions, NAWM)
perfusion: hyperintensities
Gd-T1 hyperintensities
cell debris accumulation1H MRS: ↑tCho
31P MRS: ↑PDE
↑tCho (in MS lesions)magnetization transfer
cell energy failure31P MRS: ↑PCr, ↓ATP↑PCr and ↑PCr/β-ATP (in acute MS lesions)functional MRI
BBB permeabilityunknownunknownGd-T1 hyperintensities
iron depositsunknownunknownMR-relaxometry: ↓T2
SWI: hyperintensities
Abbreviations: ACD: Apparent diffusion coefficient, ATP/mainly β-ATP: adenosine triphosphates, DGM: deep gray matter, FA: fractional anisotropy, GABA: γ-aminobutyric acid, Glx: glutamate and glutamine, [Mg2+]: intracellular Mg2+ concentration, mIns: myoInositol, NAWM: normal-appearing WM, PCr: phosphocreatine, PDE: phosphodiesters, PME: phosphomonoesters, SWI: susceptibility weighted imaging, tCho: total choline, tNAA: total N-acetyl-aspartate, WM: white matter; ↓: decreased, ↑: increased.

