Macular Ganglion Cell Complex and Peripapillary Retinal Nerve Fiber Layer Thinning in Patients with Type-1 Gaucher Disease

 ,
,  , ,
, ,
Abstract
:1. Introduction
2. Results
Main Results
3. Discussion
4. Materials and Methods
4.1. Eligibility Criteria
4.2. Study Design
4.3. Statistical Analysis
Supplementary Materials
Author Contributions
Funding
Acknowledgments
Conflicts of Interest
Abbreviations
| GD1 | Type-1 Gaucher disease |
| pRNFL | Peripapillary retinal nerve fiber layer |
| OCT | Optical coherence tomography |
| GCC | Ganglion cell complex |
| ETDRS | Early treatment diabetic retinopathy study |
| GD | Gaucher disease |
| PD | Parkinson disease |
| RGC | Retinal ganglion cells |
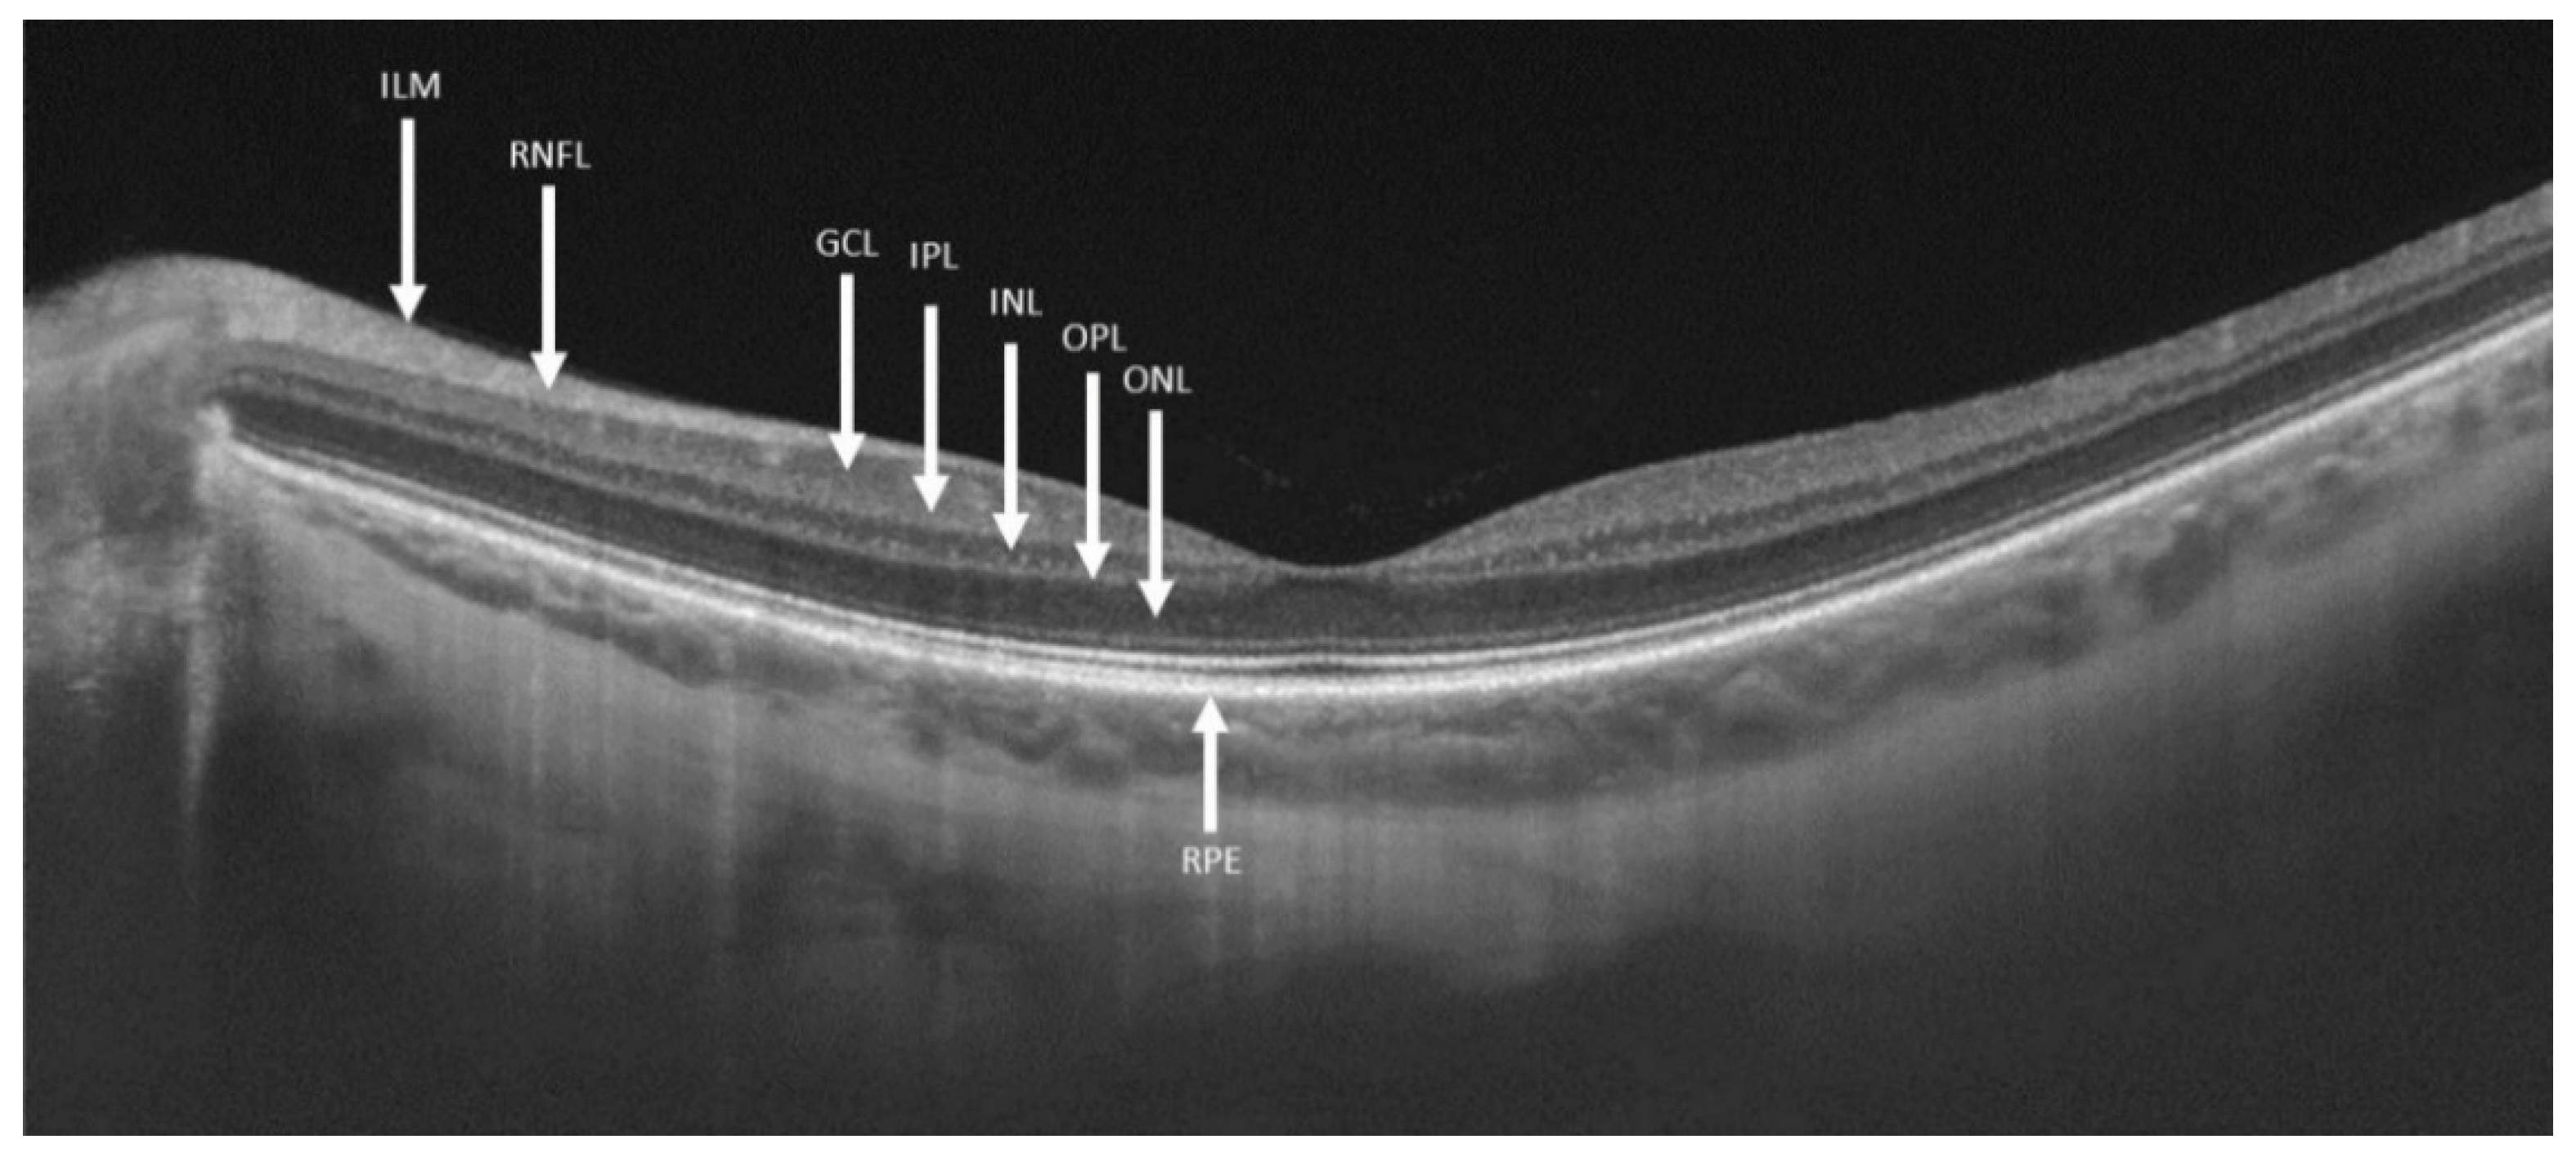
| GCL | Ganglion cell layer |
| RNFL | Retinal nerve fiber layer |
| ON | Optic nerve |
| GD3 | Type-3 Gaucher disease |
| ERG | Electroretinogram |
| VEP | Visual evoked potential |
| SZMC | Shaare Zedek Medical Center |
| DBS | Dried blood spot |
| IPL | Inner plexiform layer |
| INL | Inner nuclear layer |
| ILM | Inner limiting membrane |
| RPE | Retinal pigment epithelium |
References
- Abu-Asab, M.S.; Yeung, I.Y.L.; Ardeljan, C.; Gonzalez, A.N.; Sidransky, E.; Chan, C.-C. Ocular Implications of Gaucher Disease. In Advances in Vision Research, Volume I (Essentials in Ophthalmology); Prakash, G., Iwata, T., Eds.; Springer: Tokyo, Japan, 2017; pp. 413–423. [Google Scholar]
- Nalysnyk, L.; Rotella, P.; Simeone, J.C.; Hamed, A.; Weinreb, N. Gaucher disease epidemiology and natural history: A comprehensive review of the literature. Hematology 2017, 22, 65–73. [Google Scholar] [CrossRef] [PubMed] [Green Version]
- Zimran, A.; Elstein, D. Gaucher Disease and Related Lysosomal Storage Diseases. In Williams Hematology; Kaushansky, K., Lichtman, M.A., Prchal, J.T., Levi, M.M., Press, O.W., Burns, L.J., Caligiuri, M., Eds.; McGrawHilll: New York, NY, USA, 2015; pp. 1121–1131. ISBN 9780071833004. [Google Scholar]
- Chérin, P.; Rose, C.; De Roux-Serratrice, C.; Tardy, D.; Dobbelaere, D.; Grosbois, B.; Hachulla, E.; Jaussaud, R.; Javier, R.M.; Noël, E.; et al. The neurological manifestations of Gaucher disease type 1: The French Observatoire on Gaucher disease (FROG). J. Inherit. Metab. Dis. 2010, 33, 331–338. [Google Scholar] [CrossRef]
- Biegstraaten, M.; Wesnes, K.A.; Luzy, C.; Petakov, M.; Mrsic, M.; Niederau, C.; Giraldo, P.; Hughes, D.; Mehta, A.; Mengel, K.E.; et al. The cognitive profile of type 1 Gaucher disease patients. J. Inherit. Metab. Dis. 2012, 35, 1093–1099. [Google Scholar] [CrossRef] [Green Version]
- Capablo, J.L.; Saenz De Cabezón, A.; Fraile, J.; Alfonso, P.; Pocovi, M.; Giraldo, P. Neurological evaluation of patients with Gaucher disease diagnosed as type 1. J. Neurol. Neurosurg. Psychiatry 2008, 79, 219–222. [Google Scholar] [CrossRef]
- Riboldi, G.M.; Di Fonzo, A.B. GBA, Gaucher Disease, and Parkinson’s Disease: From Genetic to Clinic to New Therapeutic Approaches. Cells 2019, 8, 364. [Google Scholar] [CrossRef] [PubMed] [Green Version]
- Neudorfer, O.; Giladi, N.; Elstein, D.; Abrahamov, A.; Turezkite, T.; Achai, E.; Reches, A.; Bembi, B.; Zimran, A. Occurrence of Parkinson’s syndrome in type I Gaucher disease. QJM Int. J. Med. 1996, 89, 691–694. [Google Scholar] [CrossRef]
- Wong, K.; Sidransky, E.; Verma, A.; Mixon, T.; Sandberg, G.D.; Wakefield, L.K.; Morrison, A.; Lwin, A.; Colegial, C.; Allman, J.M.; et al. Neuropathology provides clues to the pathophysiology of Gaucher disease. Mol. Genet. Metab. 2004, 82, 192–207. [Google Scholar] [CrossRef]
- Sidransky, E. Gaucher disease: Complexity in a “simple” disorder. Mol. Genet. Metab. 2004, 83, 6–15. [Google Scholar] [CrossRef] [PubMed]
- La Morgia, C.; di Vito, L.; Carelli, V.; Carbonelli, M. Patterns of retinal ganglion cell damage in neurodegenerative disorders: Parvocellular vs magnocellular degeneration in optical coherence tomography studies. Front. Neurol. 2017, 8, 1–10. [Google Scholar] [CrossRef]
- Costello, F.E. Optical coherence tomography technologies: Which machine do you want to own? J. Neuro-Ophthalmol. 2014, 34, S3–S9. [Google Scholar] [CrossRef]
- Winter, A.W.; Salimi, A.; Ospina, L.H.; Roos, J.C.P. Ophthalmic manifestations of Gaucher disease: The most common lysosomal storage disorder. Br. J. Ophthalmol. 2019, 103, 315–326. [Google Scholar] [CrossRef] [PubMed]
- McNeill, A.; Roberti, G.; Lascaratos, G.; Hughes, D.; Mehta, A.; Garway-Heath, D.F.; Schapira, A.H.V. Retinal thinning in Gaucher disease patients and carriers: Results of a pilot study. Mol. Genet. Metab. 2013, 109, 221–223. [Google Scholar] [CrossRef] [PubMed]
- Matos, A.G.; Gurgel, V.P.; Gonçalves, M.C. Ophthalmologic findings in Gaucher’s disease type III: Case report. Rev. Bras. Oftalmol. 2017, 76, 316–318. [Google Scholar] [CrossRef]
- Casson, R.J.; Chidlow, G.; Wood, J.P.M. Estimate of the adenosine triphosphate requirement of human retinal ganglion cells. Clin. Exp. Ophthalmol. 2019, 47, 683–684. [Google Scholar] [CrossRef]
- Carelli, V.; La Morgia, C.; Ross-Cisneros, F.N.; Sadun, A.A. Optic neuropathies: The tip of the neurodegeneration iceberg. Hum. Mol. Genet. 2017, 26, R139–R150. [Google Scholar] [CrossRef] [Green Version]
- Corredor, R.G.; Goldberg, J.L. Retinal Ganglion Cell Life and Death—Mechanisms and Implications for Ophthalmology. Eur. Ophthalmic Rev. 2009, 3, 109. [Google Scholar] [CrossRef]
- Bruscolini, A.; Pia Pirraglia, M.; Restivo, L.; Spinucci, G.; Abbouda, A. A branch retinal artery occlusion in a patient with Gaucher disease. Graefe’s Arch. Clin. Exp. Ophthalmol. 2012, 250, 441–444. [Google Scholar] [CrossRef]
- Tumbarello, D.A.; Turner, C.E. Hic-5 Contributes to Transformation Through a RhoA/ROCK-dependent Pathway. J. Cell. Physiol. 2006, 211, 736–747. [Google Scholar] [CrossRef]
- Cleeter, M.W.J.; Chau, K.Y.; Gluck, C.; Mehta, A.; Hughes, D.A.; Duchen, M.; Wood, N.W.; Hardy, J.; Mark Cooper, J.; Schapira, A.H. Glucocerebrosidase inhibition causes mitochondrial dysfunction and free radical damage. Neurochem. Int. 2013, 62, 1–7. [Google Scholar] [CrossRef] [Green Version]
- Mead, B.; Tomarev, S. Evaluating retinal ganglion cell loss and dysfunction. Exp. Eye Res. 2016, 151, 96–106. [Google Scholar] [CrossRef] [Green Version]
- Smith, C.A.; Vianna, J.R.; Chauhan, B.C. Assessing retinal ganglion cell damage. Eye 2017, 31, 209–217. [Google Scholar] [CrossRef] [PubMed] [Green Version]
- You, Y.; Gupta, V.K.; Li, J.C.; Klistorner, A.; Graham, S.L. Optic neuropathies: Characteristic features and mechanisms of retinal ganglion cell loss. Rev. Neurosci. 2013, 24, 301–321. [Google Scholar] [CrossRef] [PubMed]
- Langeveld, M.; Elstein, D.; Szer, J.; Hollak, C.E.M.; Zimran, A. Classifying the additional morbidities of Gaucher disease. Blood Cells Mol. Dis. 2018, 68, 209–210. [Google Scholar] [CrossRef] [PubMed]
- O’Regan, G.; Desouza, R.M.; Balestrino, R.; Schapira, A.H. Glucocerebrosidase Mutations in Parkinson Disease. J. Parkinson’s Dis. 2017, 7, 411–422. [Google Scholar] [CrossRef] [Green Version]
- Rolfs, A.; Giese, A.K.; Grittner, U.; Mascher, D.; Elstein, D.; Zimran, A.; Böttcher, T.; Lukas, J.; Hübner, R.; Gölnitz, U.; et al. Glucosylsphingosine is a highly sensitive and specific biomarker for primary diagnostic and follow-up monitoring in gaucher disease in a non-jewish, caucasian cohort of gaucher disease patients. PLoS ONE 2013, 8, 1–9. [Google Scholar] [CrossRef]
- Zimran, A.; Gross, E.; West, C.; Sorge, J.; Kubitz, M.; Beutler, E. Prediction of Severity of Gaucher’S Disease By Identification of Mutations At Dna Level. Lancet 1989, 334, 349–352. [Google Scholar] [CrossRef]
- Sibille, A.; Eng, C.M.; Kim, S.J.; Pastores, G.; Grabowski, G.A. Phenotype/genotype correlations in Gaucher disease type 1: Clinical and therapeutic implications. Am. J. Hum. Genet. 1993, 52, 1094–1101. [Google Scholar]
- Treatment, E.; Retinopathy, D. Grading Diabetic Retinopathy from Stereoscopic Color Fundus Photographs—An Extension of the Modified Airlie House Classification: ETDRS Report Number 10. Ophthalmology 1991, 98, 786–806. [Google Scholar] [CrossRef]


| Control Group | Gaucher Patients | p Value | |
|---|---|---|---|
| Males (%) | 13 (43.3%) | 16 (53.3%) | 0.492 |
| Age (years) | 51.17 ± 8.93 | 51.10 ± 9.79 | 0.729 |
| Refraction (D) | −0.78 ± 2.14 | −1.28 ± 2.30 | 0.542 |
| Control Eyes (n = 60) | Gaucher eyes (n = 60) | p Value | |
|---|---|---|---|
| Macular OCT quality | 62.97 ± 5.17 | 61.28 ± 6.35 | 0.142 |
| Macular volume (mm3) | 7.69 ± 0.38 | 7.66 ± 0.27 | 0.648 |
| Macular retinal thickness (µm) | 271.98 ± 13.34 | 270.82 ± 9.62 | 0.631 |
| Optic nerve OCT quality | 62.62 ± 4.15 | 61.5 ± 5.02 | 0.196 |
| Abnormal optic nerve scans (%) | 5 (8.3%) | 22 (36.7%) | <0.001 |
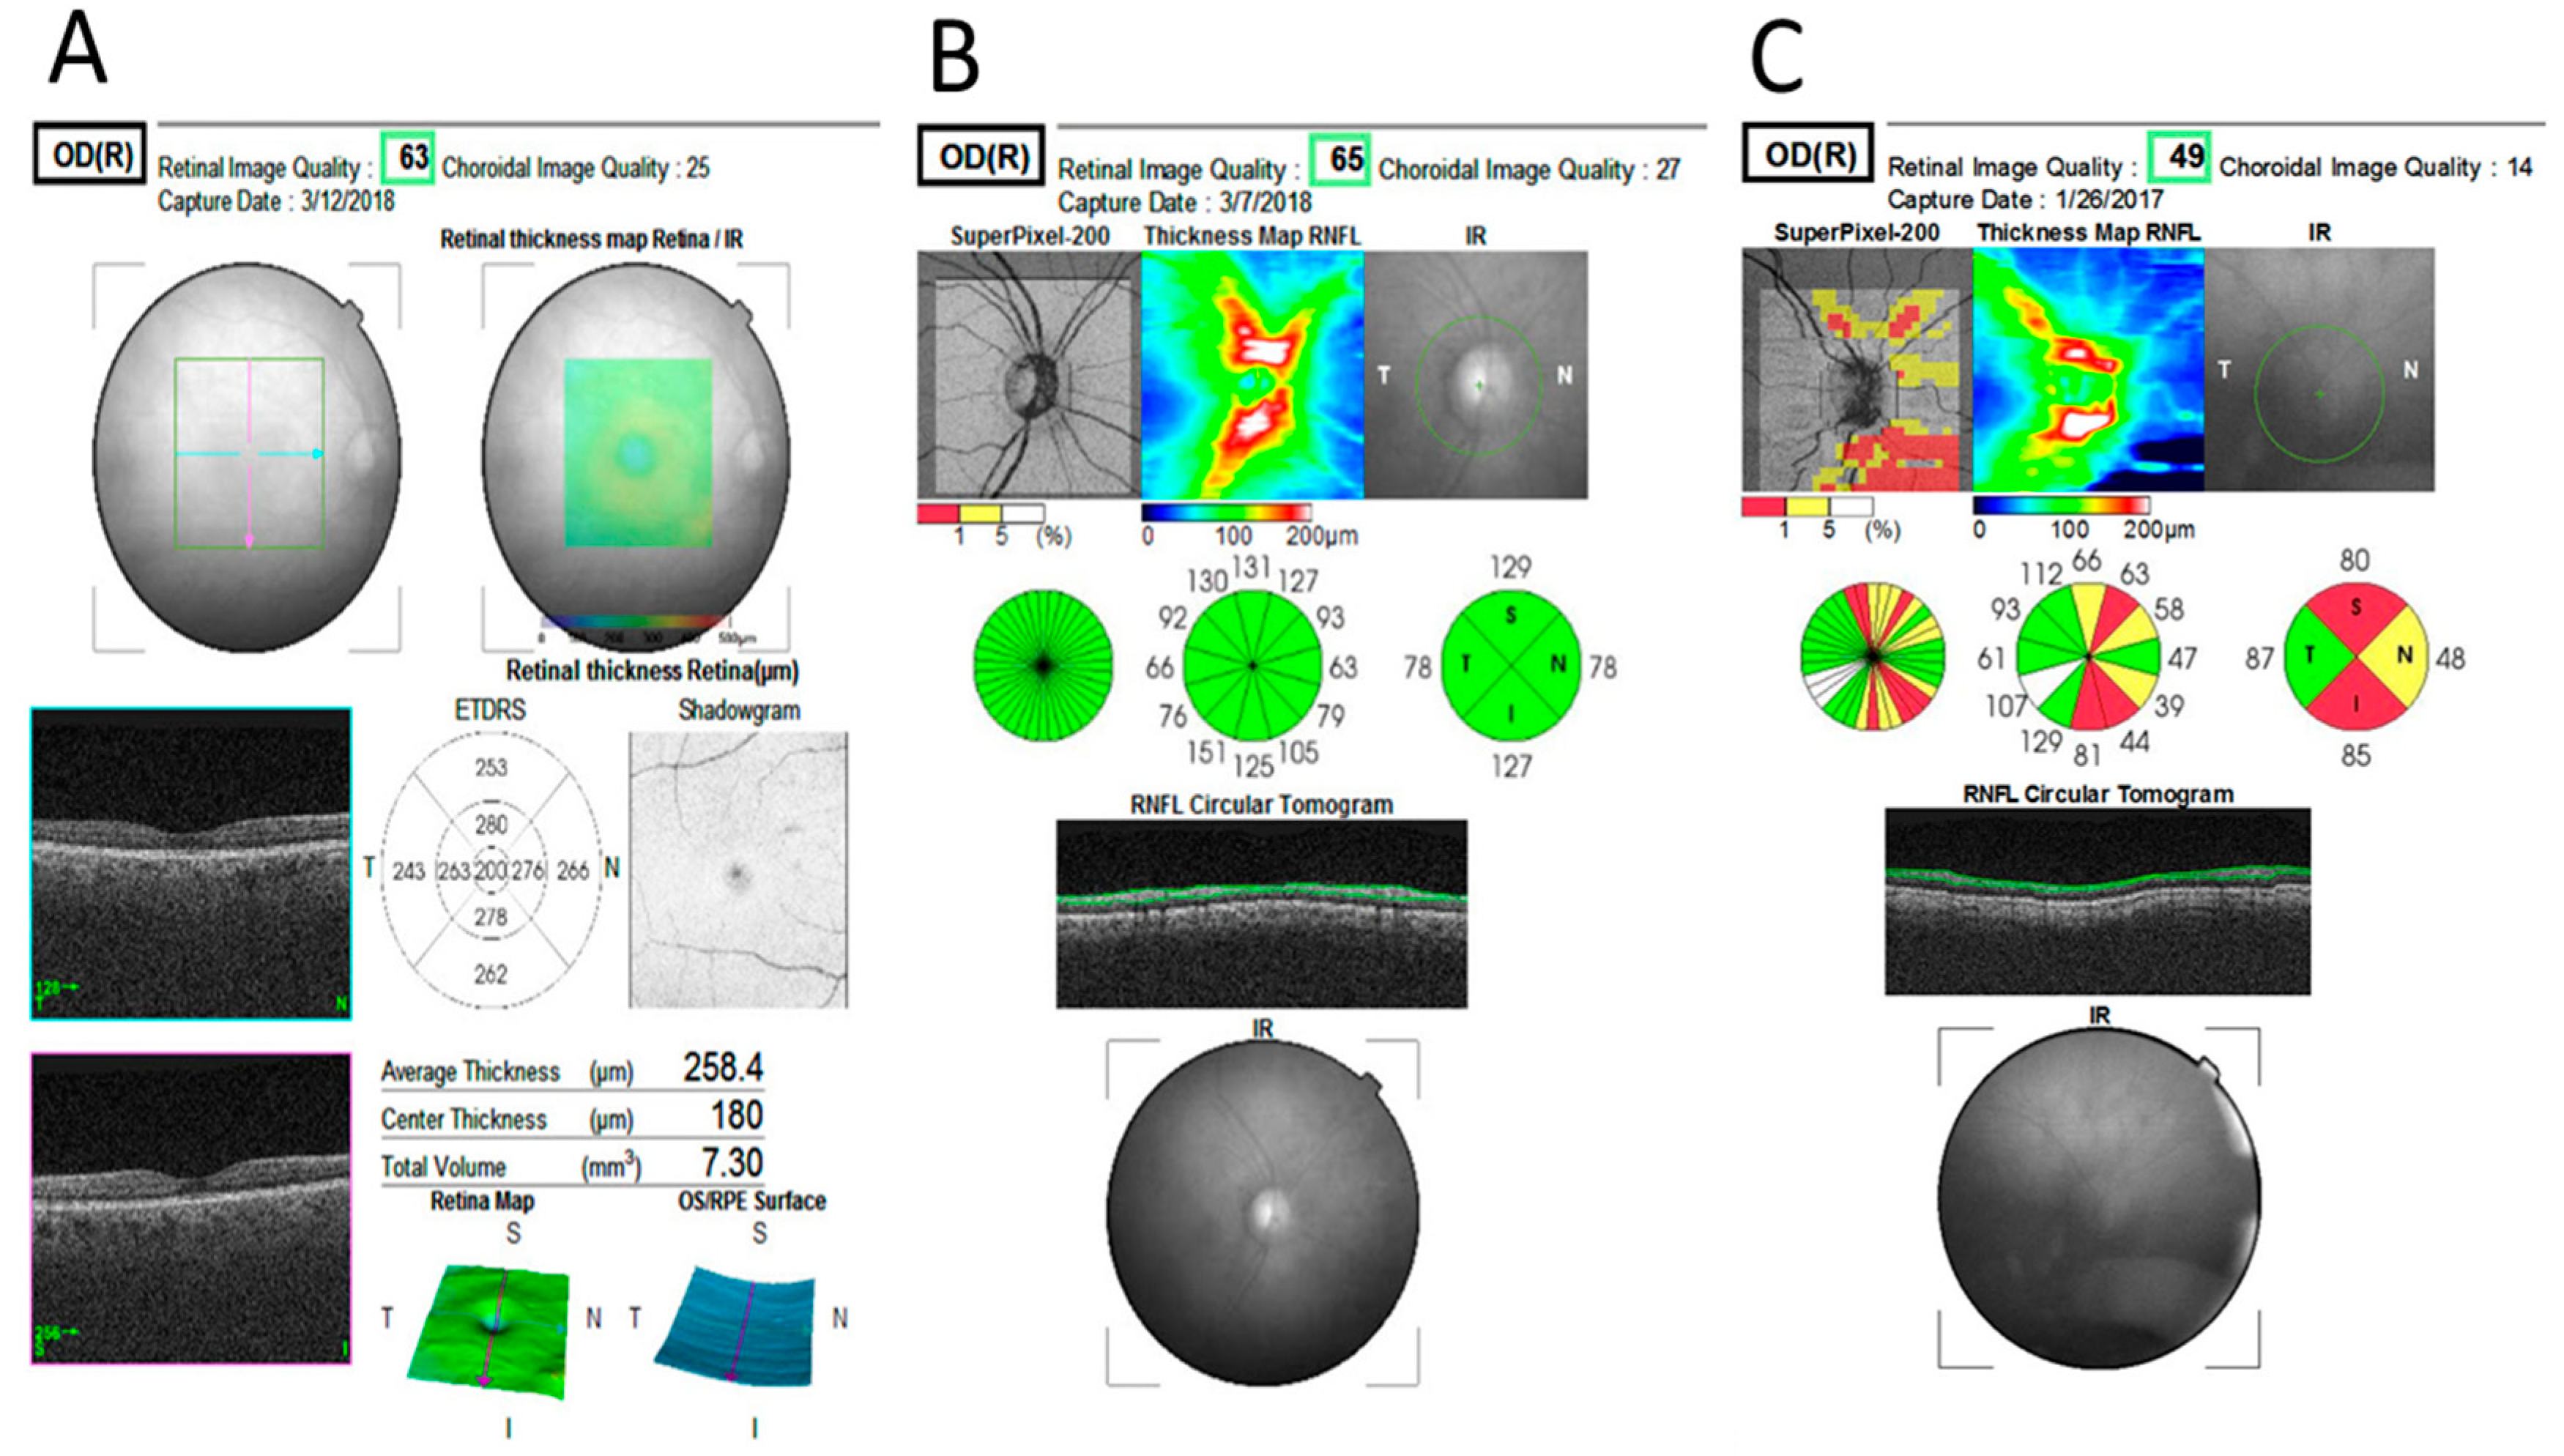
| Peripapillary RNFL (µm) | |||
| Average | 106.40 ± 8.78 | 97.63 ± 8.42 | <0.001 |
| Temporal | 73.63 ± 11.81 | 69.13 ± 13.40 | 0.220 |
| Superior | 130.57 ± 11.55 | 118.78 ± 16.15 | <0.001 |
| Nasal | 83.30 ± 15.73 | 77.38 ± 22.04 | 0.015 |
| Inferior | 138.07 ± 18.09 | 125.20 ± 16.36 | <0.001 |
| Macular GCC layer (µm) | |||
| Total average | 73.92 ± 4.90 | 72.60 ± 4.84 | 0.557 |
| Outer Average | 64.89 ± 4.63 | 62.83 ± 4.69 | 0.226 |
| central | 47.70 ± 10.88 | 50.03 ± 10.34 | 0.110 |
| inner temporal | 86.70 ± 6.48 | 85.28 ± 7.64 | 0.417 |
| Inner superior | 91.07 ± 6.52 | 89.02 ± 8.38 | 0.250 |
| Inner nasal | 92.02 ± 7.24 | 89.77 ± 7.71 | 0.281 |
| Inner inferior | 88.28 ± 8.55 | 88.03 ± 7.51 | 0.646 |
| Outer temporal | 68.17 ± 5.49 | 66.65 ± 5.28 | 0.091 |
| Outer superior | 60.12 ± 4.63 | 59.58 ± 5.08 | 0.315 |
| Outer nasal | 68.02 ± 5.24 | 65.17 ± 6.17 | 0.003 |
| outer inferior | 63.92 ± 6.55 | 59.95 ± 6.50 | 0.002 |
© 2020 by the authors. Licensee MDPI, Basel, Switzerland. This article is an open access article distributed under the terms and conditions of the Creative Commons Attribution (CC BY) license (http://creativecommons.org/licenses/by/4.0/).
Share and Cite
Weill, Y.; Zimran, A.; Zadok, D.; Wasser, L.M.; Revel-Vilk, S.; Hanhart, J.; Dinur, T.; Arkadir, D.; Becker-Cohen, M. Macular Ganglion Cell Complex and Peripapillary Retinal Nerve Fiber Layer Thinning in Patients with Type-1 Gaucher Disease. Int. J. Mol. Sci. 2020, 21, 7027. https://0-doi-org.brum.beds.ac.uk/10.3390/ijms21197027
Weill Y, Zimran A, Zadok D, Wasser LM, Revel-Vilk S, Hanhart J, Dinur T, Arkadir D, Becker-Cohen M. Macular Ganglion Cell Complex and Peripapillary Retinal Nerve Fiber Layer Thinning in Patients with Type-1 Gaucher Disease. International Journal of Molecular Sciences. 2020; 21(19):7027. https://0-doi-org.brum.beds.ac.uk/10.3390/ijms21197027
Chicago/Turabian StyleWeill, Yishay, Ari Zimran, David Zadok, Lauren M. Wasser, Shoshana Revel-Vilk, Joel Hanhart, Tama Dinur, David Arkadir, and Michal Becker-Cohen. 2020. "Macular Ganglion Cell Complex and Peripapillary Retinal Nerve Fiber Layer Thinning in Patients with Type-1 Gaucher Disease" International Journal of Molecular Sciences 21, no. 19: 7027. https://0-doi-org.brum.beds.ac.uk/10.3390/ijms21197027