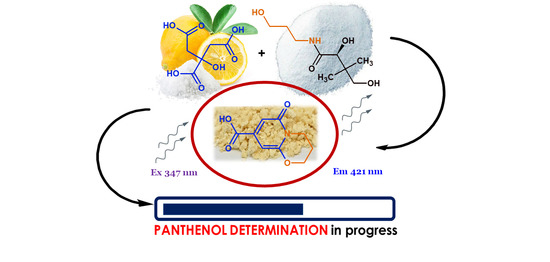
Fluorescence Assay for the Determination of d-Panthenol Based on Novel Ring-Fused 2-Pyridone Derivative


Abstract
:
1. Introduction
2. Results and Discussion
3. Materials and Methods
3.1. Materials
3.2. Methods
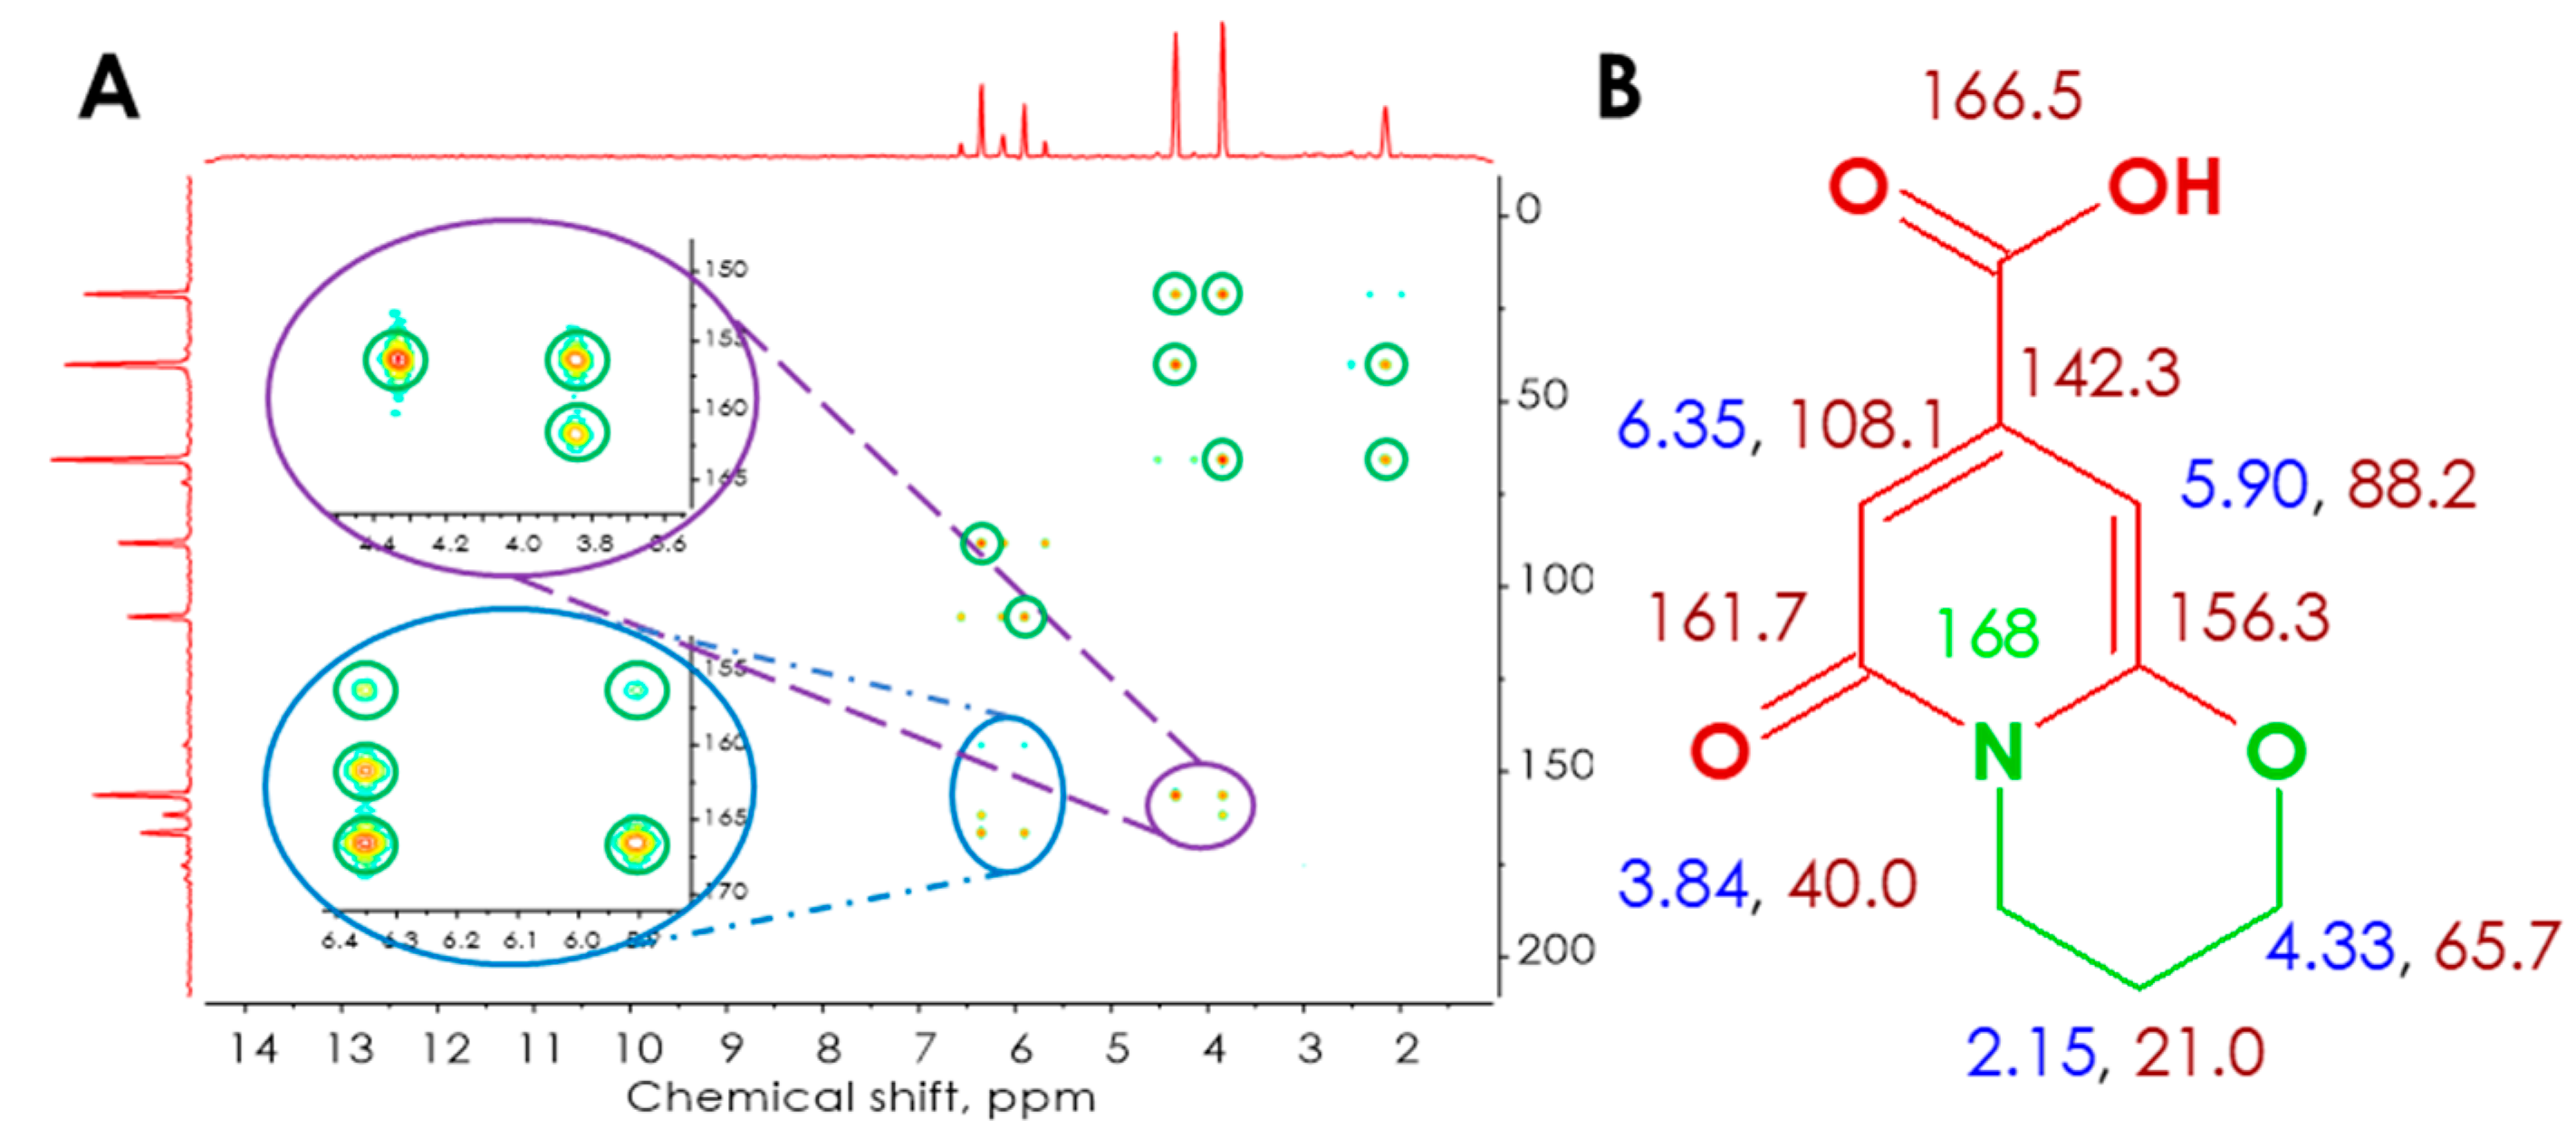
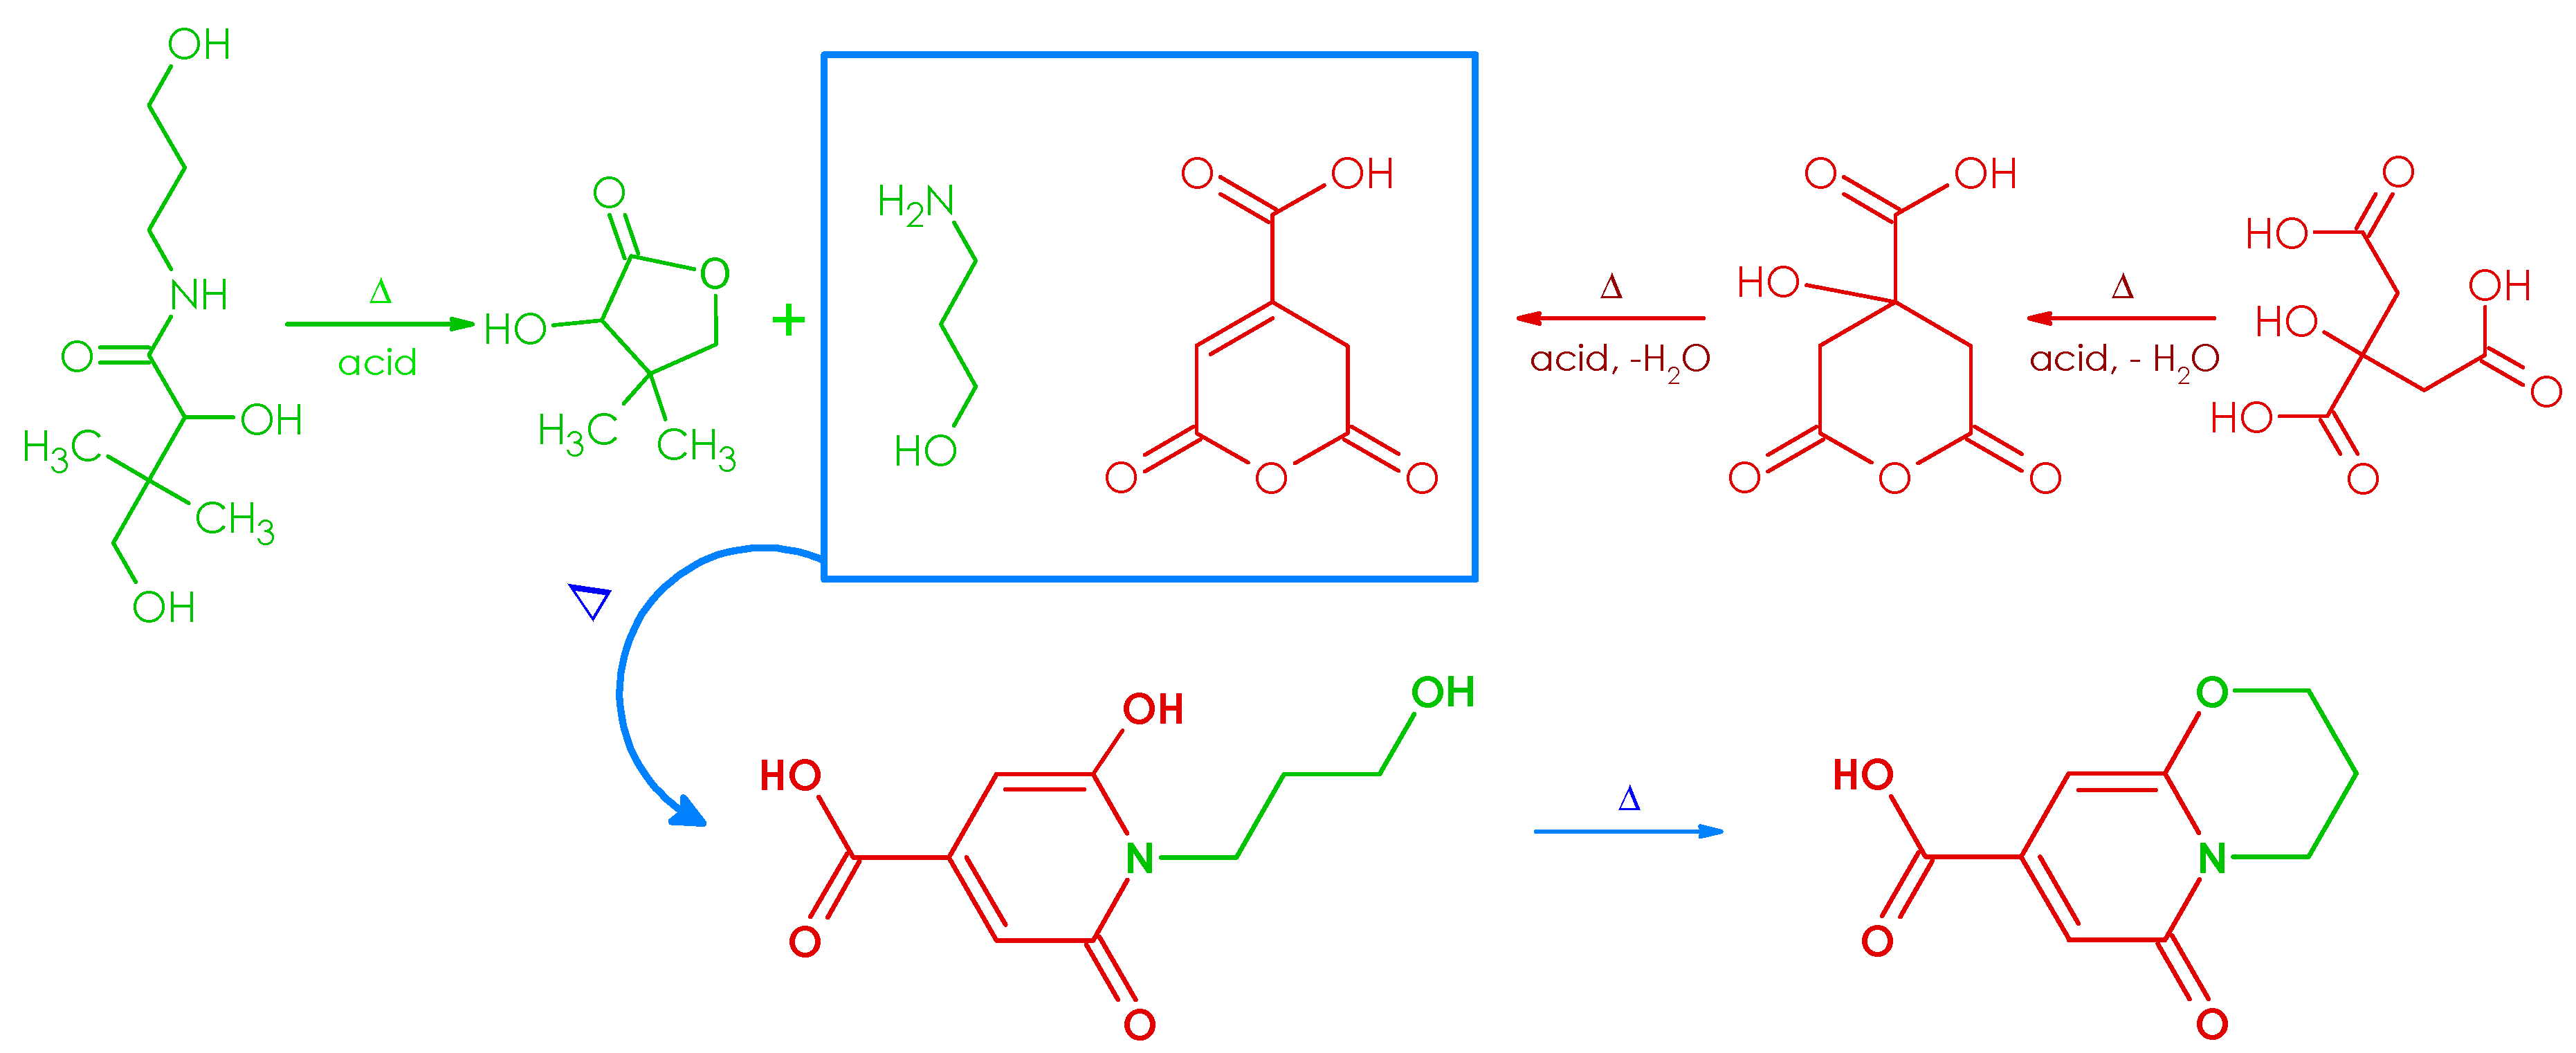
3.2.1. Synthesis, Separation, and Structure Elucidation of the Fluorophore
3.2.2. Conditions of Chromatographic Separation
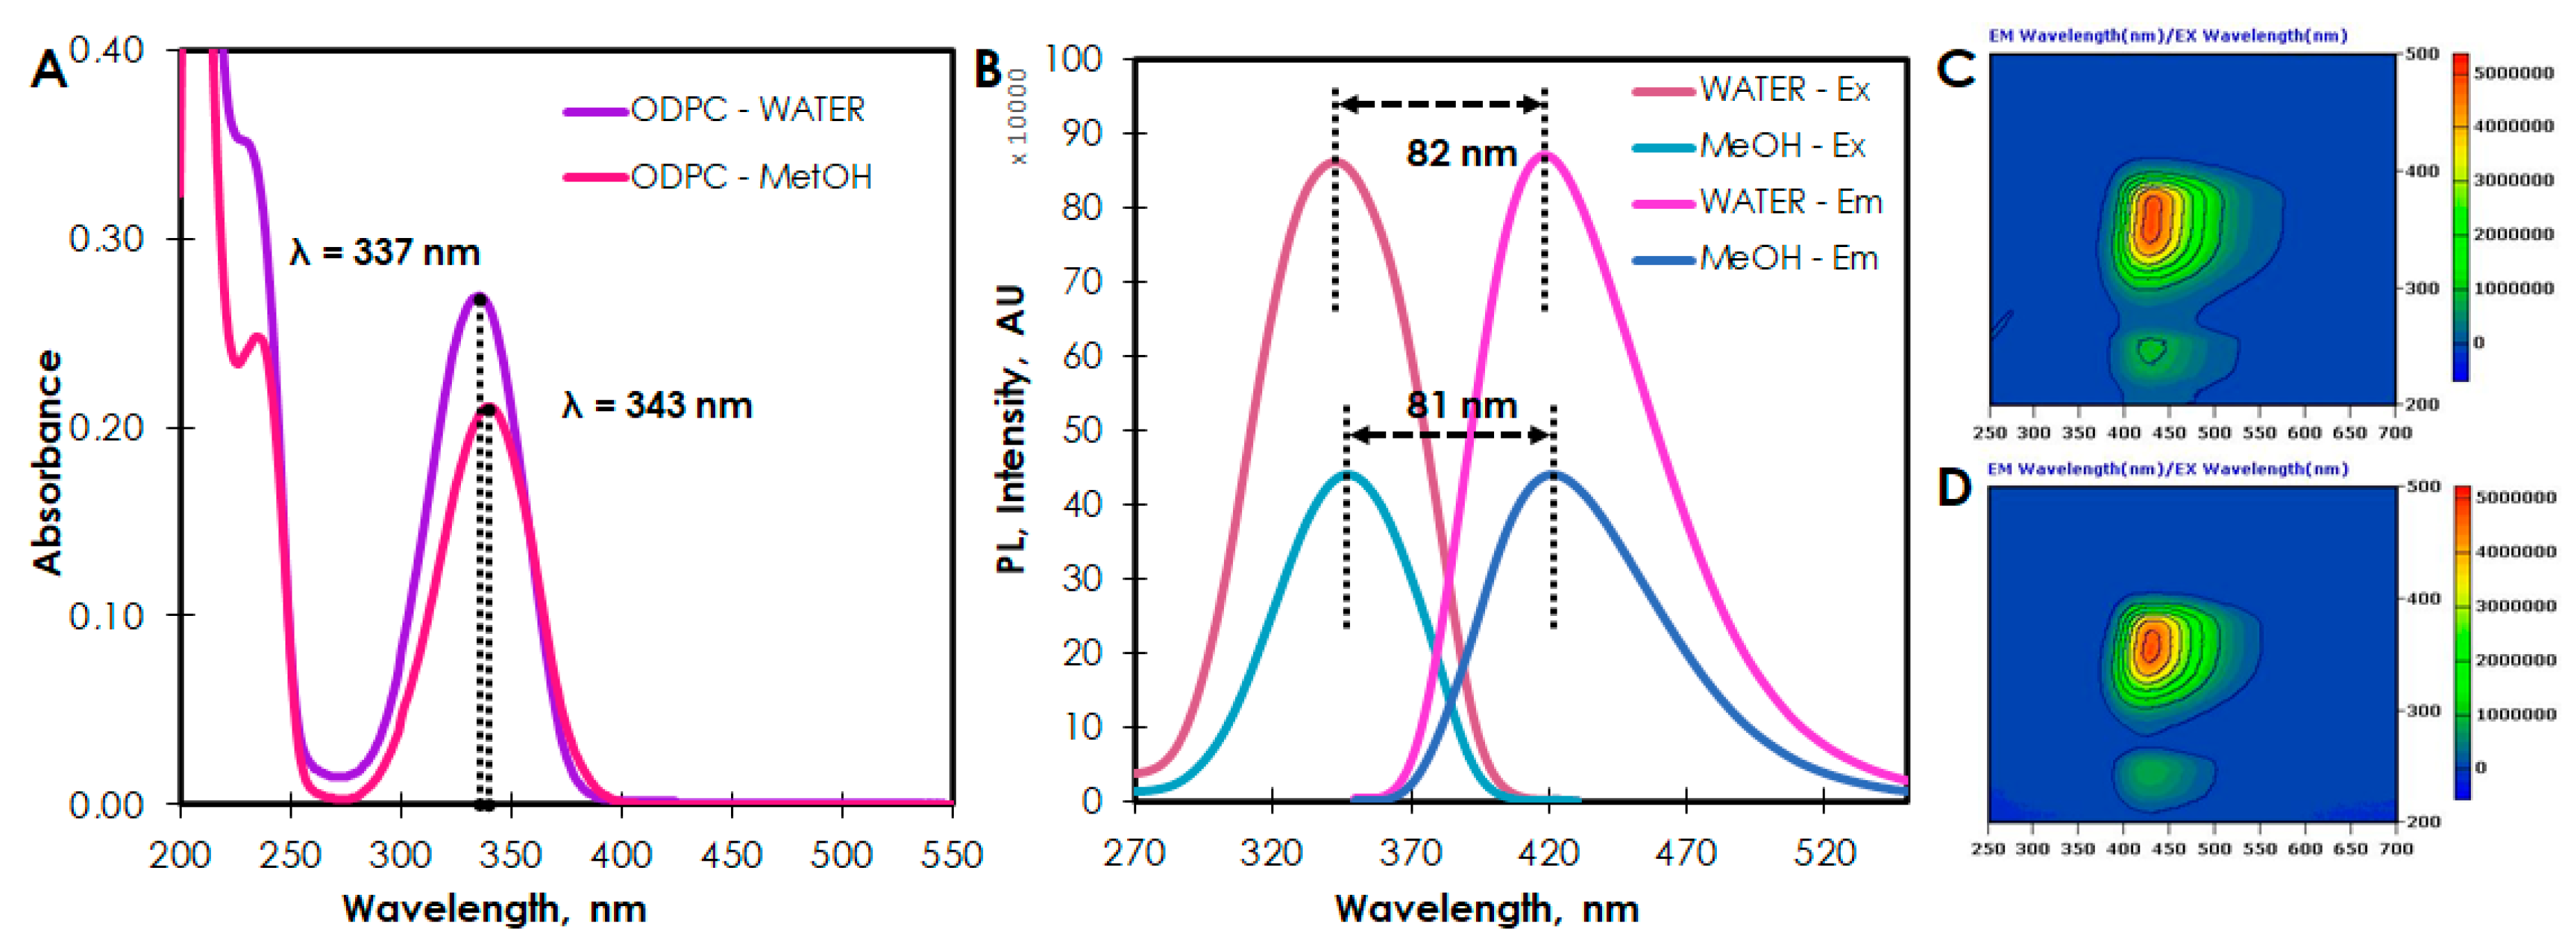
3.2.3. Optical Properties Characterization
- and the quantum yield of a sample and the standard;
- and absorption of a sample and the standard at 408 nm;
- and integral of fluorescence intensity of a sample and the standard;
- and the refractive index of solvent used for a sample and the standard.
3.3. Determination of DP Concentration
3.3.1. Preparation of Standard Solutions
3.3.2. Derivatization of DP
3.3.3. Pharmaceutical Sample Preparation
4. Conclusions
Supplementary Materials
Author Contributions
Funding
Conflicts of Interest
References
- Wang, L.H.; Tseng, S.W. Direct determination of D-panthenol and salt of pantothenic acid in cosmetic and pharmaceutical preparations by differential pulse voltammetry. Anal. Chim. Acta 2001, 432, 39–48. [Google Scholar] [CrossRef]
- Prival, M.J.; Simmon, V.F.; Mortelmans, K.E. Bacterial mutagenicity testing of 49 food ingredients gives very few positive results. Mutat. Res. Toxicol. 1991, 260, 321–329. [Google Scholar] [CrossRef]
- Ishidate, M.; Sofuni, T.; Yoshikawa, K.; Hayashi, M.; Nohmi, T.; Sawada, M.; Matsuoka, A. Primary mutagenicity screening of food additives currently used in Japan. Food Chem. Toxicol. 1984, 22, 623–636. [Google Scholar] [CrossRef]
- König, W.A.; Sturm, U. Determination of optical purity by enantioselective capillary gas chromatography: panthenol and related compounds. J. Chromatogr. A 1985, 328, 357–361. [Google Scholar] [CrossRef]
- Zholobak, N.M.; Shcherbakov, A.B.; Bogorad-Kobelska, A.S.; Ivanova, O.S.; Baranchikov, A.Y.; Spivak, N.Y.; Ivanov, V.K. Panthenol-stabilized cerium dioxide nanoparticles for cosmeceutic formulations against ROS-induced and UV-induced damage. J. Photochem. Photobiol. B Biol. 2014, 130, 102–108. [Google Scholar] [CrossRef]
- Kobayashi, D.; Kusama, M.; Onda, M.; Nakahata, N. The effect of pantothenic acid deficiency on keratinocyte proliferation and the synthesis of keratinocyte growth factor and collagen in fibroblasts. J. Pharmacol. Sci. 2011, 115, 230–234. [Google Scholar] [CrossRef] [PubMed] [Green Version]
- Semieka, M.A.; Ali, M.M.; Khafar, S.A.; Al-lethie, A. lethie A.; Elmeligy, E. Comparative Study of the Therapeutic Effect of Panthenol Gel and Mebo Ointment on Metacarpal Wound Healing in Donkeys. J. Equine Vet. Sci. 2019, 74, 21–27. [Google Scholar] [CrossRef]
- Khater, S.; West, C. Development and validation of a supercritical fluid chromatography method for the direct determination of enantiomeric purity of provitamin B5 in cosmetic formulations with mass spectrometric detection. J. Pharm. Biomed. Anal. 2015, 102, 321–325. [Google Scholar] [CrossRef]
- Vidović, S.; Stojanović, B.; Veljković, J.; Pražić-Arsić, L.; Roglić, G.; Manojlović, D. Simultaneous determination of some water-soluble vitamins and preservatives in multivitamin syrup by validated stability-indicating high-performance liquid chromatography method. J. Chromatogr. A 2008, 1202, 155–162. [Google Scholar] [CrossRef]
- Bui-nguyen, M.H. Direct determination of D-panthenol in pharmaceutical preparations by ion-pair chromatography. J. Chromatogr. 1984, 303, 291–295. [Google Scholar] [CrossRef]
- Kulikov, A.U.; Zinchenko, A.A. Development and validation of reversed phase high performance liquid chromatography method for determination of dexpanthenol in pharmaceutical formulations. J. Pharm. Biomed. Anal. 2007, 43, 983–988. [Google Scholar] [CrossRef] [PubMed]
- Shehata, M.A.M.; Tawakkol, S.M.; Abdel Fattah, L.E. Colorimetric and fluorimetric methods for determination of panthenol in cosmetic and pharmaceutical formulation. J. Pharm. Biomed. Anal. 2002, 27, 729–735. [Google Scholar] [CrossRef]
- Tarli, P.; Benocci, S.; Neri, P. Gas-chromatographic determination of pantothenates and panthenol in pharmaceutical preparations by pantoyl lactone. Anal. Biochem. 1971, 42, 8–13. [Google Scholar] [CrossRef]
- Eid, M.I.; Wahba, M.E.K. Analytical and Stability Studies on Medical Cosmetics. Am. J. Anal. Chem. 2012, 03, 277–281. [Google Scholar] [CrossRef] [Green Version]
- Shehata, M.A.; Tawakkol, S.M. Spectrophotometric and Fluorimetric Methods for Determination of Additives in Cosmetics and Pharmaceutical Formulations. Saudi Pharm. J. 2014, 12, 29–34. [Google Scholar]
- Prosser, A.R.; Sheppard, A.J. Gas--liquid chromatographic determination of pantothenates and panthenol. J. Pharm. Sci. 1969, 58, 718–721. [Google Scholar] [CrossRef] [PubMed]
- Panier, R.G.; Close, J.A. Quantitative fluorometric determination of panthenol in multivitamin preparations. J. Pharm. Sci. 1964, 53, 108–110. [Google Scholar] [CrossRef]
- Uehara, N.; Ookubo, K.; Shimizu, T. Colorimetric assay of glutathione based on the spontaneous disassembly of aggregated gold nanocomposites conjugated with water-soluble polymer. Langmuir 2010, 26, 6818–6825. [Google Scholar] [CrossRef]
- Shimizu, S.; Tani, Y.; Ogata, K. Diversity of the Degradation of Panthenol by Microorganisms. Agric. Biol. Chem. 1974, 38, 1989. [Google Scholar] [CrossRef]
- Samejima, K.; Dairman, W.; Stone, J.; Udenfriend, S. Condensation of ninhydrin with aldehydes and primary amines to yield highly fluorescent ternary products. II. Application to the Detection and Assay of Peptides, Amino Acids, Amines, and Amino Sugars. Anal. Biochem. 1971, 42, 237–247. [Google Scholar] [CrossRef]
- Zacharis, C.K.; Tzanavaras, P.D.; Mouroutis, P.N.; Rigas, P.G. NBD-Cl as a post-column reagent for primary and secondary amines after separation by ion-exchange chromatography. Anal. Lett. 2011, 44, 1821–1834. [Google Scholar] [CrossRef]
- Tran, R.T.; Yang, J.; Ameer, G.A. Citrate-Based Biomaterials and Their Applications in Regenerative Engineering. Annu. Rev. Mater. Res. 2015, 45, 1–34. [Google Scholar] [CrossRef] [PubMed] [Green Version]
- Hola, K.; Zhang, Y.; Wang, Y.; Giannelis, E.P.; Zboril, R.; Rogach, A.L. Carbon dots - Emerging light emitters for bioimaging, cancer therapy and optoelectronics. Nano Today 2014, 9, 590–603. [Google Scholar] [CrossRef]
- Reckmeier, C.J.; Schneider, J.; Susha, A.S.; Rogach, A.L. Luminescent colloidal carbon dots: optical properties and effects of doping [Invited]. Opt. Express 2016, 24, A312. [Google Scholar] [CrossRef]
- Fu, M.; Ehrat, F.; Wang, Y.; Milowska, K.Z.; Reckmeier, C.; Rogach, A.L.; Stolarczyk, J.K.; Urban, A.S.; Feldmann, J. Carbon Dots: A Unique Fluorescent Cocktail of Polycyclic Aromatic Hydrocarbons. Nano Lett. 2015, 15, 6030–6035. [Google Scholar] [CrossRef]
- Schneider, J.; Reckmeier, C.J.; Xiong, Y.; Von, M.; Susha, A.S.; Kasak, P.; Rogach, A.L. Molecular Fluorescence in Citric Acid Based Carbon Dots. J. Phys. Chem. Lett. 2017, 121, 2014–2022. [Google Scholar] [CrossRef]
- Ehrat, F.; Bhattacharyya, S.; Schneider, J.; Löf, A.; Wyrwich, R.; Rogach, A.L.; Stolarczyk, J.K.; Urban, A.S.; Feldmann, J. Tracking the Source of Carbon Dot Photoluminescence: Aromatic Domains versus Molecular Fluorophores. Nano Lett. 2017, 17, 7710. [Google Scholar] [CrossRef]
- Kasprzyk, W.; Bednarz, S.; Walas, K.; Bashmakova, N.V. Nanoscale from citric acid and urea—A molecular insight †. Nanoscale 2018, 13889–13894. [Google Scholar] [CrossRef]
- Kasprzyk, W.; Bednarz, S.; Żmudzki, P.; Galica, M.; Bogdał, D. Novel efficient fluorophores synthesized from citric acid. RSC Adv. 2015, 5, 34795–34799. [Google Scholar] [CrossRef]
- Kasprzyk, W.; Krzywda, P.; Bednarz, S.; Bogdał, D. Fluorescent citric acid-modified silicone materials. RSC Adv. 2015, 5. [Google Scholar] [CrossRef]
- Kasprzyk, W.; Bednarz, S.; Bogdał, D. Luminescence phenomena of biodegradable photoluminescent poly(diol citrates). Chem. Commun. 2013, 49, 6445–6447. [Google Scholar] [CrossRef]
- Kim, J.P.; Xie, Z.; Creer, M.; Liu, Z.; Yang, J. Citrate-based fluorescent materials for low-cost chloride sensing in the diagnosis of cystic fibrosis. Chem. Sci. 2016, 8. [Google Scholar] [CrossRef] [Green Version]
- Liu, M.; Lu, X.; Hu, L.; Liu, C.; Li, Y.; Zhang, W.; Ding, C.; Gu, J.; Cao, F. Hydrothermal synthesis of a highly photoluminescent molecule from citric acid and cysteamine for the e ffi cient detection of Au3+ in aqueous solution. Opt. Mater. (Amst.) 2019, 96, 109359. [Google Scholar] [CrossRef]
- Rubin, S.H. The Comparative Stability of Pantothenic Acid and Panthenol. J. Am. Pharm. Assoc. (Sci. Ed.) 1948, 37, 502–504. [Google Scholar] [CrossRef] [PubMed]
- Zhu, S.; Zhao, X.; Song, Y.; Lu, S.; Yang, B. Beyond bottom-up carbon nanodots: Citric-acid derived organic molecules. Nano Today 2015. [Google Scholar] [CrossRef]
- Dong, X.; Su, Y.; Geng, H.; Li, Z.; Yang, C.; Li, X.; Zhang, Y. Fast one-step synthesis of N-doped carbon dots by pyrolyzing ethanolamine. J. Mater. Chem. C 2014, 2, 7477. [Google Scholar] [CrossRef]
- Du, F.; Min, Y.; Zeng, F.; Yu, C.; Wu, S. A targeted and FRET-based ratiometric fluorescent nanoprobe for imaging mitochondrial hydrogen peroxide in living cells. Small 2014, 10, 964–972. [Google Scholar] [CrossRef] [PubMed]
- Bourlinos, A.B.; Stassinopoulos, A.; Anglos, D.; Zboril, R.; Karakassides, M.; Giannelis, E.P. Surface functionalized carbogenic quantum dots. Small 2008, 4, 455–458. [Google Scholar] [CrossRef] [PubMed]
- Lakowicz, J.R. Principles of Fluorescence Spectroscopy, 3rd ed.; Springer: Berlin/Heilderlberg, Germany, 2006; ISBN 978-0-387-31278-1. [Google Scholar]
- Kamińska, I.; Ortyl, J.; Popielarz, R. Mechanism of interaction of coumarin-based fluorescent molecular probes with polymerizing medium during free radical polymerization of a monomer. Polym. Test. 2016, 55, 310–317. [Google Scholar] [CrossRef]
- Ortyl, J.; Fiedor, P.; Chachaj-Brekiesz, A.; Pilch, M.; Hola, E.; Galek, M. The applicability of 2-amino-4,6-diphenyl-pyridine-3-carbonitrile sensors for monitoring different types of photopolymerization processes and acceleration of cationic and free-radical photopolymerization under near UV light. Sensors 2019, 19, 1668. [Google Scholar] [CrossRef] [Green Version]
- Lomenova, A.; Hroboňová, K.; Šolónyová, T. HPLC separation of panthenol enantiomers on different types of chiral stationary phases. Acta Chim. Slovaca 2018, 11, 114–119. [Google Scholar] [CrossRef] [Green Version]
- Hroboňová, K.; Lomenova, A. Determination of panthenol enantiomers in cosmetic preparations using an achiral--chiral–coupled column HPLC system. Chirality 2020, 32, 191–199. [Google Scholar] [CrossRef]
- Jones, G.; Jackson, W.R.; Choi, C.Y.; Bergmark, W.R. Solvent effects on emission yield and lifetime for coumarin laser dyes. Requirements for a rotatory decay mechanism. J. Phys. Chem. 1985, 89, 294–300. [Google Scholar] [CrossRef]


| Method | ||||
|---|---|---|---|---|
| Parameters | Fluorescence | LC-MS | ||
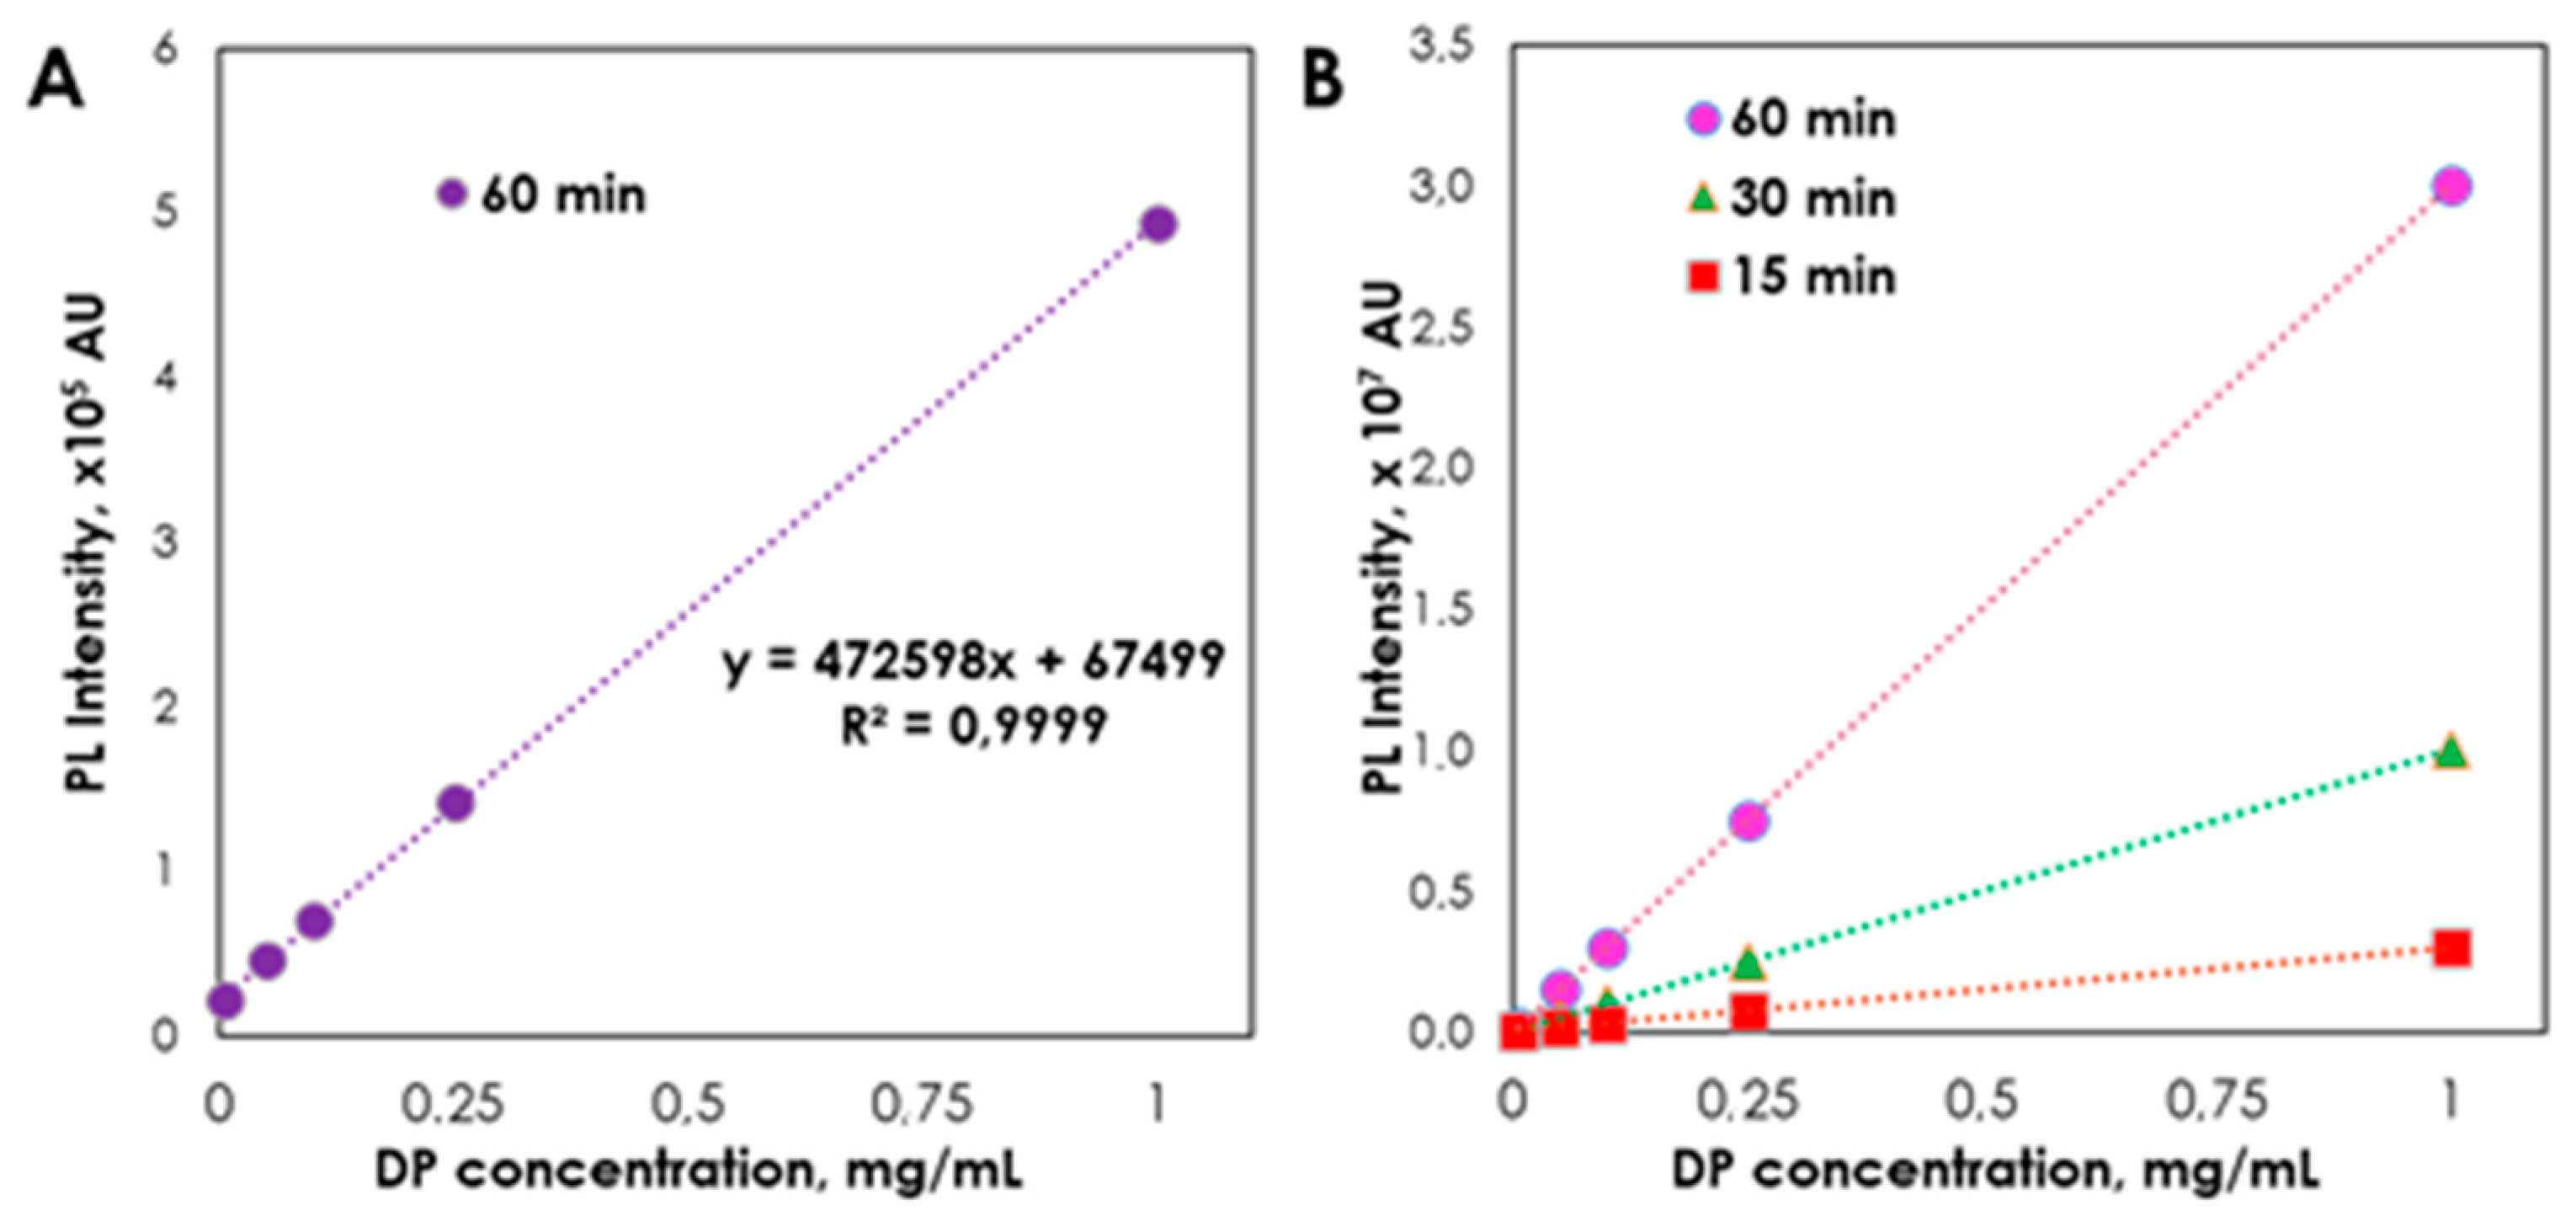
| Regression equation | A = 472598x + 67499 | A = 543834x + 63551 | ||
| Linear range (mg/mL) | 0.005–1.000 | 0.005–1.000 | ||
| Limit of detection (mg/mL) | 0.001 | 0.0005 | ||
| Limit of quantitation (mg/mL) | 0.005 | 0.0075 | ||
| Correlation coefficients (r) | 0.999 | 0.999 | ||
| Intraday precision and accuracy (mg/mL) | Accuracy, % | Precision, RSD % | Accuracy, % | Precision, RSD % |
| 0.005 | 98.5 | 1.5 | 98.2 | 2.0 |
| 0.05 | 99.1 | 1.8 | 98.1 | 1.7 |
| 0.1 | 99.6 | 2.2 | 99.4 | 1.9 |
| Pharmaceutical Formulations | Fluorescence Method | LC-MS Method | ||||
|---|---|---|---|---|---|---|
| Found (mg) | Equivalent Nominal Content ±S.D. (%) | Recovery (%) | Found (mg) | Equivalent Nominal Content ±S.D. (%) | Recovery (%) | |
| nasal liquid | 49.8 | 99.52 ± 1.10 | 99.85 ± 1.52 | 49.9 | 99.62 ± 1.11 | 99.02 ± 1.85 |
| ointment | 49.5 | 98.92 ± 1.52 | 99.56 ± 1.92 | 49.5 | 99.12 ± 2.52 | 99.33 ± 1.32 |
| body lotion | 49.2 | 98.10 ± 2.12 | 99.46 ± 1.82 | 49.4 | 98.80 ± 2.16 | 99.36 ± 1.12 |
Publisher’s Note: MDPI stays neutral with regard to jurisdictional claims in published maps and institutional affiliations. |
© 2020 by the authors. Licensee MDPI, Basel, Switzerland. This article is an open access article distributed under the terms and conditions of the Creative Commons Attribution (CC BY) license (http://creativecommons.org/licenses/by/4.0/).
Share and Cite
Kasprzyk, W.; Świergosz, T.; Koper, F. Fluorescence Assay for the Determination of d-Panthenol Based on Novel Ring-Fused 2-Pyridone Derivative. Int. J. Mol. Sci. 2020, 21, 8386. https://0-doi-org.brum.beds.ac.uk/10.3390/ijms21218386
Kasprzyk W, Świergosz T, Koper F. Fluorescence Assay for the Determination of d-Panthenol Based on Novel Ring-Fused 2-Pyridone Derivative. International Journal of Molecular Sciences. 2020; 21(21):8386. https://0-doi-org.brum.beds.ac.uk/10.3390/ijms21218386
Chicago/Turabian StyleKasprzyk, Wiktor, Tomasz Świergosz, and Filip Koper. 2020. "Fluorescence Assay for the Determination of d-Panthenol Based on Novel Ring-Fused 2-Pyridone Derivative" International Journal of Molecular Sciences 21, no. 21: 8386. https://0-doi-org.brum.beds.ac.uk/10.3390/ijms21218386