Article

The Histamine 3 Receptor Is Expressed in the Heart and Its Activation Opposes Adverse Cardiac Remodeling in the Angiotensin II Mouse Model

by
Samuel L. McCaffrey
1,2,
Grace Lim
1,
Martyn Bullock
1,
Ainsley O. Kasparian
1,3,
Roderick Clifton-Bligh
1,
William B. Campbell
4,
Alexander Widiapradja
1,2 and
Scott P. Levick
1,2,*
1
Kolling Institute for Medical Research, Royal North Shore Hospital, St Leonards, NSW 2064, Australia
2
Faculty of Medicine and Health, The University of Sydney, Camperdown, NSW 2006, Australia
3
School of Life Sciences, University of Technology Sydney, Ultimo, NSW 2007, Australia
4
Department of Pharmacology and Toxicology, Medical College of Wisconsin, Milwaukee, WI 53226, USA
*
Author to whom correspondence should be addressed.
Int. J. Mol. Sci. 2020, 21(24), 9757; https://0-doi-org.brum.beds.ac.uk/10.3390/ijms21249757
Submission received: 11 December 2020 / Revised: 14 December 2020 / Accepted: 17 December 2020 / Published: 21 December 2020
(This article belongs to the Special Issue Extracellular Matrix in Heart Disease 2.0)

Abstract

:
Histamine is a basic amine stored in mast cells, with its release capable of activating one of four histamine receptors. The histamine 3 receptor (H3R) is known to be cardioprotective during acute ischemia by acting to limit norepinephrine release. However, a recent study reported that myofibroblasts isolated from the infarct zone of rat hearts responded to H3R activation by up-regulating collagen production. Thus, it is necessary to clarify the potential role of the H3R in relation to fibrosis in the heart. We identified that the mouse left ventricle (LV) expresses the H3R. Isolation of mouse cardiac fibroblasts determined that while angiotensin II (Ang II) increased levels of the H3R, these cells did not produce excess collagen in response to H3R activation. Using the Ang II mouse model of adverse cardiac remodeling, we found that while H3R blockade had little effect on cardiac fibrosis, activation of the H3R reduced cardiac fibrosis and macrophage infiltration. These findings suggest that when activated, the H3R is anti-inflammatory and anti-fibrotic in the mouse heart and may be a promising target for protecting against cardiac fibrosis.

1. Introduction

Adverse myocardial remodeling, including cardiac fibrosis and cardiomyocyte hypertrophy, can lead to LV diastolic and systolic dysfunction and eventual heart failure. There is substantial evidence to support a contribution of mast cells to cardiac fibrosis in particular, through the release of pre-stored mediators such as the proteases tryptase and chymase [1,2,3,4,5,6,7,8,9]. Histamine, which is derived from the amino acid histidine via decarboxylation by the enzyme histidine decarboxylase, is another pre-stored mast cell product. Upon its release, histamine can bind to any of four G-protein coupled histamine receptors. These are the histamine 1 receptor (H1R), histamine 2 receptor (H2R), H3R, and histamine 4 receptor (H4R). Of these four histamine receptors, there is already strong evidence supporting a role for the H2R in the development of cardiac fibrosis. The H2R is expressed by cardiac fibroblasts, and its activation can stimulate a pro-fibrotic phenotype in isolated mouse cardiac fibroblasts [10]. H2R deletion in mice led to reduced cardiac fibrosis and improved cardiac function following aortic banding. Clinically, the Multi-Ethnic Study of Atherosclerosis (MESA) trial reported that patients receiving H2R antagonist treatment for gastric acid production had a 62% lower risk of developing heart failure [11].
Conversely, the H3R has traditionally been associated with cardioprotection. Seminal work from Roberto Levi’s group demonstrated that the H3R is localized to presynaptic cardiac sympathetic nerve fibers and, when activated during acute ischemia, acts to limit norepinephrine release [12,13,14,15]. The functional outcome of H3R activation with imetit during acute ischemia-reperfusion was a reduction in the incidence of ventricular fibrillation and arrhythmias [16]. However, a recent article by Piera et al. [17] reported that myofibroblasts isolated from the infarct zone of rat hearts following four weeks of ischemia responded to the H3R agonist imetit by up-regulating collagen production. This indicated a possible long-term pro-fibrotic role for the H3R. Importantly though, this study only investigated isolated fibroblasts and did not establish an in vivo role for the H3R in cardiac fibrosis. Thus, there is a need to clarify the contribution, if any, of the H3R to cardiac fibrosis in vivo. Accordingly, we used the Ang II-infused mouse model to investigate the role of the H3R in cardiac fibrosis. We found that (1) the H3R is expressed in the mouse LV; (2) isolated cardiac fibroblasts possess the H3R, which was up-regulated in response to Ang II; (3) blockade of the H3R with A331440 did not alter cardiac fibrosis or inflammation; and (4) activation of the H3R with imetit significantly reduced cardiac fibrosis and macrophage infiltration.

2. Results

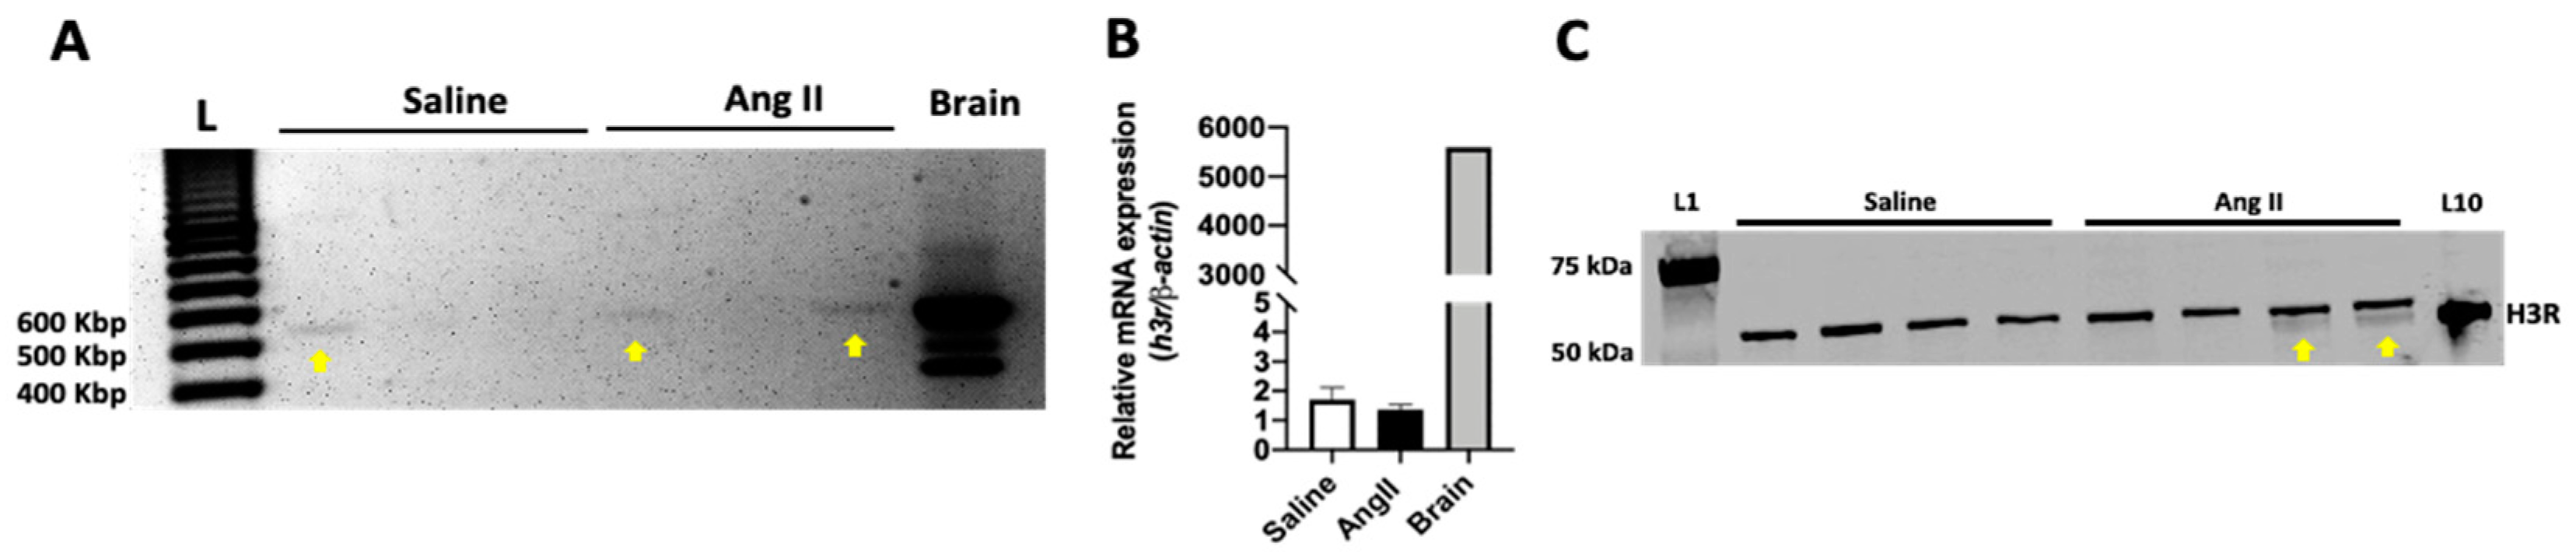
2.1. The H3R Is Expressed in the Mouse Heart

We first determined whether the H3R was expressed in the mouse heart, as well as the number of isoforms expressed. For the positive control brain, PCR revealed the expected three products corresponding to the ~530, 430, and 400 bp isoforms of the H3R as described previously [18] (Figure 1A and Figure S1). However, the mouse LV expressed only the 530 bp isoform. Furthermore, a PCR product was not detected for every LV. Sanger sequencing of the 530 bp product revealed a 99% match for the mouse H3R in both the LV and brain (Figures S2 and S3A,B). A 200 bp product observed in the LV samples was also sequenced and identified as endoplasmic reticulum chaperone SIL1 homolog (Figures S2 and S3C,D). Using real-time PCR, we quantified H3R LV expression levels for saline and Ang II groups. Due to the more sensitive nature of real-time PCR, we were able to detect product for the H3R in all hearts and found no difference in H3R expression levels between saline and Ang II groups (Figure 1B). We then investigated H3R protein in saline and Ang II hearts. Western blotting revealed two bands at, and slightly above, the predicted 50 kDa molecular weight for the H3R protein in the Ang II heart but only the larger product for the saline heart (Figure 1C and Figure S4). Using the brain as a positive control and indicator of the correct molecular weight, we concluded that the lower band of the doublet represented the actual H3R, and the upper band was non-specific binding. Therefore, while mRNA levels were equal between the two groups, it appeared that the H3R is translated to protein only in Ang II hearts.

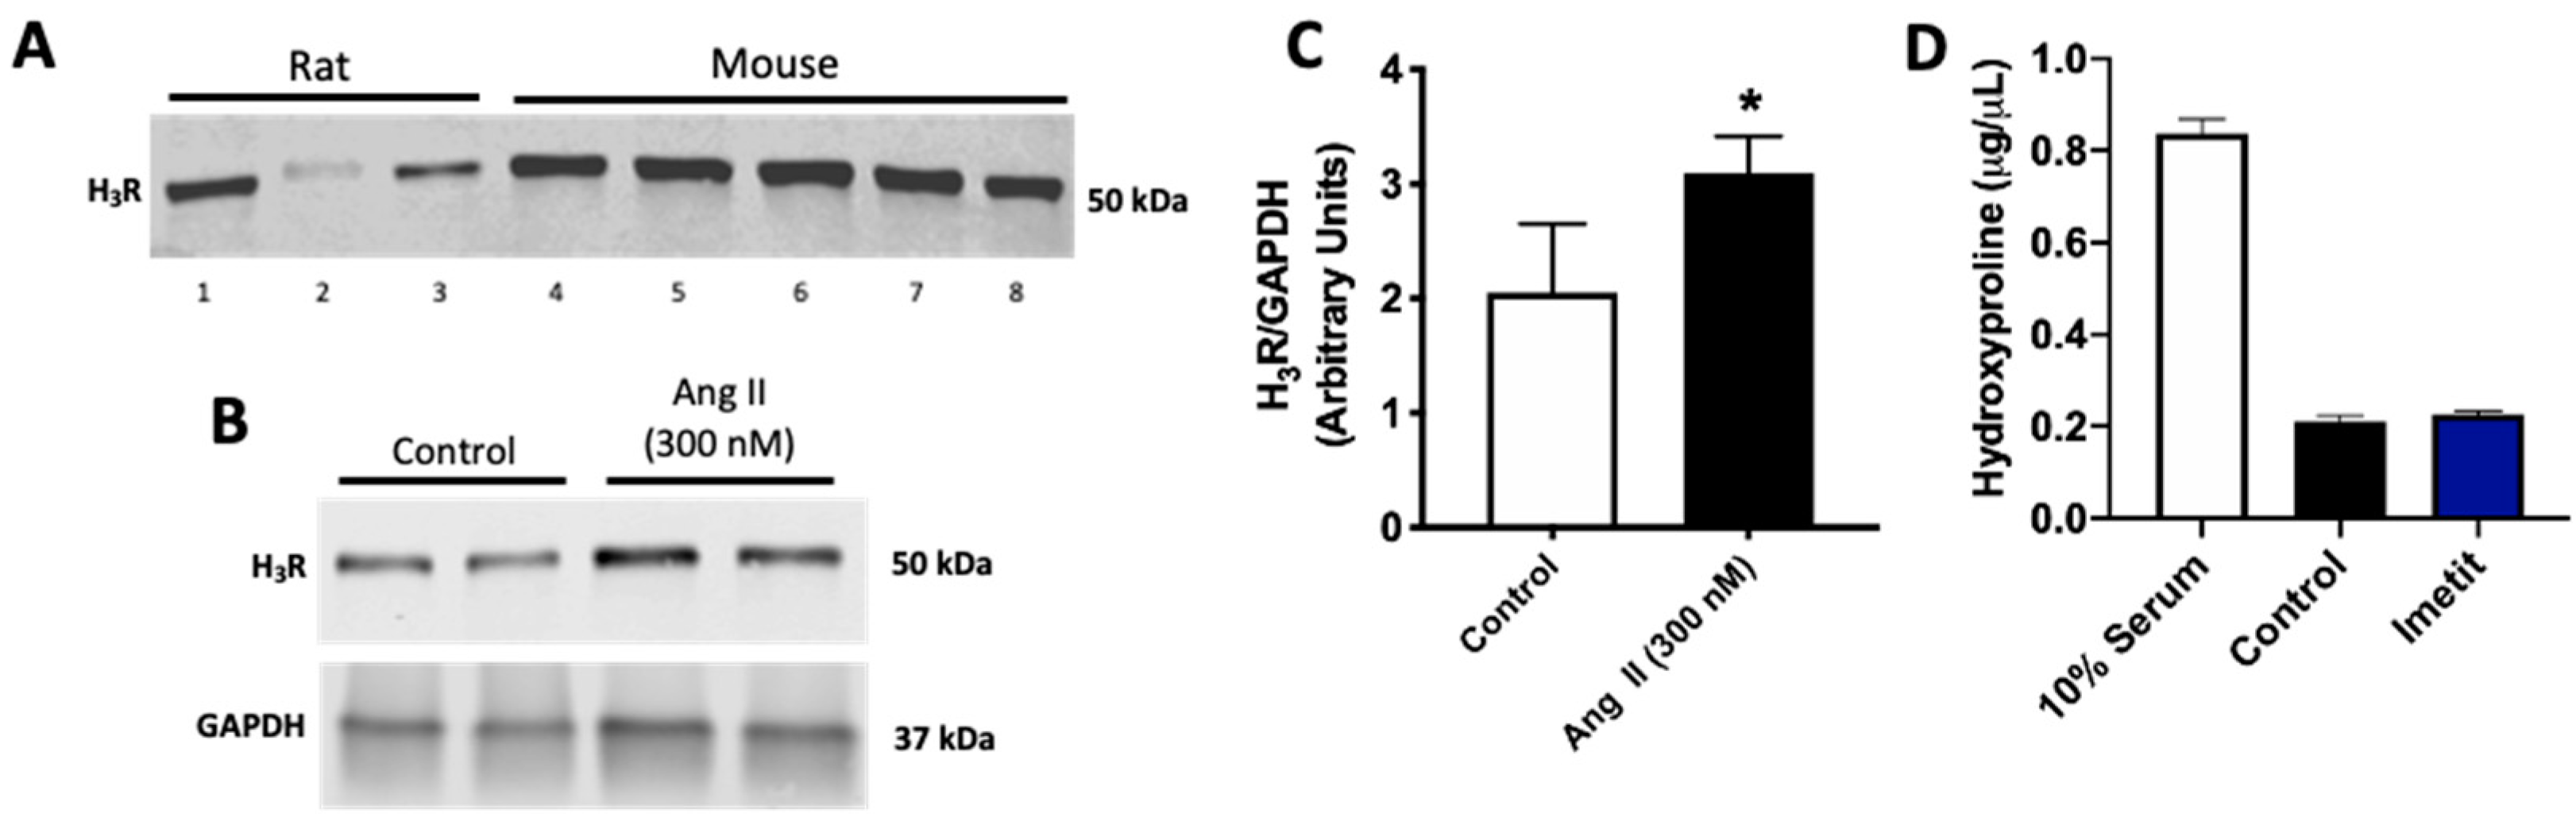
2.2. Ang II Increases H3R Levels in Isolated Cardiac Fibroblasts

Recent literature suggests that the H3R is expressed on isolated rat cardiac myofibroblasts and that its activation may be involved in the positive regulation of collagen production by these cells [17]. We sought to determine whether the presence of the H3R was restricted to the myofibroblast phenotype. Accordingly, we sought to determine whether culture conditions influencing fibroblast phenotype could alter H3R expression. We cultured isolated rat and mouse cardiac fibroblasts under various conditions designed to maintain the quiescent fibroblast phenotype or to promote a myofibroblast phenotype. Western blotting identified the H3R on isolated cardiac fibroblasts and myofibroblasts under all conditions tested (Figure 2A, see Figure Legend for culture condition details, Figure S5). Subsequently, we treated isolated mouse cardiac fibroblasts with Ang II, which significantly increased the amount of H3R on those cells (p < 0.05, Figure 2B,C and Figure S6). However, while the 10% serum positive control increased hydroxyproline as a surrogate for collagen production, treatment of isolated mouse cardiac fibroblasts with the H3R agonist imetit did not increase the production of hydroxyproline by these cells (p = 0.32 vs. Control, Figure 2D).

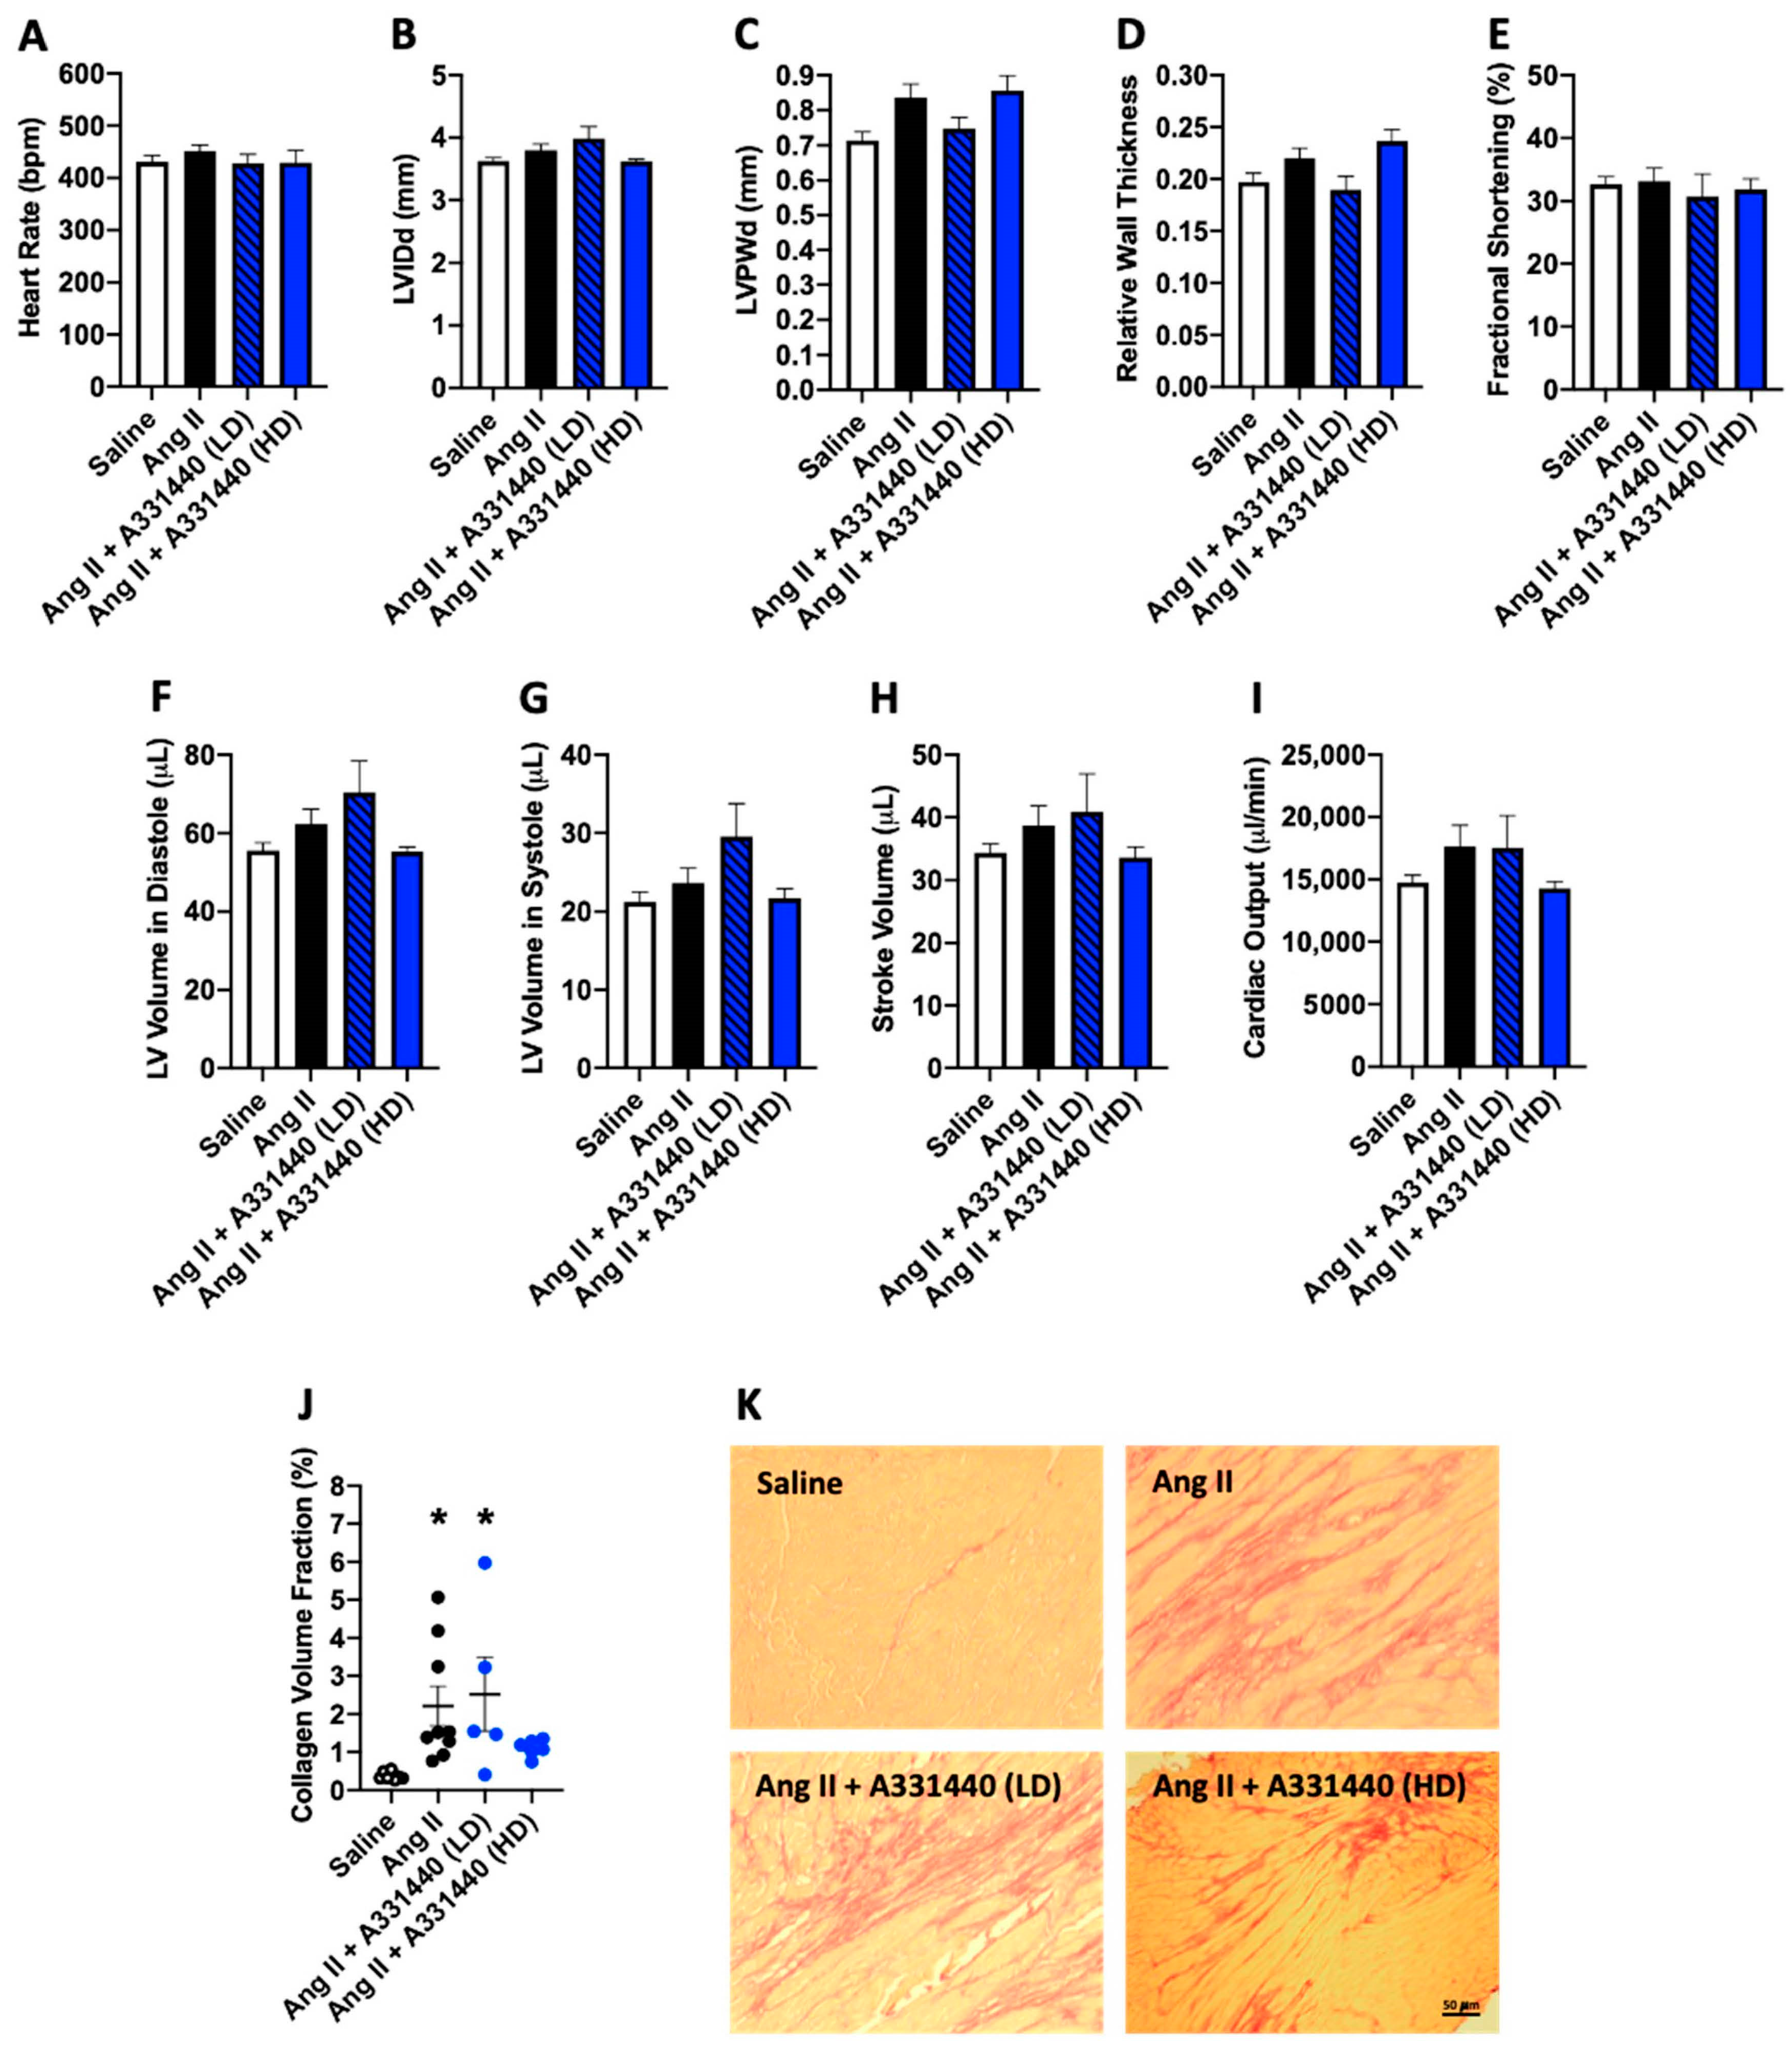
2.3. Effect of H3R Blockade on LV Structure and Function in Ang-II-Infused Mice

Although H3R activation did not induce a pro-fibrotic phenotype for isolated cardiac fibroblasts, for completeness we tested the effect of H3R blockade in vivo. Table 1 displays the biometric data for mice treated with the H3R antagonist A331440. Body weight was not different between untreated saline and Ang II mice. Low-dose A331440 (10 mg/kg/day) did not alter body weight, however, body weight was significantly lower in the high-dose A331440 group (20 mg/kg/day, p < 0.01 vs. saline, p < 0.0001 vs. Ang II, p < 0.001 vs. Ang II + A331440 LD). Ang II caused a significant increase in LV mass (p < 0.001) as well as the LV/tibia ratio (p < 0.01) compared to the saline group. There was a non-significant trend for LV mass to also be increased in Ang II mice receiving low-dose A331440 (p = 0.15 vs. saline, p = 0.99 vs. Ang II); the same trend existed for the LV/tibia ratio (p = 0.15 vs. saline, p = 0.97 vs. Ang II). LV mass was normalized by treatment with high-dose A331440 (p < 0.01 vs. Ang II, p < 0.001 vs. Ang II + A331440 LD, p = 0.99 vs. saline), as was the LV/tibia ratio (p < 0.01 vs. Ang II, p < 0.001 vs. Ang II + A331440 LD, p = 0.99 vs. saline). There were no significant differences between any of the groups for right ventricular (RV) mass, lung mass, RV/tibia, or lung/tibia ratios. While, generally speaking, there were no significant differences in the echocardiography parameters assessed (Figure 3A–I and Figure S7), there was a strong trend for LVPWd to be increased in Ang II (p = 0.07 vs. saline) and high-dose Ang II + A331440 groups (p = 0.06 vs. saline, Figure 3C). There were no differences in functional parameters between groups (Figure 3E,H,I).

2.4. H3R Blockade Did Not Alter Cardiac Fibrosis

Next, we examined whether H3R blockade altered cardiac fibrosis. Ang II increased collagen volume fraction in the LV compared to saline controls, indicative of fibrosis (Figure 3J,K, p < 0.05). Neither low-dose nor high-dose H3R antagonist A331440 significantly reduced cardiac fibrosis compared to Ang-II-infused mice (p = 0.91 low-dose A331440 vs. Ang II; p = 0.11 high-dose A331440 vs. Ang II).

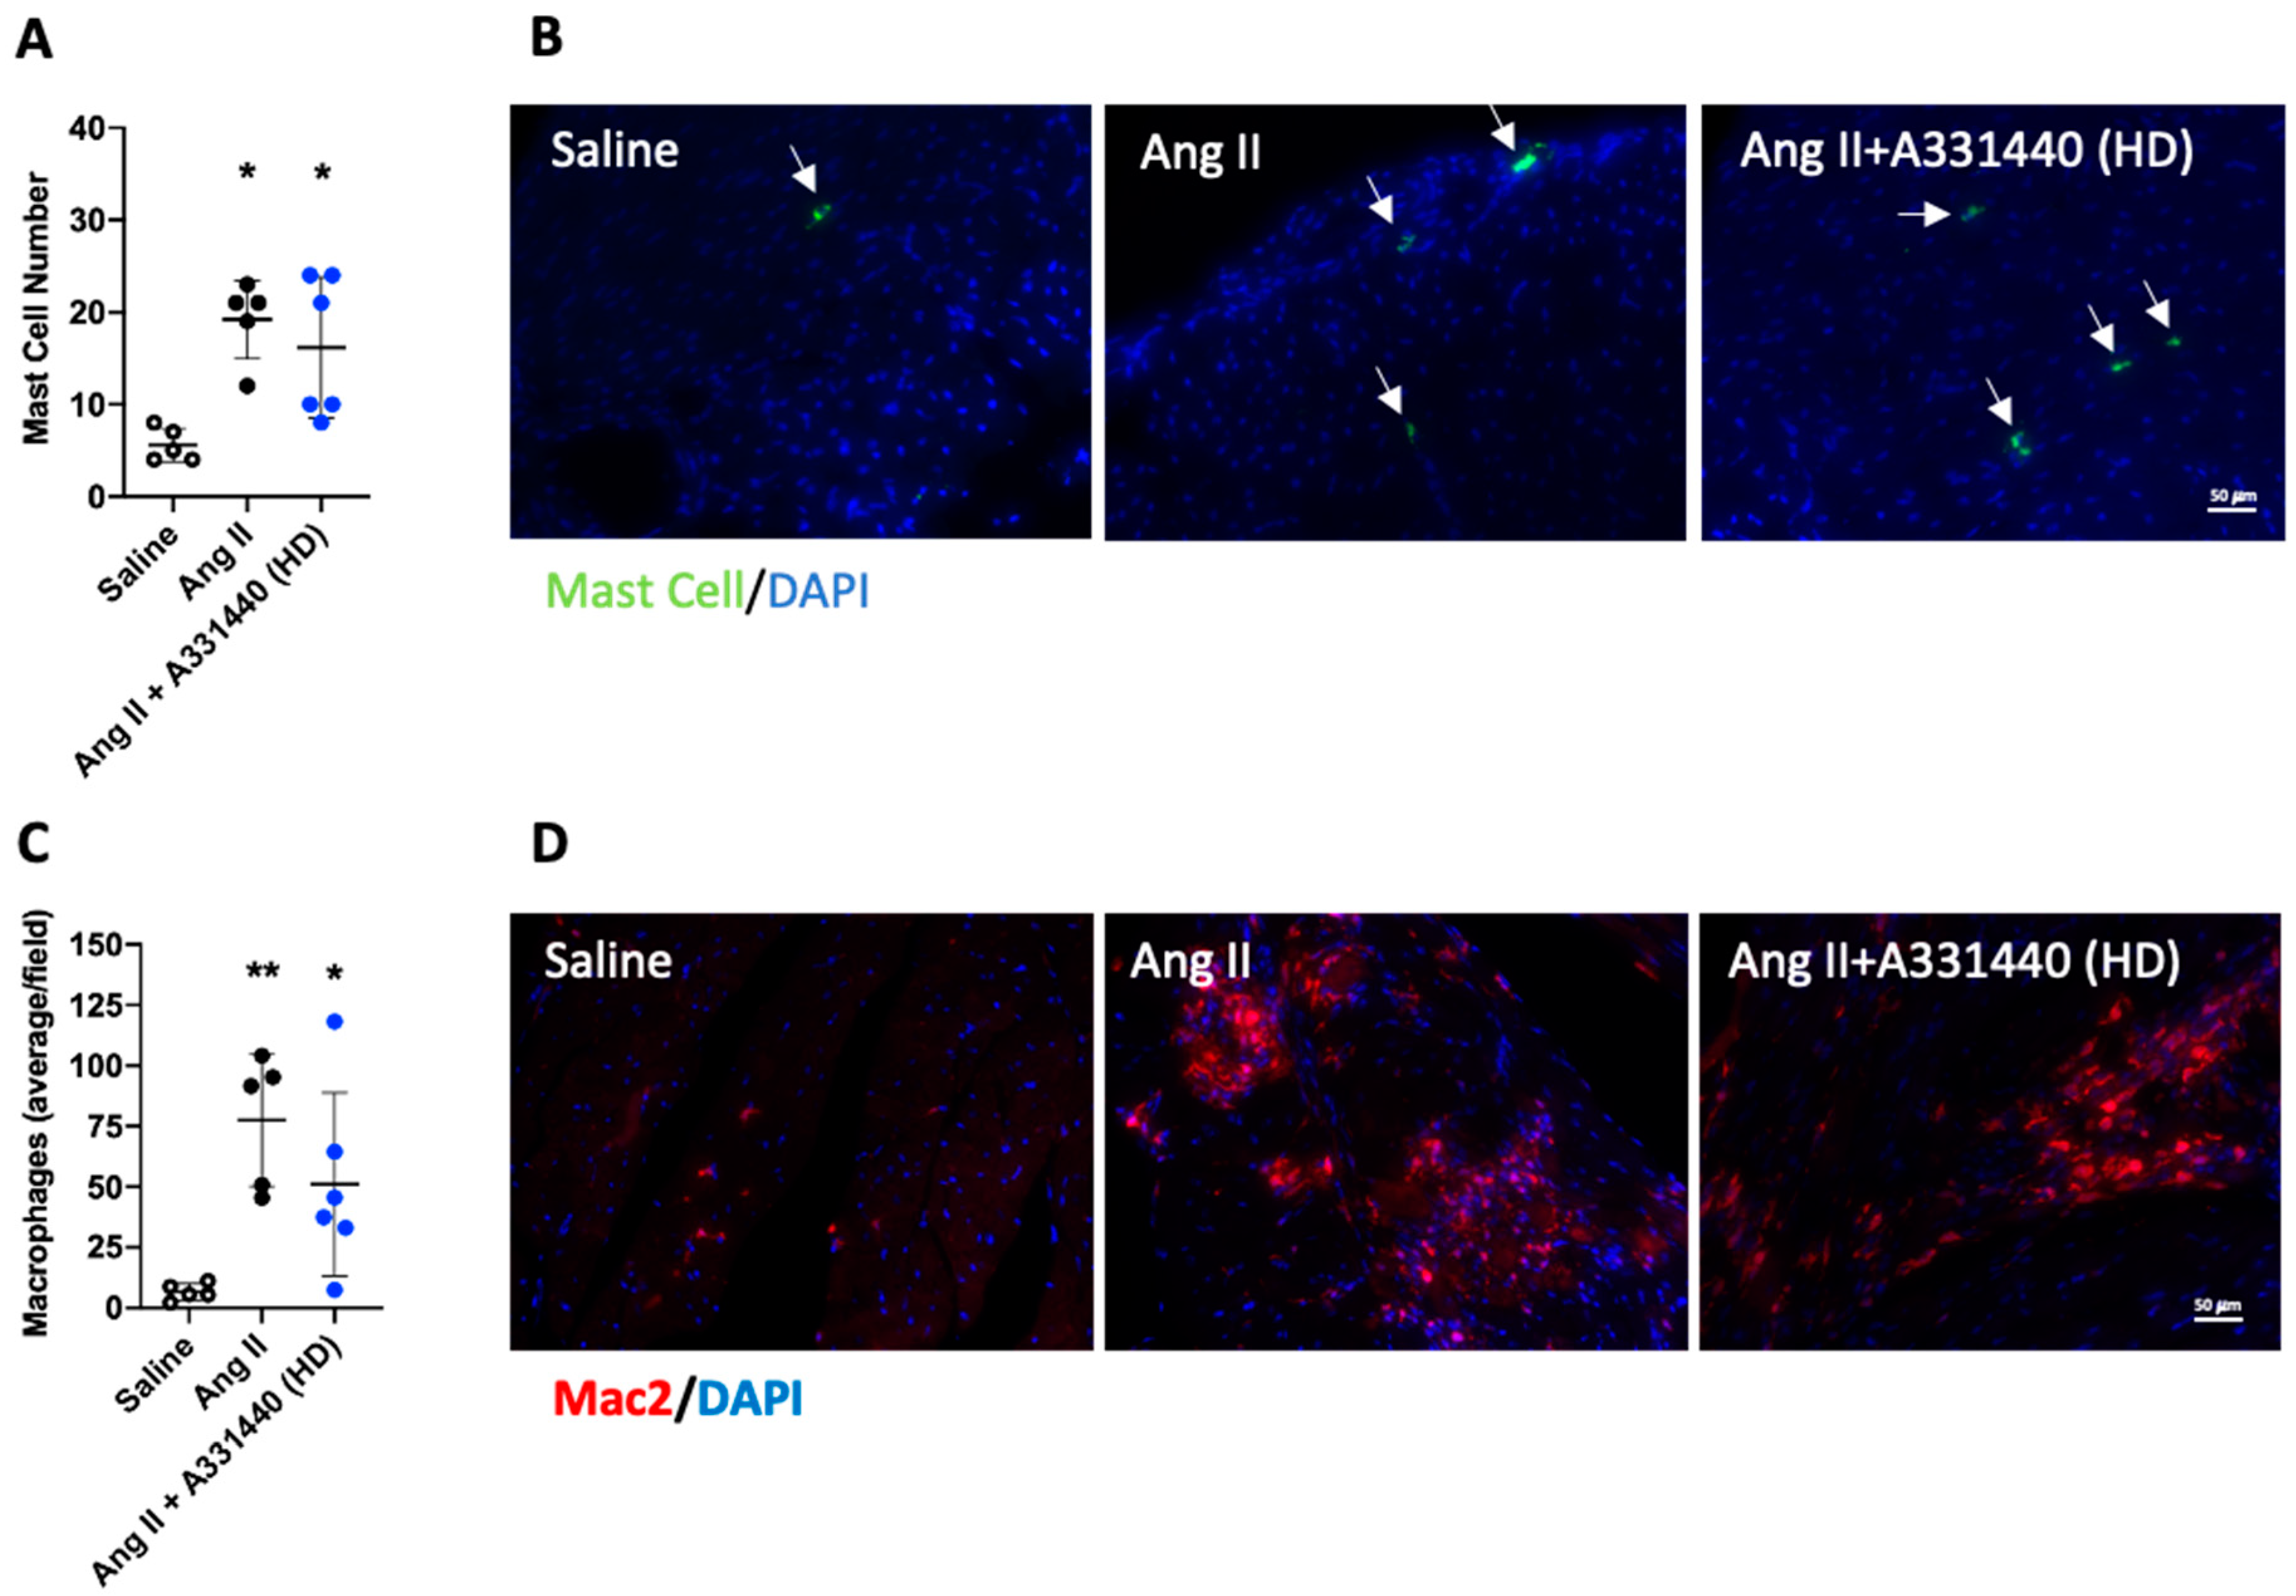
2.5. H3R Blockade Did Not Alter Inflammation

We assessed the number of mast cells and macrophages in the heart to determine whether H3R blockade altered inflammation in the heart. The number of mast cells was significantly increased in Ang-II-infused hearts (p < 0.05 vs. saline, Figure 4A,B). High-dose H3R blockade with A331440 did not alter the increase in mast cells induced by Ang II (p < 0.05 vs. saline; p = 0.63 vs. Ang II). The number of cardiac macrophages was also significantly increased in Ang-II-infused mice (p < 0.01 vs. saline, Figure 4C,D). Macrophage numbers were also significantly increased in mice treated with high-dose A331440 (p < 0.05 vs. saline; p = 0.29 vs. Ang II).

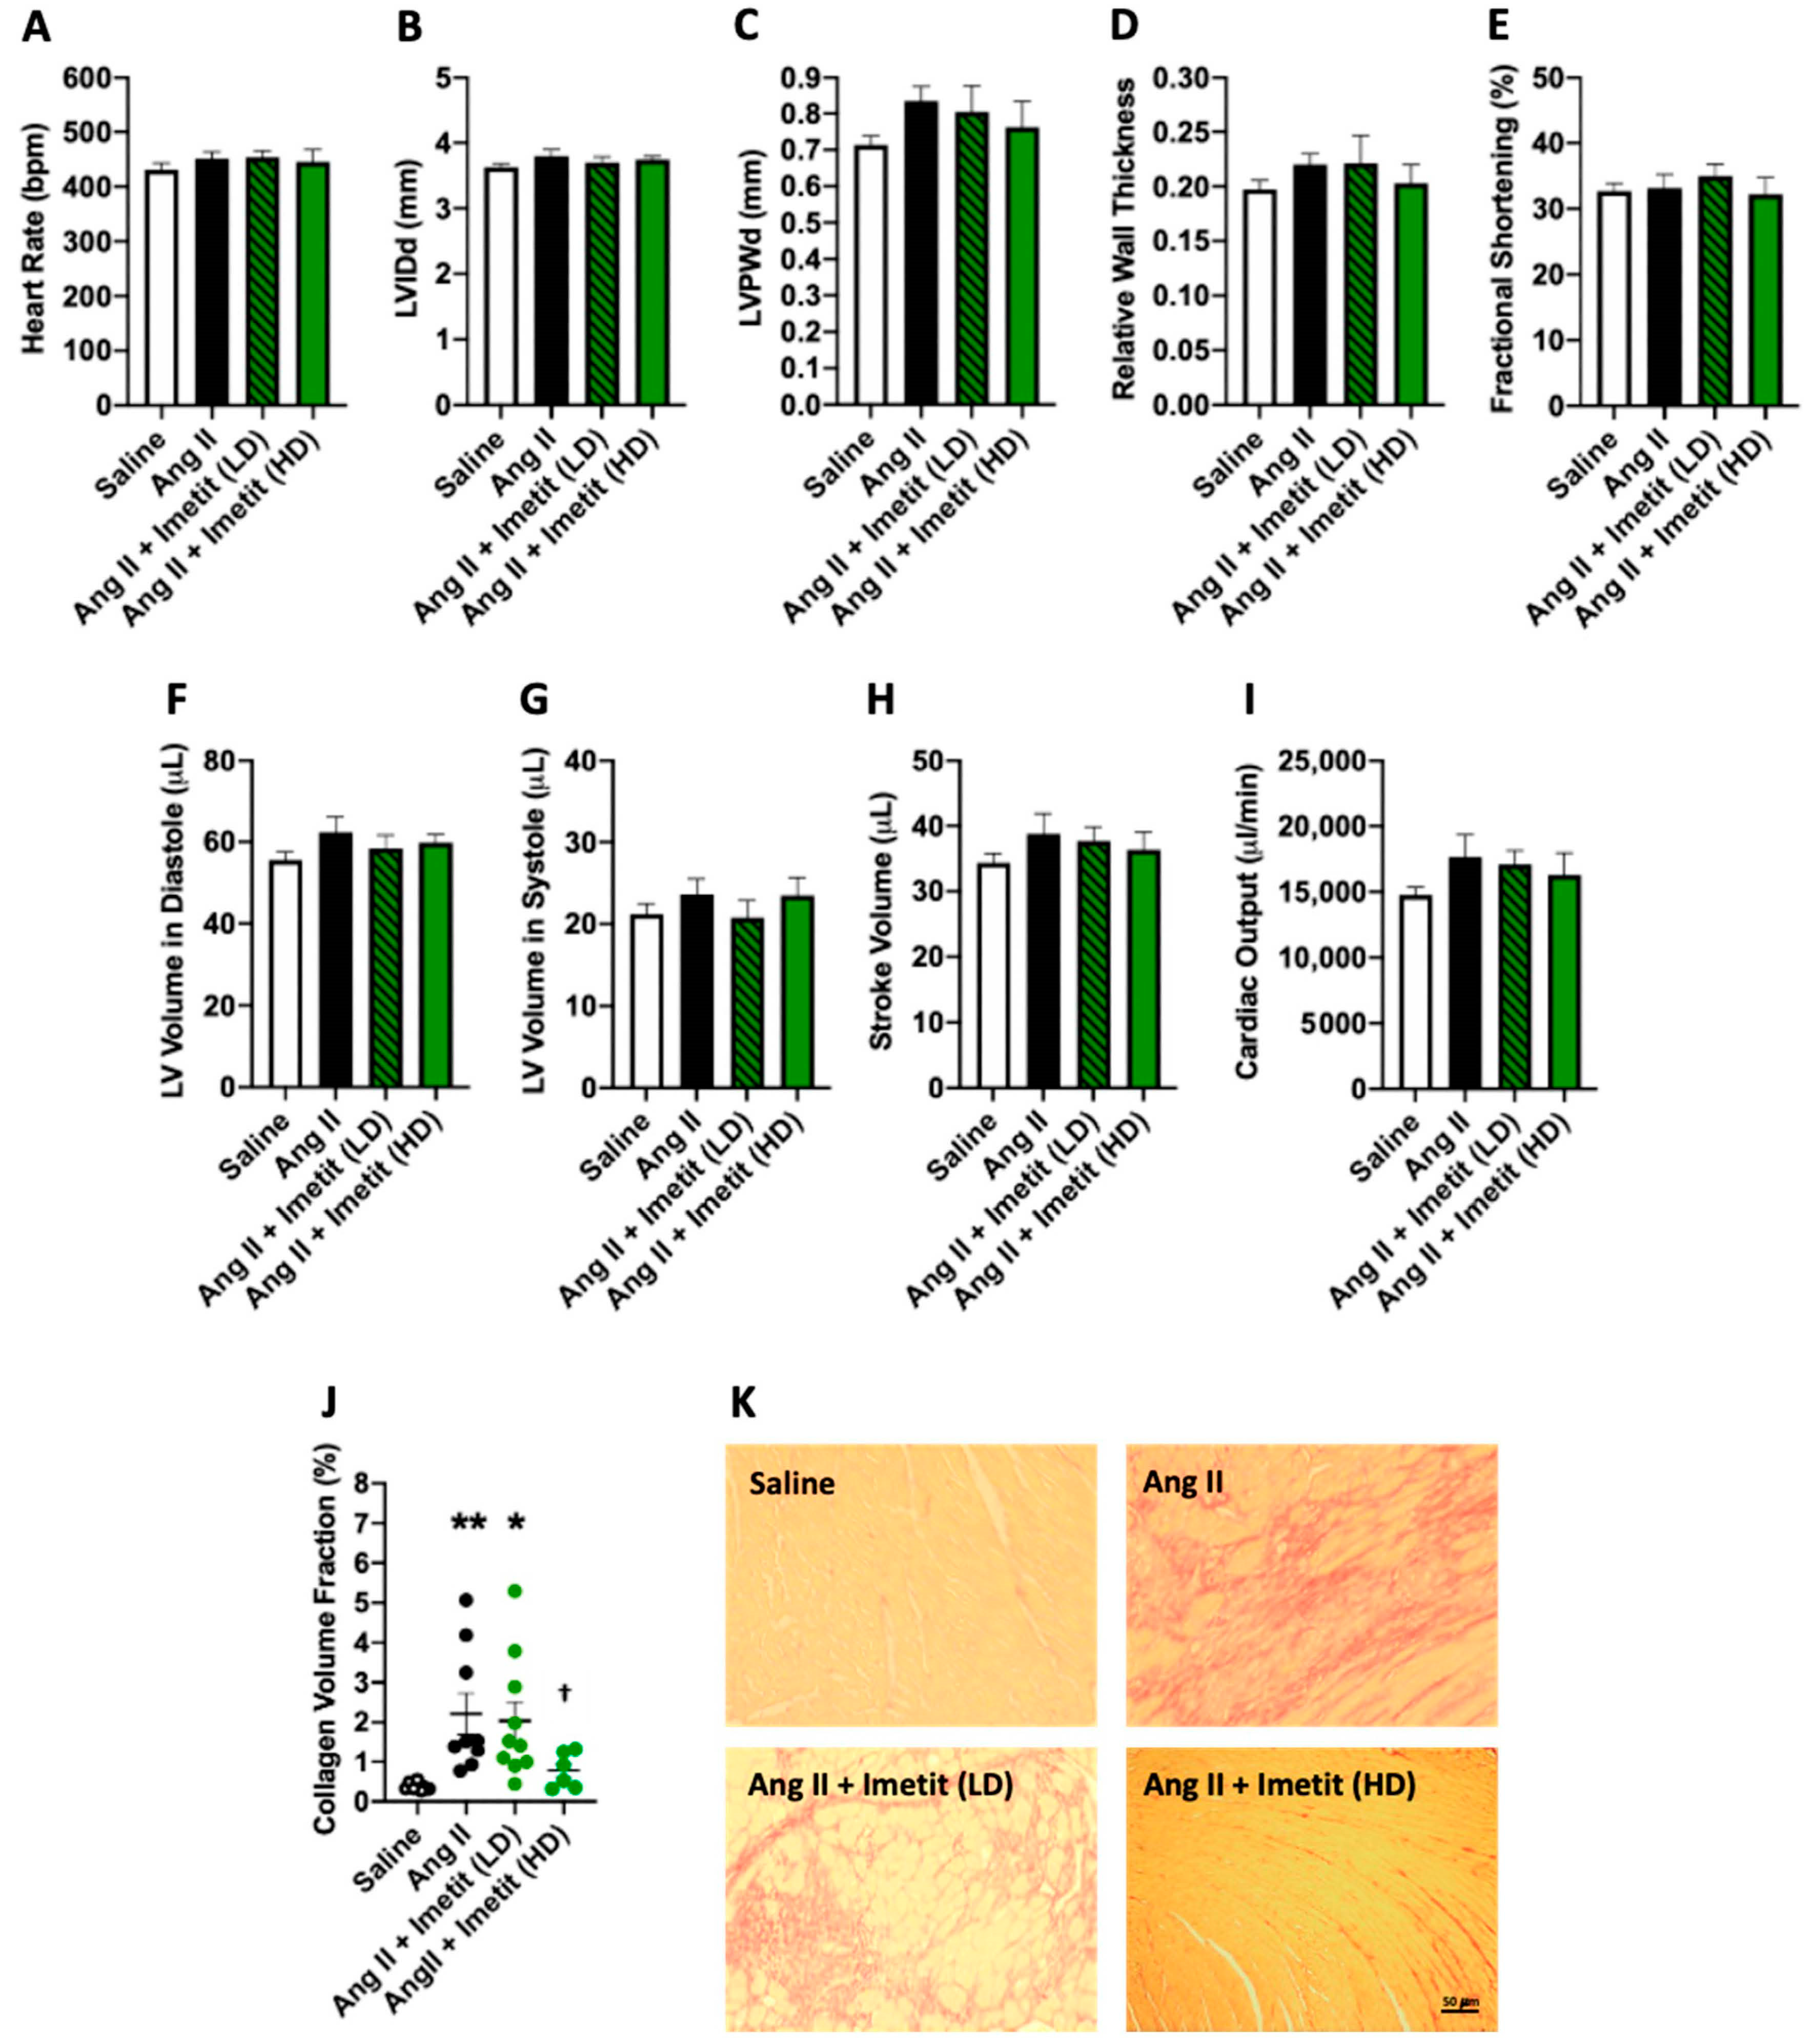
2.6. Effect of H3R Activation on LV Structure and Function in Ang-II-Infused Mice

Having determined that H3R blockade did not alter adverse cardiac remodeling, we then investigated whether H3R activation could improve remodeling. Table 1 displays the biometric data for mice treated with the H3R agonist imetit. Body weight was not different between untreated saline and Ang II mice. Low-dose imetit (20 mg/kg/day) did not alter body weight, however, body weight was significantly lower in the high-dose imetit group (40 mg/kg/day, p < 0.05 vs. saline, p < 0.0001 vs. Ang II, p < 0.01 vs. Ang II + imetit LD). Ang II caused a significant increase in LV mass (p < 0.001) as well as the LV/tibia ratio (p < 0.01) compared to the saline group. LV mass was also significantly increased in Ang II mice receiving low-dose imetit (p < 0.001 vs. saline, p = 0.99 vs. Ang II), as was the LV/tibia ratio (p < 0.001 vs. saline, p = 0.97 vs. Ang II). LV mass was normalized by treatment with high-dose imetit (p < 0.01 vs. Ang II, p < 0.001 vs. Ang II + imetit LD, p = 0.99 vs. saline), as was the LV/tibia ratio (p < 0.01 vs. Ang II, p < 0.001 vs. Ang II + imetit LD, p = 0.99 vs. saline). There were no significant differences between any of the groups for RV mass, lung mass, RV/tibia, or lung/tibia ratios. While, generally speaking, there were no significant differences in the echocardiography parameters assessed (Figure 5A–I and Figure S7), high-dose imetit tended to reduce LVPWd (Figure 5C) and hence relative wall thickness (Figure 5D). There were no differences in functional parameters between groups (Figure 5E,H,I).

2.7. H3R Activation Does Alter Cardiac Fibrosis

Ang II increased the collagen volume fraction in the LV compared to saline controls, indicative of fibrosis (Figure 5J,K and p < 0.01). Ang-II-infused mice treated with low-dose H3R agonist imetit also had increased collagen volume fraction compared to saline mice (p < 0.05 vs. saline; p = 0.74 vs. Ang II). Conversely, high-dose imetit significantly reduced collagen volume fraction (p < 0.05 vs. Ang II).

2.8. Norepinephrine Levels in the Heart

Ang II infusion did not alter cardiac norepinephrine levels at the time point examined in this study (Figure S8, p = 0.69 vs. saline). Due to the lack of effect of Ang II on norepinephrine at this time point, we did not assess the effects of high-dose imetit.

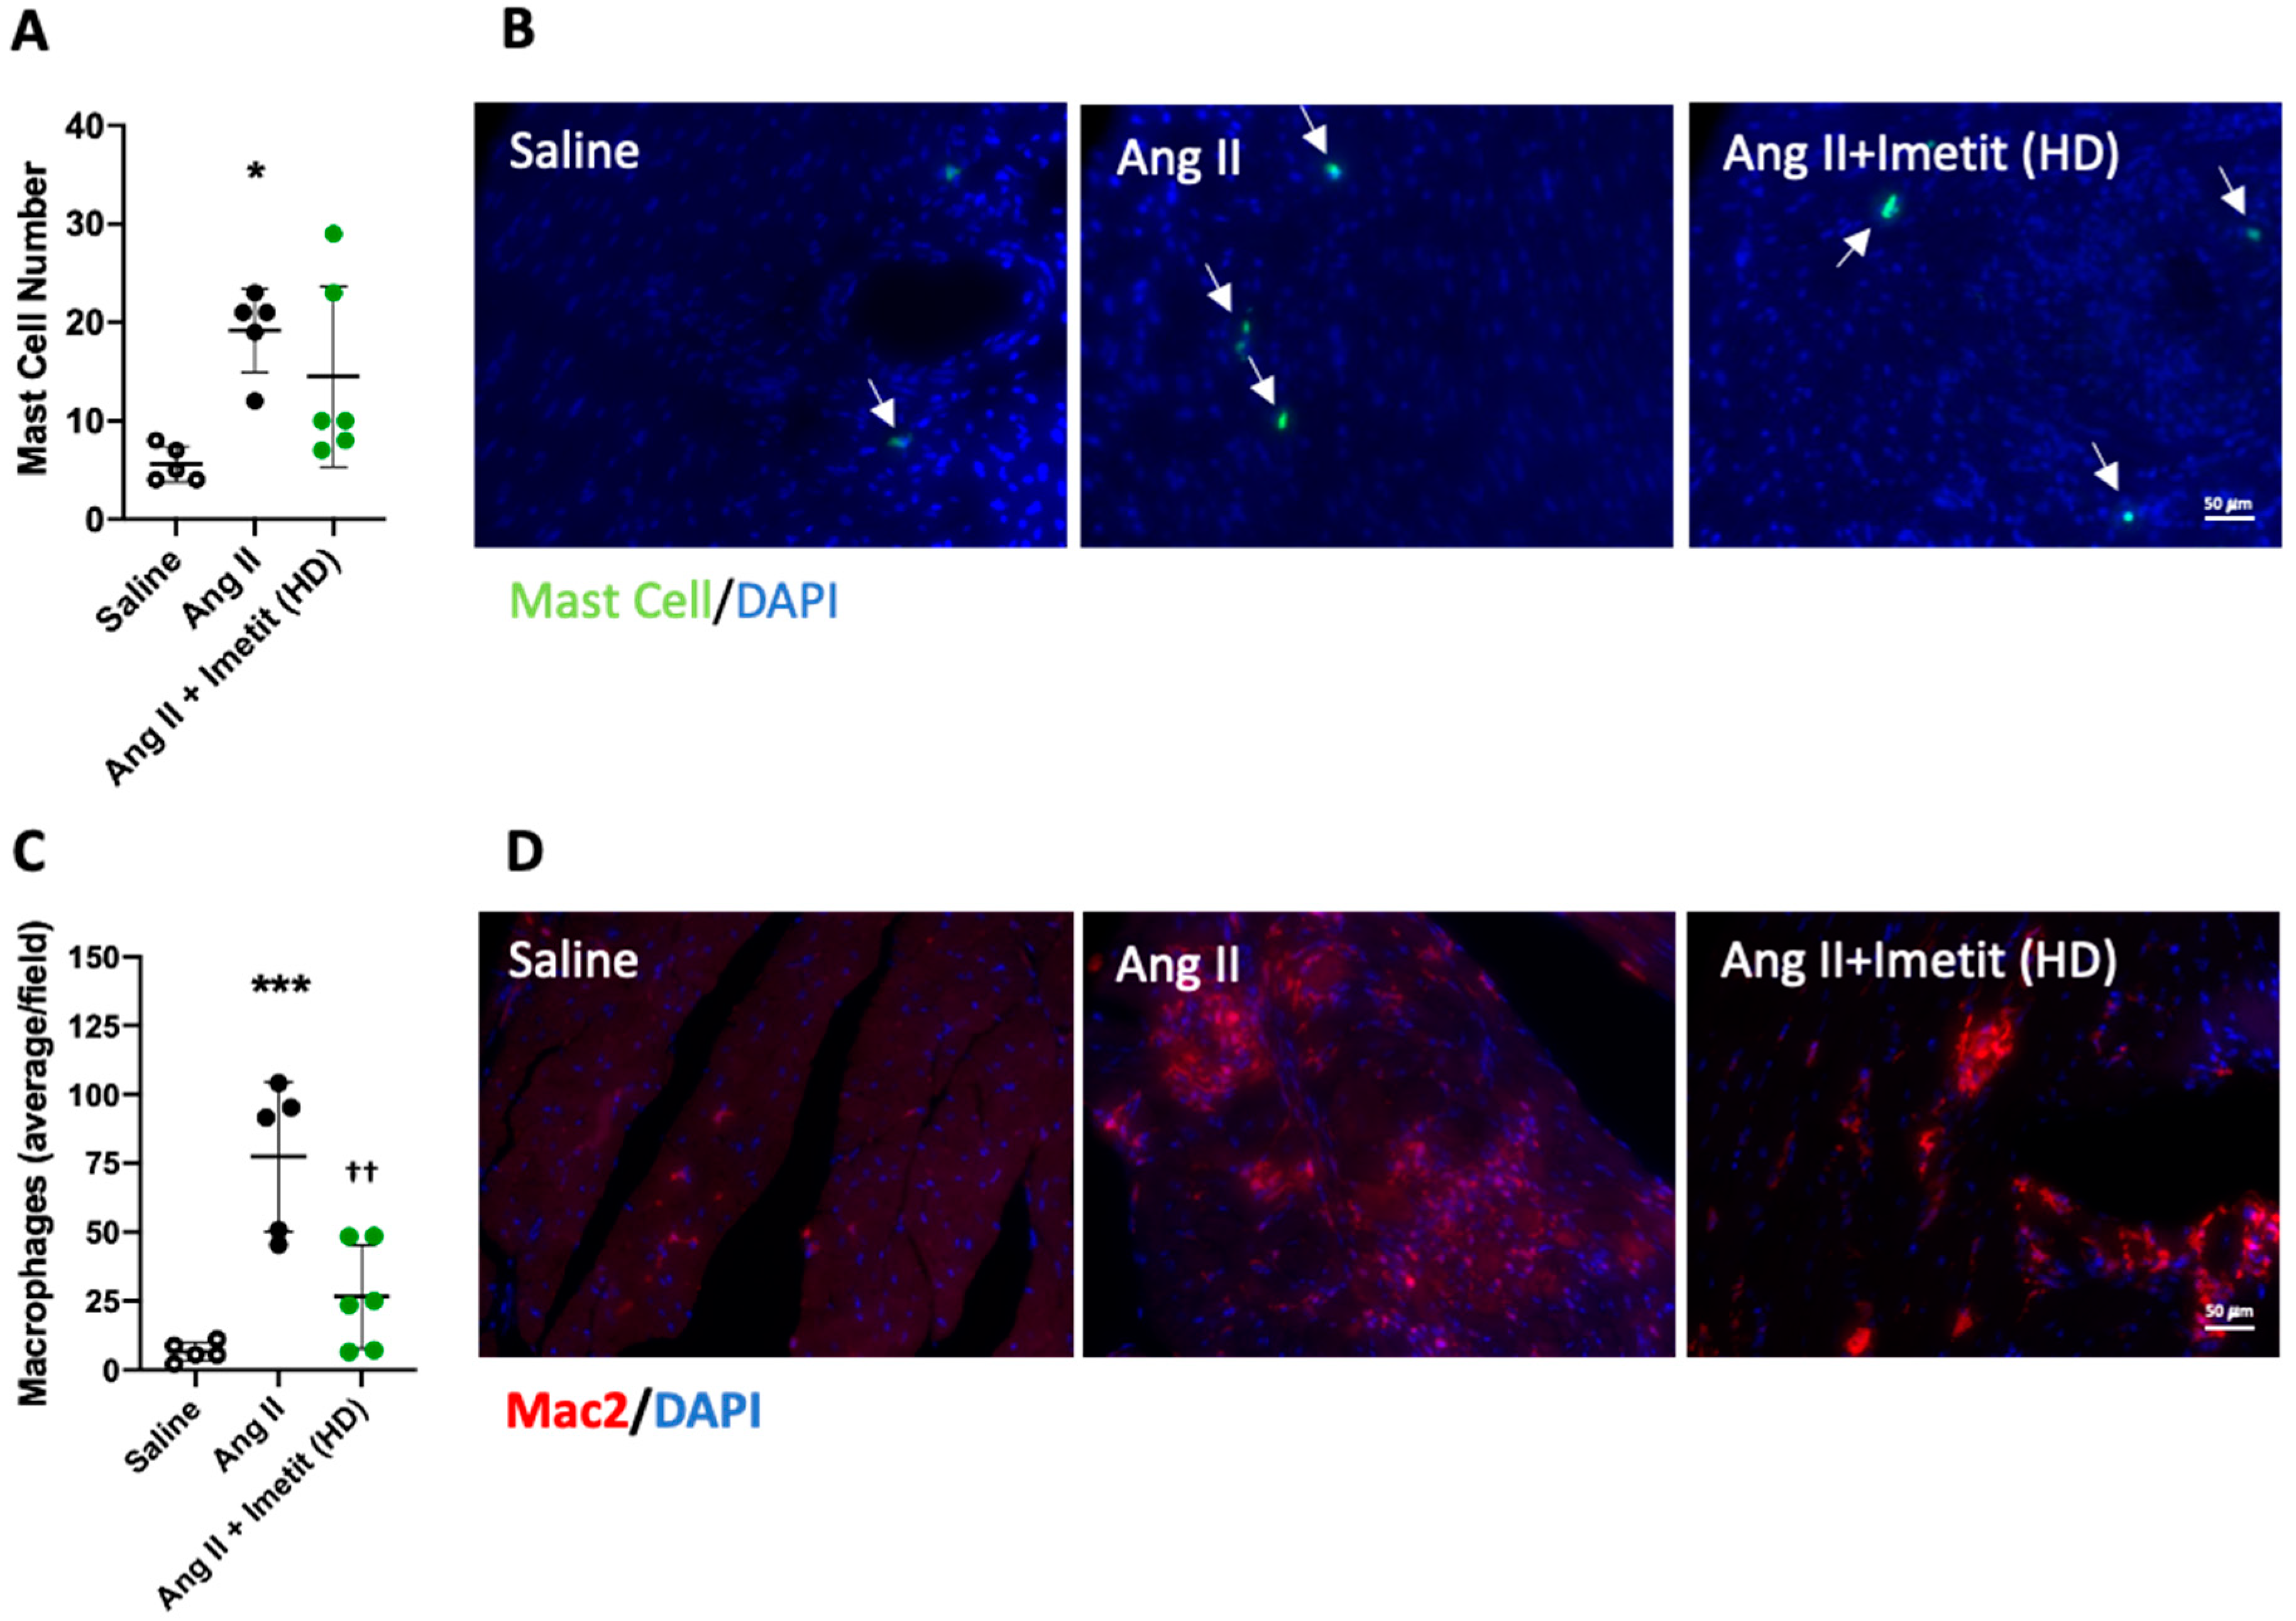
2.9. H3R Activation Reduced Inflammation

The number of mast cells in the LV was significantly increased in Ang-II-infused mice (p < 0.05 vs. saline, Figure 6A,B). There was a non-significant trend for mast cell numbers to be decreased in Ang-II-infused mice treated with high-dose imetit (p = 0.08 vs. saline, p = 0.45 vs. Ang II). The number of cardiac macrophages was also significantly increased in Ang-II-infused mice (p < 0.001 vs. saline, Figure 6C,D). Macrophage numbers were lower in mice treated with high-dose imetit compared to untreated Ang II mice (p < 0.01 vs. Ang II; p = 0.23 vs. saline).

3. Discussion

Our study identified the expression of the H3R in the mouse heart and established that activation of this receptor can counteract adverse cardiac remodeling induced by Ang II infusion. Specifically, we demonstrated that (1) the H3R was present in the mouse LV; (2) isolated cardiac fibroblasts possess the H3R, which was up-regulated in response to Ang II but did not induce a pro-fibrotic phenotype when activated; (3) blockade of the H3R with A331440 did not alter cardiac fibrosis or inflammation; and (4) activation of the H3R with imetit significantly reduced cardiac fibrosis, hypertrophy and macrophage infiltration.
We were able to identify mRNA expression of the H3R in the mouse LV. While PCR identified the three isoforms of the H3R known to be present in the rodent brain [18,19], we only detected one isoform in the mouse heart. This is in agreement with a previous report that the rat heart only expresses one H3R isoform [18]. Sanger sequencing of the 530 bp product confirmed it to be a 99% match for the H3R. The H3R had previously been identified on presynaptic cardiac sympathetic nerve fibers (cardiac synaptosomes) by pharmacological means [14]. The expression of mRNA isolated directly from the heart raises the question of which cells of the heart could express the H3R. We could not detect H3R protein in lysate from H9c2 cells (Figure S9), which are originally derived from rat atrial cardiomyocytes and now represent an immature cardiomyocyte phenotype. This, together with the low levels of the H3R, suggests that cardiomyocytes do not express the H3R. Recently, Piera et al. [17] reported that myofibroblasts isolated from the scar region of the rat heart four weeks post-ischemia possess the H3R and could increase collagen production in response to H3R activation with imetit. This was confirmed when the H3R antagonist ciproxifan reduced the increase in collagen production in response to histamine. Herein we confirmed that cardiac fibroblasts isolated from the normal mouse heart also possess the H3R, as well as when we cultured isolated rat and mouse cardiac fibroblasts under an array of conditions designed to allow comparison of fibroblast versus myofibroblast phenotype. Thus, cardiac (myo)fibroblasts, but not cardiomyocytes, are a likely source of the H3R in the heart. This may explain why H3R expression is low in the mouse heart since fibroblasts only account for roughly 15% of cells in the mouse heart [20]. Interestingly, we found that the H3R was increased on isolated cardiac fibroblasts when these cells were treated with Ang II, suggestive of a possible pro-fibrotic role. However, incubation of mouse cardiac fibroblasts with the H3R agonist imetit did not cause increased collagen production, which was in contrast to the findings of Piera et al. [17]. In the Piera et al. [17] study, what was termed “myofibroblasts” were fibroblasts isolated from the scar of the rat heart four weeks post-ischemia. It has recently been shown that fibroblasts residing in the infarct scar at chronic time points assume an intermediate phenotype coined the “matrifibrocyte” that is not a quiescent fibroblast but has lost the proliferative and α-smooth muscle actin characteristics typical of myofibroblasts [21]. Presumably, this was the phenotype of the fibroblasts isolated from the scar at four weeks post-infarct in the Piera et al. study. It may be possible that these matrifibrocytes respond differently to H3R activation. Furthermore, we also found that treatment of Ang-II-infused mice with the H3R antagonist, A331440, had no statistically significant effect on cardiac fibrosis in the Ang II model, indicating that the H3R is not pro-fibrotic in this model. In additional support of this finding, both mast cell and macrophage numbers remained elevated in the heart after A331440 treatment. Both mast cells and macrophages are important contributors to the cardiac fibrosis process [1,2,3,4,5,8,9,22,23,24].
In previous cardiac ischemia studies, activation of the H3R had been shown to be cardioprotective by down-regulating norepinephrine release. For example, activation of the H3R resulted in a reduction of norepinephrine release in an isolated guinea pig heart model of 20 min of ischemia followed by a 45-min reperfusion period [16]. Given the prominent role of norepinephrine in cardiac fibrosis [25], including Ang-II-induced cardiac fibrosis, we hypothesized that H3R activation could reduce fibrosis via down-regulation of norepinephrine. Herein we report that H3R activation with high-dose imetit significantly reduced cardiac fibrosis in the Ang II mouse model. Interestingly though, it is not clear whether this involved effects on norepinephrine as we did not observe up-regulation of norepinephrine by Ang II at the time point investigated in this study. However, we cannot rule out increases at earlier time points. There is some evidence that Ang II does not cause generalized norepinephrine release in the heart, at least in the pig [26]. That study used a micro-dialysis technique to measure norepinephrine in the cardiac interstitium, therefore it is possible that norepinephrine release is focal and was remote to the probe placement. Certainly, norepinephrine is important on some level in the Ang-II-infusion model since β-adrenergic receptor blockade prevents focal cardiomyocyte necrosis [27,28]. However, other mechanisms may be in play. Imetit was successful in reducing Ang-II-induced macrophage infiltration into the LV, which represents a mechanism by which H3R activation opposed fibrosis. Curiously, mast cell numbers were not significantly reduced by imetit, although, this was likely due to two of the six mouse hearts that remained considerably higher than the other four and led to a large standard deviation. Interestingly, we could not detect H3R protein on either bone-marrow-derived macrophages or mast cells (Figure S9), suggesting that down-regulation of inflammation by imetit may not be due to direct actions on these cell types. The question remains, how many of the beneficial effects on inflammation and cardiac fibrosis are due to activation of H3Rs in the heart versus on presynaptic cardiac sympathetic nerve fibers, especially since H3R protein could be detected in some but not all Ang-II-infused hearts. The mechanisms underlying the anti-inflammatory and anti-fibrotic actions of H3R activation clearly require further detailed investigation.
Oddly, both H3R activation and blockade normalized LV mass and LV/tibia ratio at high doses in mice infused with Ang II. For H3R activation with imetit, this appears to be due to reduced LV wall thickness, which although not statistically significant, showed a strong trend toward normalization. This lack of significance could in part be due to there only being a moderate hypertrophic effect in the Ang II model at the time point used in this study (seven days). Conversely, LV wall thickness showed no trend toward being reduced by H3R blockade with A331440. Continued wall thickening is somewhat difficult to reconcile with reduced LV mass and LV/tibia ratio, however, there are some possible explanations. One possibility is edema. We reasoned that there may be differences in edema between the imetit and A331440 groups and that less edema may account for reduced LV mass and LV/tibia ratio in the absence of reduced LV wall thickness in the A331440 group. However, we found no difference in LV water content between imetit and A331440 groups (Figure S10). Another alternative is that the heart took on a more spherical shape due to longitudinal shortening in response to A331440, without wall thinning. Unfortunately, we did not perform long-axis imaging of the heart, which could have substantiated this.
In summary, the most significant findings from the present study were (1) the H3R is expressed in the mouse heart, more specifically, cardiac fibroblasts, and (2) H3R activation was able to reduce cardiac fibrosis and cardiac inflammation. Thus, our findings indicate that the H3R has potential as a therapy for cardiac fibrosis, however, further research is required to understand the underlying mechanisms of this anti-fibrotic effect.

4. Materials and Methods

4.1. Experimental Design

Experiments were performed using 8-week-old male mice (C57BL/6). All mice were purchased through the Kearns Animal Facility at the Kolling Institute of Medical Research and were housed individually under standard environmental conditions and maintained on standard commercial mouse chow and tap water ad libitum. All animal procedures were performed according to the animal ethics protocol: RESP/19/019 approved by the Northern Sydney Local Health District Animal Ethics Committee (AEC) on 21 March 2019. The Ang-II-infusion model was chosen to assess the contribution of the H3R to cardiac remodeling. Mice were randomly divided into six groups: (1) saline-infused + saline (n = 8); (2) Ang-II-infused (1500 ng/kg/min) + saline (n = 9); (3) Ang-II-infused + H3R agonist (imetit, 20 mg/kg/day, n = 8); (4) Ang-II-infused + H3R agonist (imetit, 40 mg/kg/day, n = 6); (5) Ang-II-infused + H3R antagonist (A331440, 10 mg/kg/day, n = 5); and (6) Ang-II-infused + H3R antagonist (A-331440, 20 mg/kg/day, n = 6). Ang II or saline was delivered continuously via osmotic minipump. For minipump implantation, mice were anesthetized using inhaled isoflurane (2%). Once anesthetized as evaluated by toe pinch reflex, a longitudinal incision was made along the midline of the abdomen. Alzet 7-day minipumps containing either saline or Ang II were peritoneally implanted with minimal disturbance of the bowel. The peritoneum was closed using 5-0 Ethicon chromic gut sutures, whilst the skin wound was closed with surgical staples. Mice received Temgesic (0.1 mg/kg) for post-surgery pain relief. The H3R agonist imetit (Tocris, Minneapolis, MN, USA) and the H3R antagonist A-331440 (Sigma Aldrich, St Louis, MO, USA) were administered as daily subcutaneous injections. Daily saline injections served as a vehicle control. The experimental period lasted 7 days. At the experimental endpoint, the mice were anesthetized using isoflurane (2%) and euthanized by removal of the heart. The heart was separated into the LV plus septum and the RV. The lungs, LV, and RV were weighed, and tibia length measured. The apex portion of the LV was snap-frozen in liquid nitrogen and stored at −80 °C, whilst the base was fixed in zinc formalin.

4.2. Echocardiography

Mice underwent echocardiography (Vevo 3100 Imaging System) at the end of the 7-day experimental period to determine the effects of treatment on cardiac structure and function. Mice were anesthetized with isoflurane (2%) for the procedure. Images were taken at the mid-papillary level with a 30 MHz transducer. Measurements of LVPW and LVID were made using two-dimensional M-Mode in the parasternal short-axis view. LV function was assessed by fractional shortening (FS), stroke volume, and cardiac output calculated as follows:
FS = (LVIDd−LVIDs/LVIDd) × 100,
Stroke volume = LVIDd−LVIDs,
Cardiac Output = stroke volume × heart rate,
where LVIDd and LVIDs represent LV internal diameter in diastole and systole, respectively.

4.3. Histology/Immunofluorescence

Collagen volume fraction–picrosirius red staining of fixed LV sections was used to identify fibrillar collagen for assessment of cardiac fibrosis. LV sections were rehydrated in decreasing concentrations of ethanol and then stained with picrosirius red (0.1% Sirius Red F3BA in picric acid). LV sections were then dehydrated in increasing concentrations of ethanol and xylene and mounted with Depex and cover slipped. Stained LV sections were imaged microscopically using a 20x objective. 10 images per LV section were acquired, and each image was analyzed using Image J software. The percentage area of collagen was measured for each image with the average of the 10 images taken to generate the overall collagen volume fraction. Perivascular areas were excluded from collagen analysis.
Mast Cell/Macrophage Labeling–Formalin fixed LV sections of 5 μm thickness underwent rehydration before incubation in boiling citrate buffer for 10 min for antigen retrieval. The sections were labeled with anti-MAC-2 (1:100, Cedarlane, Burlington, VA, USA) to identify macrophages and avidin-(488) (1:100, Life Technologies, Carlsbad, CA, USA) to identify mast cells, following blocking for non-specific binding. MAC-2 labeling was visualized using 568-goat anti-rat secondary antibody (1:100, Life Technologies). All sections were cover slipped with ProLong Diamond containing DAPI (Life Technologies) and visualized under a fluorescence microscope. Macrophage numbers were calculated as the average number of macrophages contained in 5 random fields at 20× magnification. Mast cell numbers were expressed as the total number of avidin positive cells in each LV section (20× magnification).

4.4. Isolation and Treatment of Cardiac Fibroblasts

Cardiac fibroblasts were isolated from the LV of male C57BL/6 mice and male Sprague Dawley rats (8 weeks of age) similarly to how we have described previously [1,4,29,30]. Briefly, LV tissue was minced and digested by a series of 5 incubations with 100 ng/µL Liberase TM (Roche, Basel, Switzerland) at 37 °C for 15 min. The cell pellets were resuspended and plated in DMEM-F12 media for mouse fibroblasts and DMEM for rat fibroblasts and supplemented with 10% FBS. Non-adherent cells were removed by washing. Fibroblasts were used after only one passage to minimize changes in phenotype associated with culture. Before treatment, both mouse and rat fibroblasts were serum-starved in DMEM-F12 media for 24 hrs either on gelatin-coated or non-coated 6-well plates and then treated with Ang II (300 nM), TGFβ1 (10 ng/mL), or high glucose (25 mM) for 24 hrs. All treatments were performed in DMEM-F12 (mouse) or DMEM (rat) containing 1.5% FBS except for the high serum positive control (10% serum).

4.5. PCR/Sequencing

To initially identify the expression of RNA for the H3R in the LV, total RNA from LV tissue (saline and Ang-II-treated) was isolated using the RNeasy Plus Mini Kit (Qiagen, Hilden, Germany) according to the manufacturer’s instructions, quantified using a Nanodrop 1000 UV-Vis spectrophotometer (Thermo Fisher Scientific, Waltham, MA, USA), and then 5 μg of RNA converted to cDNA using Maxima H Minus Reverse Transcriptase (Thermo Scientific). One μL of each cDNA template was amplified with HotstartTaq DNA Polymerase (Qiagen), with the following primers by Morisset et al. [18]: HRH3 (Forward primer: 5′ TGCTGTATGGGCCTGCCATCCTGAGTTGG 3′, Reverse primer: 5′ CACCATCTTCATGCGCTTCTCCAGGGATGC 3′). The thermal cycling program was performed on a MiniAmp Thermal Cycler (Thermo Fisher Scientific) with an initial denaturation step at 95 °C for 10 min, followed by 35 cycles of 30s denaturation at 94 °C, 30 s annealing at 55 °C, 60s extension at 72 °C, and then a final step holding at 98 °C for 10 min. One μL of each PCR product was then subjected to a second round of PCR using identical conditions. PCR products were resolved on a 2% agarose gel and imaged using a Major Science gel imager. Individual amplicons were isolated by gel extraction using the Wizard® SV Gel and PCR Clean-Up System (Promega, Madison, WI, USA) and identified by Sanger sequencing (Australian Genome Research Facility, Melbourne, Australia). Expression of Hrh3 was quantified using SensiFAST probe Hi-ROX mastermix (Bioline Australia, Eveleigh, Australia) in combination with mouse Hrh3 and Gapdh-specific Taqman assays (Life Technologies), run on QuantStudio 12K Flex real-time PCR machine (Thermo Fisher Scientific) according to the manufacturer’s instructions. Relative expression of Hrh3 normalized against Gapdh was calculated by the ddCT method using ExpressionSuite Software (Thermo Fisher Scientific).

4.6. Protein Analysis

Western blots were used for the identification of H3R protein in LV lysates and isolated cardiac fibroblast lysates. Forty micrograms of protein for each sample were mixed in a 1:1 ratio in Lamelli buffer and heated at 90 °C for 15 min. Samples were loaded into precast Mini-Protean TGX gels (BIO-RAD, Hercules, CA, USA) and run at 80 V until separated optimally. Protein was then transferred onto a nitrocellulose membrane. The membrane was checked with Ponceau S solution for successful protein transfer, then blocked with an intercept blocking buffer (TBS) for 1 hr. The membrane was incubated overnight at 4 °C in an H3R primary antibody (Thermo Fisher Scientific H3R Polyclonal antibody Rabbit IgG, 1:1000). This was followed by incubation with a secondary antibody (Donkey Anti-Rabbit, 1:10,000) for 1 hr at room temperature. The membrane was washed in TBST between each change of antibody and before being imaged on an Odyssey CLx imager. Equal protein loading was determined by GAPDH (Sigma Aldrich, St Louis, MO, USA, 1:1000). Norepinephrine was assessed in LV lysate by ELISA (Aviva Systems Biology, San Diego, CA, USA) as per the manufacturer’s instructions. All samples were run in duplicate.

4.7. Hydroxyproline Assay

Collagen production by isolated mouse cardiac fibroblasts was assessed by measuring hydroxyproline levels in the culture media. Briefly, 100 µL of fibroblast cell culture media was incubated with 100 µL of 6N HCl and hydrolyzed at 107 °C for 18 hrs. The samples were dried in a vacuum centrifuge for 3 hrs and reconstituted with 500 μL of dH2O. They were then oxidized with 250 μL of chloramine T reagent and developed with 250 μL of Ehrlich’s reagent. Two hundred microliters of each sample, including the standards, were aliquoted into 96 well plates before being read at an absorbance wavelength of 550 nm. All samples were run in duplicate and averaged and hydroxyproline level determined from a hydroxyproline standard curve.

4.8. Statistical Analysis

All experimental data were expressed as a mean ± standard deviation (SD) or standard error of the mean (SEM) as appropriate. The statistical significance of the data was determined by t-test for comparison of two experimental groups and by one-way analysis of variance (ANOVA) with Tukey post-analysis for comparison of three or more groups. p < 0.05 was considered statistically significant.

Supplementary Materials

Author Contributions

Conceptualization, S.P.L. and A.W.; Methodology, S.P.L., S.L.M., A.W., G.L., M.B., and W.B.C.; Formal Analysis, S.L.M., A.O.K., G.L., M.B., and A.W.; Data Curation, S.L.M., A.O.K., G.L., M.B., A.W., and S.P.L.; Writing–Original Draft Preparation, S.L.M. and S.P.L.; Writing–Review & Editing, S.L.M., A.O.K., G.L., M.B., R.C.-B., W.B.C., A.W., and S.P.L.; Supervision, R.C.-B., A.W., and S.P.L.; Project Administration, S.P.L.; Funding Acquisition, W.B.C. and S.P.L. All authors have read and agreed to the published version of the manuscript.

Funding

This work was supported by the NIH (HL132908 to W.B.C.) and the George and Mary Thompson Fellowship (to S.P.L.). The authors acknowledge the facilities of Sydney Imaging, a Core Research Facility at the University of Sydney.

Conflicts of Interest

The authors declare no conflict of interest.

Abbreviations

H1RHistamine 1 receptor
H2RHistamine 2 receptor
H3RHistamine 3 receptor
H4RHistamine 4 receptor
MESAMulti-ethnic Study of Atherosclerosis
Ang IIAngiotensin II
LVLeft ventricle
RVRight ventricle
LVIDdLeft ventricular internal diameter in diastole
LVPWdLeft ventricular posterior wall thickness in diastole

References

  1. Levick, S.P.; McLarty, J.L.; Murray, D.B.; Freeman, R.M.; Carver, W.E.; Brower, G.L. Cardiac mast cells mediate left ventricular fibrosis in the hypertensive rat heart. Hypertension 2009, 53, 1041–1047. [Google Scholar] [CrossRef]
  2. Levick, S.P.; Melendez, G.C.; Plante, E.; McLarty, J.L.; Brower, G.L.; Janicki, J.S. Cardiac mast cells: The centrepiece in adverse myocardial remodelling. Cardiovasc. Res. 2011, 89, 12–19. [Google Scholar] [CrossRef] [Green Version]
  3. Li, J.; Jubair, S.; Levick, S.P.; Janicki, J.S. The autocrine role of tryptase in pressure overload-induced mast cell activation, chymase release and cardiac fibrosis. IJC Metab. Endocr. 2016, 10, 16–23. [Google Scholar] [CrossRef] [PubMed] [Green Version]
  4. McLarty, J.L.; Melendez, G.C.; Brower, G.L.; Janicki, J.S.; Levick, S.P. Tryptase/Protease-activated receptor 2 interactions induce selective mitogen-activated protein kinase signaling and collagen synthesis by cardiac fibroblasts. Hypertension 2011, 58, 264–270. [Google Scholar] [CrossRef] [PubMed]
  5. Widiapradja, A.; Manteufel, E.J.; Dehlin, H.M.; Pena, J.; Goldspink, P.H.; Sharma, A.; Kolb, L.L.; Imig, J.D.; Janicki, J.S.; Lu, B.; et al. Regulation of cardiac mast cell maturation and function by the neurokinin-1 receptor in the fibrotic heart. Sci. Rep. 2019, 9, 11004. [Google Scholar] [CrossRef] [PubMed]
  6. Janicki, J.S.; Brower, G.L.; Levick, S.P. The emerging prominence of the cardiac mast cell as a potent mediator of adverse myocardial remodeling. Methods Mol. Biol. 2015, 1220, 121–139. [Google Scholar]
  7. Kanemitsu, H.; Takai, S.; Tsuneyoshi, H.; Nishina, T.; Yoshikawa, K.; Miyazaki, M.; Ikeda, T.; Komeda, M. Chymase inhibition prevents cardiac fibrosis and dysfunction after myocardial infarction in rats. Hypertens. Res. 2006, 29, 57–64. [Google Scholar] [CrossRef] [Green Version]
  8. Zhao, X.Y.; Zhao, L.Y.; Zheng, Q.S.; Su, J.L.; Guan, H.; Shang, F.J.; Niu, X.L.; He, Y.P.; Lu, X.L. Chymase induces profibrotic response via transforming growth factor-beta 1/Smad activation in rat cardiac fibroblasts. Mol. Cell. Biochem. 2008, 310, 159–166. [Google Scholar] [CrossRef]
  9. Levick, S.P.; Widiapradja, A. Mast cells: Key contributors to cardiac fibrosis. Int. J. Mol. Sci. 2018, 19, 231. [Google Scholar] [CrossRef] [Green Version]
  10. Zeng, Z.; Shen, L.; Li, X.; Luo, T.; Wei, X.; Zhang, J.; Cao, S.; Huang, X.; Fukushima, Y.; Bin, J.; et al. Disruption of histamine H2 receptor slows heart failure progression through reducing myocardial apoptosis and fibrosis. Clin. Sci. 2014, 127, 435–448. [Google Scholar] [CrossRef]
  11. Leary, P.J.; Tedford, R.J.; Bluemke, D.A.; Bristow, M.R.; Heckbert, S.R.; Kawut, S.M.; Krieger, E.V.; Lima, J.A.; Masri, C.S.; Ralph, D.D.; et al. Histamine H2 receptor antagonists, left ventricular morphology, and heart failure risk: The MESA study. J. Am. Coll. Cardiol. 2016, 67, 1544–1552. [Google Scholar] [CrossRef] [PubMed]
  12. Imamura, M.; Poli, E.; Omoniyi, A.T.; Levi, R. Unmasking of activated histamine H3-receptors in myocardial ischemia: Their role as regulators of exocytotic norepinephrine release. J. Pharmacol. Exp. Ther. 1994, 271, 1259–1266. [Google Scholar] [PubMed]
  13. Gothert, M.; Garbarg, M.; Hey, J.A.; Schlicker, E.; Schwartz, J.C.; Levi, R. New aspects of the role of histamine in cardiovascular function: Identification, characterization, and potential pathophysiological importance of H3 receptors. Can. J. Physiol. Pharmacol. 1995, 73, 558–564. [Google Scholar] [CrossRef] [PubMed]
  14. Imamura, M.; Seyedi, N.; Lander, H.M.; Levi, R. Functional identification of histamine H3-receptors in the human heart. Circ. Res. 1995, 77, 206–210. [Google Scholar] [CrossRef] [PubMed]
  15. Hatta, E.; Yasuda, K.; Levi, R. Activation of histamine H3 receptors inhibits carrier-mediated norepinephrine release in a human model of protracted myocardial ischemia. J. Pharmacol. Exp. Ther. 1997, 283, 494–500. [Google Scholar]
  16. Imamura, M.; Lander, H.M.; Levi, R. Activation of histamine H3-receptors inhibits carrier-mediated norepinephrine release during protracted myocardial ischemia. Comparison with adenosine A1-receptors and alpha2-adrenoceptors. Circ. Res. 1996, 78, 475–481. [Google Scholar] [CrossRef]
  17. Piera, L.; Olczak, S.; Kun, T.; Galdyszynska, M.; Ciosek, J.; Szymanski, J.; Drobnik, J. Disruption of histamine/H3 receptor signal reduces collagen deposition in cultures scar myofibroblasts. J. Physiol. Pharmacol. Off. J. Pol. Physiol. Soc. 2019, 70. [Google Scholar] [CrossRef]
  18. Morisset, S.; Sasse, A.; Gbahou, F.; Héron, A.; Ligneau, X.; Tardivel-Lacombe, J.; Schwartz, J.C.; Arrang, J.M. The rat H3 receptor: Gene organization and multiple isoforms. Biochem. Biophys. Res. Commun. 2001, 280, 75–80. [Google Scholar] [CrossRef]
  19. Rouleau, A.; Héron, A.; Cochois, V.; Pillot, C.; Schwartz, J.C.; Arrang, J.M. Cloning and expression of the mouse histamine H3 receptor: Evidence for multiple isoforms. J. Neurochem. 2004, 90, 1331–1338. [Google Scholar] [CrossRef]
  20. Pinto, A.R.; Ilinykh, A.; Ivey, M.J.; Kuwabara, J.T.; D’Antoni, M.L.; Debuque, R.; Chandran, A.; Wang, L.; Arora, K.; Rosenthal, N.A.; et al. Revisiting cardiac cellular composition. Circ. Res. 2016, 118, 400–409. [Google Scholar] [CrossRef] [Green Version]
  21. Fu, X.; Khalil, H.; Kanisicak, O.; Boyer, J.G.; Vagnozzi, R.J.; Maliken, B.D.; Sargent, M.A.; Prasad, V.; Valiente-Alandi, I.; Blaxall, B.C.; et al. Specialized fibroblast differentiated states underlie scar formation in the infarcted mouse heart. J. Clin. Investig. 2018, 128, 2127–2143. [Google Scholar] [CrossRef] [PubMed] [Green Version]
  22. Kong, P.; Christia, P.; Frangogiannis, N.G. The pathogenesis of cardiac fibrosis. Cell Mol. Life Sci 2014, 71, 549–574. [Google Scholar] [CrossRef] [PubMed] [Green Version]
  23. Patel, B.; Bansal, S.S.; Ismahil, M.A.; Hamid, T.; Rokosh, G.; Mack, M.; Prabhu, S.D. CCR2(+) monocyte-derived infiltrating macrophages are required for adverse cardiac remodeling during pressure overload. JACC Basic Transl. Sci. 2018, 3, 230–244. [Google Scholar] [CrossRef] [PubMed]
  24. Zhang, W.; Chancey, A.L.; Tzeng, H.P.; Zhou, Z.; Lavine, K.J.; Gao, F.; Sivasubramanian, N.; Barger, P.M.; Mann, D.L. The development of myocardial fibrosis in transgenic mice with targeted overexpression of tumor necrosis factor requires mast cell-fibroblast interactions. Circulation 2011, 124, 2106–2116. [Google Scholar] [CrossRef] [PubMed] [Green Version]
  25. Perlini, S.; Palladini, G.; Ferrero, I.; Tozzi, R.; Fallarini, S.; Facoetti, A.; Nano, R.; Clari, F.; Busca, G.; Fogari, R.; et al. Sympathectomy or doxazosin, but not propranolol, blunt myocardial interstitial fibrosis in pressure-overload hypertrophy. Hypertension 2005, 46, 1213–1218. [Google Scholar] [CrossRef] [PubMed] [Green Version]
  26. Lameris, T.W.; de Zeeuw, S.; Duncker, D.J.; Alberts, G.; Boomsma, F.; Verdouw, P.D.; van den Meiracker, A.H. Exogenous angiotensin II does not facilitate norepinephrine release in the heart. Hypertension 2002, 40, 491–497. [Google Scholar] [CrossRef] [PubMed] [Green Version]
  27. Henegar, J.R.; Schwartz, D.D.; Janicki, J.S. Ang II-related myocardial damage: Role of cardiac sympathetic catecholamines and beta-receptor regulation. Am. J. Physiol. 1998, 275, H534–H541. [Google Scholar] [CrossRef] [Green Version]
  28. Kabour, A.; Henegar, J.R.; Devineni, V.R.; Janicki, J.S. Prevention of angiotensin II induced myocyte necrosis and coronary vascular damage by lisinopril and losartan in the rat. Cardiovasc. Res 1995, 29, 543–548. [Google Scholar] [CrossRef]
  29. Dehlin, H.M.; Manteufel, E.J.; Monroe, A.L.; Reimer, M.H., Jr.; Levick, S.P. Substance P acting via the neurokinin-1 receptor regulates adverse myocardial remodeling in a rat model of hypertension. Int. J. Cardiol. 2013, 168, 4643–4651. [Google Scholar] [CrossRef] [Green Version]
  30. Melendez, G.C.; McLarty, J.L.; Levick, S.P.; Du, Y.; Janicki, J.S.; Brower, G.L. Interleukin 6 mediates myocardial fibrosis, concentric hypertrophy, and diastolic dysfunction in rats. Hypertension 2010, 56, 225–231. [Google Scholar] [CrossRef] [Green Version]
Figure 1. The mouse heart expresses the H3R. (A) PCR identified a ~530 bp product for the saline and Ang II mouse LV (yellow arrows). (B) real-time PCR quantification of H3R mRNA from hearts of saline and Ang-II-infused mice (n = 5/group). The brain is the positive control (n = 1). Data are mean ± SEM. (C) Western blotting identifying the presence of H3R protein (yellow arrows) only in hearts from mice infused with Ang II and not from saline-infused mice. L1 = ladder, L10 = brain as positive control.
Ijms 21 09757 g001
Figure 2. Isolated cardiac (myo)fibroblasts express the H3R. (A) Western blot for the H3R in isolated rat and mouse cardiac (myo)fibroblast lysate. Cardiac fibroblasts were exposed to varying culture conditions designed to maintain a more quiescent fibroblast phenotype or to induce myofibroblast conversion to determine under which conditions the H3R was present: Lane 1 = rat fibroblasts grown on plastic, Lane 2 = rat fibroblasts grown on gelatin, Lane 3 = rat fibroblast in high serum (10% serum), Lane 4 = mouse fibroblasts grown on gelatin, Lane 5 = mouse fibroblasts in 10% serum, Lane 6 = mouse fibroblasts treated with Ang II (300 nM), Lane 7 = mouse fibroblasts treated with TGF-β1 (10 ng/mL), and Lane 8 = mouse fibroblasts in high glucose (25 mM). (B) Western blot for the H3R in isolated mouse cardiac fibroblasts treated with Ang II (300 nM). GAPDH served as the loading control. (C) quantification of the H3R in isolated mouse cardiac fibroblasts treated with Ang II (n = 4/group). (D) Hydroxyproline as a marker of collagen production in the media from isolated mouse cardiac fibroblasts treated with the H3R agonist, imetit (100 nM, n = 6/group). 10% serum served as a positive control. Data are mean ± SD (C) or SEM (D). * = p < 0.05 vs. Control.
Ijms 21 09757 g002
Figure 3. Blockade of the H3R does not prevent adverse cardiac remodeling. Echocardiographic assessment of heart rate (A); left ventricular internal diameter in diastole (LVIDd, (B)); left ventricular posterior wall thickness in diastole (LVPWd, (C)); relative wall thickness (D); fractional shortening (E); left ventricular volume in diastole (F); left ventricular volume in systole (G); stroke volume (H); cardiac output (I); left ventricular collagen volume fraction as a marker of fibrosis in saline, Ang II, Ang II + low-dose (LD) A331440, and Ang II + high-dose (HD) A331440 mice (J); representative picrosirious red stained images used to determine collagen volume fraction (K). All data are mean ± SEM. Saline, n = 8; Ang II, n = 9; Ang II + A331440 (LD), n = 5; Ang II + A331440 (HD), n = 6; * = p < 0.05 vs. saline.
Ijms 21 09757 g003
Figure 4. Cardiac mast cell and macrophage numbers in response to H3R blockade with A331440. (A) quantification of mast cells/LV section; (B) representative images for cardiac mast cells as indicated by white arrows (green = mast cell, blue = DAPI); (C) quantification of macrophages/LV field; (D) representative images for cardiac macrophages (red = macrophages, blue = DAPI). All data are mean ± SD. Saline, n = 5; Ang II, n = 5; Ang II + A331440, n = 6; * = p < 0.05 vs. saline, ** = p < 0.01 vs. saline.
Ijms 21 09757 g004
Figure 5. Activation of the H3R with imetit improves cardiac remodeling. (A) heart rate; (B) left ventricular internal diameter in diastole (LVIDd); (C) left ventricular posterior wall thickness in diastole (LVPWd); (D) relative wall thickness; (E) fractional shortening; (F) left ventricular volume in diastole; (G) left ventricular volume in systole; (H) stoke volume; (I) cardiac output; (J) left ventricular collagen volume fraction as a marker of fibrosis in saline, Ang II, Ang II + low-dose (LD) imetit, and Ang II + high-dose (HD) imetit mice; (K) representative picrosirious red stained images used to determine collagen volume fraction. All data are mean ± SEM. Saline, n = 8; Ang II, n = 9; Ang II + imetit (LD), n = 8; Ang II + imetit (HD), n = 6; * = p < 0.05 vs. saline, ** = p < 0.01 vs. saline, † = p < 0.05 vs. Ang II.
Ijms 21 09757 g005
Figure 6. Cardiac mast cell and macrophage numbers in response to H3R activation with imetit. (A) quantification of mast cells/LV section; (B) representative images for cardiac mast cells as indicated by white arrows (green = mast cell, blue = DAPI); (C) quantification of macrophages/LV field; (D) representative images for cardiac macrophages (red = macrophages, blue = DAPI). All data are mean ± SD. Saline, n = 5; Ang II, n = 5; Ang II + imetit, n = 6; * = p < 0.05 vs. saline, *** = p < 0.001 vs. saline, †† = p < 0.01 vs. Ang II.
Ijms 21 09757 g006
Table 1. Biometrics for A331440 and imetit treatment.
SalineAng IIAng II + A331440 (LD)Ang II + A331440 (HD)Ang II + Imetit (LD)Ang II + Imetit (HD)
Body Weight (g)23.5 ± 1.925.3 ± 1.723.3 ± 1.920.3 ± 1.3 **,††††,‡‡‡24.2 ± 1.420.9 ± 0.9 *,††††,‡‡
LV mass (mg)77.4 ± 10.098.4 ± 8.5 ***91.2 ± 12.176.8 ± 7.3 ††,‡‡‡100.2 ± 12.4 ***76.8 ± 4.8 ††,‡‡‡
LV/Tibia (mg/mm)4.0 ± 0.64.9 ± 0.4 **4.7 ± 0.73.3 ± 0.4 ††,‡‡‡5.1 ± 0.6 ***3.9 ± 0.2 ††,‡‡‡
RV mass (mg)21.3 ± 1.522.2 ± 3.526.4 ± 10.024.7 ± 3.422.8 ± 3.723.3 ± 2.5
RV/Tibia (mg/mm)1.1 ± 0.11.1 ± 0.21.4 ± 0.51.3 ± 0.21.2 ± 0.21.2 ± 0.1
Lung mass (mg)115.1 ± 8.5125.7 ± 10.9130.2 ± 17.9130.5 ± 7.2130.2 ± 10.9115.8 ± 10.5
Lung/Tibia (mg/mm)6.5 ± 1.56.3 ± 0.66.7 ± 0.76.6 ± 0.46.7 ± 0.55.9 ± 0.5
LD = low dose, HD = high dose, BW = body weight, LV = left ventricle, RV = right ventricle. Values are mean ± SD; n = 8 for saline, n = 9 for Ang II, n = 5 for Ang II + A331440 LD, n = 6 for Ang II + A331440 HD, n = 10 for Ang II + imetit LD, n = 6 for Ang II + imetit HD; * p < 0.05 vs. saline; ** p < 0.01 vs. saline; *** p < 0.001 vs. saline; †† p < 0.01 vs. Ang II; †††† p < 0.0001 vs. Ang II, ‡‡ p < 0.01 vs. corresponding LD group; ‡‡‡ p < 0.001 vs. corresponding LD group.
Publisher’s Note: MDPI stays neutral with regard to jurisdictional claims in published maps and institutional affiliations.

