Chaperone-Assisted Mitotic Actin Remodeling by BAG3 and HSPB8 Involves the Deacetylase HDAC6 and Its Substrate Cortactin

 , and
, and 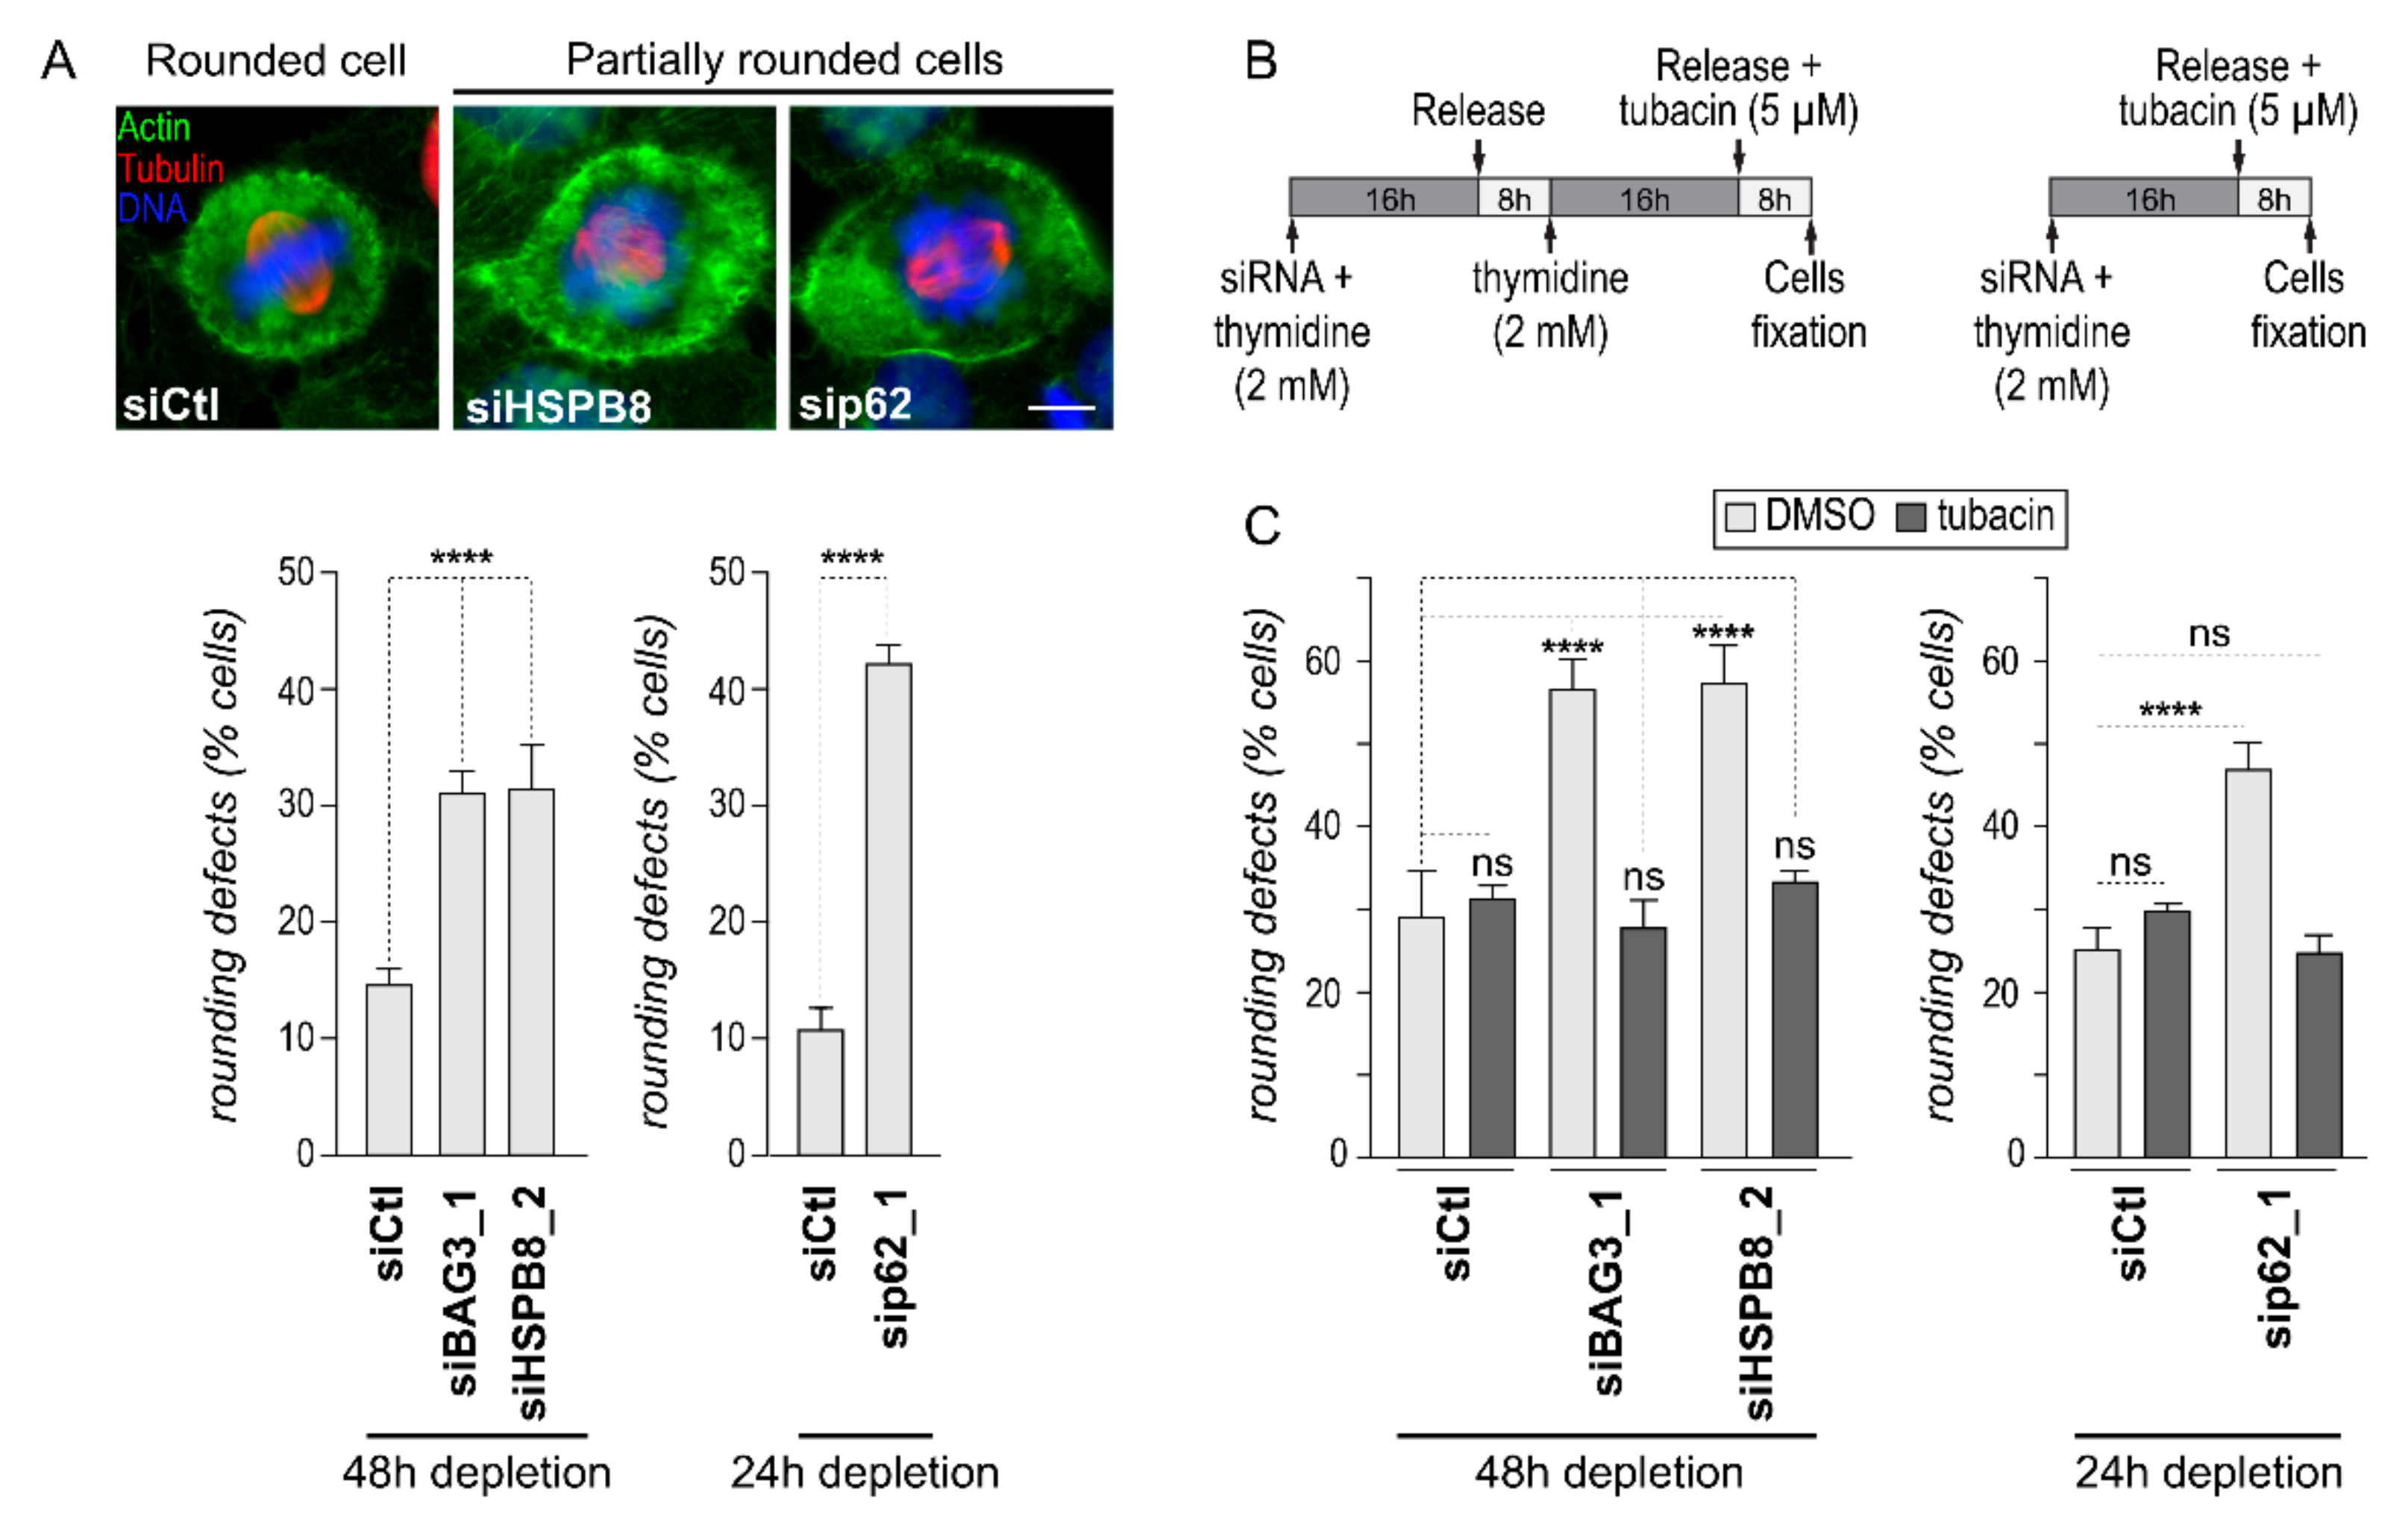
Abstract
:1. Introduction
2. Results
2.1. Downregulation of HDAC6 Activity Can Normalize Mitotic Cell Rounding in Cells Depleted of BAG3, HSPB8 or p62/SQSTM1
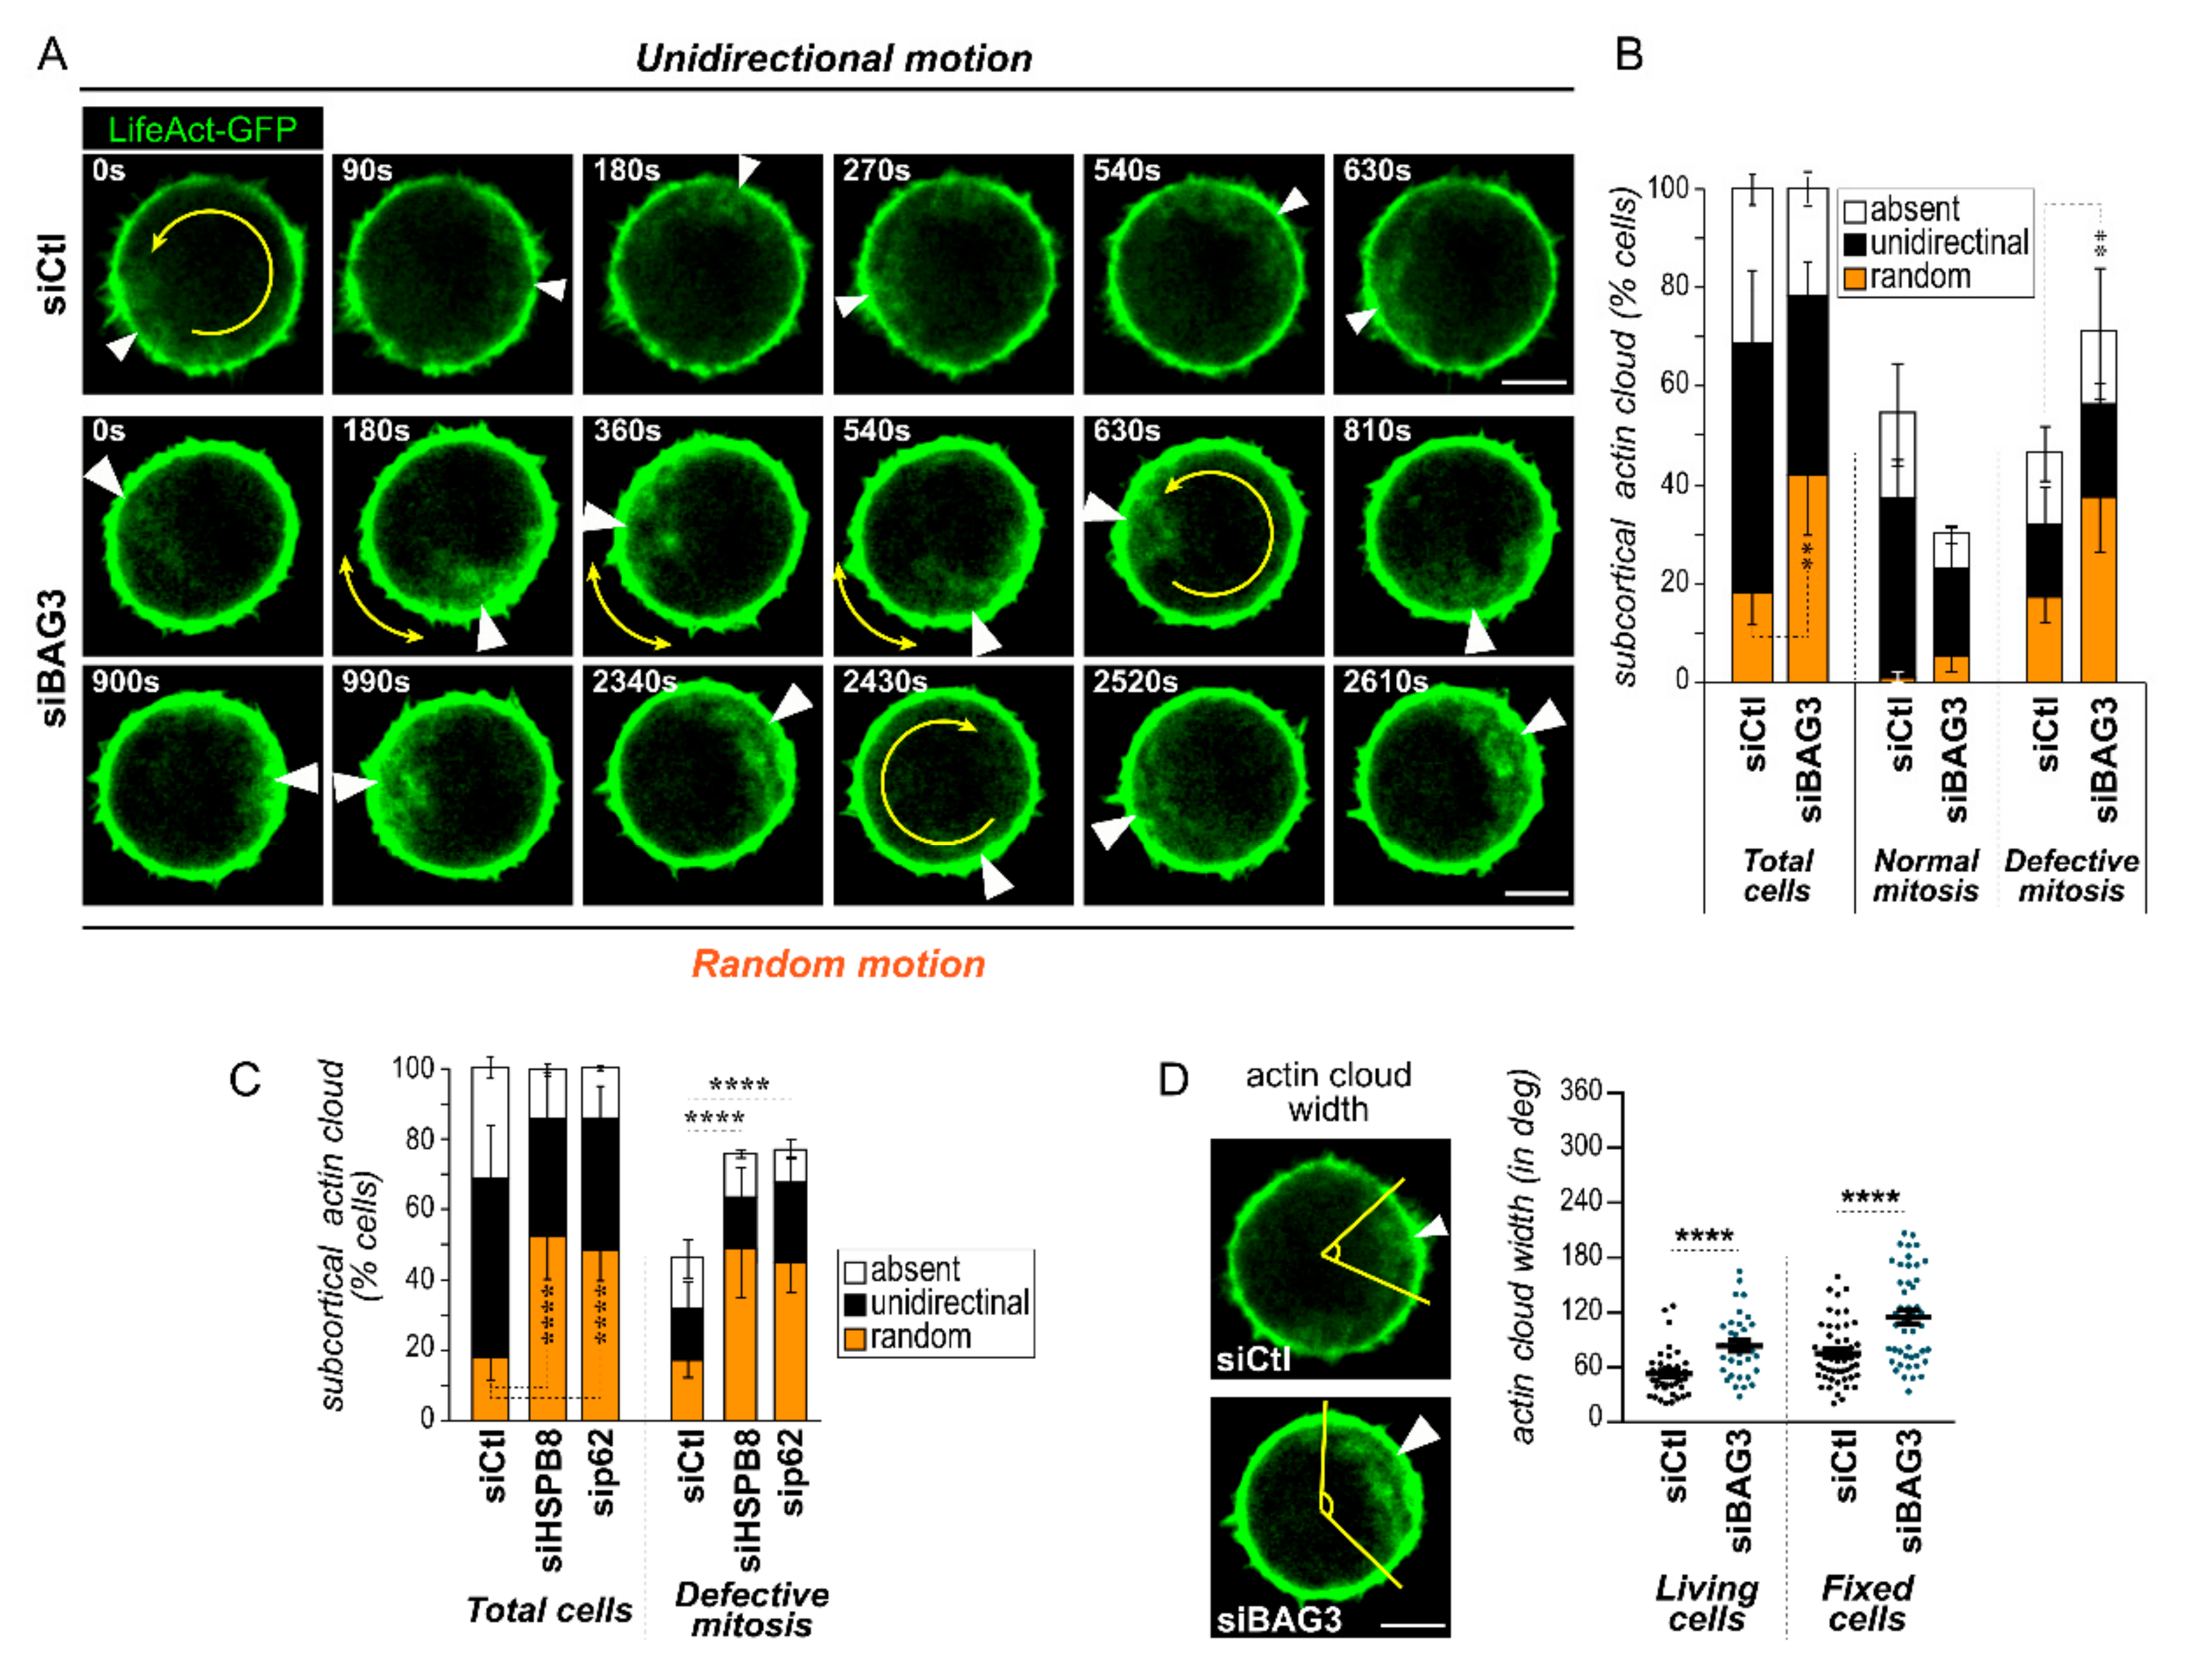
2.2. BAG3, HSPB8, and p62/SQSTM1 Are Required for Faithful Subcortical Actin Cloud Dynamic in Round Mitotic Cells
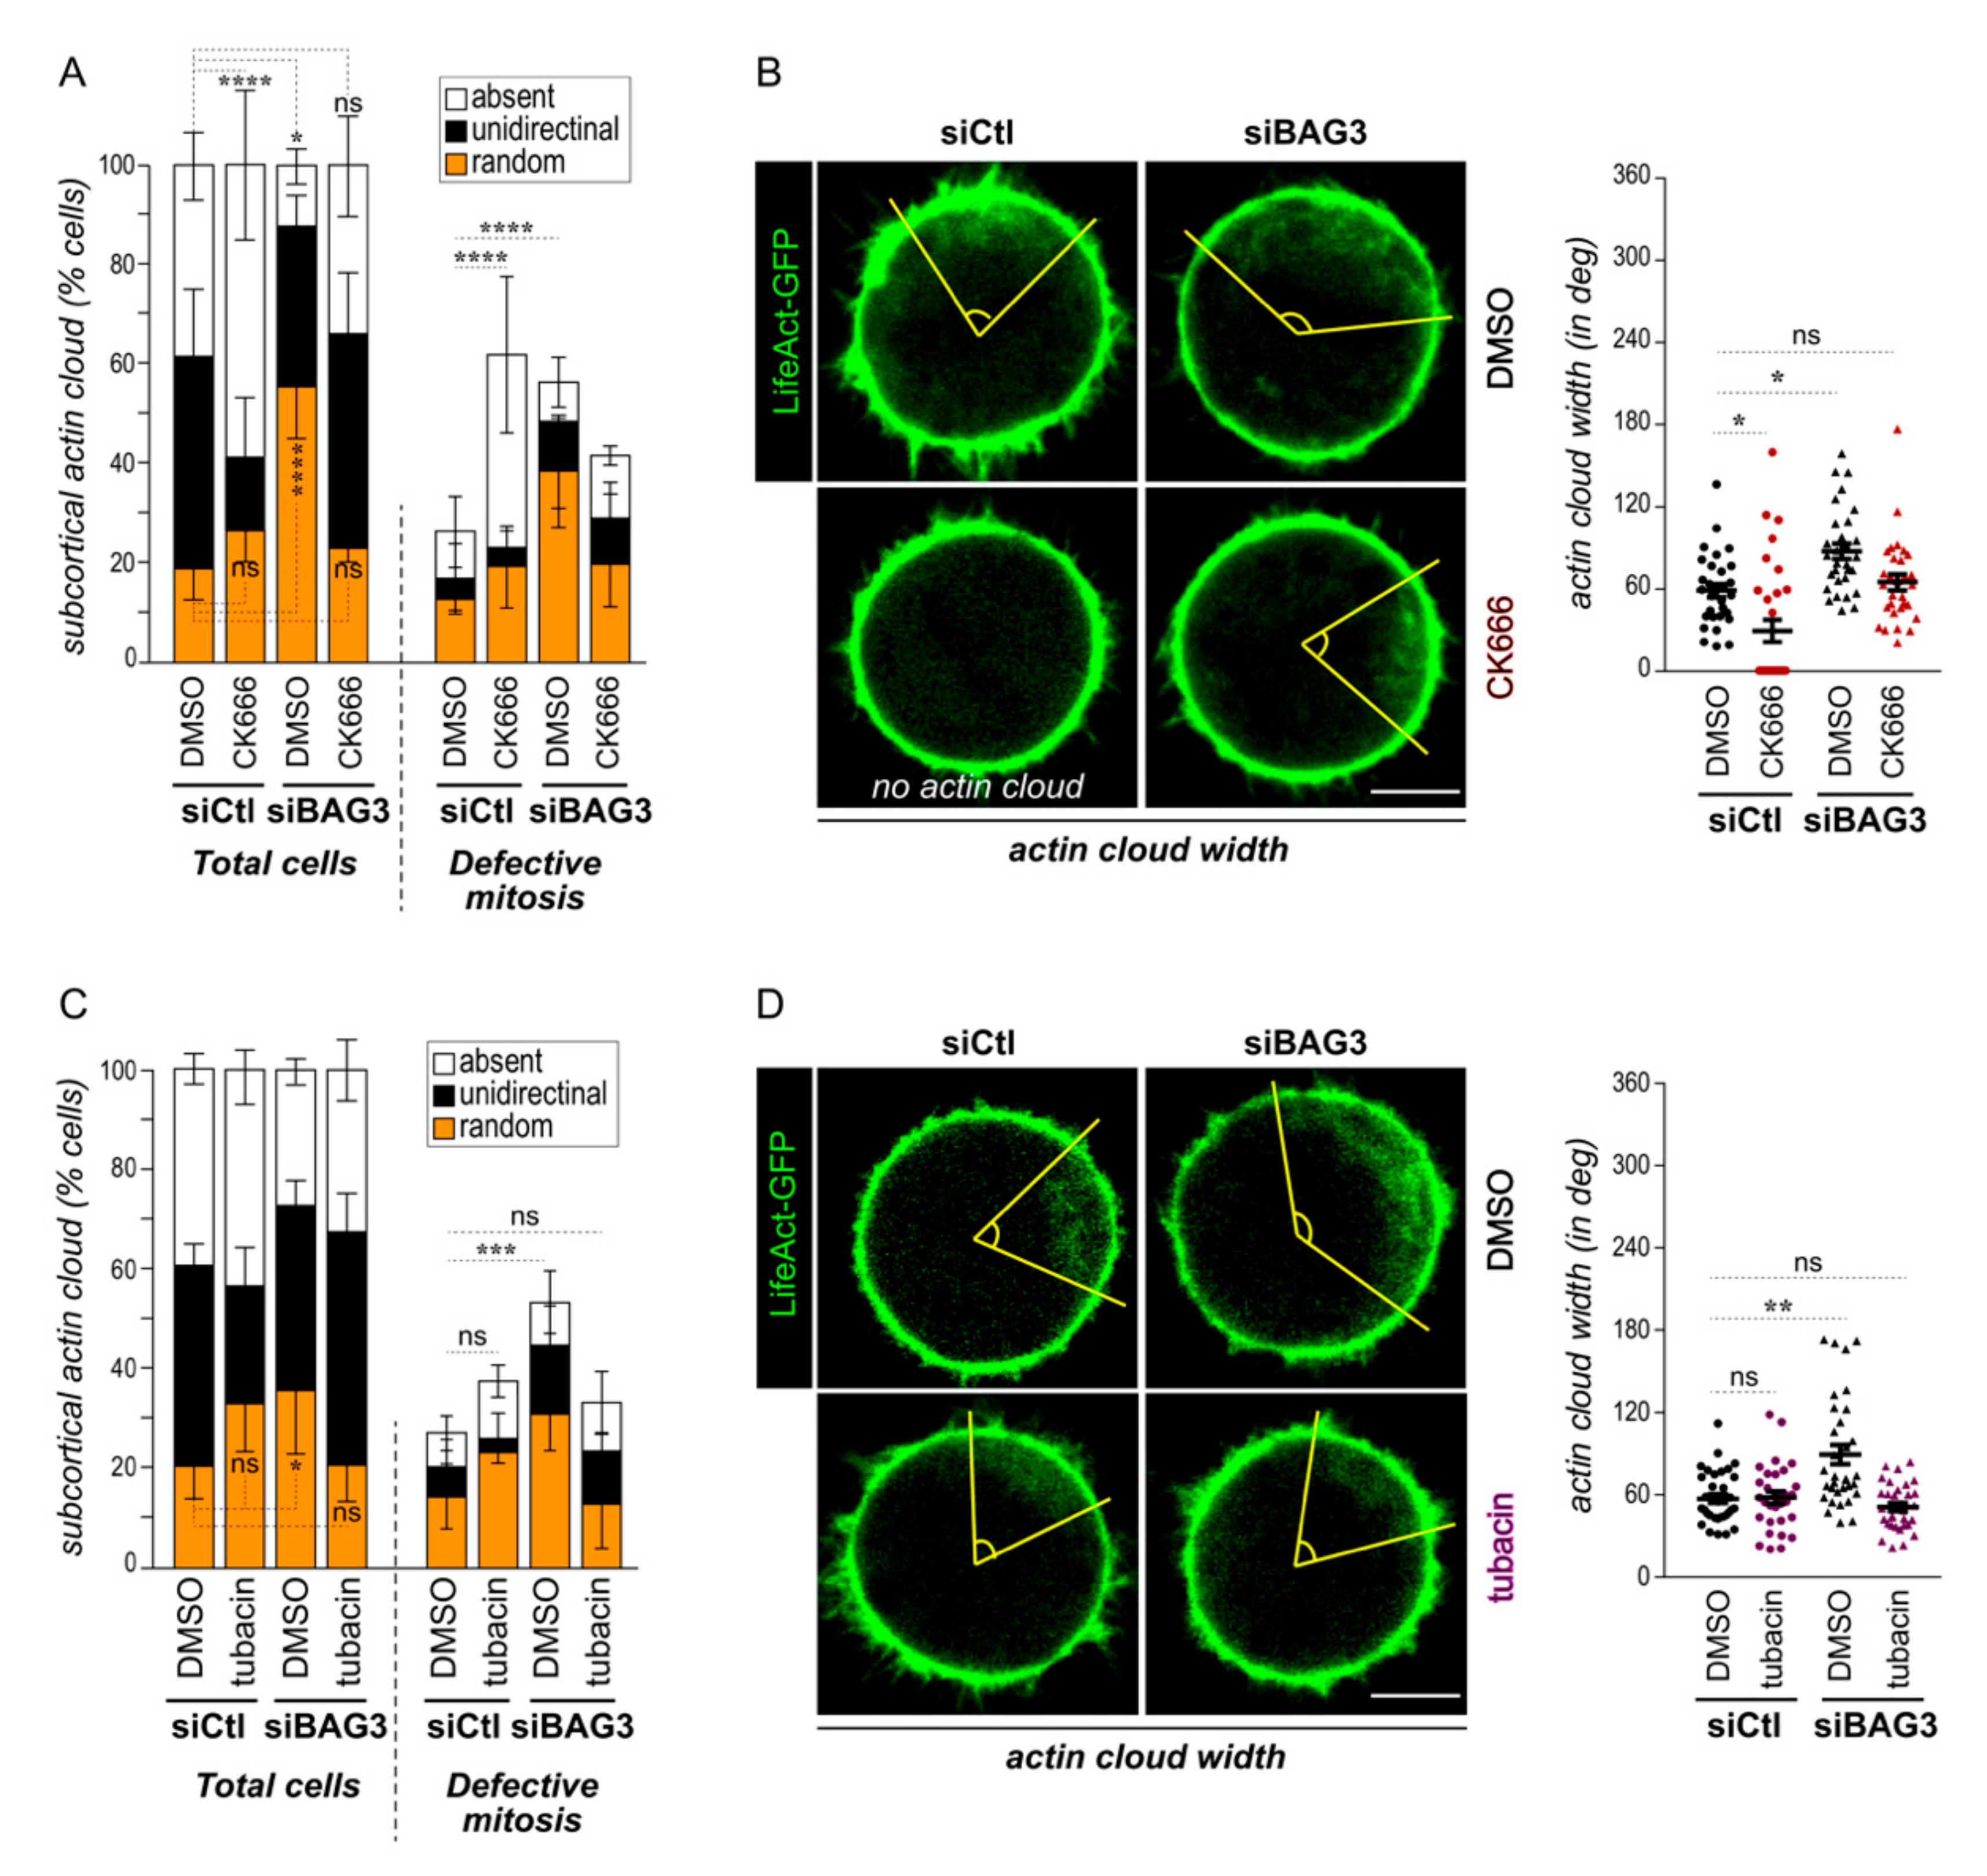
2.3. Downregulation of Arp2/3 Complex or HDAC6 Activity Normalizes Actin Cloud Organization and Dynamic in BAG3-Depleted Cells
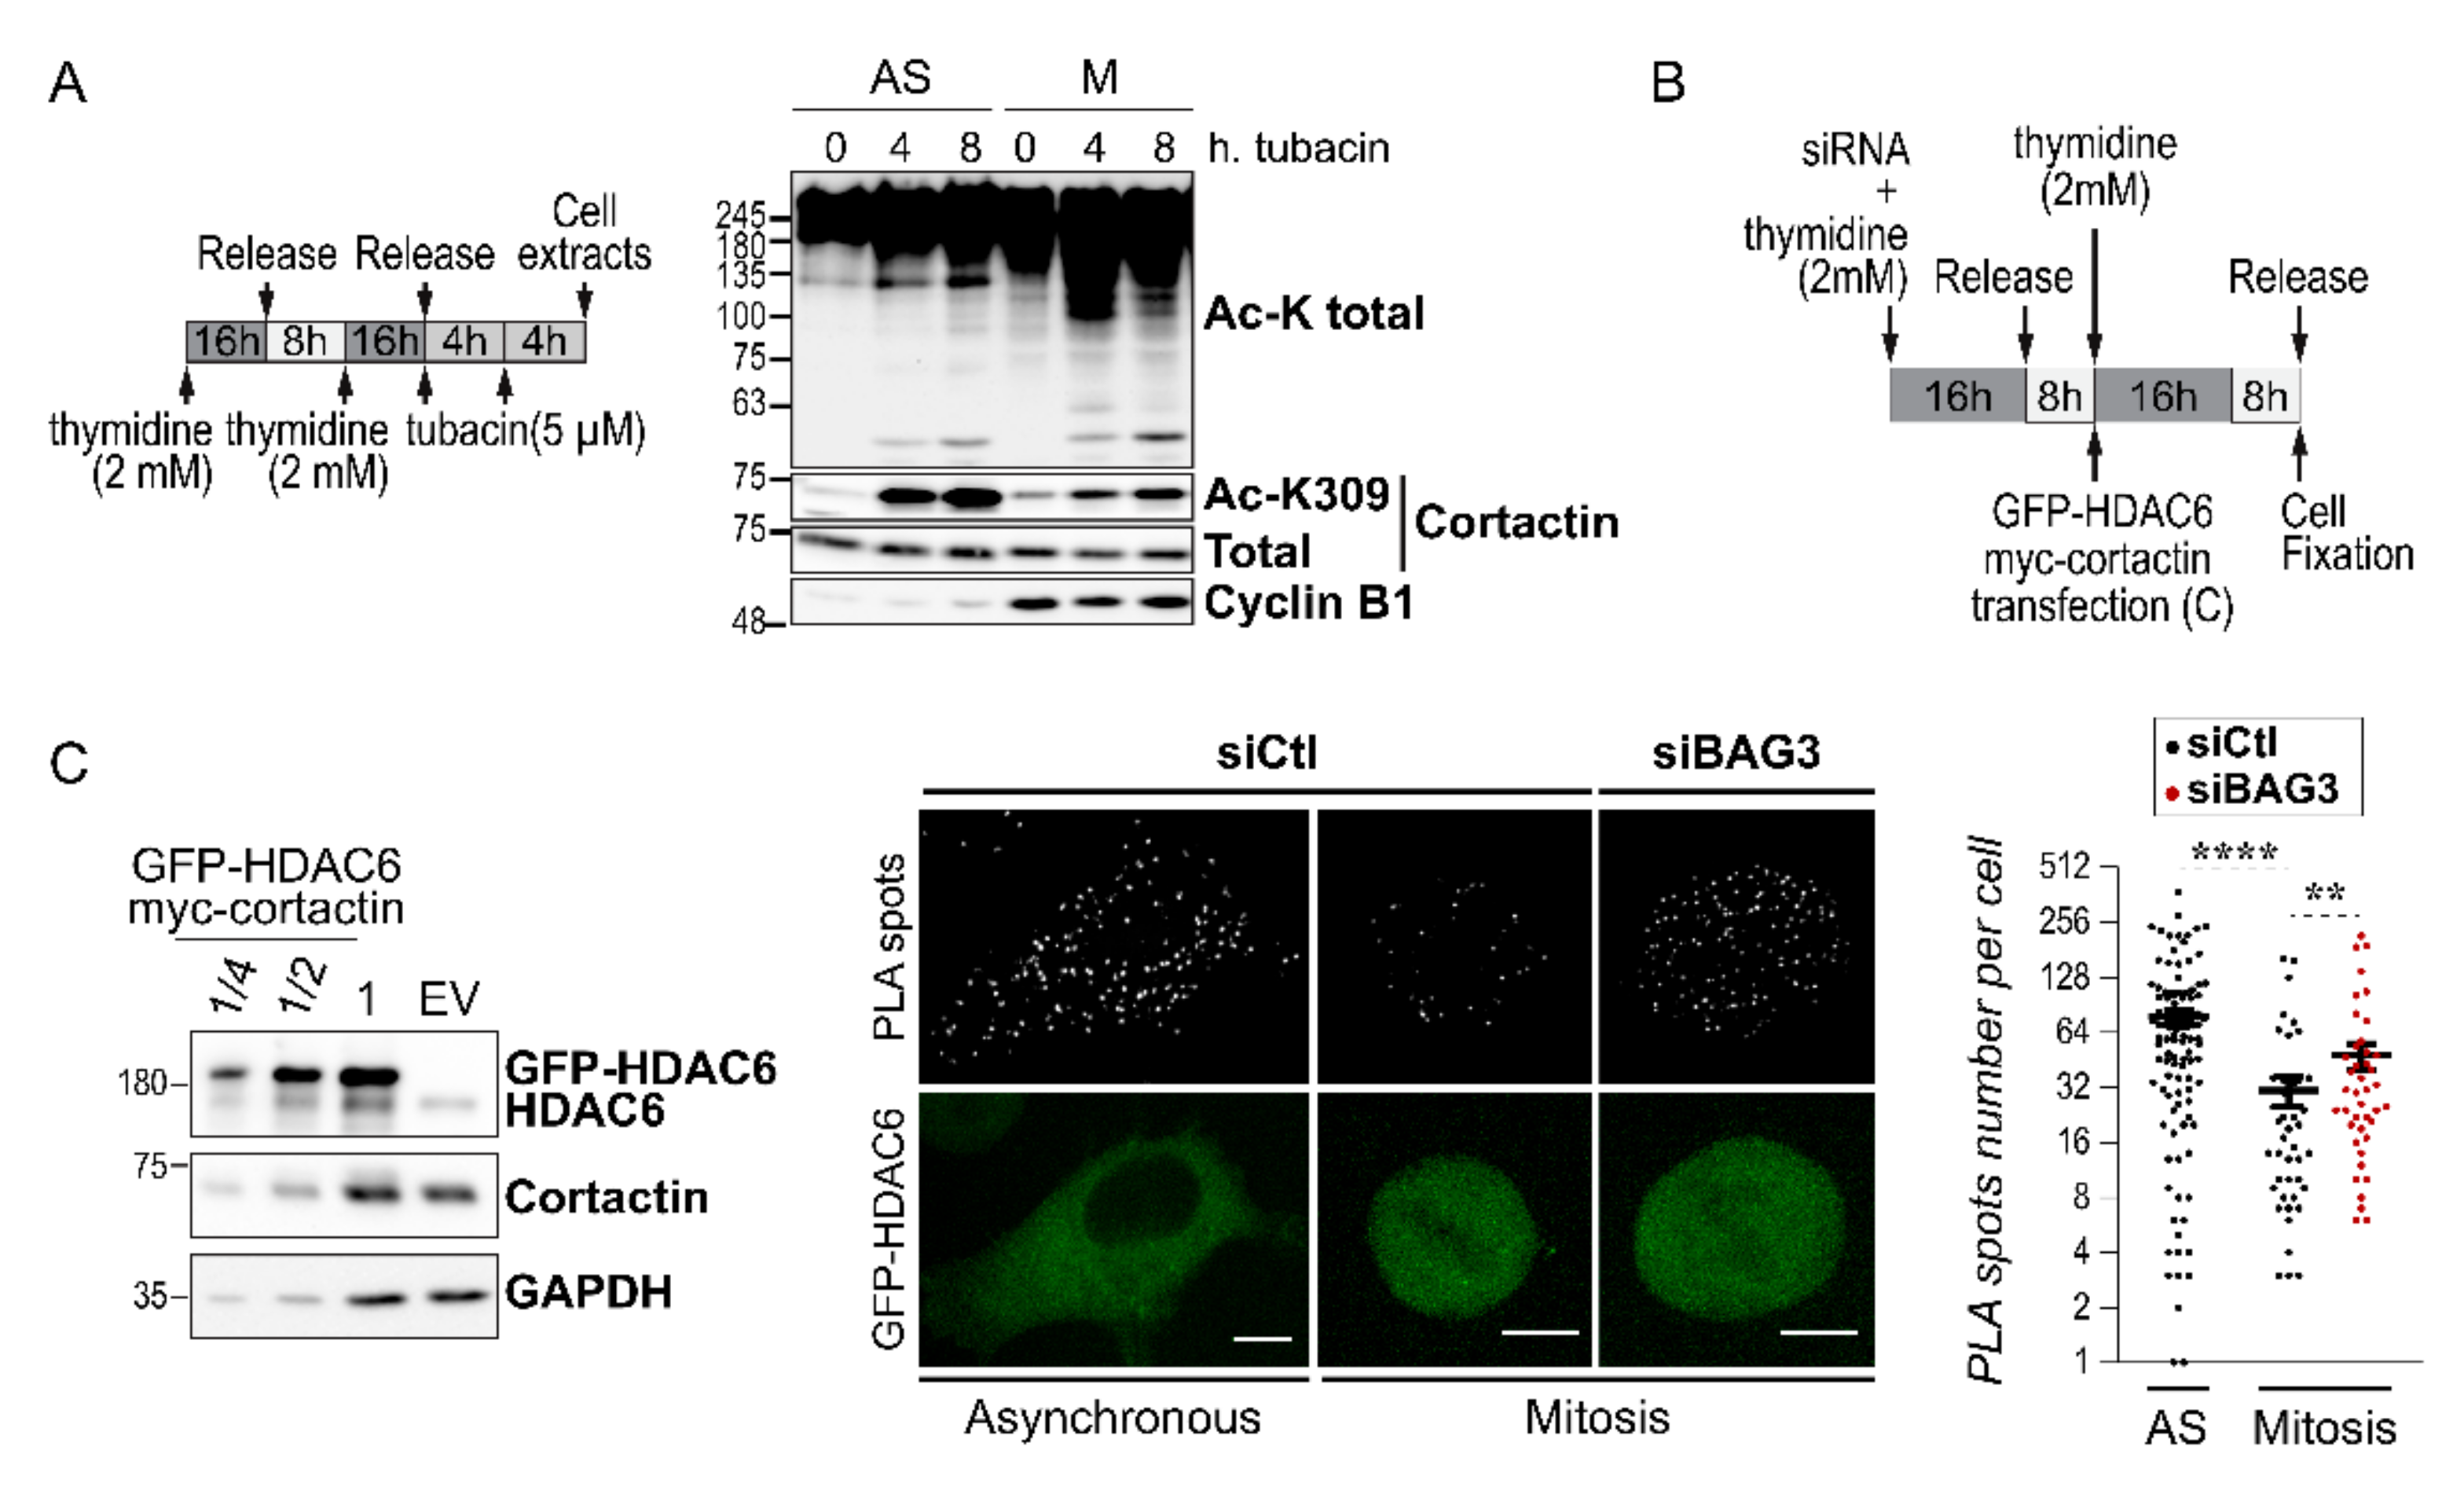
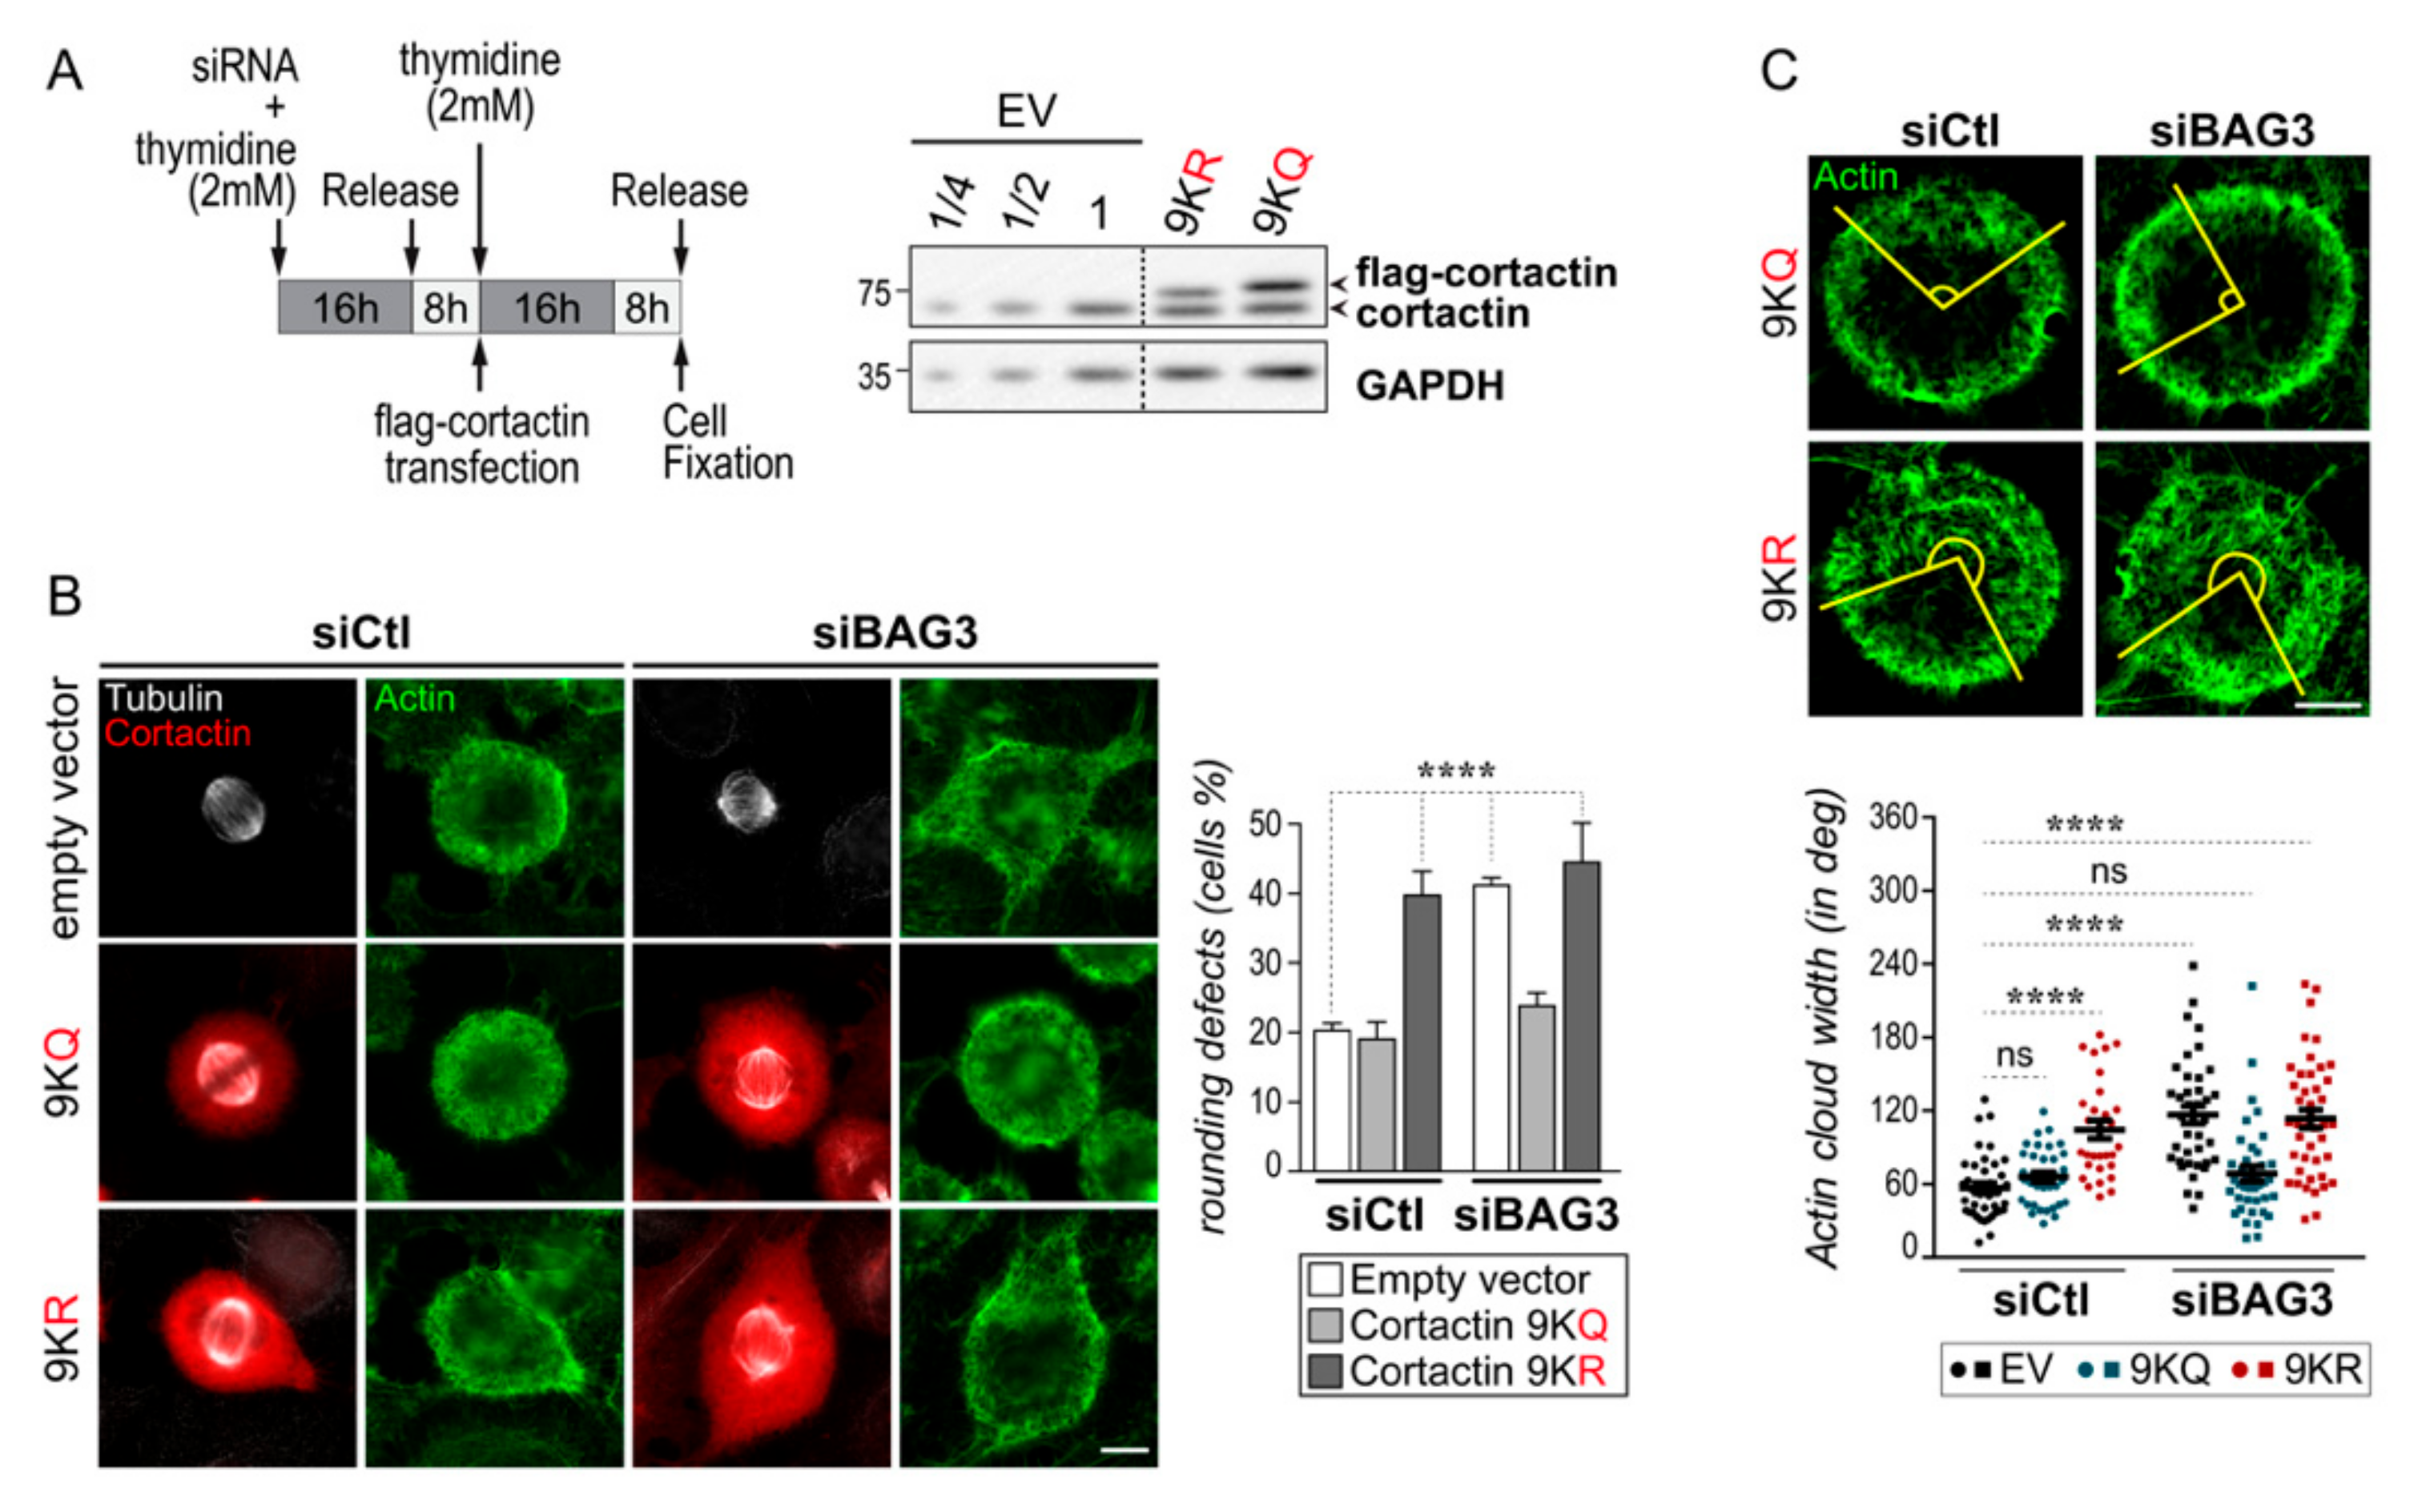
2.4. BAG3 Limits the Mitotic Association of HDAC6 with Its Substrate Cortactin, an Arp2/3 Regulatory Protein that Modulates Mitotic Actin Remodeling
3. Discussion
4. Materials and Methods
4.1. Cell Culture, Synchronization, siRNA Transfection and Cell Treatments
4.2. Adenovirus, Infection, Vectors and Transfection
4.3. Antibodies and Chemicals
4.4. Western Blot
4.5. Immunofluorescence, PLA, Time Lapse Imaging and Images Quantification
4.6. Statistical Analysis
5. Conclusions
Supplementary Materials
Author Contributions
Funding
Institutional Review Board Statement
Informed Consent Statement
Data Availability Statement
Acknowledgments
Conflicts of Interest
Abbreviations
| PQC | protein quality control |
| PLA | proximity ligation assay |
| TLA | three letter acronym |
| LD | linear dichroism |
| GFP | Green Fluorescent protein |
| RFP | Red Fluorescent Protein |
References
- Pollard, T.D.; Cooper, J.A. Actin, a central player in cell shape and movement. Science 2009, 326, 1208–1212. [Google Scholar] [CrossRef] [PubMed] [Green Version]
- Chalut, K.J.; Paluch, E.K. The Actin Cortex: A Bridge between Cell Shape and Function. Dev. Cell 2016, 38, 571–573. [Google Scholar] [CrossRef] [PubMed] [Green Version]
- Ramkumar, N.; Baum, B. Coupling changes in cell shape to chromosome segregation. Nat. Rev. Mol. Cell Biol. 2016, 17, 511–521. [Google Scholar] [CrossRef] [PubMed] [Green Version]
- Cadart, C.; Zlotek-Zlotkiewicz, E.; Le Berre, M.; Piel, M.; Matthews, H.K. Exploring the function of cell shape and size during mitosis. Dev. Cell 2014, 29, 159–169. [Google Scholar] [CrossRef] [PubMed] [Green Version]
- Taubenberger, A.V.; Baum, B.; Matthews, H.K. The Mechanics of Mitotic Cell Rounding. Front. Cell Dev. Biol. 2020, 8, 687. [Google Scholar] [CrossRef] [PubMed]
- Werner, A.; Disanza, A.; Reifenberger, N.; Habeck, G.; Becker, J.; Calabrese, M.; Urlaub, H.; Lorenz, H.; Schulman, B.; Scita, G.; et al. SCFFbxw5 mediates transient degradation of actin remodeller Eps8 to allow proper mitotic progression. Nat. Cell Biol. 2013, 15, 179–188. [Google Scholar] [CrossRef] [PubMed] [Green Version]
- Bovellan, M.; Romeo, Y.; Biro, M.; Boden, A.; Chugh, P.; Yonis, A.; Vaghela, M.; Fritzsche, M.; Moulding, D.; Thorogate, R.; et al. Cellular control of cortical actin nucleation. Curr. Biol. 2014, 24, 1628–1635. [Google Scholar] [CrossRef] [Green Version]
- Rosa, A.; Vlassaks, E.; Pichaud, F.; Baum, B. Ect2/Pbl acts via Rho and polarity proteins to direct the assembly of an isotropic actomyosin cortex upon mitotic entry. Dev. Cell 2015, 32, 604–616. [Google Scholar] [CrossRef] [Green Version]
- Cao, L.; Yonis, A.; Vaghela, M.; Barriga, E.H.; Chugh, P.; Smith, M.B.; Maufront, J.; Lavoie, G.; Meant, A.; Ferber, E.; et al. SPIN90 associates with mDia1 and the Arp2/3 complex to regulate cortical actin organization. Nat. Cell Biol. 2020, 22, 803–814. [Google Scholar] [CrossRef]
- Mitsushima, M.; Aoki, K.; Ebisuya, M.; Matsumura, S.; Yamamoto, T.; Matsuda, M.; Toyoshima, F.; Nishida, E. Revolving movement of a dynamic cluster of actin filaments during mitosis. J. Cell Biol. 2010, 191, 453–462. [Google Scholar] [CrossRef] [Green Version]
- Fink, J.; Carpi, N.; Betz, T.; Betard, A.; Chebah, M.; Azioune, A.; Bornens, M.; Sykes, C.; Fetler, L.; Cuvelier, D.; et al. External forces control mitotic spindle positioning. Nat. Cell Biol. 2011, 13, 771–778. [Google Scholar] [CrossRef] [PubMed]
- Wolff, S.; Weissman, J.S.; Dillin, A. Differential scales of protein quality control. Cell 2014, 157, 52–64. [Google Scholar] [CrossRef] [PubMed] [Green Version]
- Guilbert, S.M.; Varlet, A.-A.; Fuchs, M.; Lambert, H.; Landry, J.A.; Lavoie, J.N. Regulation of Actin-Based Structure Dynamics by HspB Proteins and Partners. In The Big Book of Small Heat Shock Proteins; Tanguay, R.M., Hightower, L.E., Eds.; Springer International Publishing AG: Cham, Switzerland, 2015; ISBN 978-3-319-16076-4. [Google Scholar]
- Yu, H.; Yang, F.; Dong, P.; Liao, S.; Liu, W.R.; Zhao, G.; Qin, B.; Dou, Z.; Liu, Z.; Liu, W.; et al. NDP52 tunes cortical actin interaction with astral microtubules for accurate spindle orientation. Cell Res. 2019, 29, 666–679. [Google Scholar] [CrossRef] [PubMed]
- Belaid, A.; Cerezo, M.; Chargui, A.; Corcelle-Termeau, E.; Pedeutour, F.; Giuliano, S.; Ilie, M.; Rubera, I.; Tauc, M.; Barale, S.; et al. Autophagy plays a critical role in the degradation of active RHOA, the control of cell cytokinesis, and genomic stability. Cancer Res. 2013, 73, 4311–4322. [Google Scholar] [CrossRef] [Green Version]
- Fuchs, M.; Luthold, C.; Guilbert, S.M.; Varlet, A.A.; Lambert, H.; Jetté, A.; Elowe, S.; Landry, J.; Lavoie, J.N. A Role for the Chaperone Complex BAG3-HSPB8 in Actin Dynamics, Spindle Orientation and Proper Chromosome Segregation during Mitosis. PLoS Genet. 2015, 11, e1005582. [Google Scholar] [CrossRef]
- Varlet, A.A.; Fuchs, M.; Luthold, C.; Lambert, H.; Landry, J.; Lavoie, J.N. Fine-tuning of actin dynamics by the HSPB8-BAG3 chaperone complex facilitates cytokinesis and contributes to its impact on cell division. Cell Stress Chaperones 2017, 22, 553–567. [Google Scholar] [CrossRef] [Green Version]
- Higuchi-Sanabria, R.; Frankino, P.A.; Paul, J.W., 3rd; Tronnes, S.U.; Dillin, A. A Futile Battle? Protein Quality Control and the Stress of Aging. Dev. Cell 2018, 44, 139–163. [Google Scholar] [CrossRef]
- Saibil, H. Chaperone machines for protein folding, unfolding and disaggregation. Nat. Rev. Mol. Cell Biol. 2013, 14, 630–642. [Google Scholar] [CrossRef] [Green Version]
- Behl, C. Breaking BAG: The Co-Chaperone BAG3 in Health and Disease. Trends Pharmacol. Sci. 2016, 37, 672–688. [Google Scholar] [CrossRef]
- Klimek, C.; Kathage, B.; Wordehoff, J.; Hohfeld, J. BAG3-mediated proteostasis at a glance. J. Cell Sci. 2017, 130, 2781–2788. [Google Scholar] [CrossRef] [Green Version]
- Carra, S.; Seguin, S.J.; Lambert, H.; Landry, J. HspB8 chaperone activity toward poly(Q)-containing proteins depends on its association with Bag3, a stimulator of macroautophagy. J. Biol. Chem. 2008, 283, 1437–1444. [Google Scholar] [CrossRef] [PubMed] [Green Version]
- Rauch, J.N.; Tse, E.; Freilich, R.; Mok, S.A.; Makley, L.N.; Southworth, D.R.; Gestwicki, J.E. BAG3 Is a Modular, Scaffolding Protein that physically Links Heat Shock Protein 70 (Hsp70) to the Small Heat Shock Proteins. J. Mol. Biol. 2017, 429, 128–141. [Google Scholar] [CrossRef] [PubMed] [Green Version]
- Fuchs, M.; Poirier, D.J.; Seguin, S.J.; Lambert, H.; Carra, S.; Charette, S.J.; Landry, J. Identification of the key structural motifs involved in HspB8/HspB6-Bag3 interaction. Biochem. J. 2009, 425, 245–255. [Google Scholar] [CrossRef] [PubMed] [Green Version]
- Collier, M.P.; Benesch, J.L.P. Small heat-shock proteins and their role in mechanical stress. Cell Stress Chaperones 2020, 25, 601–613. [Google Scholar] [CrossRef] [PubMed] [Green Version]
- Marzullo, L.; Turco, M.C.; De Marco, M. The multiple activities of BAG3 protein: Mechanisms. Biochim. Biophys. Acta Gen. Subj. 2020, 1864, 129628. [Google Scholar] [CrossRef]
- Minoia, M.; Boncoraglio, A.; Vinet, J.; Morelli, F.F.; Brunsting, J.F.; Poletti, A.; Krom, S.; Reits, E.; Kampinga, H.H.; Carra, S. BAG3 induces the sequestration of proteasomal clients into cytoplasmic puncta: Implications for a proteasome-to-autophagy switch. Autophagy 2014, 10, 1603–1621. [Google Scholar] [CrossRef] [Green Version]
- Guilbert, S.M.; Lambert, H.; Rodrigue, M.A.; Fuchs, M.; Landry, J.; Lavoie, J.N. HSPB8 and BAG3 cooperate to promote spatial sequestration of ubiquitinated proteins and coordinate the cellular adaptive response to proteasome insufficiency. FASEB J. 2018, 32, 3518–3535. [Google Scholar] [CrossRef] [Green Version]
- Kathage, B.; Gehlert, S.; Ulbricht, A.; Ludecke, L.; Tapia, V.E.; Orfanos, Z.; Wenzel, D.; Bloch, W.; Volkmer, R.; Fleischmann, B.K.; et al. The cochaperone BAG3 coordinates protein synthesis and autophagy under mechanical strain through spatial regulation of mTORC1. Biochim. Biophys. Acta Mol. Cell Res. 2017, 1864, 62–75. [Google Scholar] [CrossRef]
- Arndt, V.; Dick, N.; Tawo, R.; Dreiseidler, M.; Wenzel, D.; Hesse, M.; Furst, D.O.; Saftig, P.; Saint, R.; Fleischmann, B.K.; et al. Chaperone-assisted selective autophagy is essential for muscle maintenance. Curr. Biol. 2010, 20, 143–148. [Google Scholar] [CrossRef]
- Li, T.; Zhang, C.; Hassan, S.; Liu, X.; Song, F.; Chen, K.; Zhang, W.; Yang, J. Histone deacetylase 6 in cancer. J. Hematol. Oncol. 2018, 11, 111. [Google Scholar] [CrossRef]
- Haggarty, S.J.; Koeller, K.M.; Wong, J.C.; Grozinger, C.M.; Schreiber, S.L. Domain-selective small-molecule inhibitor of histone deacetylase 6 (HDAC6)-mediated tubulin deacetylation. Proc. Natl. Acad. Sci. USA 2003, 100, 4389–4394. [Google Scholar] [CrossRef] [PubMed] [Green Version]
- Wong, J.C.; Hong, R.; Schreiber, S.L. Structural biasing elements for in-cell histone deacetylase paralog selectivity. J. Am. Chem. Soc. 2003, 125, 5586–5587. [Google Scholar] [CrossRef] [PubMed]
- Zhang, X.; Yuan, Z.; Zhang, Y.; Yong, S.; Salas-Burgos, A.; Koomen, J.; Olashaw, N.; Parsons, J.T.; Yang, X.J.; Dent, S.R.; et al. HDAC6 modulates cell motility by altering the acetylation level of cortactin. Mol. Cell 2007, 27, 197–213. [Google Scholar] [CrossRef] [PubMed] [Green Version]
- Weed, S.A.; Karginov, A.V.; Schafer, D.A.; Weaver, A.M.; Kinley, A.W.; Cooper, J.A.; Parsons, J.T. Cortactin localization to sites of actin assembly in lamellipodia requires interactions with F-actin and the Arp2/3 complex. J. Cell Biol. 2000, 151, 29–40. [Google Scholar] [CrossRef] [PubMed]
- Uruno, T.; Liu, J.; Zhang, P.; Fan, Y.; Egile, C.; Li, R.; Mueller, S.C.; Zhan, X. Activation of Arp2/3 complex-mediated actin polymerization by cortactin. Nat. Cell Biol. 2001, 3, 259–266. [Google Scholar] [CrossRef]
- Soderberg, O.; Gullberg, M.; Jarvius, M.; Ridderstrale, K.; Leuchowius, K.J.; Jarvius, J.; Wester, K.; Hydbring, P.; Bahram, F.; Larsson, L.G.; et al. Direct observation of individual endogenous protein complexes in situ by proximity ligation. Nat. Methods 2006, 3, 995–1000. [Google Scholar] [CrossRef]
- Ciuffa, R.; Lamark, T.; Tarafder, A.K.; Guesdon, A.; Rybina, S.; Hagen, W.J.; Johansen, T.; Sachse, C. The selective autophagy receptor p62 forms a flexible filamentous helical scaffold. Cell Rep. 2015, 11, 748–758. [Google Scholar] [CrossRef] [Green Version]
- Bjorkoy, G.; Lamark, T.; Brech, A.; Outzen, H.; Perander, M.; Overvatn, A.; Stenmark, H.; Johansen, T. p62/SQSTM1 forms protein aggregates degraded by autophagy and has a protective effect on huntingtin-induced cell death. J. Cell Biol. 2005, 171, 603–614. [Google Scholar] [CrossRef] [Green Version]
- Itakura, E.; Mizushima, N. p62 Targeting to the autophagosome formation site requires self-oligomerization but not LC3 binding. J. Cell Biol. 2011, 192, 17–27. [Google Scholar] [CrossRef] [Green Version]
- Ichimura, Y.; Kumanomidou, T.; Sou, Y.S.; Mizushima, T.; Ezaki, J.; Ueno, T.; Kominami, E.; Yamane, T.; Tanaka, K.; Komatsu, M. Structural basis for sorting mechanism of p62 in selective autophagy. J. Biol. Chem. 2008, 283, 22847–22857. [Google Scholar] [CrossRef] [Green Version]
- Jain, A.; Lamark, T.; Sjottem, E.; Larsen, K.B.; Awuh, J.A.; Overvatn, A.; McMahon, M.; Hayes, J.D.; Johansen, T. p62/SQSTM1 is a target gene for transcription factor NRF2 and creates a positive feedback loop by inducing antioxidant response element-driven gene transcription. J. Biol. Chem. 2010, 285, 22576–22591. [Google Scholar] [CrossRef] [PubMed] [Green Version]
- Komatsu, M.; Kurokawa, H.; Waguri, S.; Taguchi, K.; Kobayashi, A.; Ichimura, Y.; Sou, Y.S.; Ueno, I.; Sakamoto, A.; Tong, K.I.; et al. The selective autophagy substrate p62 activates the stress responsive transcription factor Nrf2 through inactivation of Keap1. Nat. Cell Biol. 2010, 12, 213–223. [Google Scholar] [CrossRef] [PubMed]
- Houslay, M.D.; Christian, F. p62 (SQSTM1) forms part of a novel, reversible aggregate containing a specific conformer of the cAMP degrading phosphodiesterase, PDE4A4. Autophagy 2010, 6, 1198–1200. [Google Scholar] [CrossRef] [PubMed]
- Rantanen, K.; Pursiheimo, J.P.; Hogel, H.; Miikkulainen, P.; Sundstrom, J.; Jaakkola, P.M. p62/SQSTM1 regulates cellular oxygen sensing by attenuating PHD3 activity through aggregate sequestration and enhanced degradation. J. Cell Sci 2013, 126, 1144–1154. [Google Scholar] [CrossRef] [PubMed] [Green Version]
- Mathiassen, S.G.; De Zio, D.; Cecconi, F. Autophagy and the Cell Cycle: A Complex Landscape. Front. Oncol. 2017, 7, 51. [Google Scholar] [CrossRef] [Green Version]
- Loukil, A.; Zonca, M.; Rebouissou, C.; Baldin, V.; Coux, O.; Biard-Piechaczyk, M.; Blanchard, J.M.; Peter, M. High-resolution live-cell imaging reveals novel cyclin A2 degradation foci involving autophagy. J. Cell Sci. 2014, 127, 2145–2150. [Google Scholar] [CrossRef] [Green Version]
- Loukil, A.; Izard, F.; Georgieva, M.; Mashayekhan, S.; Blanchard, J.M.; Parmeggiani, A.; Peter, M. Foci of cyclin A2 interact with actin and RhoA in mitosis. Sci. Rep. 2016, 6, 27215. [Google Scholar] [CrossRef] [Green Version]
- Wang, W.; Chen, L.; Ding, Y.; Jin, J.; Liao, K. Centrosome separation driven by actin-microfilaments during mitosis is mediated by centrosome-associated tyrosine-phosphorylated cortactin. J. Cell Sci. 2008, 121, 1334–1343. [Google Scholar] [CrossRef] [Green Version]
- Farina, F.; Ramkumar, N.; Brown, L.; Samandar Eweis, D.; Anstatt, J.; Waring, T.; Bithell, J.; Scita, G.; Thery, M.; Blanchoin, L.; et al. Local actin nucleation tunes centrosomal microtubule nucleation during passage through mitosis. EMBO J. 2019, 38, e99843. [Google Scholar] [CrossRef]
- Hong, J.; Park, J.S.; Lee, H.; Jeong, J.; Hyeon Yun, H.; Yun Kim, H.; Ko, Y.G.; Lee, J.H. Myosin heavy chain is stabilized by BCL-2 interacting cell death suppressor (BIS) in skeletal muscle. Exp. Mol. Med. 2016, 48, e225. [Google Scholar] [CrossRef]
- Zhang, L.; Liu, S.; Liu, N.; Zhang, Y.; Liu, M.; Li, D.; Seto, E.; Yao, T.P.; Shui, W.; Zhou, J. Proteomic identification and functional characterization of MYH9, Hsc70, and DNAJA1 as novel substrates of HDAC6 deacetylase activity. Protein Cell 2015, 6, 42–54. [Google Scholar] [CrossRef] [PubMed] [Green Version]
- Fuchs, M.; Boulanger, M.C.; Lambert, H.; Landry, J.; Lavoie, J.N. Adenofection: A Method for Studying the Role of Molecular Chaperones in Cellular Morphodynamics by Depletion-Rescue Experiments. J. Vis. Exp. 2016, 115, e54557. [Google Scholar] [CrossRef] [PubMed]
- Champagne, C.; Landry, M.C.; Gingras, M.C.; Lavoie, J.N. Activation of adenovirus type 2 early region 4 ORF4 cytoplasmic death function by direct binding to Src kinase domain. J. Biol. Chem. 2004, 279, 25905–25915. [Google Scholar] [CrossRef] [PubMed] [Green Version]
- Dziengelewski, C.; Rodrigue, M.A.; Caillier, A.; Jacquet, K.; Boulanger, M.C.; Bergeman, J.; Fuchs, M.; Lambert, H.; Laprise, P.; Richard, D.E.; et al. Adenoviral protein E4orf4 interacts with the polarity protein Par3 to induce nuclear rupture and tumor cell death. J. Cell Biol. 2020, 219, e201805122. [Google Scholar] [CrossRef]


Publisher’s Note: MDPI stays neutral with regard to jurisdictional claims in published maps and institutional affiliations. |
© 2020 by the authors. Licensee MDPI, Basel, Switzerland. This article is an open access article distributed under the terms and conditions of the Creative Commons Attribution (CC BY) license (http://creativecommons.org/licenses/by/4.0/).
Share and Cite
Luthold, C.; Varlet, A.-A.; Lambert, H.; Bordeleau, F.; Lavoie, J.N. Chaperone-Assisted Mitotic Actin Remodeling by BAG3 and HSPB8 Involves the Deacetylase HDAC6 and Its Substrate Cortactin. Int. J. Mol. Sci. 2021, 22, 142. https://0-doi-org.brum.beds.ac.uk/10.3390/ijms22010142
Luthold C, Varlet A-A, Lambert H, Bordeleau F, Lavoie JN. Chaperone-Assisted Mitotic Actin Remodeling by BAG3 and HSPB8 Involves the Deacetylase HDAC6 and Its Substrate Cortactin. International Journal of Molecular Sciences. 2021; 22(1):142. https://0-doi-org.brum.beds.ac.uk/10.3390/ijms22010142
Chicago/Turabian StyleLuthold, Carole, Alice-Anaïs Varlet, Herman Lambert, François Bordeleau, and Josée N. Lavoie. 2021. "Chaperone-Assisted Mitotic Actin Remodeling by BAG3 and HSPB8 Involves the Deacetylase HDAC6 and Its Substrate Cortactin" International Journal of Molecular Sciences 22, no. 1: 142. https://0-doi-org.brum.beds.ac.uk/10.3390/ijms22010142