Article

mRNA and miRNA Expression Analyses of the MYC/E2F/miR-17-92 Network in the Most Common Pediatric Brain Tumors

by
Renata Gruszka
1,2,*,
Krzysztof Zakrzewski
3,
Paweł Piotr Liberski
1 and
Magdalena Zakrzewska
1
1
Department of Molecular Pathology and Neuropathology, Medical University of Lodz, Pomorska 251, 92-216 Lodz, Poland
2
Biobank Lab, Department of Molecular Biophysics, Faculty of Biology and Environmental Protection, University of Lodz, Pomorska 139, 90-235 Lodz, Poland
3
Department of Neurosurgery, Polish Mother Memorial Hospital Research Institute in Lodz, Rzgowska 281/289, 93-338 Lodz, Poland
*
Author to whom correspondence should be addressed.
Int. J. Mol. Sci. 2021, 22(2), 543; https://0-doi-org.brum.beds.ac.uk/10.3390/ijms22020543
Submission received: 12 December 2020 / Revised: 30 December 2020 / Accepted: 4 January 2021 / Published: 7 January 2021
(This article belongs to the Special Issue Molecular Biology and Translational Aspects in CNS Tumors 2.0)

Abstract

:
Numerous molecular factors disrupt the correctness of the cell cycle process leading to the development of cancer due to increased cell proliferation. Among known causative factors of such process is abnormal gene expression. Nowadays in the light of current knowledge such alterations are frequently considered in the context of mRNA–miRNA correlation. One of the molecular factors with potential value in tumorigenesis is the feedback loop between MYC and E2F genes in which miR-17-5p and miR-20a from the miR-17-92 cluster are involved. The current literature shows that overexpression of the members of the OncomiR-1 are involved in the development of many solid tumors. In the present work, we investigated the expression of components of the MYC/E2F/miR-17-92 network and their closely related elements including members of MYC and E2F families and miRNAs from two paralogs of miR-17-92: miR-106b-25 and miR-106a-363, in the most common brain tumors of childhood, pilocytic astrocytoma (PA), WHO grade 1; ependymoma (EP), WHO grade 2; and medulloblastoma (MB), WHO grade 4. We showed that the highest gene expression was observed in the MYC family for MYCN and in the E2F family for E2F2. Positive correlation was observed between the gene expression and tumor grade and type, with the highest expression being noted for medulloblastomas, followed by ependymomas, and the lowest for pilocytic astrocytomas. Most members of miR-17-92, miR-106a-363 and miR-106b-25 clusters were upregulated and the highest expression was noted for miR-18a and miR-18b. The rest of the miRNAs, including miR-19a, miR-92a, miR-106a, miR-93, or miR-25 also showed high values. miR-17-5p, miR-20a obtained a high level of expression in medulloblastomas and ependymomas, while close to the control in the pilocytic astrocytoma samples. miRNA expression also depended on tumor grade and histology.

Graphical Abstract

1. Introduction

miRNA molecules are involved in the post-transcriptional regulation of gene expression, and changes in their activity are associated with development of cancer by modulating oncogenic and/or tumor suppressor pathways. Moreover, miRNAs are still being studied as useful biomarkers, promising a valuable diagnostic tool useful in defining the prognosis and helpful in identifying the targeted therapy strategies [1,2]. One of the most recognized miRNA families is the miR-17-92 cluster (OncomiR-1), whose particular members demonstrate oncogenic functions influencing cell proliferation, apoptosis, and neoplastic angiogenesis [3]. OncomiR-1 contains six miRNAs: miR-17, miR-18, miR-19a, miR-20, miR-19b, and miR-92 derived from a common pri-mRNA localized in the MIR17HG/C13orf25 human gene located on chromosome 13. The cluster has two paralogs: the miR-106b-25 and the miR-106a-363, which comprise miR-106b, miR-93, and miR-25 in the MCM7 gene on chromosome 7 and miR-106a, miR-18b, miR-19b-2, miR-20b, miR-92a-2, and miR-363 on the X chromosome, respectively [3,4]. The most common element of these three clusters is their origin. miR-17-92 and its paralogs were probably created through tandem genetic duplication of individual cluster members, followed by duplication of entire clusters and subsequent loss of individual miRNAs [4]. This hypothesis was confirmed by the possibility of grouping specific miRNAs on the basis of sequence homology into four miRNA families: miR-17 family, (miR-17-5p, miR-20a, miR-20b, miR-106a, miR-106b, miR-93), miR-18 family (miR-18a, miR-18b), miR-19 family (miR-19a, miR-19b-1, miR-19b-2), and miR-92 family (miR-92a-1, miR-92a-2, miR-25, miR-363) [4].
Experimental studies have shown that there is a negative feedback loop among members of the miR-17-92 cluster and E2F and MYC transcription factors [5,6]. Many mathematical models of the MYC/E2F/miR-17-92 network were created, estimating how overexpression of the miR-17-92 cluster affects different types of cancers [5,7,8]. The consecutive studies provide evidences that the overexpression of miR-17-92 members is involved in the development of many solid tumors, including lung [9], breast [10], colon [11], hepatocellular [12], and stomach cancer [13]. Their essential role in adipocyte differentiation [14], lung development [15], angiogenesis [16], tumorigenesis [17], and heart development [18] was also underlined.

2. Results

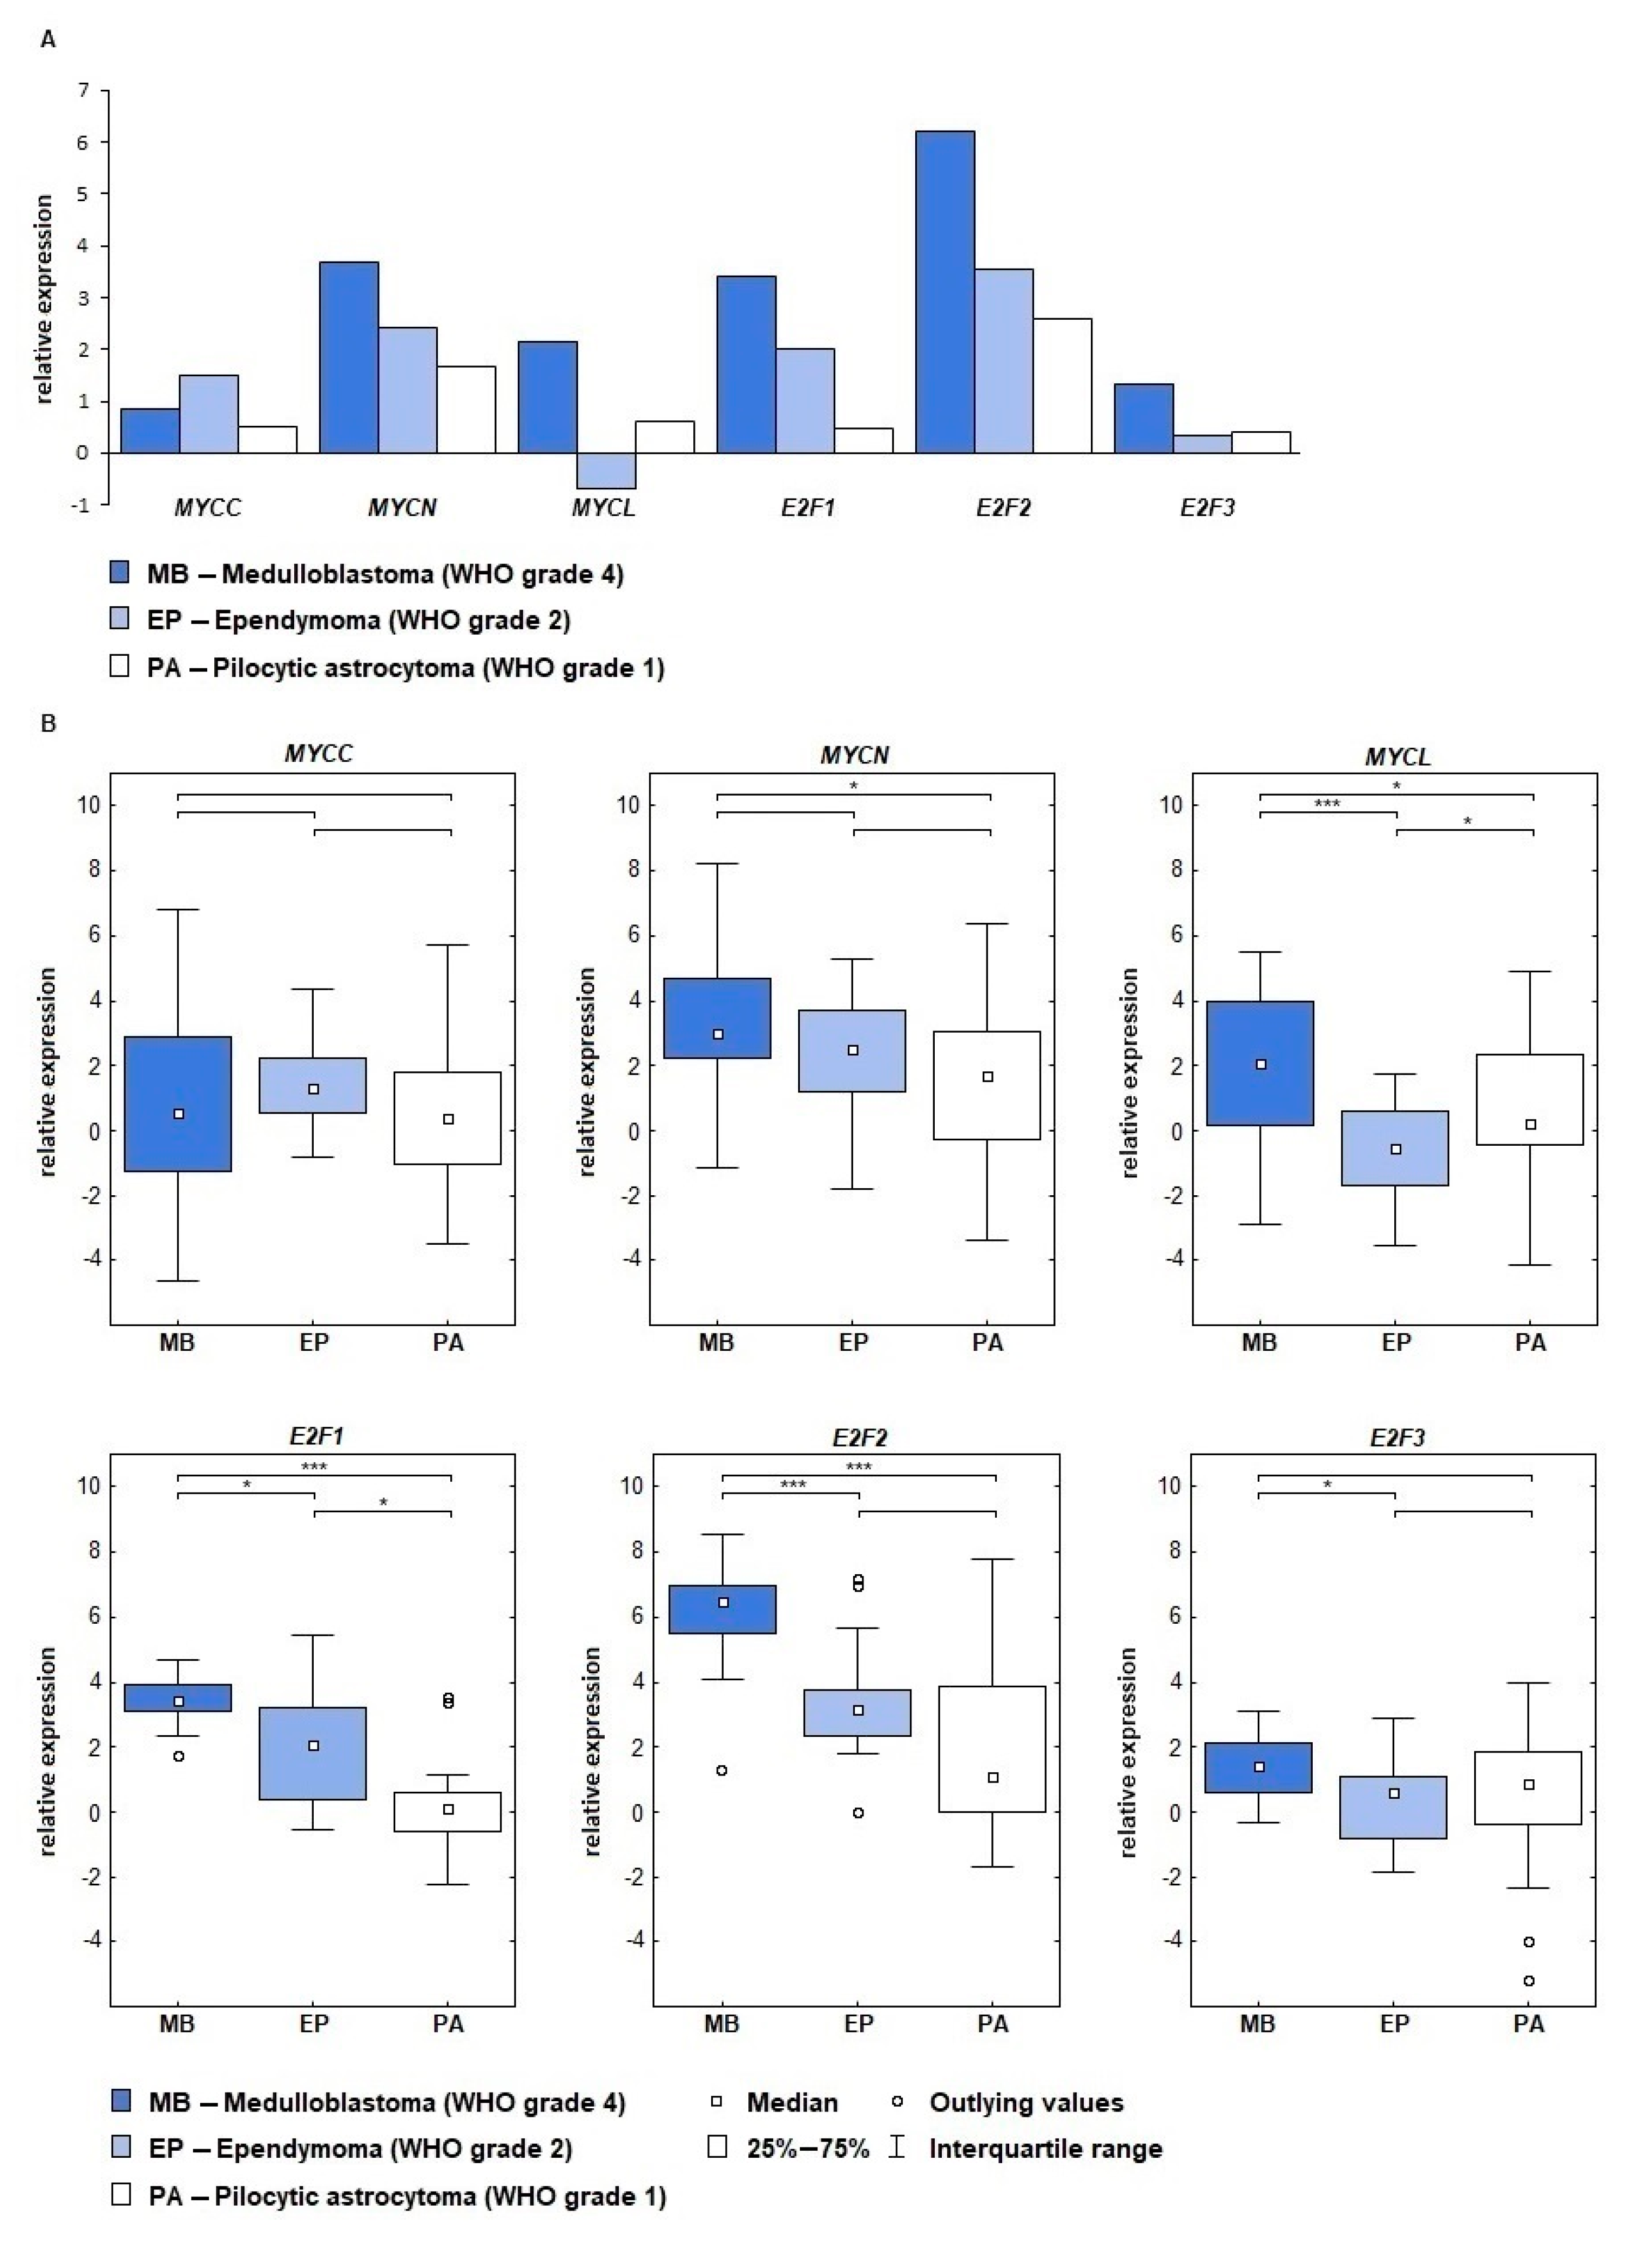
2.1. MYC and E2F Gene Expression Is Connected with Tumor Type and Grade

Analysis of expression levels of genes from the MYC family showed that MYCN was characterized by the highest activity (Figure 1). The highest level was confirmed for the medulloblastomas (ddCt = 3.67), which have the highest grade of malignancy among the examined tumors. Differences in expression levels between the analyzed groups showed statistical significance between medulloblastoma (MB) and pilocytic astrocytoma (PA) (p = 0.0125, Table 1).
The expression of the MYCC gene was at a lower level than MYCN. The highest values of MYCC were confirmed in the ependymomas (ddCt = 1.49), followed by medulloblastomas, while the lowest expression was showed in the pilocytic astrocytomas, however, no statistically significant differences were found between the groups.
For the MYCL gene we obtained the highest expression in the medulloblastomas (ddCt = 2.15), followed by pilocytic astrocytomas. Downregulation was noted in the ependymomas (ddCt = −0.68). The following differences in the expression between the groups p = 0.0116,74 (MB vs. PA), p = 0.000109 (MB vs. ependymoma (EP)) and p = 0.0440,45 (EP vs. PA) were statistically significant.
Gene expression analysis among the members of the E2F family showed very high up-expression for the E2F2 gene. The highest level was found in the medulloblastomas (ddCt = 6.62), followed by EPs and PAs. The differences between the groups for the E2F2 gene, p < 0.000, was noted between MB and PA and MB and EP groups. E2F1 expression reached a significance level between MBs and PAs (p < 0.000), between MBs and EPs (p = 0.0135) and between EPs and PAs (p = 0.014). The E2F3 gene obtained the lowest level of expression where ddCt = 1.33 for MBs, ddCt = 0.34 for EPs, ddCt = 0.39 for PAs. Statistically significant differences were noted between MB and EP, where p = 0.011.
In conclusion, the MYCN, E2F1, E2F2 genes showed the highest expression levels among the studied groups. The highest ddCt values of these genes were noticed in medulloblastomas, followed by ependymomas and pilocytic astrocytomas, indicating a positive correlation between expression level and tumor grade.

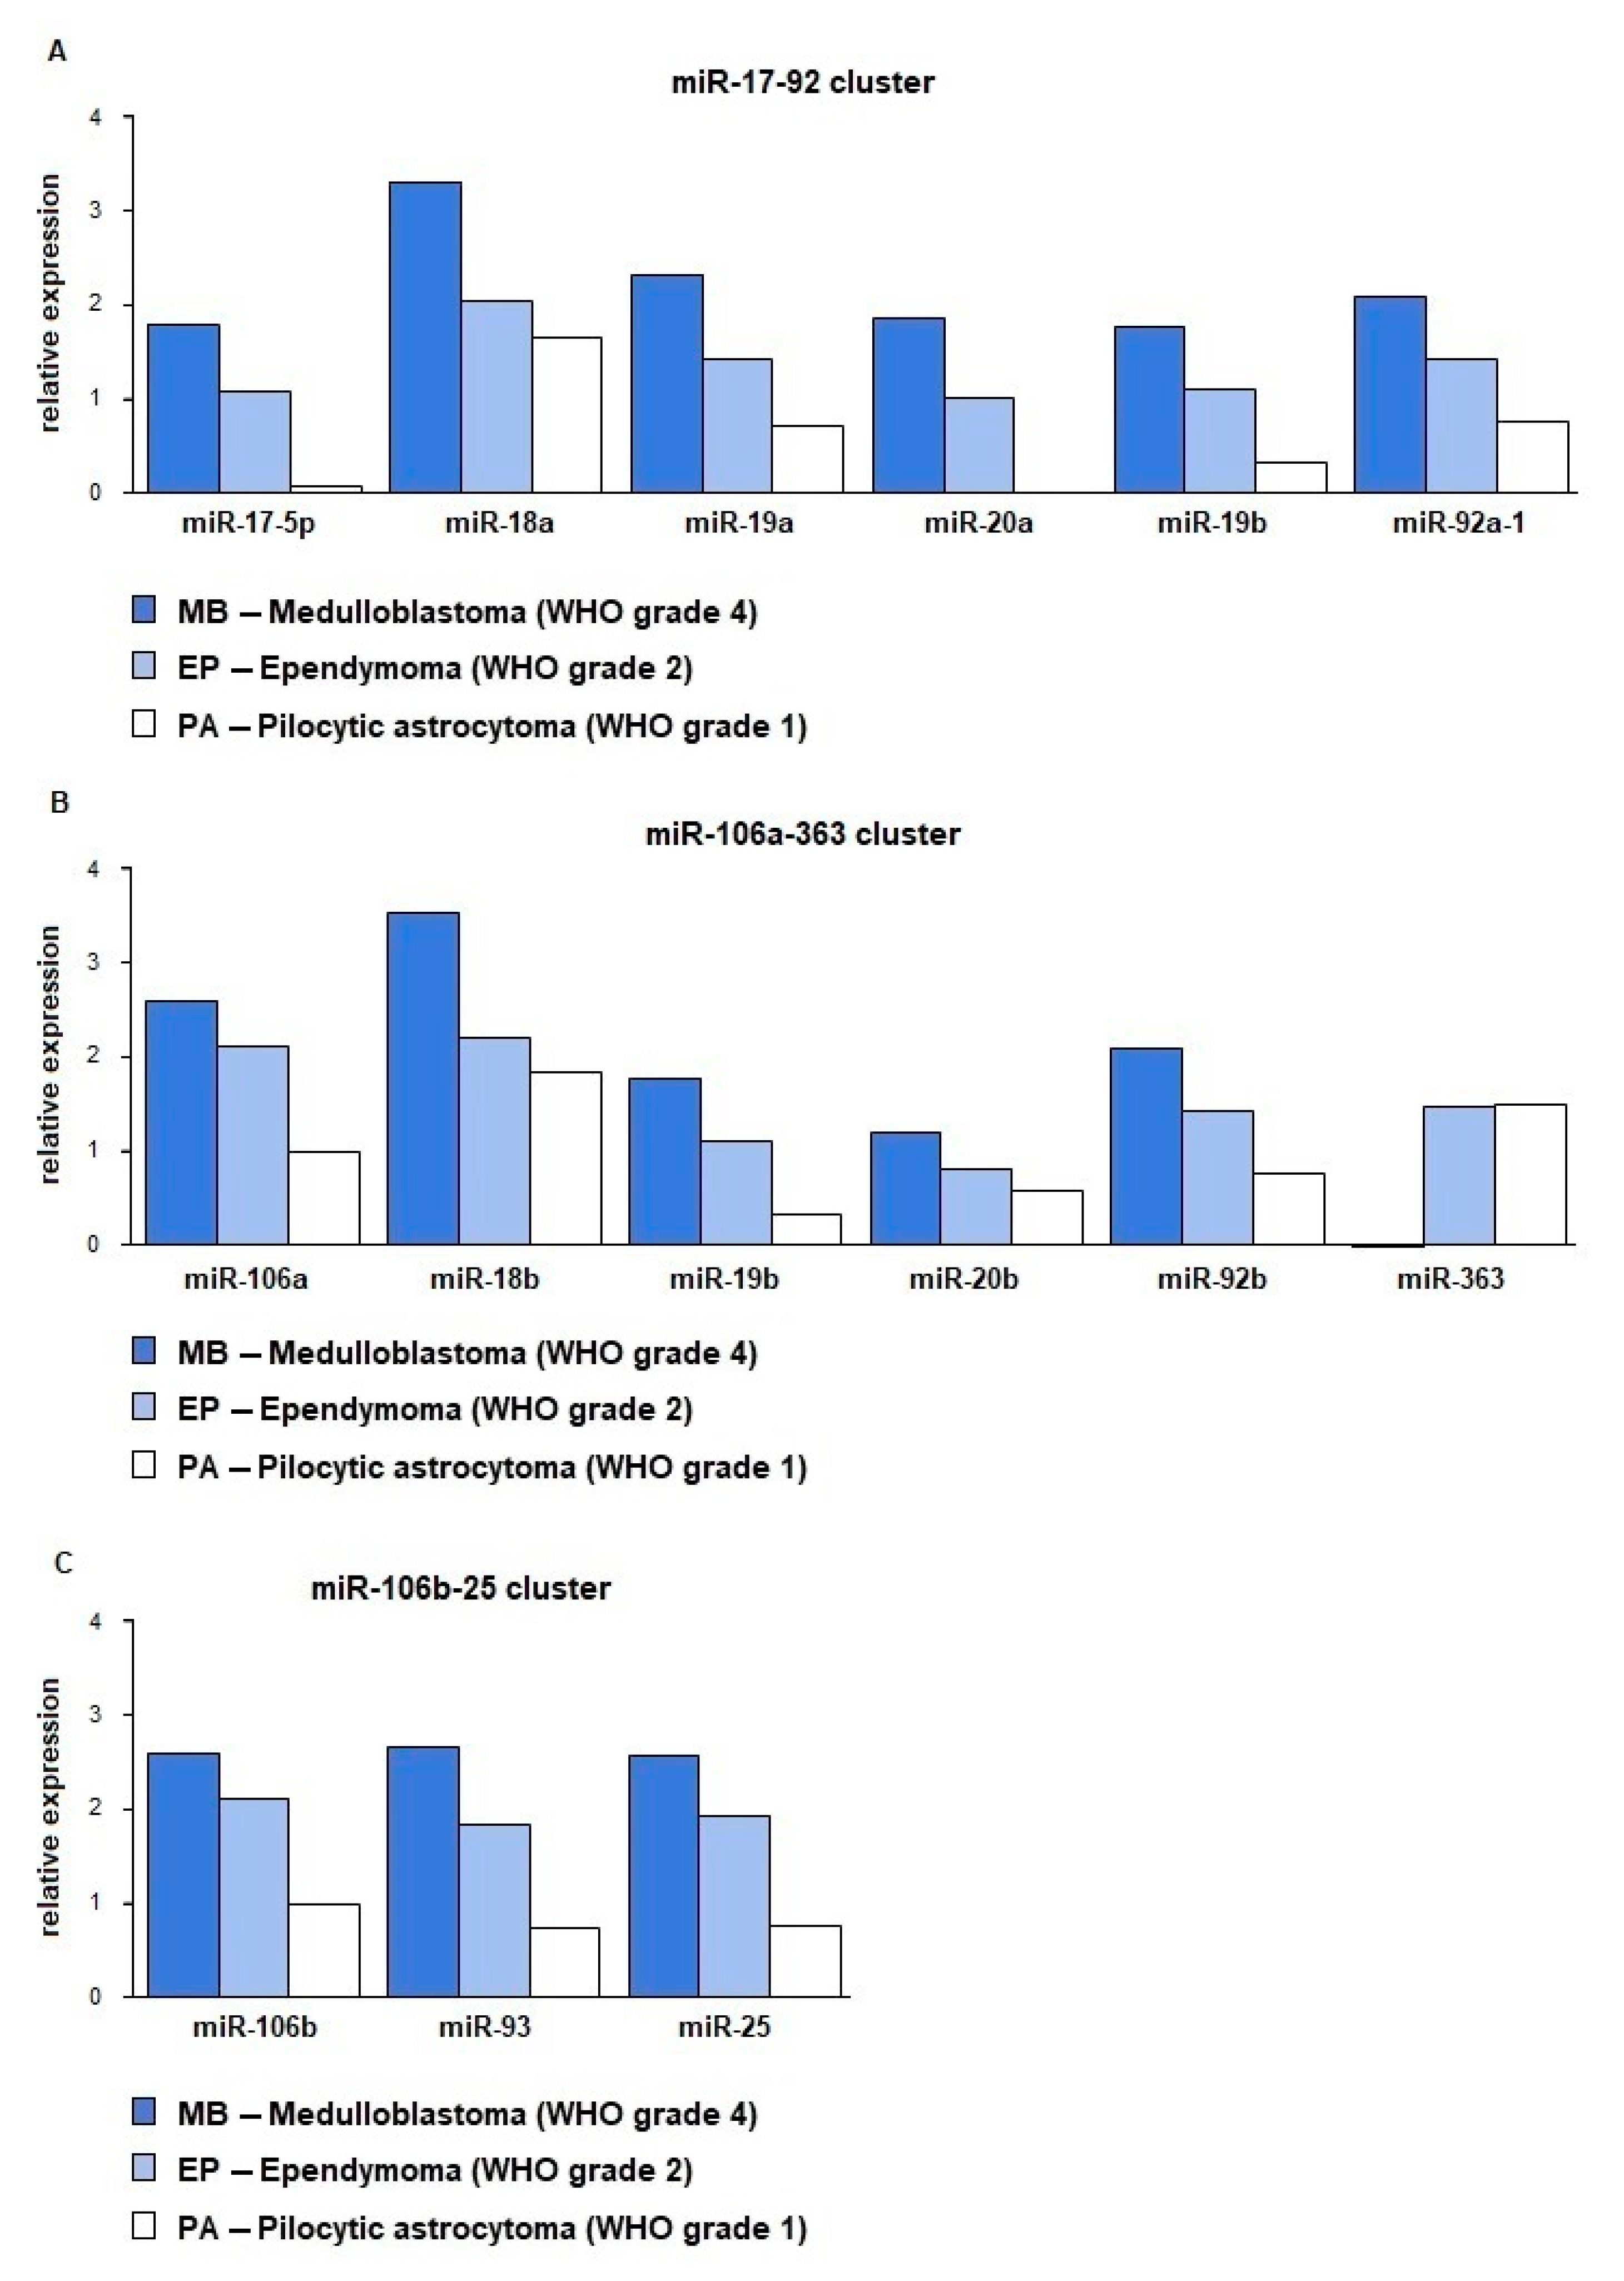
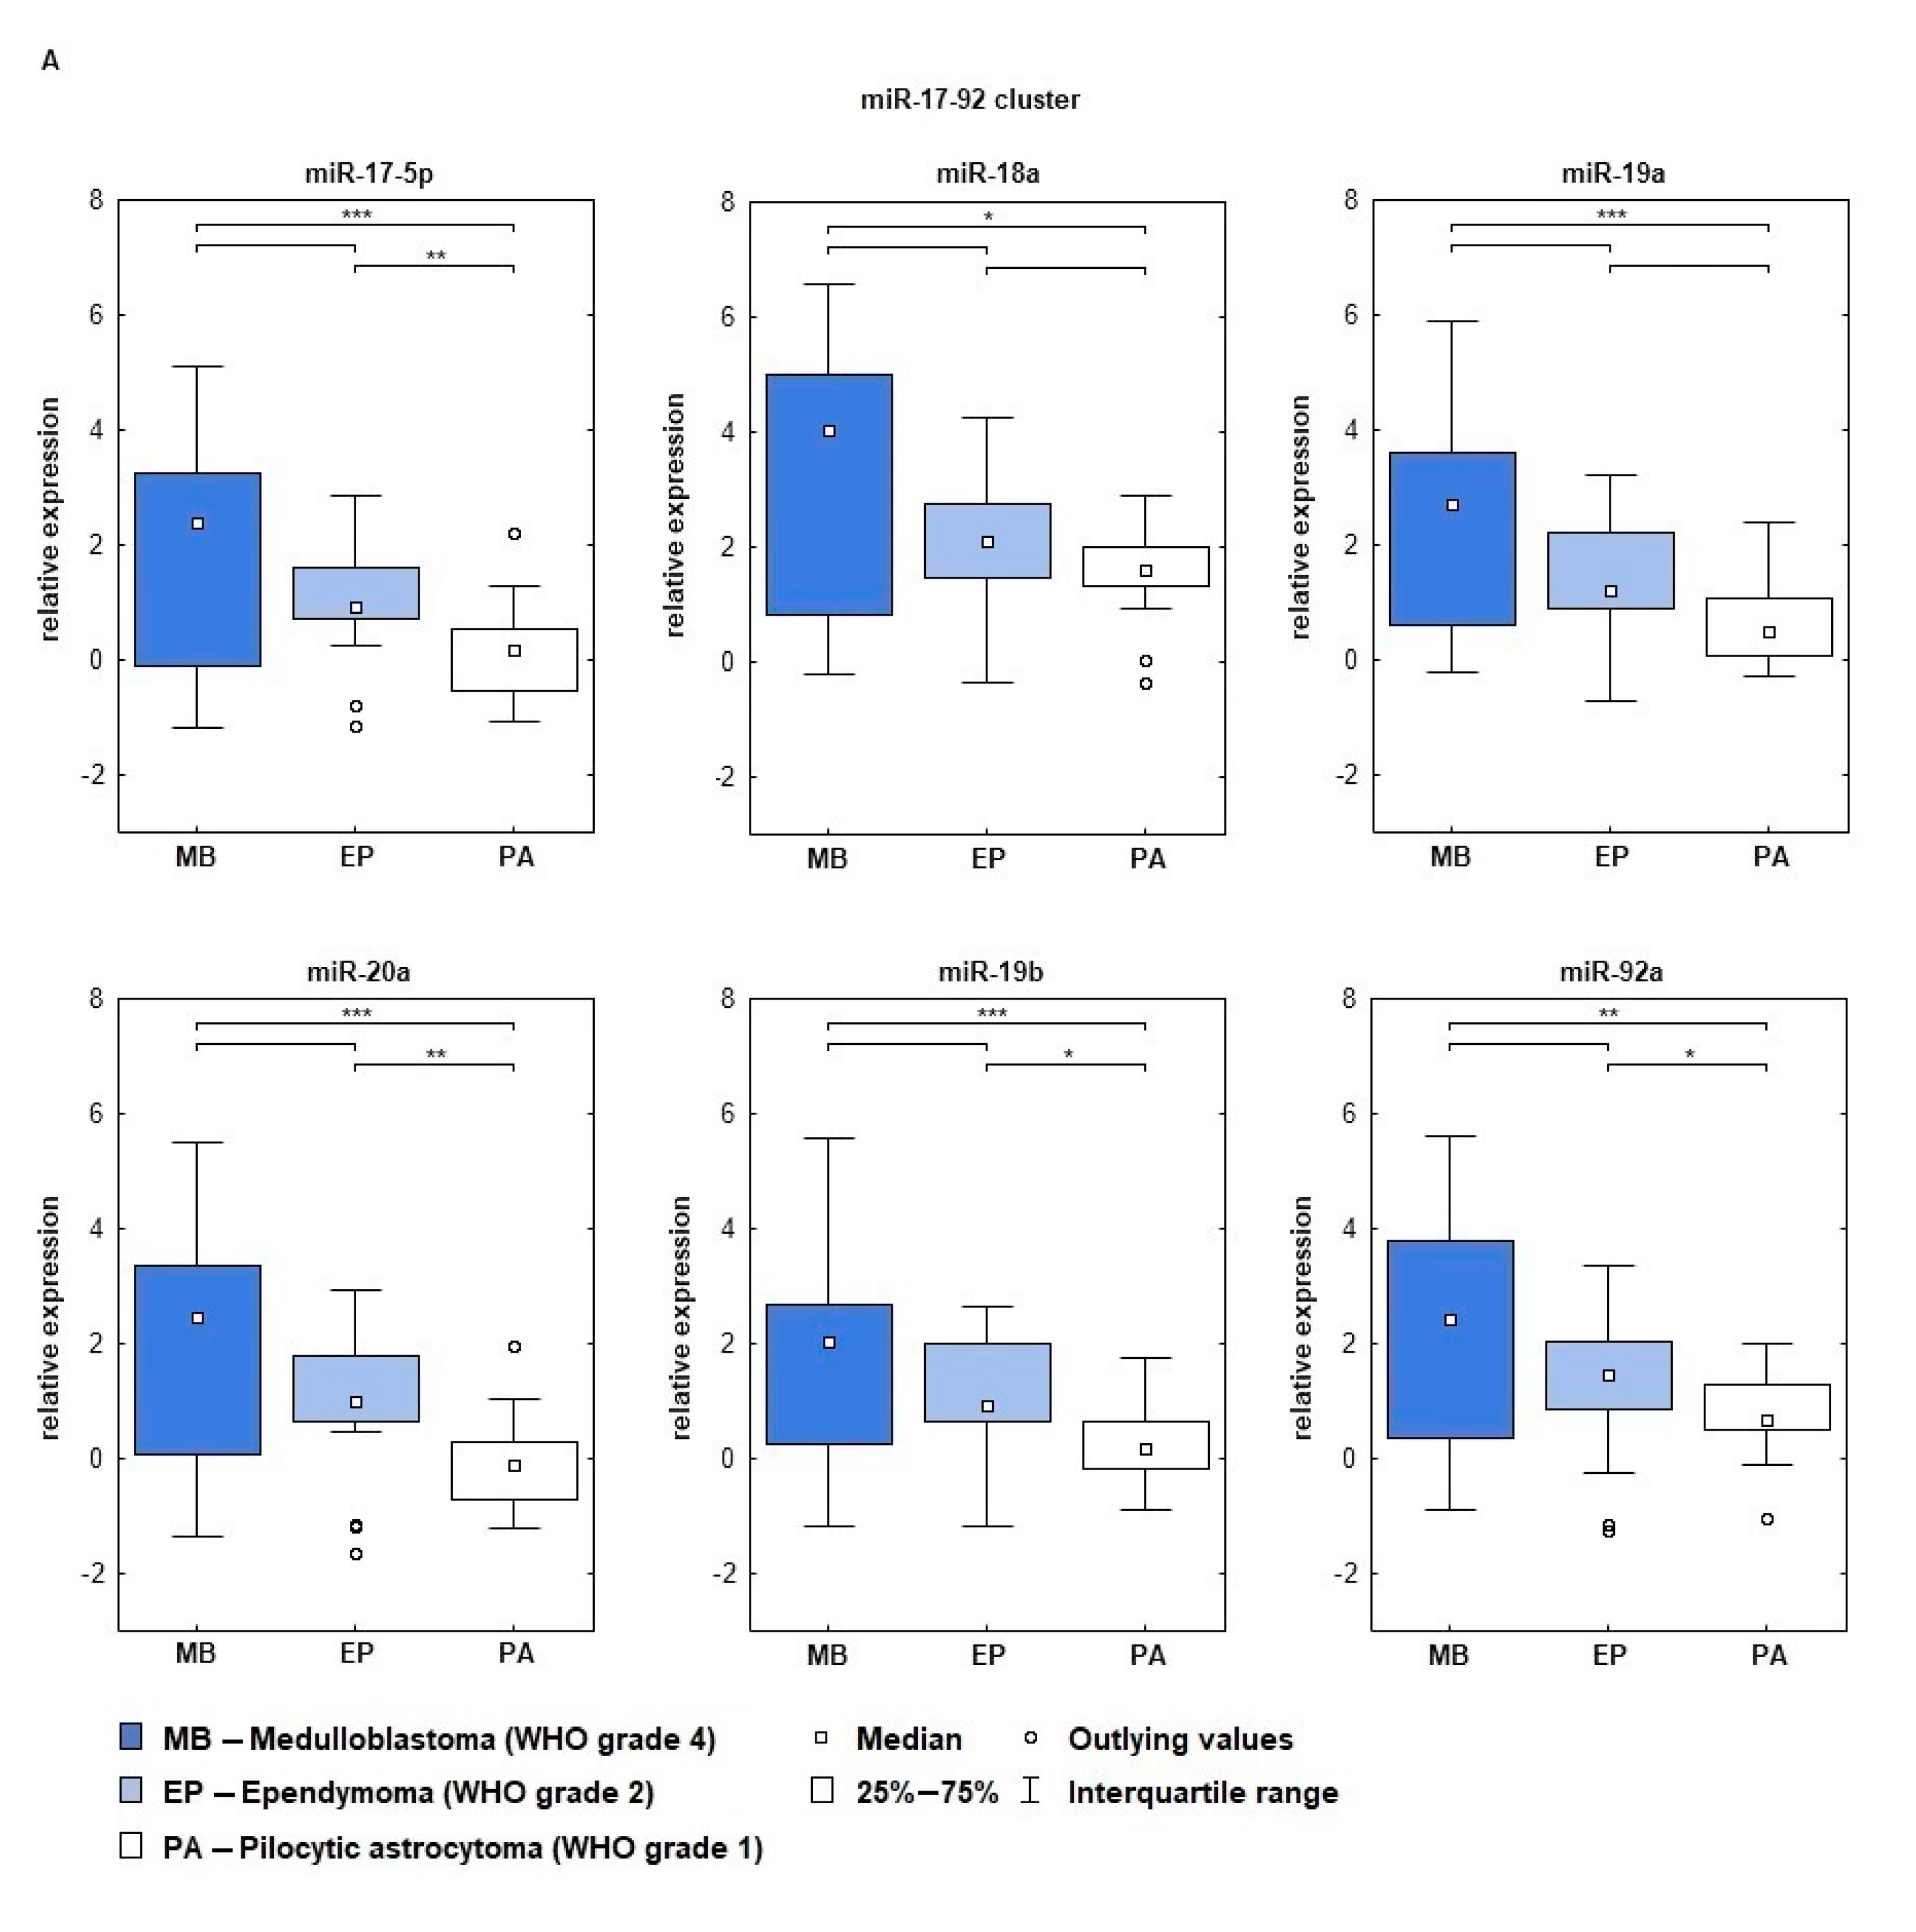
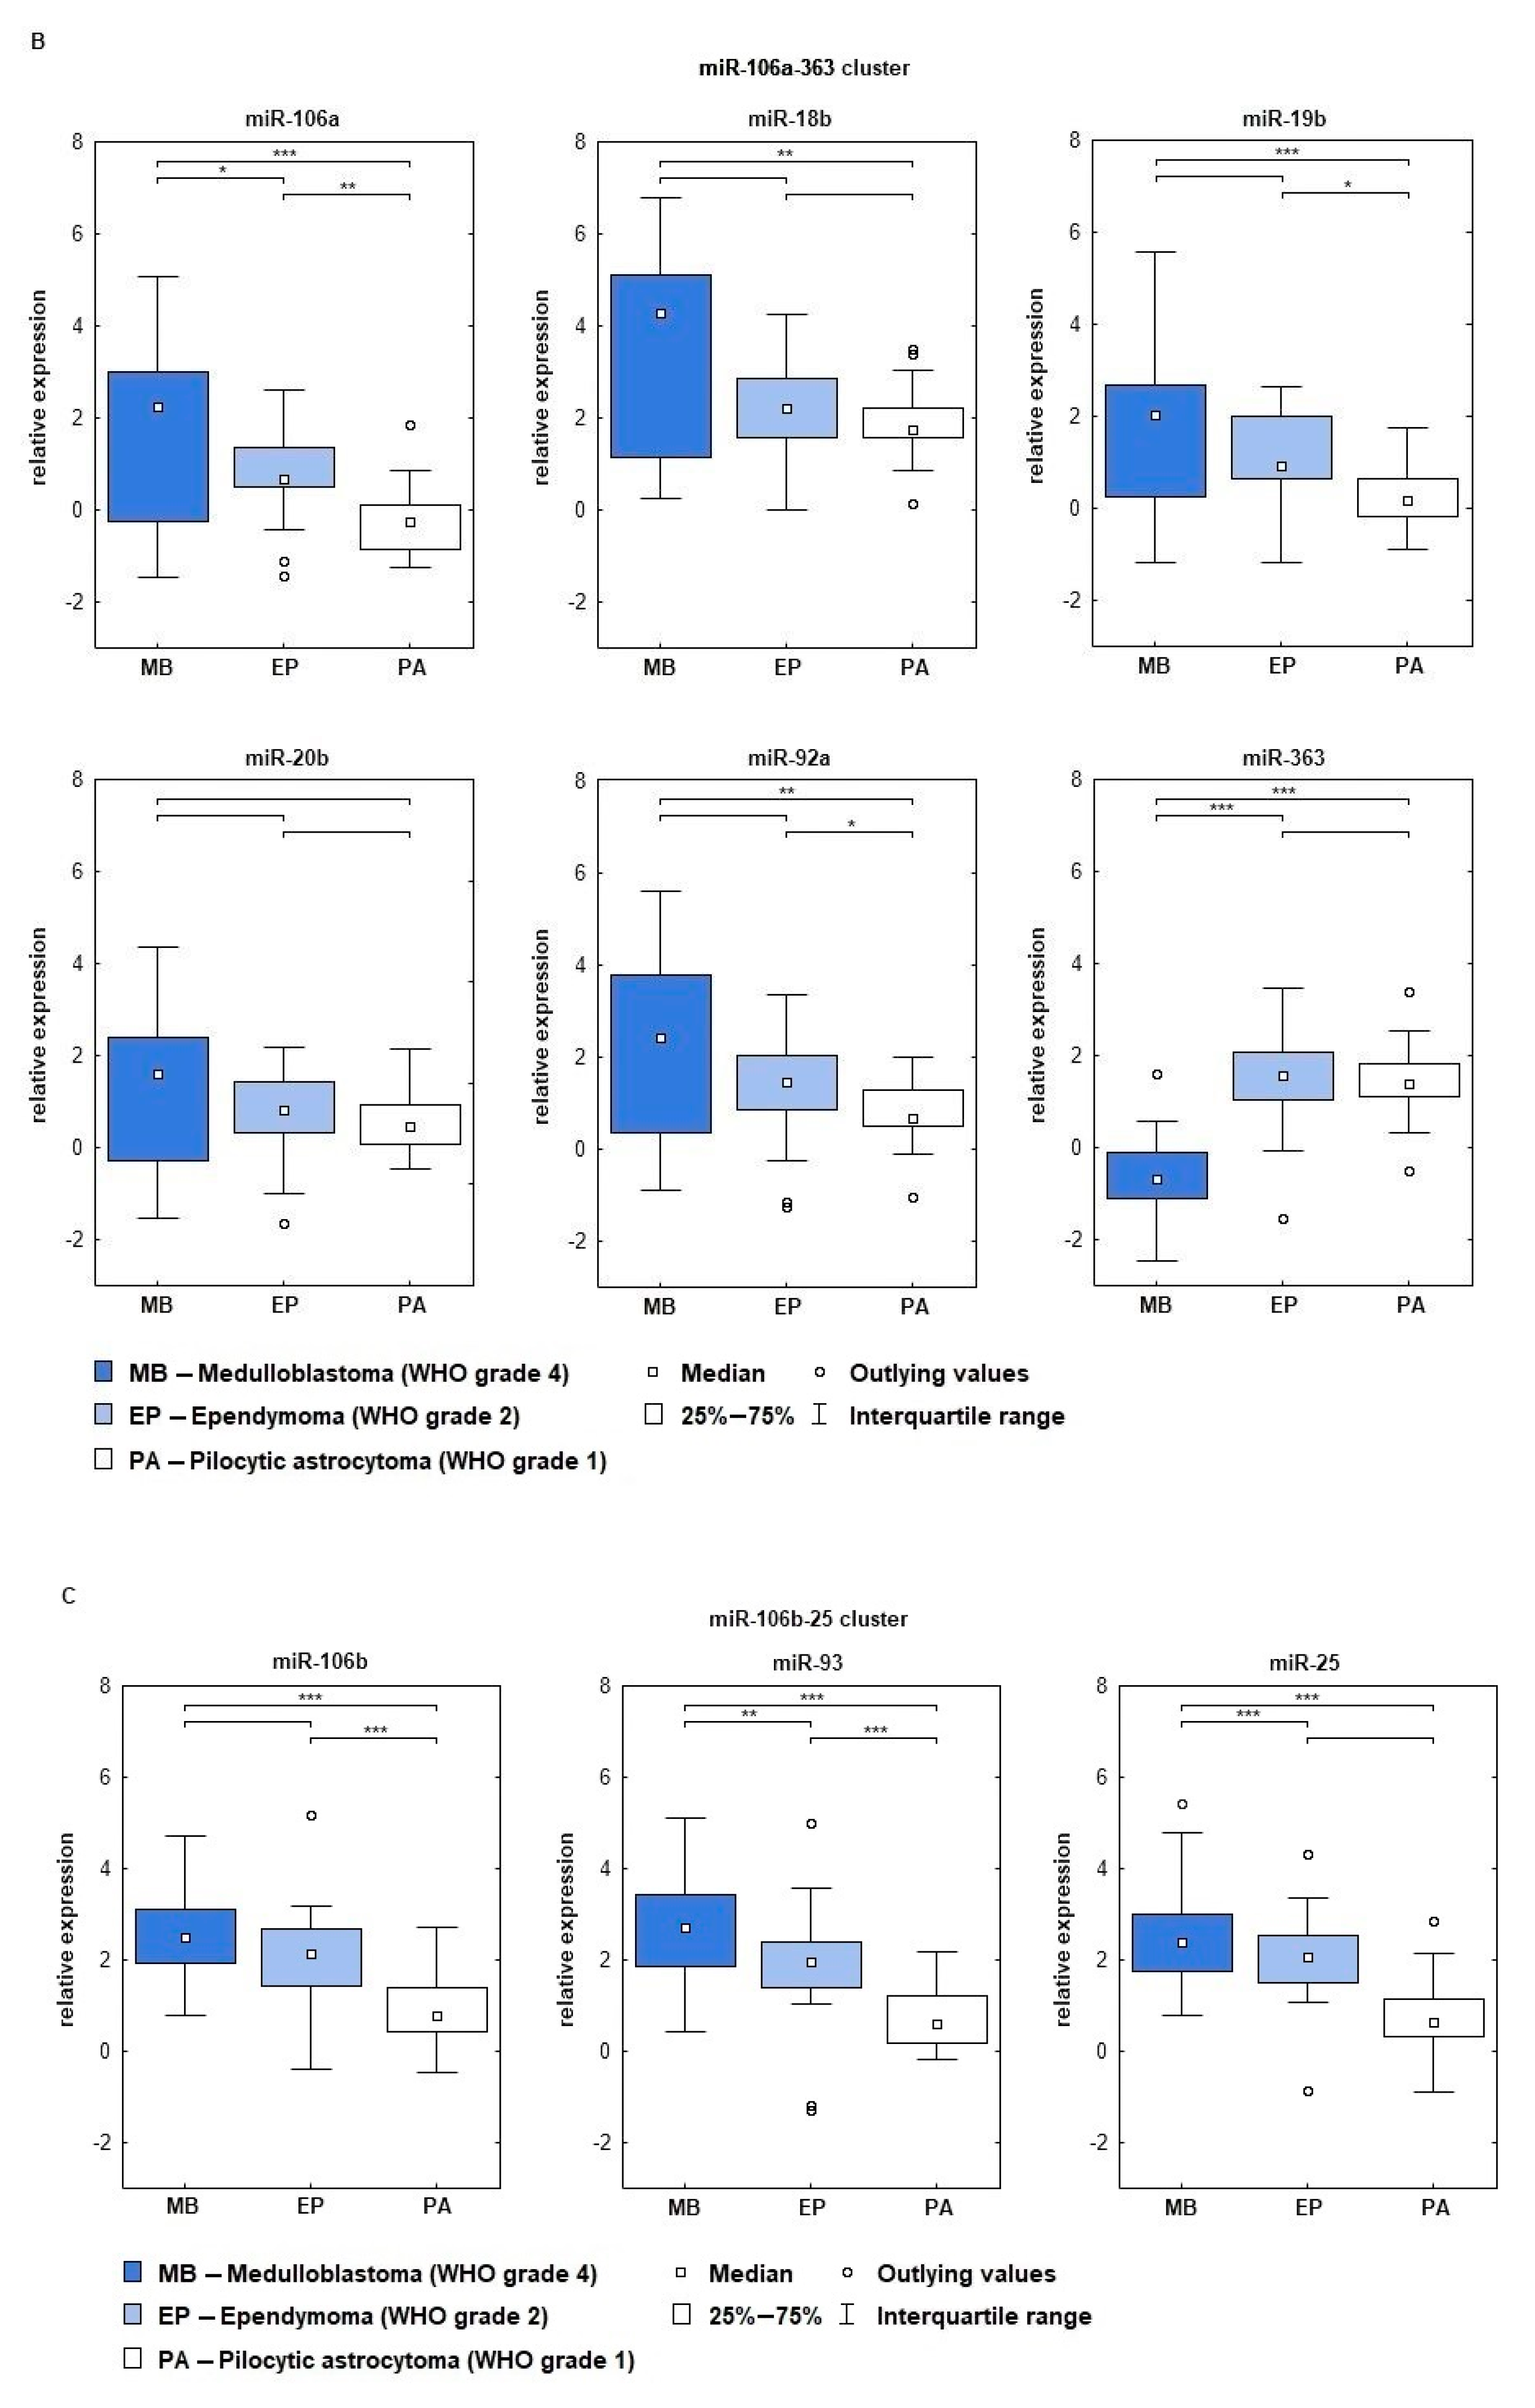
2.2. miRNA Expression Depends on Tumor’s Histopathology and WHO Grade

Almost all tested miRNAs from miR-17-95, miR-106b-25, and miR-106a-363 clusters showed overexpression in the analyzed cohort of pediatric brain tumors. It has been observed that there is a correlation between miRNA expression and the tumor’s grade. The highest miRNA expression was noted for medulloblastomas, next highest for ependymomas, and finally pilocytic astrocytomas. The highest expression level was confirmed for miR-18a (miR-17-92 cluster) and miR-18b (miR-106a-363 cluster). Double delta Ct of miR-18a was 3.28 for MBs, 2.04 for Eps, and 1.66 for Pas, accordingly. ddCt values noted for miR-18b were 3.54 for MB, 2.19 for Eps, and 1.85 for PAs. It should also be emphasized that miR-17-5p and miR-20-5p achieved very low expression values in pilocytic astrocytomas, ddCt was 0.08 for miR-17-5p, while for miR-20a-5p expression was below the internal control level (−0.11). The one exception was noted for miR-363, for which down-expression in the medulloblastomas (ddCt = −0.70) was showed, while in the ependymomas (ddCt = 1.47) and pilocytic astrocytomas (ddCt = 1.48) the expression was on a higher level. Comparison of miRNA expression levels from the miR-17-92, miR-106b-25, and miR-106a-363 clusters in the three tumor groups showed that the increase of miRNA expression was dependent on WHO grade and type (Figure 2 and Figure 3). Statistically significant differences in miRNA expression occurred between MBs and PAs, next between EPs and PAs, while the smallest differences were noted between MBs and EPs (Table 2).

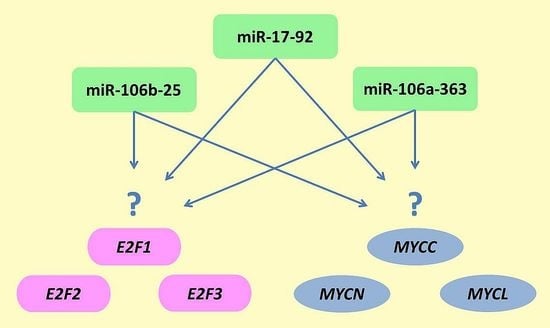
2.3. Relationship between Gene Expression of Genes from MYC and E2F Families and miRNAs

The analysis of correlation between genes from the MYC and E2F families (Table 3) showed a positive Pearson correlation coefficient in pilocytic astrocytomas, eight out of nine gene–gene pairs achieved statistical significance with r values ranging from 0.55 to 0.81. In the ependymoma group 6 out of nine gene–gene pairs reached the level of statistical significance, r value was in the range of 0.54 to 0.66. In medulloblastomas, only three pairs obtained statistical significance, r value from 0.38 to 0.51. There was no strong correlation between genes and miRNA expression (the correlation coefficient ranged from −0.61 to 0.38). Among the statistically significant results, the most interesting observations concerned the miR-106b-25 cluster. In ependymomas, gene expression negatively correlated with the expression of cluster members, e.g., miR-106b-MYCC r = −0.42, miR-106b-MYCN r = −0.61, miR-106b-E2F2 r = −0.51, miR-106b-E2F3 r = −0.58, miR-93-MYCN r = −0.47, miR-25-MYCN r = −0.47, miR-25-E2F2 r = −0.49, miR-25-E2F3 r = −0.52. The remaining statistically significant results include miR-363-E2F3 r = −0.42 in EPs, miR-92a-MYCC r = 0.38 in MBs, miR-92a-E2F1 r = −0.40 in MBs, and miR-18b-E2F1 r = −0.37 in MBs. No statistically significant results were obtained in pilocytic astrocytomas.
Strong correlations between miRNAs were reported due to the common origin of the miRNAs. The strongest correlation was found in medulloblastomas and ependymomas, while a lower value of the correlation coefficient was noted for pilocytic astrocytomas. Pearson correlation analyses were performed with a 95% confidence interval.

3. Discussion

The most important role of miRNA is advanced interactions between particular miRNA groups and genes with crucial cellular functions. One example of such interactions is the feedback loop between MYC/E2F and miR-17-92. Expression of the E2F1 gene is caused by MYC and also MYC expression is induced by E2F1, forming the positive feedback loop [19]. The expression level of E2F and MYC transcription factors determines further cell activity, including transcription of the members of the miR-17-92 cluster. In addition, MYCC and MYCN can initiate transcription by direct binding to the miR-17-92 promoter [20]. E2F1 expression is negatively regulated by two miRNAs from the cluster, miR-17-5p and miR-20a [6,21]. Additionally miR-20a modulates E2F2 and E2F3 translation [6].
Dysregulated expression of E2F and MYC families and miR-17-92 cluster are often found in the most types of cancers including lung [9,22], breast [23,24] and prostate tumors [25] or leukemia [26].
Here we present the results of the expression analysis performed for genes from the MYC (MYCC, MYCN, MYCL) and E2F (E2F1, E2F2, E2F3) families and miRNAs from miR-17-92, miR-106b-25 and miR-106a-363 clusters in three types of pediatric brain tumors showing different histology and grade: medulloblastoma (WHO grade 4), ependymoma (WHO grade 2) and pilocytic astrocytoma (WHO grade 1).
The E2F family consists of E2F1, E2F2, and E2F3 transcription factors, with defined activating function, and E2F4-8, with confirmed inhibiting functions. The first subgroup of E2F proteins are involved in the regulation of the cell cycle and have sufficient transcriptional activity to drive quiescent cells from G1 to S phase [27,28]. MYC family consists of three paralogs MYCC, MYCN, MYCL, which are characterized as known oncogenic factors [29,30].
High levels of E2F1 were described as factors associated with a cell cycle dysregulation. If E2F1 expression is low, the mammalian cell will remain at rest in the G1 phase. In turn, high expression of E2F1 leads to increased cell proliferation that may result in tumor formation and progression [5,31]. Our study confirmed that E2F1 mRNA levels were correlated with tumor grade and were increased in high grade lesions. Differences between the three analyzed groups revealed a statistically significant level of gene expression with p < 0.001 between medulloblastoma and pilocytic astrocytoma and p < 0.05 between medulloblastoma and ependymoma, and ependymoma and pilocytic astrocytoma. Upregulation of E2F1 has been reported in studies performed both on in vitro and in vivo brain tumor models, which described a significant increase in E2F1 expression levels and activity [32,33].
Oliver’s team in research performed on a mouse model of medulloblastoma showed that MYCN promotes cell cycle gene expression; increase of MYCN expression level was there reported with significantly increased levels of E2F1 (3.7-fold), and E2F2 (6.1-fold) [34]. Such observations are consistent with our results. Here we showed the highest expression level of E2F2, MYCN and E2F1 in each of the studied groups of tumors (Figure 1A). Swartling and colleagues in their study performed on a medulloblastoma mouse model showed that MYCN contributes to tumor initiation and progression. Tumor maintenance requires constant MYCN expression, while inhibition of its expression leads to aging of tumor cells [35]. Increase of MYCN expression has been reported in cancer with an aggressive course and poor prognosis, particularly that of neural origin, and also in neuroendocrine tumors [30] including medulloblastoma [36], while there is not much evidence linking MYCN to glial-derived tumors [37]. In our study, among the three types of tumors examined, the highest expression of MYCN was found in medulloblastomas, which confirms the observations made in the previous reports [38]. MYCN is a recognized biomarker in neuroblastomas, but little is known about the expression of MYCN in less aggressive brain tumors [39]. According to our best knowledge only one report relates to several cases of anaplastic ependymoma (WHO grade 3) [40].
Here we report that MYCN showed the highest level of expression in three study groups among the MYC family. Our work is based on the analysis of pediatric infratentorial brain tumors, and a high level of MYCN expression can be associated with the development of the cerebellum [37]. Additionally MYCC and MYCN proteins are mostly functionally interchangeable [41]. It is very possible that MYCN takes over the MYCC function. In our study, the MYCC mRNA level in all groups occurs at a similar level (without statistically significant differences between the groups), while MYCN is distinguished by a very high level of expression. High expression of MYCN in all groups studied suggests a dependency not on the grade of the tumor but even more on its location. This is consistent with the research presented by Korshunov et al. on pediatric infratentorial glioblastomas with high MYCN expression [42].
It was shown that MYCC and MYCN can bind to the promoter of miR-17-92 and initiate transcription [20,43]. Overexpression of miR-92, miR-106a, miR-17-5p, and miR-93 were associated with MYCN amplification [44], and in addition, E2F1 expression is negatively regulated by two miRNAs from the cluster, miR-17-5p and miR-20a [6,21,45]. Therefore we decided to examine the levels of expression of members of the miR-17-92 group and its two paralogs, miR-106a-363 and miR-106b-25. All components of the mir-17-92, mir-106a-363, and miR-106b-25 clusters showed overexpression relative to the control. Two molecules, miR-17-5p and miR-20a, were the most frequently studied and reported miRNAs of these clusters also in brain tumors [46,47]. Studies concerning the expression level of miRNAs in human gliomas have shown that expression of miR-17 and miR-20a were significantly higher than in control tissues. The molecules promoted proliferation and invasion and inhibited apoptosis in glioma cells and thus contributed to increasing malignancy of the tumors [48,49]. Our results showed that miR-17-5p and miR-20a achieved similar levels of expression relative to each other in the individual groups studied; when expression in the medulloblastoma group was high, in ependymoma the level was slightly lower, while in pilocytic astrocytoma these miRNAs reached very low overexpression level compared to the control. This was consistent with the literature reports that the level of expression positively correlates with the malignancy of the tumor [46,47,50]. Moreover miR-20a and miR-17-5p regulated E2F1 by binding in the 3′-UTR of its mRNA [21]. In our research miR-17-5p and miR-20a did not reach the highest expression among the miRNAs tested, nor did E2F1 from the E2F family of genes. This may indicate the involvement of these factors in mutual regulation. Yang et al. also showed that E2F1 is a direct target of miR-106a, and the level of miR-106a expression inversely correlates with the tumor grade [51]. In our study we showed that miR-106a expression correlates with the WHO grade, the highest expression level was confirmed in medulloblastoma and the lowest in pilocytic astrocytoma. Such results have also been reported for tumors of glial origin [52,53].
The highest level of expression in our study was noted for miR-18a and miR-18b. miR-18a is highly expressed in many types of cancer and cell lines, enhancing the tumorigenesis, malignancy, and metastatic potential [54,55,56]. In addition, miR-18a plasma concentration was significantly higher in preoperative samples than in postoperative samples in gastrointestinal cancers [55,57]. High expression of miR-18a has also been shown in glioblastoma tissue samples and cell lines. The increasing level of that miRNA was associated with cell proliferation and progression [58,59]. Similar results were obtained for miR-18b. miR-18b is one of the most significantly upregulated miRNAs in colorectal cancer, where miR-18b expression promoted cell proliferation, facilitating cell cycle progression [60]. In breast cancer, overexpression of miR-18b was noted in both clinical samples and cell lines, and upregulated miR-18b increased cell migration [61]. A relationship between miR-18b expression and grade of malignancy was demonstrated; in addition, an increase in miR-18b expression contributed to poor prognosis [60].
Our results demonstrate that miR-18a and miR-18b showed the highest level of expression among all miRNA molecules tested. However, until now there has been no other research on such a large scale covering all elements of the miR-17-92, miR-106b-25, and miR106a-363 clusters, especially in brain tumors in children, therefore it is difficult to answer whether this is a feature unique to this type of lesion. One thing is certain, that miR-18a and miR-18b are found to be high in pediatric brain tumors and that the decrease in expression is associated with lower grade.
miR-363 was the sole miRNA tested by us whose expression level was close to the level of control in medulloblastomas, whereas it was high in ependymomas and pilocytic astrocytomas. The literature concerning this issue is quite limited and concerns mainly glial tumors. Conti et al. in their study conducted on pilocytic astrocytomas (WHO grade 1), diffuse fibrillary astrocytomas (WHO grade 2), anaplastic astrocytomas (WHO grade 3), and glioblastomas (WHO grade 4) showed that miR-363 was upregulated in all the tumors and its level positively correlated with the grade of tested samples [62]. Here we showed that expression of miR-363 was higher in tumors of glial and ependymal rather than embryonal origin, and according to that our results could be confirmation for the observations presented by Conti et al.
The positive Pearson correlation coefficient between the expression of genes from the MYC and E2F families was observed in the group of pilocytic astrocytomas, then in ependymomas (Table 3), whereas in the medulloblastomas the least pairs gene–gene achieved the results on the level of statistical significance.
Correlation analysis of miRNA-gene pairs expression showed no strong interactions. Only for a few miRNA-gene pairs were the results statistically significant. Among them inverse correlations (r > −0.61) were noted in the ependymoma group for miR-106b-MYCC, miR-106b-MYCN, miR-106b-E2F2, miR-106b-E2F3, miR-93-MYCN, miR-25-MYCN, miR-25-E2F2, miR-25-E2F3, i.e., members of the miR-106b-25 cluster. The MYC and E2F gene families are involved in the regulation of the cell cycle and their expression levels could be disturbed during carcinogenesis. Moreover, members of the miR-17-92 cluster participate in the regulation of these genes [5,6]. An important feature of miRNA biology is that a single miRNA may be compatible with multiple regions of mRNA, thus regulating entire networks of proteins. Conversely, one mRNA can be targeted by several miRNAs [63]. It should be emphasized that tumorigenesis is a cascade of events, dysregulation of individual genes and miRNA-gene interactions, activation of signaling pathways, which are influenced by multiple factors including tumor type, location, stage, as well as age of the patient [64]. Thus, a gene can be regulated by many miRNAs (MYC is predicted to be targeted by 48 miRNAs, according to the database mirdb.org) and it can influence the regulation of other miRNAs by becoming part of a feedback loop. Some of the best characterized feedback loops involving MYC are MYC/PTEN/miR-106b, miR-93, miR-25, miR-19a, miR-22, miR-26a, miR-193b, miR-23b; MYC/RB1/miR-106a, miR-106b, and miR-17; MYC/VEGF/miR-106b, miR-106a, miR-93, miR-34a, miR-20a, miR-17, miR-16, miR-15a [65].
To summarize, we confirmed the largest statistically significant differences of miRNA expression between medulloblastomas and pilocytic astrocytomas, followed by ependymomas and pilocytic astrocytomas, while the smallest differences were noted between MBs and EPs. However, we expected the smallest differences between the least malignant tumors of common glial origin, i.e., PAs and EPs. The result may indicate that the levels of miRNA expression depend not only on the grade, but also on tumor type.
Our current research, which focused on the evaluation of miRNA expression from three clusters and related genes from MYC and E2F families in pediatric brain tumors, demonstrated that expression levels of members of the miR-17-92 cluster and its paralogs are upregulated in the analyzed cohort of cases and levels of their expression correlate with the WHO grade and histology. Members of the E2F family were overexpressed in all samples and the highest expression levels were confirmed for E2F2. Among the genes from the MYC family, the highest expression was observed for MYCN and it was also correlated with the WHO grade and type.
Such observation indicates the plausible therapeutic potential of miRNAs as critical targets in brain tumor therapy despite tumor type in the future.

4. Materials and Methods

4.1. Patients and Tissue Samples

In the analysis 90 samples of childhood brain tumors stabilized in RNA later and stored at −80 °C were included. Brain tumors comprised 30 pilocytic astrocytomas (WHO grade 1), 30 infratentorial ependymomas (WHO grade 2), and 30 medulloblastomas (WHO grade 4). All analyzed tumors were located infratentorially. The age of the patients ranged from 0 to 18 years. Control material constituted Human Brain Total RNA (Invitrogen, cat. No AM7962). The experiments were approved by the Bioethical Committee at the Medical University of Lodz (permit No: RNN/122/17/KE).

4.2. RNA Isolation and Reverse Transcription

Total RNA, including a fraction of small non-coding RNAs, was extracted according to the manufacturer’s instructions, using commercially available miRNeasy Mini Kit (Qiagen, Hilden, Germany). The quantity and purity of RNA were analyzed quantitatively and qualitative.

4.3. Reverse Transcription and Quantification of Gene Expression by qRT-PCR

cDNA dedicated for gene expression analysis was synthetized from 500 ng of total RNA of each sample by 5x HiFlex Buffer (miScript II RT Kit, Qiagen). The real-time quantitative PCR analysis was performed in duplicate using Fast Advanced Master Mix and specific TaqMan probes (Life Technologies, Carlsbad, CA, USA) for MYCC (Hs00153408_m1), MYCN (Hs00232074_m1), MYCL (Hs00420495_m1), E2F1 (Hs00153451_m1), E2F2 (Hs00231667_m1), E2F3 (Hs00605457_m1) genes and GAPDH used as the control housekeeping gene (Hs99999905_m1).
Normalized relative expression levels of the examined gene were calculated in the tested samples compared with control based on the sample’s average Ct value, according the formula in Equation (1):
ddCt = dCt(target sample) − dCt(control sample) = (Ctreftar-Ctgenetar) − (CTrefcont-Ctgenecont).

4.4. Reverse Transcription and Detection of miRNA Expression by qRT-PCR

To conduct miRNA expression analysis 750 ng of total RNA was reverse transcribed using a TaqMan MicroRNA Reverse Transcription kit and specific RT primers from TaqMan MicroRNA assays (Life Technologies, USA) for hsa-miR-17 (assay ID: 0023081), hsa-miR-20a (0005801), hsa-miR-106b (0004421), hsa-miR-93 (0010901), hsa-miR-20b (0010141), hsa-miR-106a (0021691), hsa-miR-18a (0024221), hsa-miR-18b (0022171), hsa-miR-19a (0003951), hsa-miR-19b (0003961), hsa-miR-92a (0004311), hsa-miR-25 (0004031), and hsa-miR-363 (0012711). Two sequences, U6 snRNA (0019731) and hsa-miR-9 (000583) were used as the internal control.
miRNA expression was performed using dedicated TaqMan probes, PCR primer set from TaqMan MicroRNA and Fast Advanced Master Mix (Life Technologies, USA). Reactions for each assay were performed in duplicate, the results were averaged to analyses. CFX96™ Touch Real-Time PCR Detection System was used for acquisition (Bio-Rad, Hercules, CA, USA).
Normalized relative expression levels of the miRNA in the tested samples vs. the control sample were calculated based on the mean Ct value of the sample, according to the formula in Equation (2):
ddCt = dCt(target sample) − dCt(a control sample) = (Ctreftar-CtmiRNAtar) − (CTrefcont-CTmiRNAcont).

4.5. Statistical Analysis

Statistica (v. 13.0) software was used for the statistical analysis of research results. Normality was checked using the Shapiro–Wilk test and the Lilliefors-corrected Kolmogorov–Smirnov. Comparisons of the different miRNA and gene expression levels between groups were performed using ANOVA coupled with Tukey’s post hoc test or the Kruskal–Wallis test, depending on the type of distribution. Spearman’s rank correlation was used to assess the correlations between miRNAs and gene expression.

Author Contributions

Conceptualization, R.G. and M.Z.; methodology, R.G., M.Z.; formal analysis, R.G.; investigation, R.G.; resources, K.Z., P.P.L., M.Z.; writing—original draft preparation, R.G.; writing—review and editing, M.Z., K.Z., P.P.L.; visualization, R.G., M.Z.; project administration, R.G.; funding acquisition, R.G. All authors have read and agreed to the published version of the manuscript.

Funding

This study was supported by National Science Centre grant number 2017/25/N/NZ4/01545 and Medical University of Lodz grant number 502-03/1-034-04/502-14-375-18.

Institutional Review Board Statement

The study was approved by the Bioethical Committee at the Medical University of Lodz, (approval number: RNN/122/17/KE, permission date 11 April 2017).

Informed Consent Statement

Informed consent was obtained from all subjects involved in the study.

Data Availability Statement

The datasets used and analyzed are available from the corresponding author on reasonable request.

Conflicts of Interest

The authors declare no conflict of interest.

Abbreviations

EPEpendymoma
MBMedulloblastoma
PAPilocytic astrocytoma

References

  1. Visani, M.; de Biase, D.; Marucci, G.; Cerasoli, S.; Nigrisoli, E.; Bacchi Reggiani, M.L.; Albani, F.; Baruzzi, A.; Pession, A. Expression of 19 microRNAs in glioblastoma and comparison with other brain neoplasia of grades I-III. Mol. Oncol. 2014, 8, 417–430. [Google Scholar] [CrossRef] [PubMed]
  2. Hayes, J.; Peruzzi, P.P.; Lawler, S. MicroRNAs in cancer: Biomarkers, functions and therapy. Trends Mol. Med. 2014, 20, 460–469. [Google Scholar] [CrossRef] [PubMed]
  3. Mendell, J.T. miRiad Roles for the miR-17-92 Cluster in Development and Disease. Cell 2008, 133, 217–222. [Google Scholar] [CrossRef] [Green Version]
  4. Tanzer, A.; Stadler, P.F. Molecular evolution of a microRNA cluster. J. Mol. Biol. 2004, 339, 327–335. [Google Scholar] [CrossRef] [PubMed]
  5. Aguda, B.D.; Kim, Y.; Piper-Hunter, M.G.; Friedman, A.; Marsh, C.B. MicroRNA regulation of a cancer network: Consequences of the feedback loops involving miR-17-92, E2F, and Myc. Proc. Natl. Acad. Sci. USA 2008, 105, 19678–19683. [Google Scholar] [CrossRef] [Green Version]
  6. Sylvestre, Y.; De Guire, V.; Querido, E.; Mukhopadhyay, U.K.; Bourdeau, V.; Major, F.; Ferbeyre, G.; Chartrand, P. An E2F/miR-20a Autoregulatory Feedback Loop. J. Biol. Chem. 2006, 282, 2135–2143. [Google Scholar] [CrossRef] [Green Version]
  7. Sengupta, D.; Govindaraj, V.; Kar, S. Alteration in microRNA-17-92 dynamics accounts for differential nature of cellular proliferation. FEBS Lett. 2018, 592, 446–458. [Google Scholar] [CrossRef]
  8. Wang, G.; Yang, Z. Stability and Hopf Bifurcation Analysis in a Delayed Myc/E2F/miR-17-92 Network Involving Interlinked Positive and Negative Feedback Loops. Discret. Dyn. Nat. Soc. 2018, 2018, 1–12. [Google Scholar] [CrossRef]
  9. Zhang, X.; Li, Y.; Qi, P.; Ma, Z. Biology of MiR-17-92 Cluster and Its Progress in Lung Cancer. Int. J. Med. Sci. 2018, 15, 1443–1448. [Google Scholar] [CrossRef] [Green Version]
  10. Moi, L.; Braaten, T.; Al-Shibli, K.; Lund, E.; Busund, L.-T.R. Differential expression of the miR-17-92 cluster and miR-17 family in breast cancer according to tumor type; results from the Norwegian Women and Cancer (NOWAC) study. J. Transl. Med. 2019, 17, 1–20. [Google Scholar] [CrossRef] [Green Version]
  11. Knudsen, K.N.; Nielsen, B.S.; Lindebjerg, J.; Hansen, T.F.; Holst, R.; Sørensen, F.B. microRNA-17 Is the Most Up-Regulated Member of the miR-17-92 Cluster during Early Colon Cancer Evolution. PLoS ONE 2015, 10, e0140503. [Google Scholar] [CrossRef]
  12. Tan, W.; Li, Y.; Lim, S.G.; Tan, T.M. miR-106b-25/miR-17-92 clusters: Polycistrons with oncogenic roles in hepatocellular carcinoma. World J. Gastroenterol. 2014, 20, 5962–5972. [Google Scholar] [CrossRef] [PubMed]
  13. Guo, J.; Miao, Y.; Xiao, B.; Huan, R.; Jiang, Z.; Meng, D.; Wang, Y. Differential expression of microRNA species in human gastric cancer versus non-tumorous tissues. J. Gastroenterol. Hepatol. 2009, 24, 652–657. [Google Scholar] [CrossRef]
  14. Wang, Q.; Li, Y.C.; Wang, J.; Kong, J.; Qi, Y.; Quigg, R.J.; Li, X. miR-17-92 cluster accelerates adipocyte differentiation by negatively regulating tumor-suppressor Rb2/p130. Proc. Natl. Acad. Sci. USA 2008, 105, 2889–2894. [Google Scholar] [CrossRef] [PubMed] [Green Version]
  15. Carraro, G.; El-Hashash, A.; Guidolin, D.; Tiozzo, C.; Turcatel, G.; Young, B.M.; De Langhe, S.P.; Bellusci, S.; Shi, W.; Parnigotto, P.P.; et al. miR-17 family of microRNAs controls FGF10-mediated embryonic lung epithelial branching morphogenesis through MAPK14 and STAT3 regulation of E-Cadherin distribution. Dev. Biol. 2009, 333, 238–250. [Google Scholar] [CrossRef] [PubMed] [Green Version]
  16. Suárez, Y.; Fernández-Hernando, C.; Yu, J.; Gerber, S.A.; Harrison, K.D.; Pober, J.S.; Iruela-Arispe, M.L.; Merkenschlager, M.; Sessa, W.C. Dicer-dependent endothelial microRNAs are necessary for postnatal angiogenesis. Proc. Natl. Acad. Sci. USA 2008, 105, 14082–14087. [Google Scholar] [CrossRef] [Green Version]
  17. Hong, L.; Lai, M.; Chen, M.; Xie, C.; Liao, R.; Kang, Y.J.; Xiao, C.; Hu, W.-Y.; Han, J.; Sun, P. The miR-17-92 Cluster of MicroRNAs Confers Tumorigenicity by Inhibiting Oncogene-Induced Senescence. Cancer Res. 2010, 70, 8547–8557. [Google Scholar] [CrossRef] [Green Version]
  18. Chen, J.; Huang, Z.-P.; Seok, H.Y.; Ding, J.; Kataoka, M.; Zhang, Z.; Hu, X.; Wang, G.; Lin, Z.; Wang, S.; et al. mir-17–92 Cluster Is Required for and Sufficient to Induce Cardiomyocyte Proliferation in Postnatal and Adult Hearts. Circ. Res. 2013, 112, 1557–1566. [Google Scholar] [CrossRef]
  19. Bracken, A.P.; Ciro, M.; Cocito, A.; Helin, K. E2F target genes: Unraveling the biology. Trends Biochem. Sci. 2004, 29, 409–417. [Google Scholar] [CrossRef]
  20. Mogilyansky, E.; Rigoutsos, I. The miR-17/92 cluster: A comprehensive update on its genomics, genetics, functions and increasingly important and numerous roles in health and disease. Cell Death Differ. 2013, 20, 1603–1614. [Google Scholar] [CrossRef]
  21. O’Donnell, K.A.; Wentzel, E.A.; Zeller, K.I.; Dang, C.V.; Mendell, J.T. c-Myc-regulated microRNAs modulate E2F1 expression. Nat. Cell Biol. 2005, 435, 839–843. [Google Scholar] [CrossRef] [PubMed]
  22. Matsubara, H.; Takeuchi, T.; Nishikawa, E.; Yanagisawa, K.; Hayashita, Y.; Ebi, H.; Yamada, H.; Suzuki, M.; Nagino, M.; Nimura, Y.; et al. Apoptosis induction by antisense oligonucleotides against miR-17-5p and miR-20a in lung cancers overexpressing miR-17-92. Oncogene 2007, 26, 6099–6105. [Google Scholar] [CrossRef] [PubMed] [Green Version]
  23. Pan, J.; Shen, J.; Si, W.; Du, C.; Chen, D.; Xu, L.; Yao, M.; Fu, P.; Fan, W. Resveratrol promotes MICA/B expression and natural killer cell lysis of breast cancer cells by suppressing c-Myc/miR-17 pathway. Oncotarget 2017, 8, 65743–65758. [Google Scholar] [CrossRef] [PubMed] [Green Version]
  24. Li, H.; Bian, C.; Liao, L.; Li, J.; Zhao, R.C. miR-17-5p promotes human breast cancer cell migration and invasion through suppression of HBP1. Breast Cancer Res. Treat. 2010, 126, 565–575. [Google Scholar] [CrossRef]
  25. Zhang, C.; Zhang, S.; Zhang, Z.; He, J.; Xu, Y.; Liu, S. ROCK has a crucial role in regulating prostate tumor growth through interaction with c-Myc. Oncogene 2013, 33, 5582–5591. [Google Scholar] [CrossRef] [Green Version]
  26. Venturini, L.; Battmer, K.; Castoldi, M.; Schultheis, B.; Hochhaus, A.; Muckenthaler, M.U.; Ganser, A.; Eder, M.; Scherr, M. Expression of the miR-17-92 polycistron in chronic myeloid leukemia (CML) CD34+ cells. Blood 2007, 109, 4399–4405. [Google Scholar] [CrossRef]
  27. Kent, L.N.; Leone, G. The broken cycle: E2F dysfunction in cancer. Nat. Rev. Cancer 2019, 19, 326–338. [Google Scholar] [CrossRef]
  28. Trimarchi, J.M.; Fairchild, B.; Wen, J.; Lees, J.A. The E2F6 transcription factor is a component of the mammalian Bmi1-containing polycomb complex. Proc. Natl. Acad. Sci. USA 2001, 98, 1519–1524. [Google Scholar] [CrossRef]
  29. Ruiz-Pérez, M.V.; Henley, A.B.; Arsenian-Henriksson, M. The MYCN Protein in Health and Disease. Genes 2017, 8, 113. [Google Scholar] [CrossRef]
  30. Beltran, H. The N-myc Oncogene: Maximizing its Targets, Regulation, and Therapeutic Potential. Mol. Cancer Res. 2014, 12, 815–822. [Google Scholar] [CrossRef] [Green Version]
  31. Yao, G.; Lee, T.J.; Mori, S.; Nevins, J.R.; You, L. A bistable Rb–E2F switch underlies the restriction point. Nat. Cell Biol. 2008, 10, 476–482. [Google Scholar] [CrossRef] [PubMed]
  32. Olson, M.V.; Johnson, D.G.; Jiang, H.; Xu, J.; Alonso, M.M.; Aldape, K.D.; Fuller, G.N.; Bekele, B.N.; Yung, W.K.A.; Gomez-Manzano, C.; et al. Transgenic E2F1 Expression in the Mouse Brain Induces a Human-Like Bimodal Pattern of Tumors. Cancer Res. 2007, 67, 4005–4009. [Google Scholar] [CrossRef] [PubMed] [Green Version]
  33. Dirks, P.B.; Rutka, J.T.; Hubbard, S.L.; Mondal, S.; Hamel, P.A. The E2F-family proteins induce distinct cell cycle regulatory factors in p16-arrested, U343 astrocytoma cells. Oncogene 1998, 17, 867–876. [Google Scholar] [CrossRef] [PubMed] [Green Version]
  34. Oliver, T.G.; Grasfeder, L.L.; Carroll, A.L.; Kaiser, C.; Gillingham, C.L.; Lin, S.M.; Wickramasinghe, R.; Scott, M.P.; Wechsler-Reya, R.J. Transcriptional profiling of the Sonic hedgehog response: A critical role for N-myc in proliferation of neuronal precursors. Proc. Natl. Acad. Sci. USA 2003, 100, 7331–7336. [Google Scholar] [CrossRef] [Green Version]
  35. Swartling, F.J.; Grimmer, M.R.; Hackett, C.S.; Northcott, P.A.; Fan, Q.-W.; Goldenberg, D.D.; Lau, J.; Masic, S.; Nguyen, K.; Yakovenko, S.; et al. Pleiotropic role for MYCN in medulloblastoma. Genes Dev. 2010, 24, 1059–1072. [Google Scholar] [CrossRef] [Green Version]
  36. Skowron, P.; Ramaswamy, V.; Taylor, M.D. Genetic and molecular alterations across medulloblastoma subgroups. J. Mol. Med. 2015, 93, 1075–1084. [Google Scholar] [CrossRef] [Green Version]
  37. Knoepfler, P.S.; Cheng, P.F.; Eisenman, R.N. N-myc is essential during neurogenesis for the rapid expansion of progenitor cell populations and the inhibition of neuronal differentiation. Genes Dev. 2002, 16, 2699–2712. [Google Scholar] [CrossRef] [Green Version]
  38. Pomeroy, S.L.; Tamayo, P.; Gaasenbeek, M.; Sturla, L.M.; Angelo, M.; McLaughlin, M.E.; Kim, J.Y.; Goumnerova, L.C.; Black, P.M.; Lau, C.; et al. Prediction of central nervous system embryonal tumour outcome based on gene expression. Nature 2002, 415, 436–442. [Google Scholar] [CrossRef]
  39. Higashi, M.; Sakai, K.; Fumino, S.; Aoi, S.; Furukawa, T.; Tajiri, T. The roles played by the MYCN, Trk, and ALK genes in neuroblastoma and neural development. Surg. Today 2019, 49, 721–727. [Google Scholar] [CrossRef]
  40. Swanson, A.A.; Raghunathan, A.; Jenkins, R.B.; Messing-Jünger, M.; Pietsch, T.; Clarke, M.J.; Kaufmann, T.J.; Giannini, C. Spinal Cord Ependymomas With MYCN Amplification Show Aggressive Clinical Behavior. J. Neuropathol. Exp. Neurol. 2019, 78, 791–797. [Google Scholar] [CrossRef]
  41. Malynn, B.A.; De Alboran, I.M.; O’Hagan, R.C.; Bronson, R.; Davidson, L.; Depinho, R.A.; Alt, F.W. N-myc can functionally replace c-myc in murine development, cellular growth, and differentiation. Genome Res. 2000, 14, 1390–1399. [Google Scholar]
  42. Korshunov, A.; Schrimpf, D.; Ryzhova, M.; Sturm, D.; Chavez, L.; Hovestadt, V.; Sharma, T.; Habel, A.; Burford, A.; Jones, C.; et al. H3-/IDH-wild type pediatric glioblastoma is comprised of molecularly and prognostically distinct subtypes with associated oncogenic drivers. Acta Neuropathol. 2017, 134, 507–516. [Google Scholar] [CrossRef] [PubMed]
  43. De Pontual, L.; Yao, E.; Callier, P.; Faivre, L.; Drouin, V.; Cariou, S.; Van Haeringen, A.; Geneviève, D.; Goldenberg, A.; Oufadem, M.; et al. Germline deletion of the miR-17∼92 cluster causes skeletal and growth defects in humans. Nat. Genet. 2011, 43, 1026–1030. [Google Scholar] [CrossRef] [PubMed] [Green Version]
  44. Schulte, J.H.; Horn, S.; Otto, T.; Samans, B.; Heukamp, L.C.; Eilers, U.-C.; Krause, M.; Astrahantseff, K.; Klein-Hitpass, L.; Buettner, R.; et al. MYCN regulates oncogenic MicroRNAs in neuroblastoma. Int. J. Cancer 2008, 122, 699–704. [Google Scholar] [CrossRef] [PubMed]
  45. Woods, K.; Thomson, J.M.; Hammond, S.M. Direct regulation of an oncogenic micro-RNA cluster by E2Ftranscription factors. J. Biol. Chem. 2007, 282, 2130–2134. [Google Scholar] [CrossRef] [PubMed] [Green Version]
  46. Costa, F.F.; Bischof, J.M.; Vanin, E.F.; Lulla, R.R.; Wang, M.; Sredni, S.T.; Rajaram, V.; Bonaldo, M.D.F.; Wang, D.; Goldman, S.; et al. Identification of MicroRNAs as Potential Prognostic Markers in Ependymoma. PLoS ONE 2011, 6, e25114. [Google Scholar] [CrossRef] [PubMed]
  47. Gruszka, R.; Zakrzewski, K.; Liberski, P.P.; Zakrzewska, M. microRNA interaction with MAPK and AKT pathways in paediatric brain tumours—Preliminary results and review of the literature. Folia Neuropathol. 2020, 58, 123–132. [Google Scholar] [CrossRef]
  48. Lu, S.; Wang, S.; Geng, S.; Ma, S.; Liang, Z.; Jiao, B. Increased Expression of microRNA-17 Predicts Poor Prognosis in Human Glioma. J. Biomed. Biotechnol. 2012, 2012, 1–6. [Google Scholar] [CrossRef] [Green Version]
  49. Liao, C.; Chen, W.; Wang, J. MicroRNA-20a Regulates Glioma Cell Proliferation, Invasion, and Apoptosis by Targeting CUGBP Elav-Like Family Member 2. World Neurosurg. 2019, 121, e519–e527. [Google Scholar] [CrossRef]
  50. Zakrzewska, M.; Fendler, W.; Zakrzewski, K.; Sikorska, B.; Grajkowska, W.; Dembowska-Bagińska, B.; Filipek, I.; Stefańczyk, Ł.; Liberski, P.P. Altered MicroRNA Expression Is Associated with Tumor Grade, Molecular Background and Outcome in Childhood Infratentorial Ependymoma. PLoS ONE 2016, 11, e0158464. [Google Scholar] [CrossRef]
  51. Yang, G.; Zhang, R.; Chen, X.; Mu, Y.; Ai, J.; Shi, C.; Liu, Y.; Shi, C.; Sun, L.; Rainov, N.G.; et al. MiR-106a inhibits glioma cell growth by targeting E2F1 independent of p53 status. J. Mol. Med. 2011, 89, 1037–1050. [Google Scholar] [CrossRef] [PubMed]
  52. Li, D.; Wang, Z.; Chen, Z.; Lin, L.; Wang, Y.; Sailike, D.; Luo, K.; Du, G.; Xiang, X.; Jiafu, G.D. MicroRNA-106a-5p facilitates human glioblastoma cell proliferation and invasion by targeting adenomatosis polyposis coli protein. Biochem. Biophys. Res. Commun. 2016, 481, 245–250. [Google Scholar] [CrossRef] [PubMed]
  53. Zhi, F.; Chen, X.; Wang, S.; Xia, X.; Shi, Y.; Guan, W.; Shao, N.; Qu, H.; Yang, C.; Zhang, Y.; et al. The use of hsa-miR-21, hsa-miR-181b and hsa-miR-106a as prognostic indicators of astrocytoma. Eur. J. Cancer. 2010, 46, 1640–1649. [Google Scholar] [CrossRef] [PubMed]
  54. Hsu, T.-I.; Hsu, C.-H.; Lee, K.-H.; Lin, J.-T.; Chen, C.-S.; Chang, K.-C.; Su, C.-Y.; Hsiao, M.; Lu, P.-J. MicroRNA-18a is elevated in prostate cancer and promotes tumorigenesis through suppressing STK4 in vitro and in vivo. Oncogenesis 2014, 3, e99. [Google Scholar] [CrossRef] [Green Version]
  55. Morimura, R.; Komatsu, S.; Ichikawa, D.; Takeshita, H.; Tsujiura, M.; Nagata, H.; Konishi, H.; Shiozaki, A.; Ikoma, H.; Okamoto, K.; et al. Novel diagnostic value of circulating miR-18a in plasma of patients with pancreatic cancer. Br. J. Cancer 2011, 105, 1733–1740. [Google Scholar] [CrossRef] [Green Version]
  56. Shen, Z.; Wu, X.; Wang, Z.; Li, B.; Zhu, X. Effect of miR-18a overexpression on the radiosensitivity of non-small cell lung cancer. Int. J. Clin. Exp. Pathol. 2015, 8, 643–648. [Google Scholar]
  57. Tsujiura, M.; Komatsu, S.; Ichikawa, D.; Shiozaki, A.; Konishi, H.; Takeshita, H.; Moriumura, R.; Nagata, H.; Kawaguchi, T.; Hirajima, S.; et al. Circulating miR-18a in plasma contributes to cancer detection and monitoring in patients with gastric cancer. Gastric Cancer 2014, 18, 271–279. [Google Scholar] [CrossRef] [Green Version]
  58. Zhou, J.; Wang, M.; Deng, D. c-Fos/microRNA-18a feedback loop modulates the tumor growth via HMBOX1 in human gliomas. Biomed. Pharmacother. 2018, 107, 1705–1711. [Google Scholar] [CrossRef]
  59. Song, Y.; Wang, P.; Zhao, W.; Yao, Y.; Liu, X.; Ma, J.; Xue, Y.; Liu, Y. MiR-18a regulates the proliferation, migration and invasion of human glioblastoma cell by targeting neogenin. Exp. Cell Res. 2014, 324, 54–64. [Google Scholar] [CrossRef]
  60. Li, Y.; Chen, M.; Liu, J.; Li, L.; Yang, X.; Zhao, J.; Wu, M.; Ye, M. Upregulation of MicroRNA 18b Contributes to the Development of Colorectal Cancer by Inhibiting CDKN2B. Mol. Cell. Biol. 2017, 37, e00391-17. [Google Scholar] [CrossRef] [Green Version]
  61. Fonseca-Sanchéz, M.A.; Pérez-Plasencia, C.; Fernández-Retana, J.; Arechaga-Ocampo, E.; Marchat, L.A.; Rodríguez-Cuevas, S.; Bautista-Piña, V.; Arellano-Anaya, Z.E.; Flores-Pérez, A.; Diaz-Chávez, J.; et al. microRNA-18b is upregulated in breast cancer and modulates genes involved in cell migration. Oncol. Rep. 2013, 30, 2399–2410. [Google Scholar] [CrossRef] [PubMed] [Green Version]
  62. Conti, A.; Romeo, S.G.; Cama, A.; La Torre, D.; Barresi, V.; Pezzino, G.; Tomasello, C.; Cardali, S.; Angileri, F.F.; Polito, F.; et al. MiRNA expression profiling in human gliomas: Upregulated miR-363 increases cell survival and proliferation. Tumor Biol. 2016, 37, 14035–14048. [Google Scholar] [CrossRef] [PubMed]
  63. Lim, L.P.; Lau, N.C.; Garrett-Engele, P.; Grimson, A.; Schelter, J.M.; Castle, J.; Bartel, D.P.; Linsley, P.S.; Johnson, J.M. Microarray analysis shows that some microRNAs downregulate large numbers of target mRNAs. Nature 2005, 433, 769–773. [Google Scholar] [CrossRef] [PubMed]
  64. Mazurek, M.; Grochowski, C.; Litak, J.; Osuchowska, I.; Maciejewski, R.; Kamieniak, P. Recent Trends of microRNA Significance in Pediatric Population Glioblastoma and Current Knowledge of Micro RNA Function in Glioblastoma Multiforme. Int. J. Mol. Sci. 2020, 21, 3046. [Google Scholar] [CrossRef]
  65. El Baroudi, M.; Corà, D.; Bosia, C.; Osella, M.; Caselle, M. A Curated Database of miRNA Mediated Feed-Forward Loops Involving MYC as Master Regulator. PLoS ONE 2011, 6, e14742. [Google Scholar] [CrossRef]
Figure 1. Expression of genes from the MYC and E2F families in three groups of pediatric brain tumors: medulloblastomas, ependymomas, and pilocytic astrocytomas. (A) Relative expression of MYCC, MYCN, MYCL, E2F1, F2F2, and E2F3 genes given in ddCt values. (B) Relative expression of MYCC, MYCN, MYCL, E2F1, F2F2, and E2F3 with an indication of the differences in expression between the groups studied; * p < 0.05, *** p < 0.001.
Ijms 22 00543 g001
Figure 2. Relative expression level of members of three paralogical clusters in medulloblastoma, ependymoma, and pilocytic astrocytoma. (A) miR-17-92 cluster; (B) miR-106a-363 cluster; (C) miR-106b-25 cluster. Relative expression is given in ddCt value.
Ijms 22 00543 g002
Figure 3. Relative expression of miRNAs from miR-17-92, miR-106a-363, and miR-106b-25 clusters in the analyzed groups of pediatric brain tumors. Relative expression is given in ddCt values. (A) miR-17-92 cluster; (B) miR-106a-363 cluster; (C) miR-106b-25 cluster; * p < 0.05, ** p < 0.01, *** p < 0.001.
Ijms 22 00543 g003aIjms 22 00543 g003b
Table 1. p values determining the level of statistical significance in gene expression from MYC and E2F families between the analyzed groups. If p value is less than 0.05 we report the result as statistically significant (indicated in bold). MB, medulloblastoma; EP, ependymoma; PA, pilocytic astrocytoma.
GeneMB vs. PAMB vs. EPEP vs. PA
MYCC0.7880190.4714200.164877
MYCN0.0124570.3750580.535525
MYCL0.0116740.0001090.044045
E2F10.0000000.0135210.014328
E2F20.0000000.0000231.000000
E2F30.1321150.0109071.000000
Table 2. p values determining the level of statistical significance in the expression of miRNAs from the miR-17-92, miR-106a-363, and miR-106b-25 clusters between the groups. If p value is less than 0.05 we report the result as statistically significant (indicated in bold). MB, medulloblastoma; EP, ependymoma; PA, pilocytic astrocytoma.
miRNAMB vs. PAMB vs. EPEP vs. PA
17-92miR-17-5p0.0000,661.0000,000.0018,81
miR-18a0.0112,560.2688,290.6894,59
miR-19a0.0002,080.2688,290.6894,59
miR-20a0.0000,100.7671,390.0013,14
miR-19b0.0001,280.0765,680.0343,83
miR-920.0030,201.0000,000.0288,40
106b-25miR-106b0.0001,070.1327,580.0001,70
miR-930.0001,070.0076,120.0003,19
miR-250.0001,070.0526,610.0002,33
106a-363miR-106a0.0001,070.0372,520.0042,90
miR-18b0.0083,770.1771,930.8113,97
miR-19b-2 A0.0001,280.0765,680.0343,83
miR-20b0.0837,450.3829,150.6841,70
miR-92-2 B0.0030,201.0000,000.0288,40
miR-3630.0000,000.0000,001.0000,00
A miR-19b-2 sequential compliance with miR-19b, B miR-92-2 sequential compliance with miR-92.
Table 3. Pearson correlation coefficients between members of the MYC and E2F families in three analyzed groups. If p value is less than 0.05 we report the result as statistically significant (indicated in bold). MB, medulloblastoma; EP, ependymoma; PA, pilocytic astrocytoma.
Gene–GeneMBEPPA
MYCC-E2F1−0.210.550.75
MYCC-E2F2−0.130.300.61
MYCC-E2F30.190.540.72
MYCN-E2F10.400.660.81
MYCN-E2F20.510.600.79
MYCN-E2F3−0.210.550.79
MYCL-E2F10.210.250.37
MYCL-E2F20.380.290.55
MYCL-E2F3−0.220.620.60
Publisher’s Note: MDPI stays neutral with regard to jurisdictional claims in published maps and institutional affiliations.

