Article

Role of HMOX1 Promoter Genetic Variants in Chemoresistance and Chemotherapy Induced Neutropenia in Children with Acute Lymphoblastic Leukemia

by
Karolina Bukowska-Strakova
1,*,
Joanna Włodek
1,
Ewelina Pitera
1,
Magdalena Kozakowska
2,
Anna Konturek-Cieśla
2,
Maciej Cieśla
2,
Monika Gońka
2,
Witold Nowak
2,
Aleksandra Wieczorek
3,
Katarzyna Pawińska-Wąsikowska
3,
Alicja Józkowicz
2,* and
Maciej Siedlar
1,*
1
Department of Clinical Immunology, Institute of Pediatrics, Jagiellonian University Medical College, 31-663 Kraków, Poland
2
Department of Medical Biotechnology, Faculty of Biochemistry, Biophysics and Biotechnology, Jagiellonian University, 31-007 Kraków, Poland
3
Pediatric, Oncology and Hematology Department, Institute of Pediatrics, Jagiellonian University Medical College, 30-387 Krakow, Poland
*
Authors to whom correspondence should be addressed.
Int. J. Mol. Sci. 2021, 22(3), 988; https://0-doi-org.brum.beds.ac.uk/10.3390/ijms22030988
Submission received: 30 December 2020 / Accepted: 15 January 2021 / Published: 20 January 2021
(This article belongs to the Special Issue Heme- and Hemoglobin Stress in Human Diseases)

Abstract

:
Whilst the survival rates of childhood acute lymphoblastic leukemia (ALL) have increased remarkably over the last decades, the therapy resistance and toxicity are still the major causes of treatment failure. It was shown that overexpression of heme oxygenase-1 (HO-1) promotes proliferation and chemoresistance of cancer cells. In humans, the HO-1 gene (HMOX1) expression is modulated by two polymorphisms in the promoter region: (GT)n-length polymorphism and single-nucleotide polymorphism (SNP) A(−413)T, with short GT repeat sequences and 413-A variants linked to an increased HO-1 inducibility. We found that the short alleles are significantly more frequent in ALL patients in comparison to the control group, and that their presence may be associated with a higher risk of treatment failure, reflecting the role of HO-1 in chemoresistance. We also observed that the presence of short alleles may predispose to develop chemotherapy-induced neutropenia. In case of SNP, the 413-T variant co-segregated with short or long alleles, while 413-A almost selectively co-segregated with long alleles, hence it is not possible to determine if SNPs are actually of phenotypic significance. Our results suggest that HO-1 can be a potential target to overcome the treatment failure in ALL patients.

1. Introduction

Acute lymphoblastic leukemia (ALL) is one of the most common hematological neoplasms that affects the entire lifespan of both infants and adults, with significant prevalence between the ages of 2 and 6 years. Among children, more than 80% cases of ALL are B-cell precursor ALL (BCP-ALL) [1]. Prognosis and outcome in ALL depend on several factors including: age, genetic aberrations and gene expression profile, prednisone response, leukemia characteristics and last but not least—an initial leukemic cells responsiveness to the induction therapy, defined as minimal residual disease (MRD), that is the strongest independent risk factor for relapse in childhood ALL [1,2,3]. Since MRD is a measurement of drug resistance in vivo and reflects multiple cellular, host, and treatment variables, it has been therefore used for refining initial treatment stratification to the risk categories (standard (SR), intermediate (IR), and high risk (HR)), allowing to tailor the intensity of chemotherapy for the individual patient [4]. Although survival rates of childhood BCP-ALL have increased remarkably, reaching up to 90% in developed countries [5,6], therapy resistance and toxicity are still the most important barriers to survival, associated with high morbidity and mortality [7,8,9,10]. Among them, neutropenia (chemotherapy-induced neutropenia—CIN) [11] results in a high risk of life-threatening infections and therefore is the primary cause of dose reductions and dose delays during chemotherapy [12]. For the treatment and prophylaxis of CIN, human recombinant G-CSF (granulocyte colony stimulating factor) is recommended [13,14]. To guide more efficient and cost-effective applications of the G-CSF, a number of studies have attempted to define the precise risk factors for CIN [15]. Although the frequency of CIN is related to some non-genetic variables, including chemotherapy scheme, cancer type and such patient-specific factors as age, presence of concomitant diseases and general health status [16,17], little is known about the genetic factors affecting susceptibility to chemotherapy-induced myelosuppression [18,19].
Some chemotherapeutic agents that might be used for ALL treatment (such as doxorubicin, vinblastine or camptothecin) [20] increase the level of oxidative stress, as their antitumor activity depends directly on H2O2-induced apoptosis [21,22,23,24,25]. One of the critical cytoprotective proteins induced in response to oxidative stress is heme oxygenase-1 (HO-1, encoded by HMOX1 gene localized on chromosome 22q12) [26,27,28,29,30]. HO-1 is a heme-degrading enzyme yielding ferrous iron, biliverdin and carbon monoxide. It exerts antioxidative and antiapoptotic effects in response to various cellular stressors [31]. In carcinogenesis, HO-1 has an ambiguous role [32,33,34]. Even though it is essential for preventing carcinogenesis in healthy cells through maintaining redox homeostasis [35], under the ongoing process of tumorigenesis, its activation becomes deleterious for patients, since its antioxidant, antiapoptotic, and anti-inflammatory properties promote proliferation and invasiveness of malignant cells, leading ultimately to protection of neoplastic cells from apoptosis [36], which was also observed in AML [29]. Furthermore, HO-1 regulates proliferation and differentiation of many cell types [37,38,39,40,41,42,43,44], and recently we have demonstrated that it also affects granulocytic development through influencing myelocyte proliferation [45], suggesting its potential role in regulating granulopoiesis under stress-induced conditions, such as chemotherapy.
In human, the level of inducible HO-1 response is controlled by polymorphisms in the gene promoter region [46]. Based on the (GT)n microsatellite length polymorphism, the HMOX1 promoter can be classified into three categories: short, medium and long [47]) and based on the various promoter lengths, six genotypes are derived: short/short (SS), medium/short (MS), medium/medium (MM), long/short (LS), long/medium (LM), and long/long (LL) [48], affecting both basal and induced levels of HO-1 expression [49]. Since the long (GT)n sequence has the potential to acquire thermodynamically unfavorable Z-DNA conformation [46], therefore, short alleles were shown to be associated with increased transcriptional activity, higher inducibility and enhanced HO-1 enzymatic activity in numerous biological and clinical studies [46,47,49,50,51,52,53,54,55]. Interestingly, it was also demonstrated in lymphoblastoid cell lines that the cells with short (GT)n repeats exhibited an increased resistance to oxidant-induced apoptosis [51]. The association between HMOX1 promoter polymorphisms and cancer susceptibility has been studied widely, but remains inconsistent [56]. Both LL genotype [52,54,57,58,59,60] and SS genotype [61] were shown to increase risk of different cancers. The second type of polymorphism in HMOX1 gene is associated with an A(−413)T (rs2071746) single-base change [47,62]. In this case of SNP A(−413)T, it was suggested that the A might be associated with a higher promoter activity than the T allele [46,63], but the contradictory results were also published [64]. There are only a few studies investigating both types of polymorphisms (lengths and SNPs) simultaneously [65] and there are no data on the effect of certain polymorphic variants on the clinical course in cancer patients, including ALL patients.
The aim of this study was to investigate the impact of HMOX1 promoter polymorphisms on long-term clinical outcomes, the prevalence of childhood ALL, and the role of certain polymorphic variants in resistance to chemotherapy. Second, since HO-1 plays a role in granulopoiesis, and we have verified whether those polymorphisms may reflect a predisposition to CIN incidences in children with ALL.

2. Results

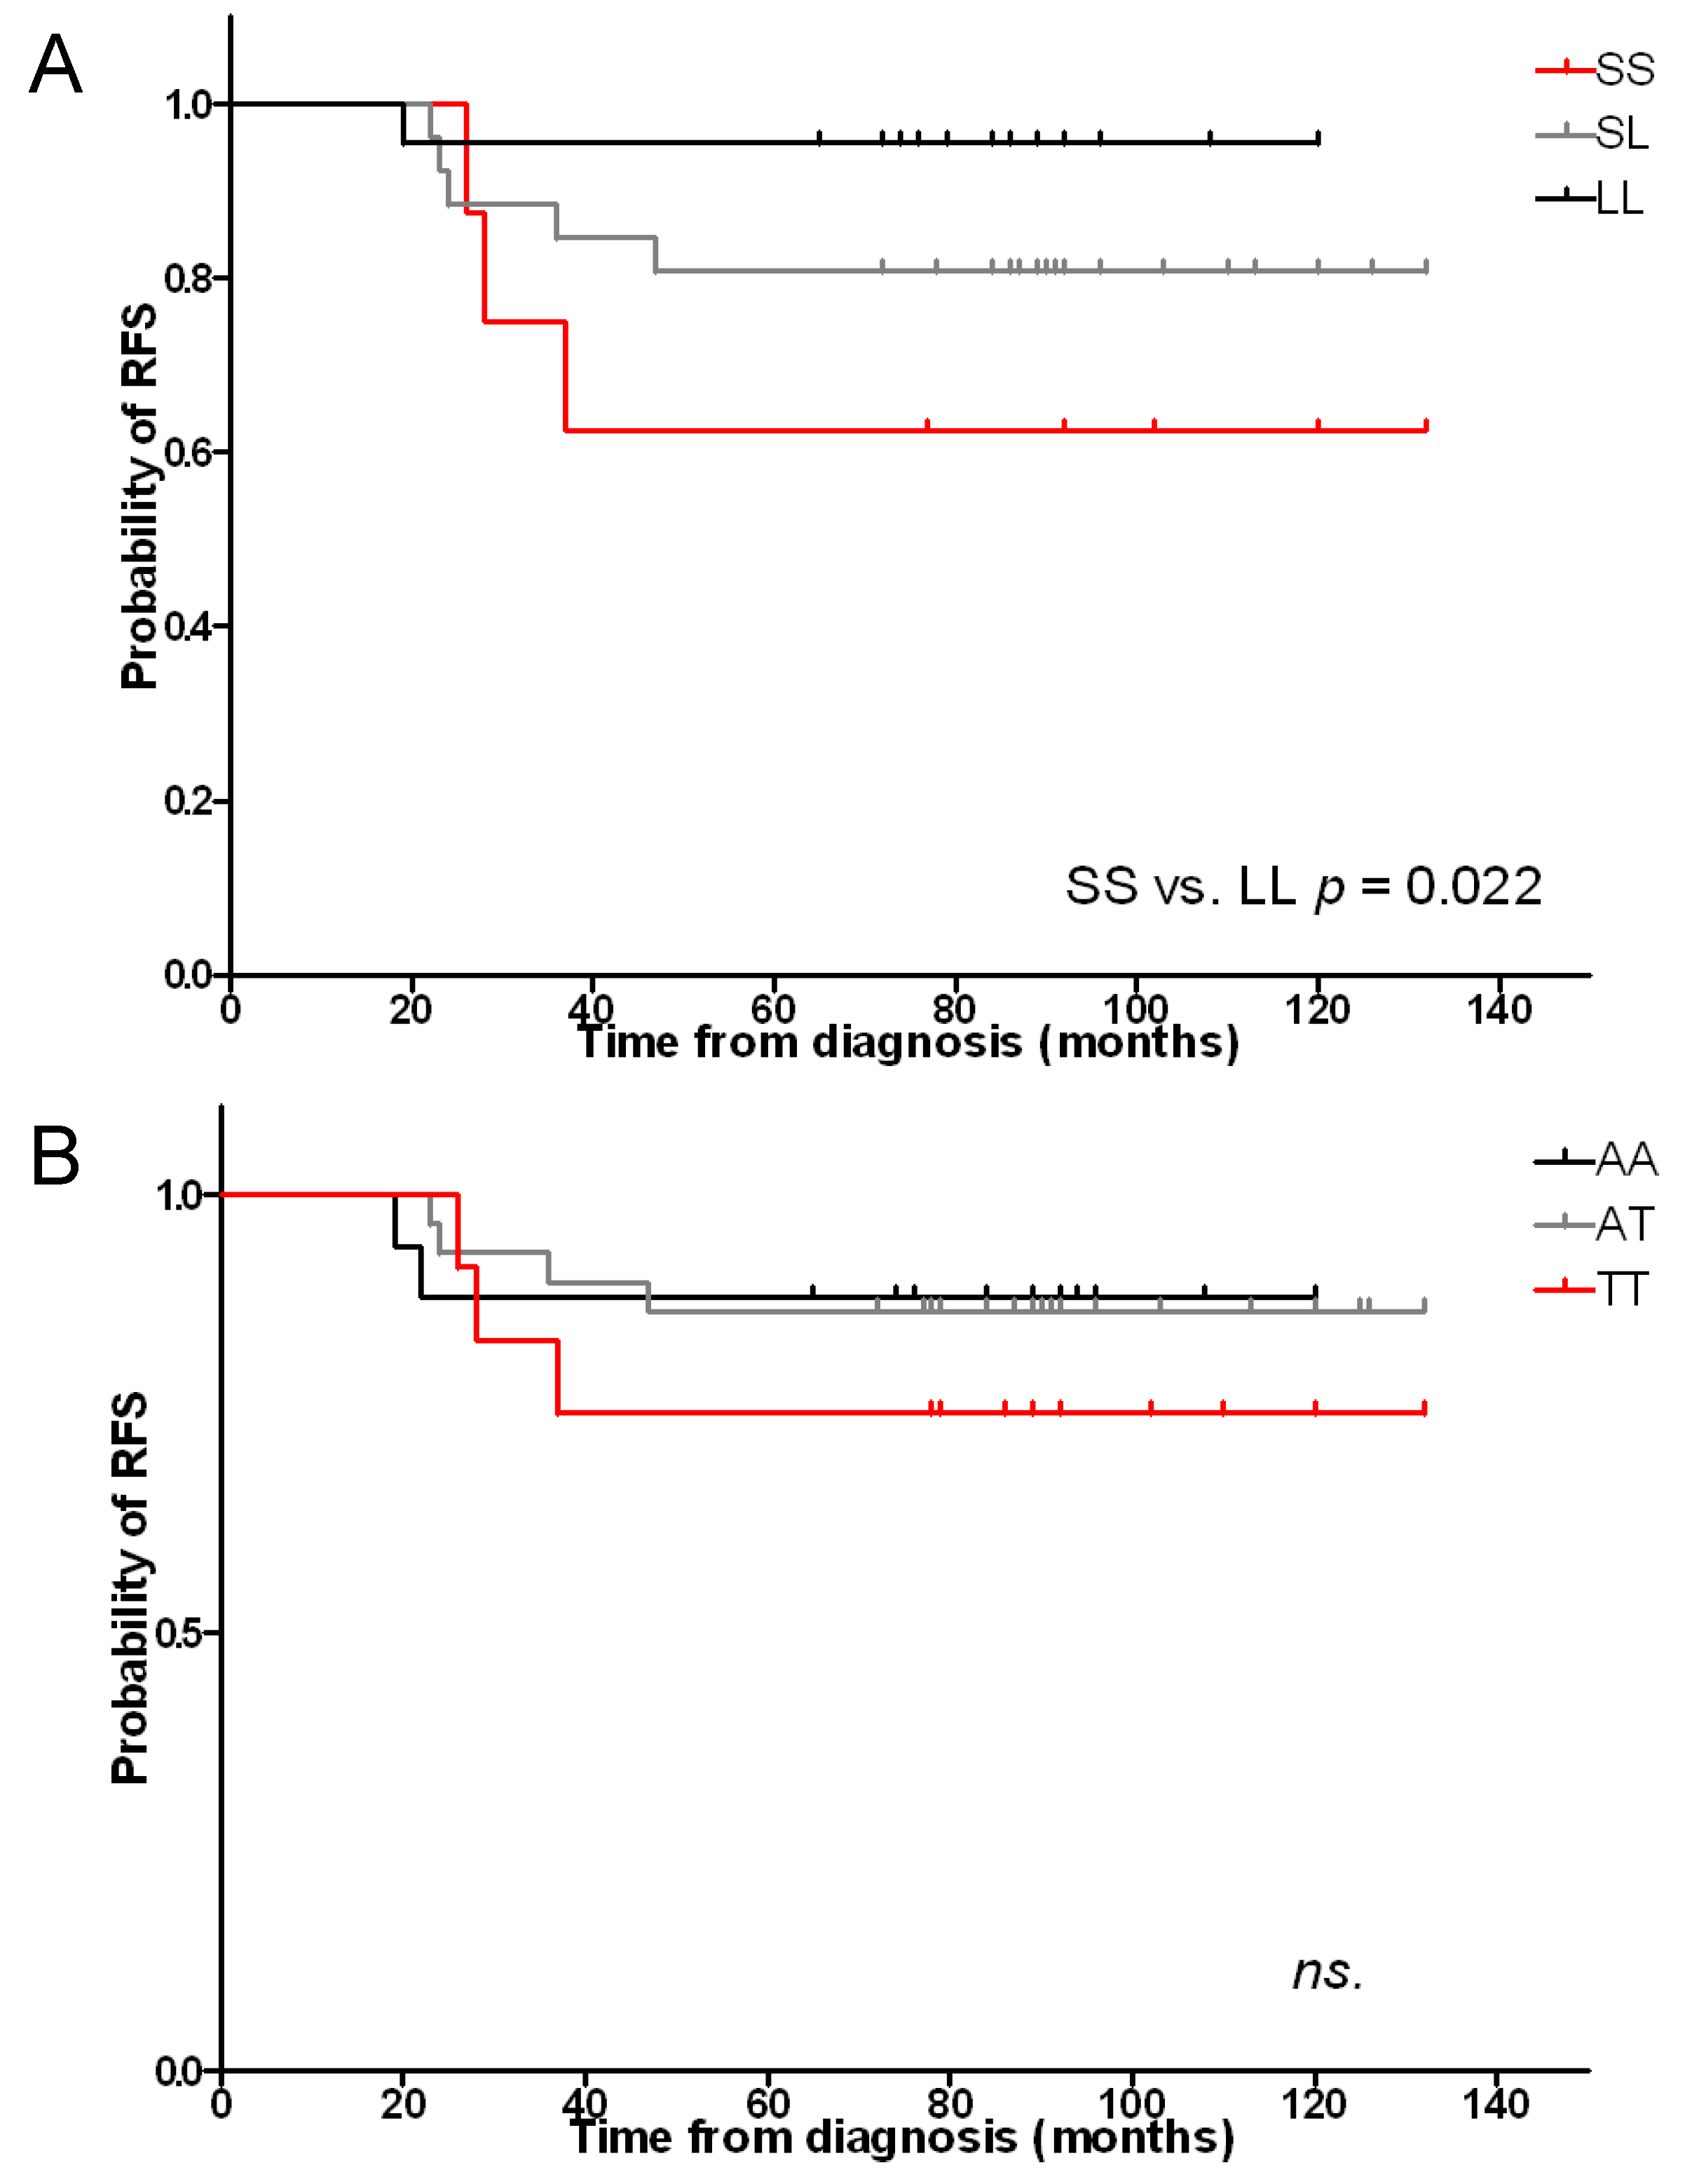
2.1. Length and A(−413)T SNP Polymorphisms and Risk of Relapse

To investigate the long-term clinical impact of certain polymorphisms, we evaluated the trend of standardized log-rank statistics using relapse-free survival (RFS) time. Among patients with the SS genotype, 3 patients (37.5%) experienced relapse at mean time of 30 months from the diagnosis. Among patients with the SL genotype, five patients (18.5%) experienced relapse at mean time of 30.4 months from the diagnosis. Among patients with the LL genotype, one patient (4.8%) experienced relapse at 19 months from the diagnosis. The proportion of patients who experienced relapse within certain subgroup (SS, SL or LL) did not reach statistical significance (p = 0.08). The five-year actuarial probabilities of RFS were 62.5%, 80.8%, and 95.5% for SS, SL, and LL group respectively, with the highest difference between SS vs. LL genotype (p = 0.022) (Figure 1A). This analysis suggests that the presence of short alleles might be a risk factor for poor prognosis. However, the effect of length polymorphism on patients’ overall survival (OS) did not reach statistical significance.
Among patients with the AA genotype, two patients (11.8%) experienced relapse at mean time of 20.5 months from the diagnosis. Among patients with the AT genotype, four patients (13.3%) experienced relapse at mean time of 32.5 months from the diagnosis. Among patients with the TT genotype, three patients (25%) experienced relapse at mean time of 30.3 months from the diagnosis. The proportion of patients who experienced relapse within certain subgroup (AA, AT or TT) was statistically insignificant. The five-year actuarial probabilities of RFS were 88.2%, 86.7%, and 75% in AA, AT, and TT group respectively, not showing statistical difference (Figure 1B). This analysis indicates that A(−413)T polymorphism has no prognostic significance.

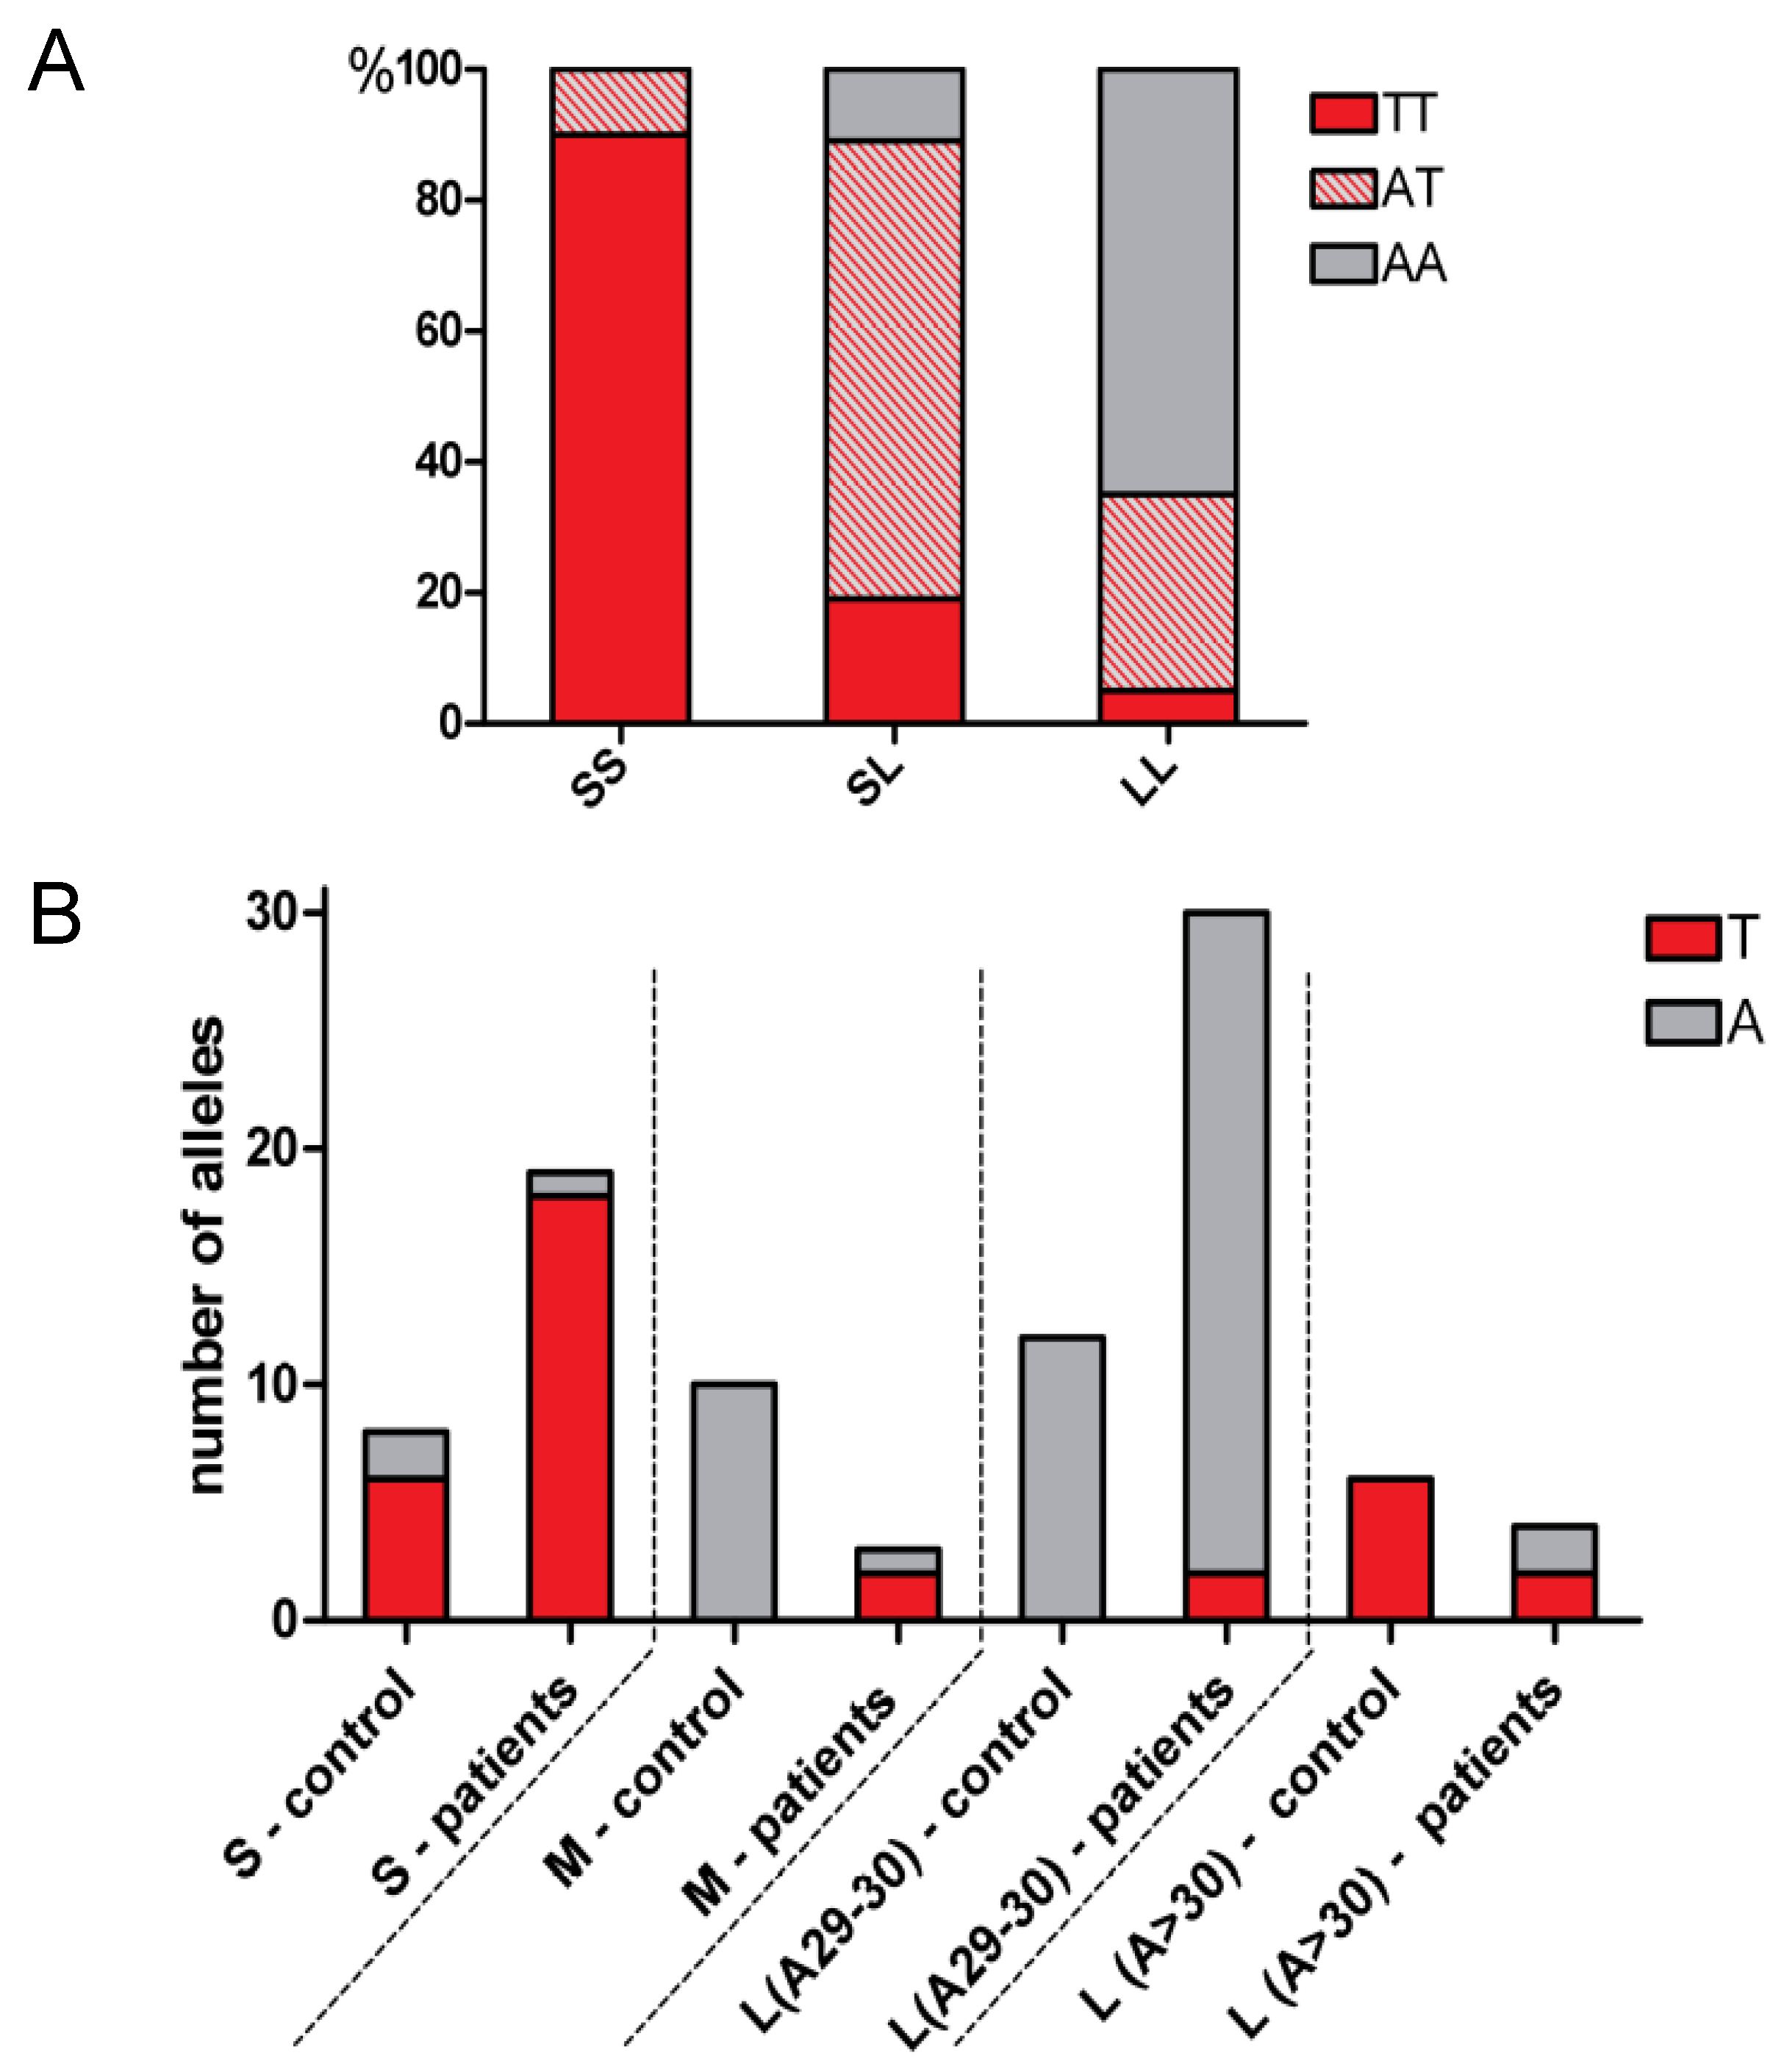
2.2. Co-Segregation of A(−413)T SNP with Length Polymorphisms

In order to examine the co-segregation of the HMOX1 −413 A > T SNP with (GT)n repeat polymorphisms we compared a percentage frequency distribution (frequency of AA, AT or TT genotype distribution, shown as a percentage of the total frequencies in all analyzed subjects divided on the basis of length polymorphism (Figure 2A)) and distribution of different (GT)n alleles in subjects homozygous in terms of TT or AA (Figure 2B). Concordantly with data obtained by Bean et al. [65], we found that both in healthy controls and in ALL patients, in almost all individuals short alleles occurred simultaneously with T alleles, and in most cases long alleles (29/30 GT) were present together with A alleles (Figure 2A). We also noticed that in the control group, very long alleles (>30 GT) exclusively occurred together with T alleles (Figure 2B). Because of this co-segregation, without simultaneous investigation of SNP and length polymorphisms, it is not possible to clearly identify which of the A or T alleles exhibit transcriptional activation properties. Due to this doubt, and also the fact that the length polymorphism function has been well documented, and that our data demonstrate its role in RFS, we postulate that only the length polymorphism, but not SNP, should be considered clinically significant.

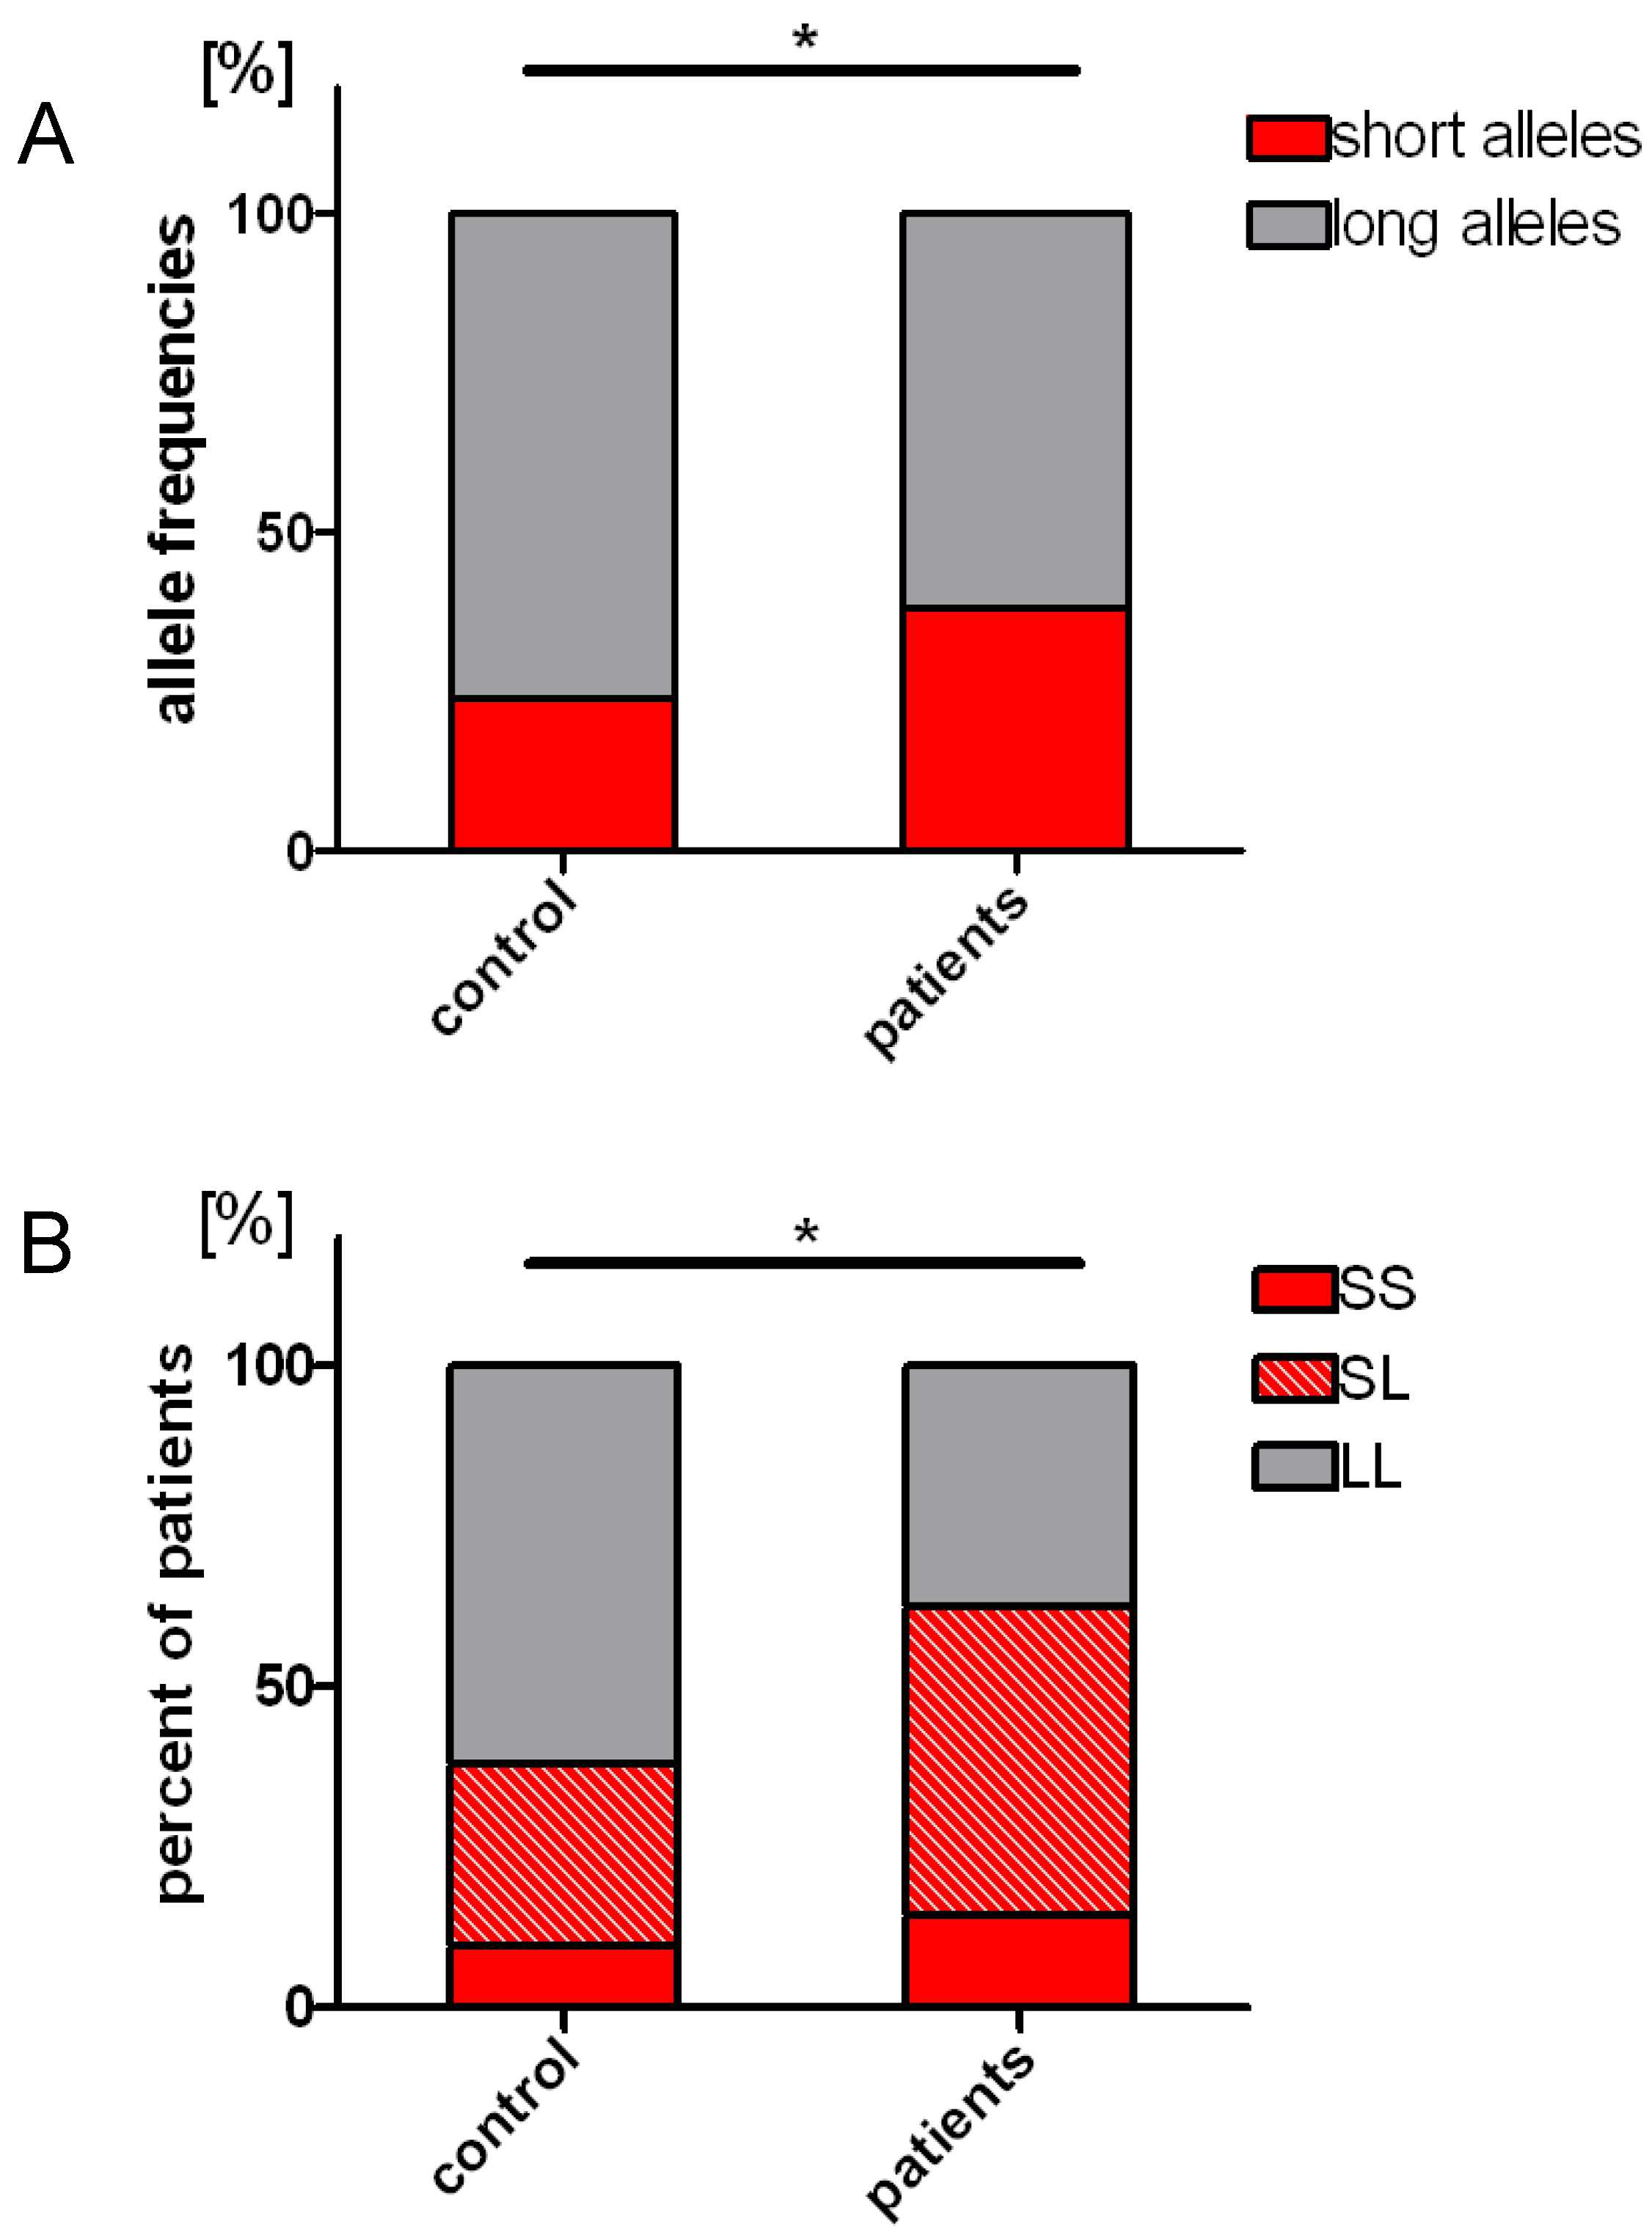
2.3. Distribution of the Length Polymorphisms and Acute Lymphoblastic Leukemia Prevalence

Because the criteria for distinguishing the M and L alleles are inconsistent (different cutoffs set arbitrary in different studies), and their precise distinction is not of biological and clinical importance, we analyzed our results applying only 2 allele categories (S and L), with a cutoff for S alleles of 23 or fewer dinucleotide repeats (<24), based on our earlier research where we experimentally determined the cut-off value in human endothelial cells, by measuring HMOX1 expression [49]. Next, we assessed the frequency of the S and L alleles in control subjects and in patients (Figure 3A). We found that L alleles were prevailing over S alleles in both control and ALL patients’ groups. However, S alleles were statistically more frequent in ALL patients than in healthy children (38.4% in ALL patients and 23.8% in control group, p = 0.032 Figure 3A).
Then we compared the proportion of individuals with the SS, SL and LL genotype in the studied groups. Since it had previously been shown that one short allele would suffice to provide higher activation of HMOX1 promoter [49,66], in the first step we combined individuals with the SS and SL genotypes into one group. We found that among ALL patients, the proportion of such individuals was statistically higher than in the control group of healthy people (62.5% in ALL patients; 38.1% in control group, p = 0.024 Figure 3B). Because in lymphoblastoid cell lines (LCLs) it was shown that HMOX1 mRNA expressions and HO-1 activities were significantly higher in cells with the SS genotype [67], in the next step we compared a proportion of homozygous SS individuals in studied groups. However, we did not find significant difference in the distribution of SS homozygotic individuals between ALL and control group (14.3% in ALL patients; 9.5% in control group, Figure 3B). These results indicate that the presence of the S allele (SS or SL genotype) may increase the risk of ALL leukogenesis, but the additional presence of a second S allele (SS genotype) is no longer relevant.

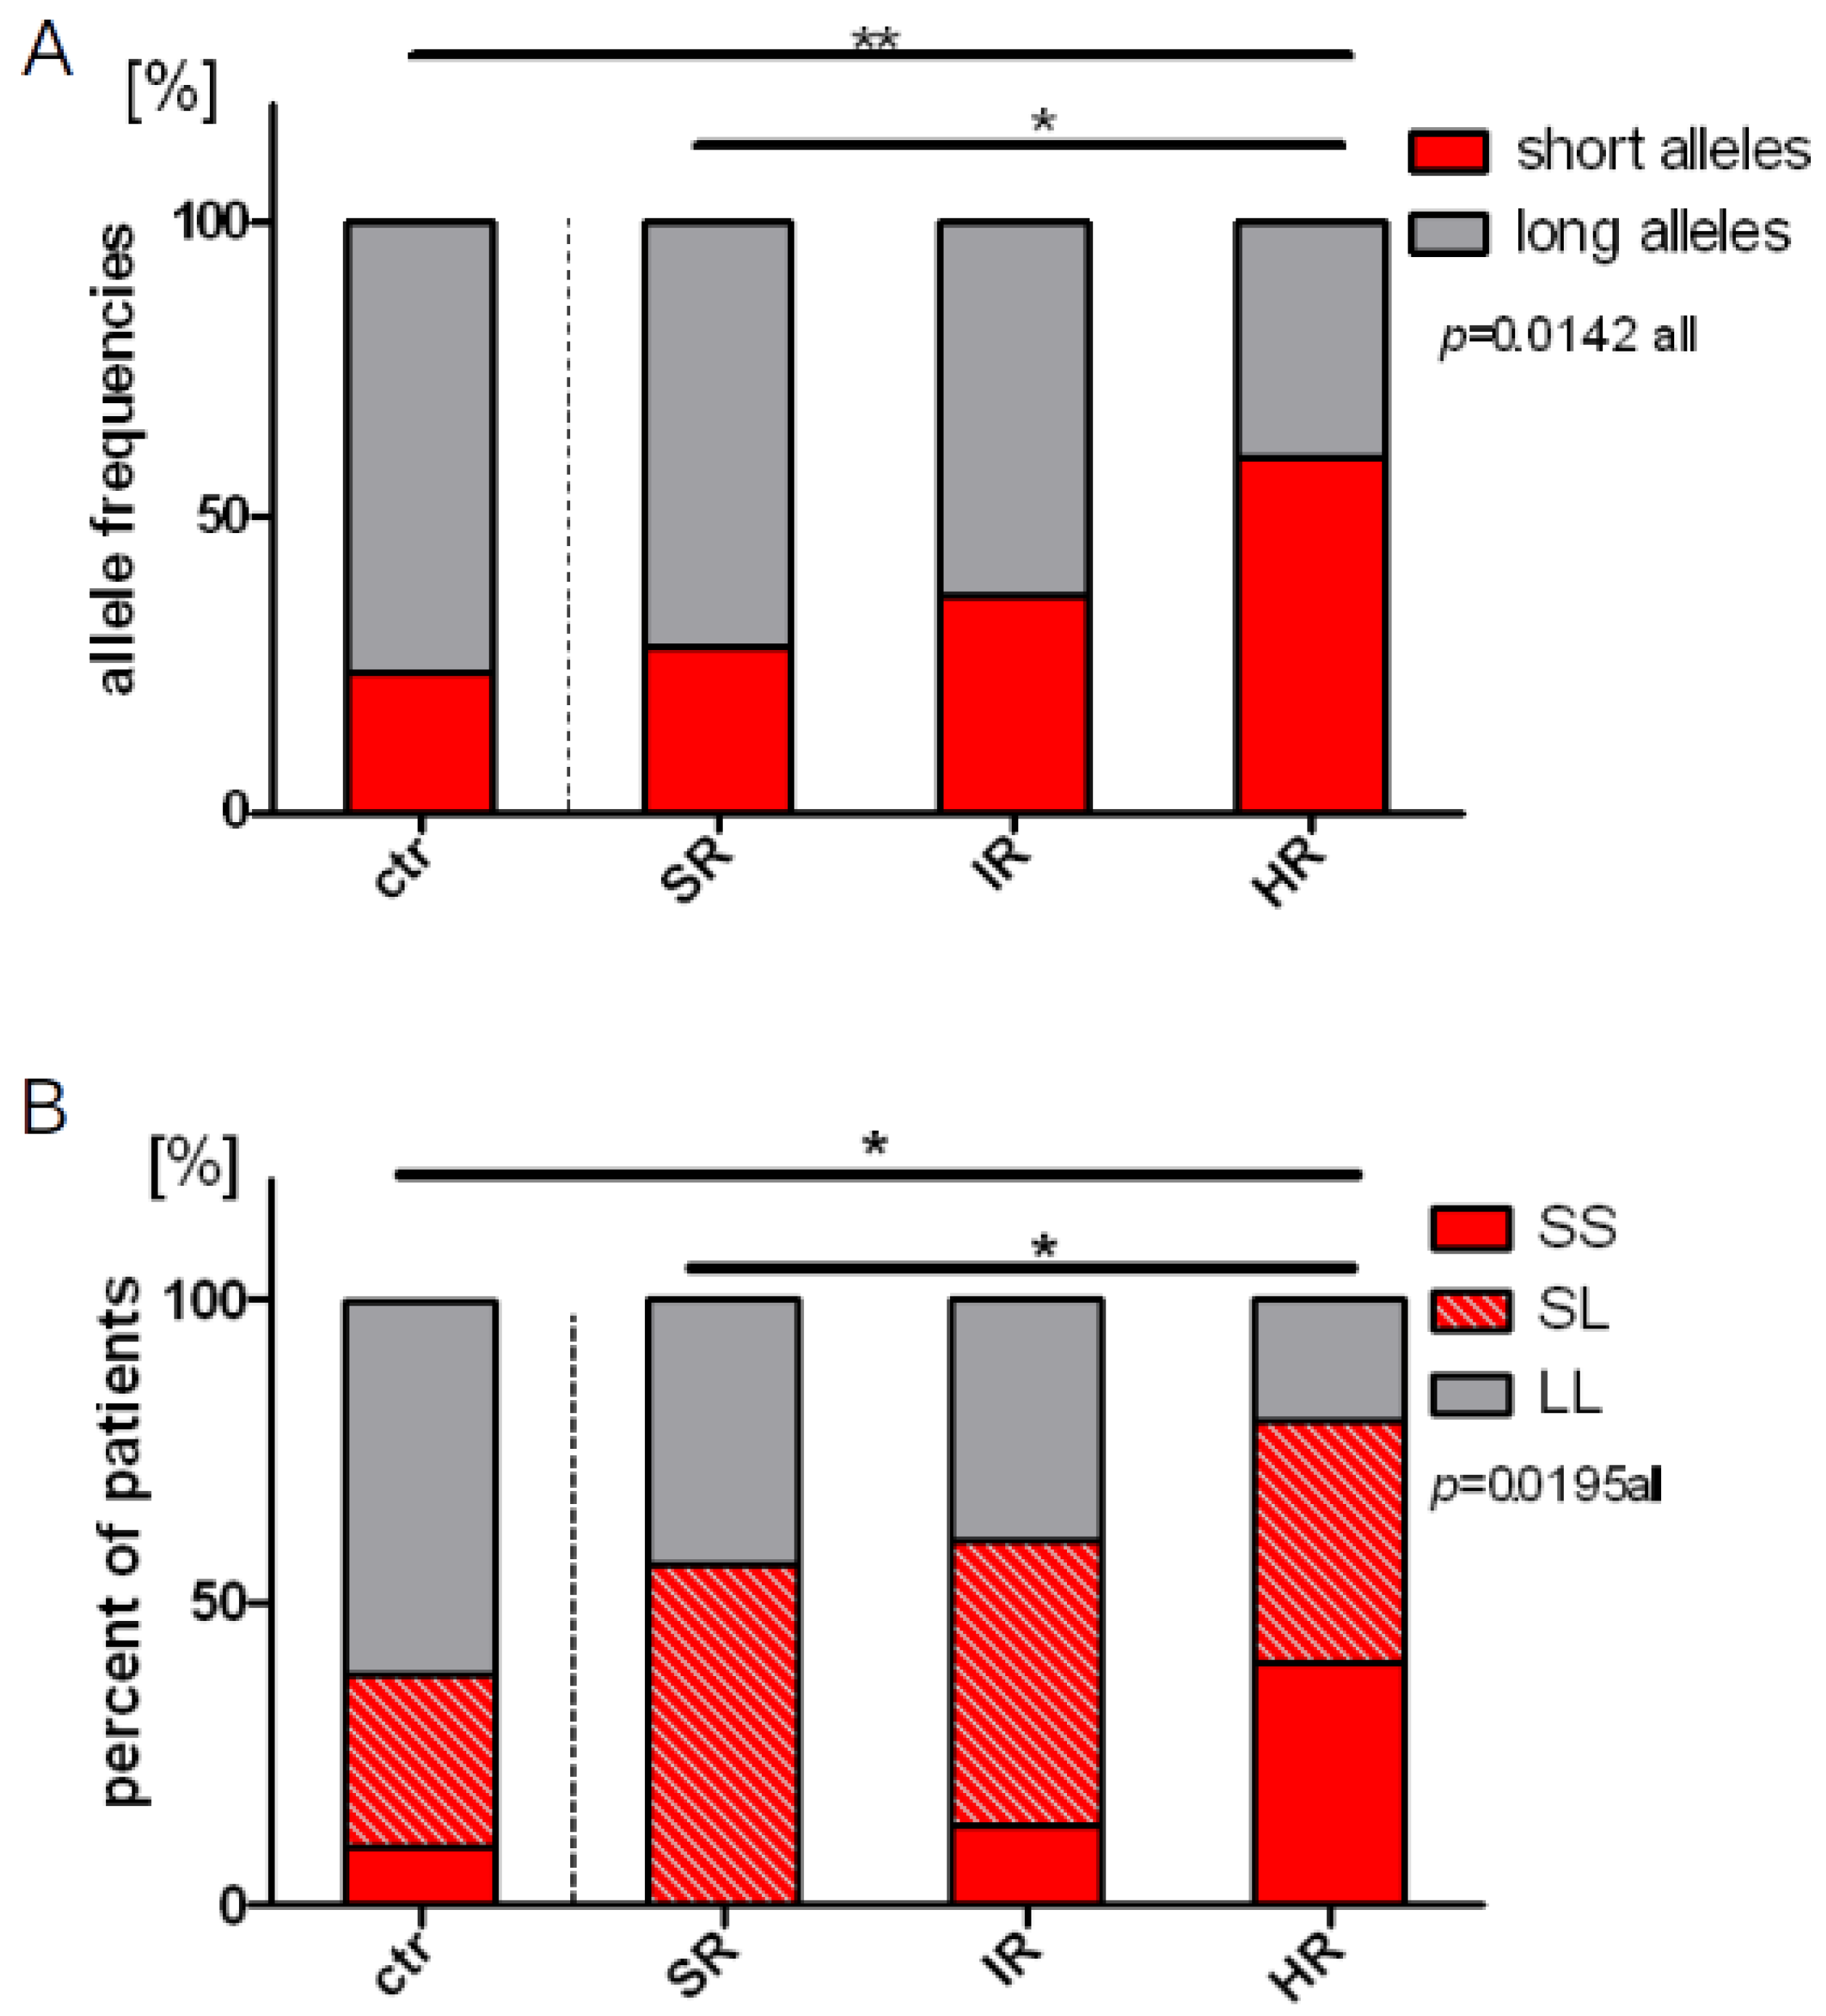
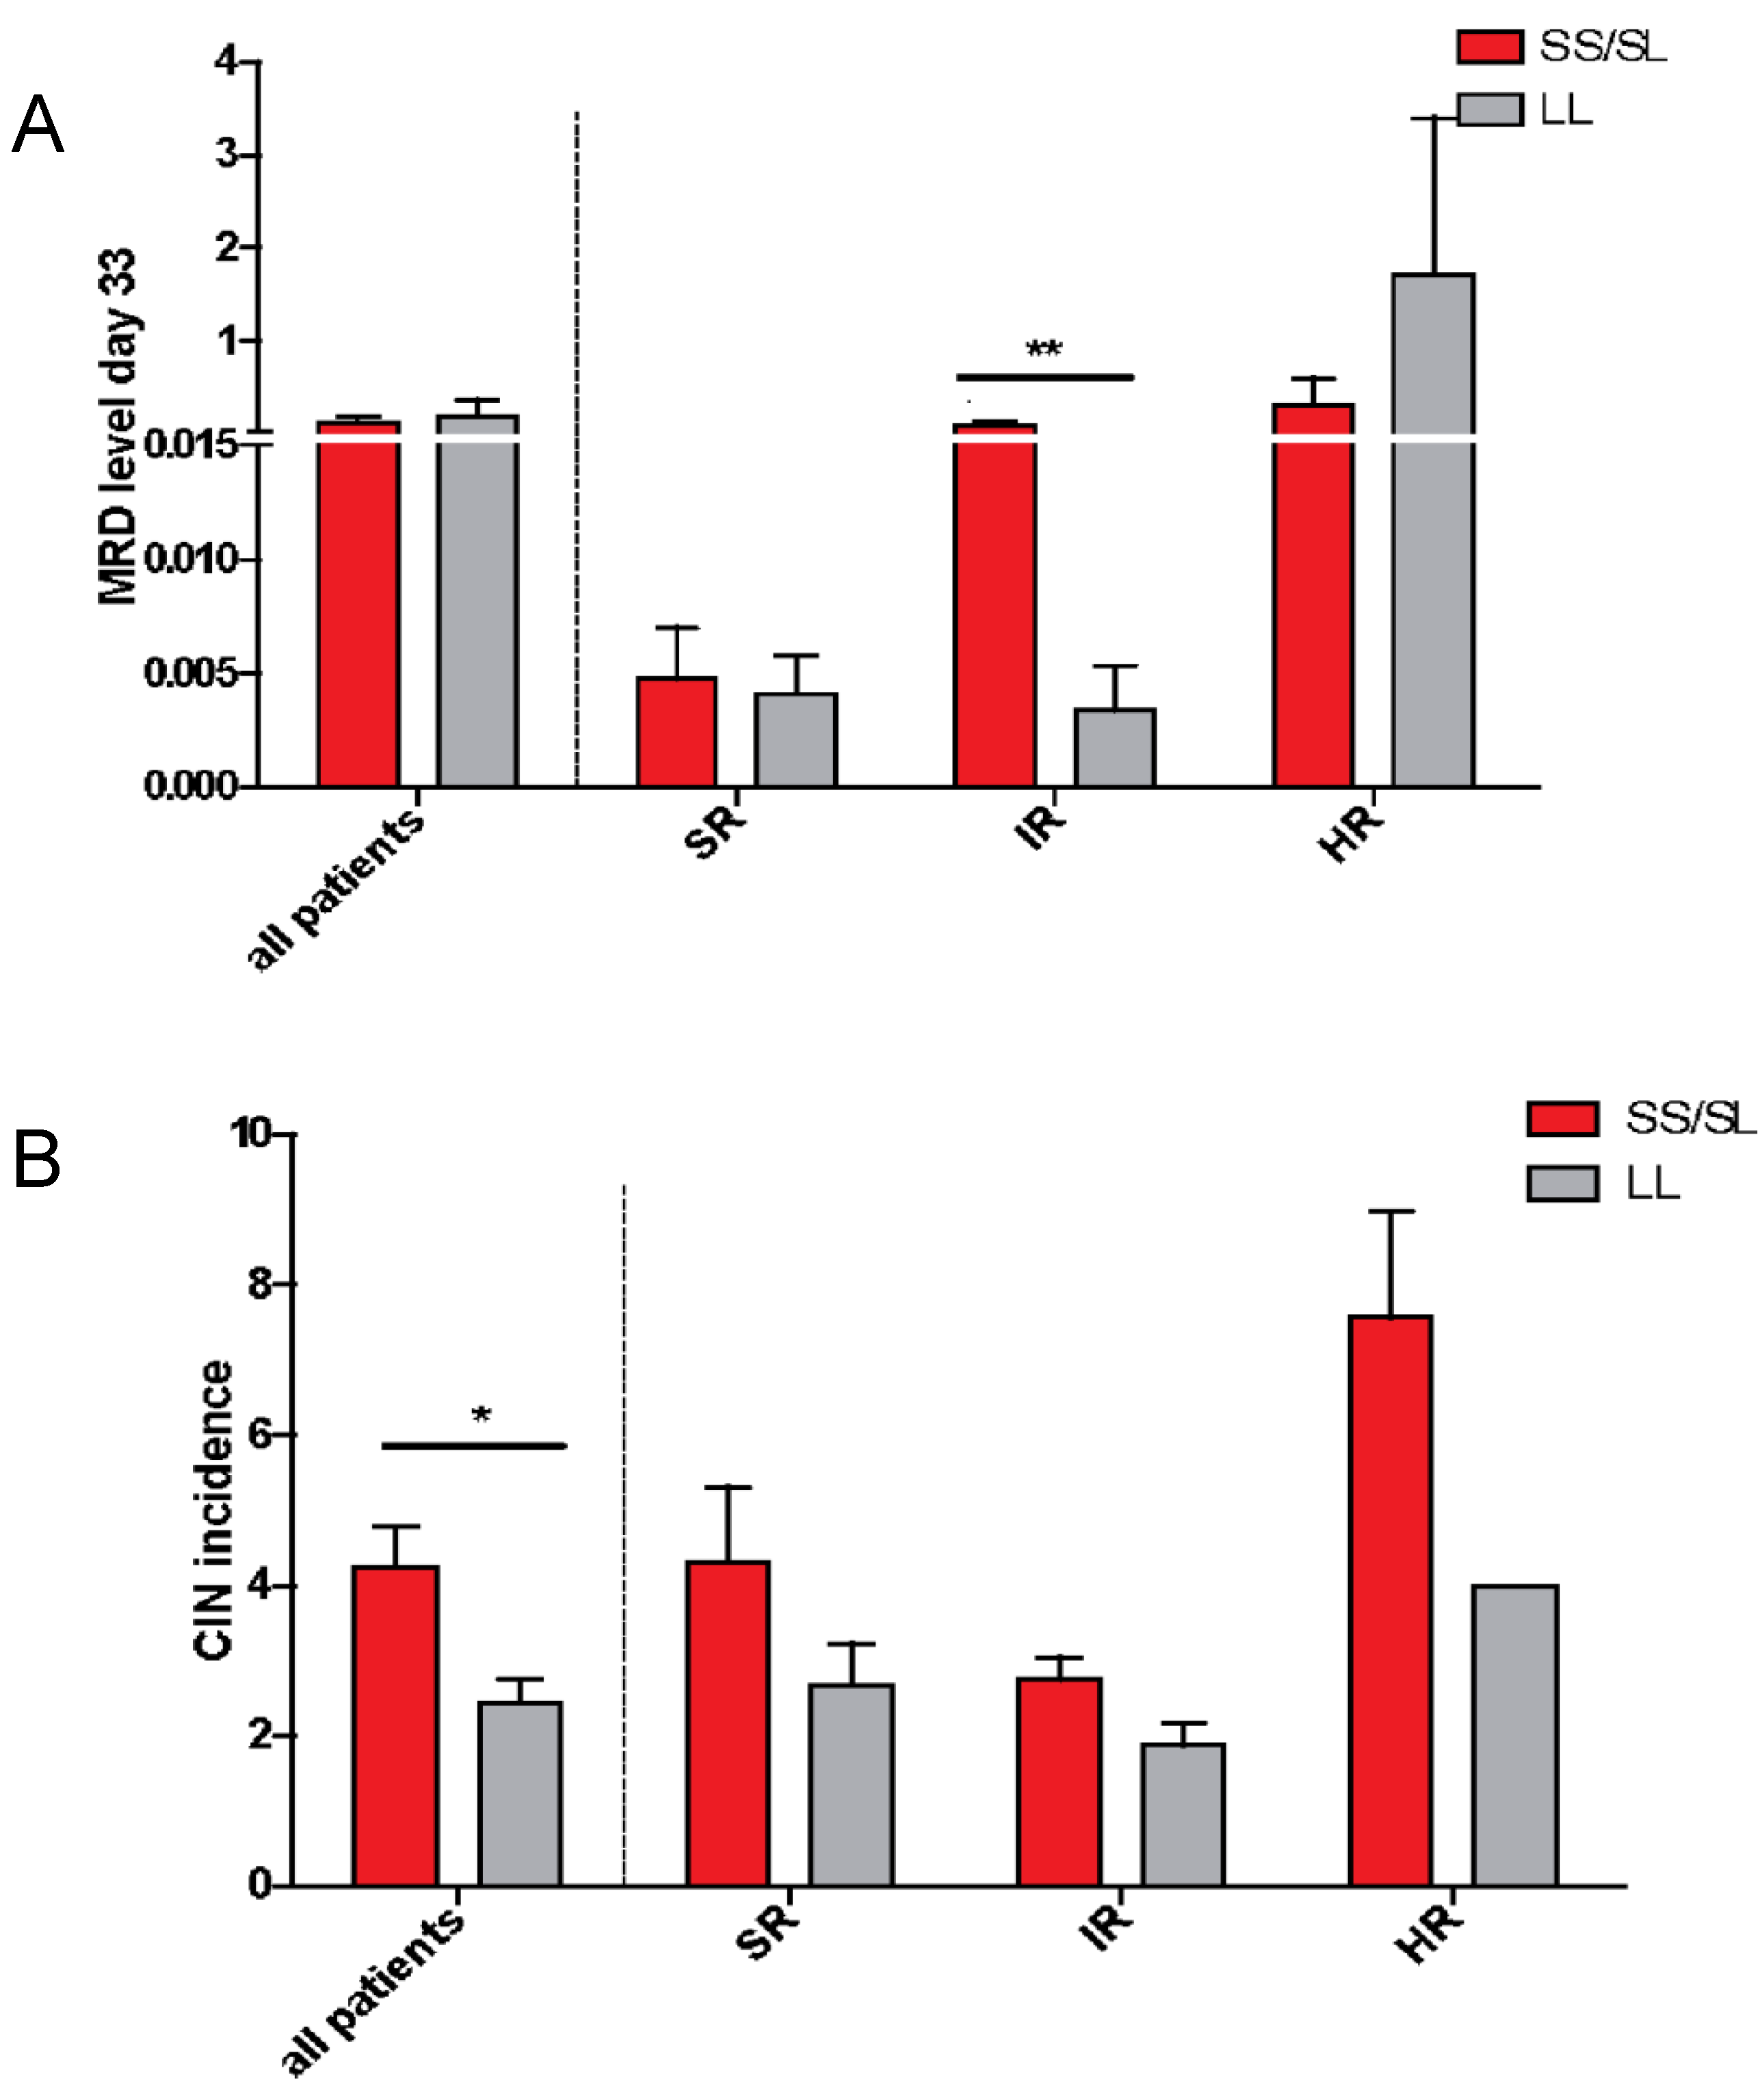
2.4. Length Polymorphisms and Treatment Response

Next, we found different frequency of the S and L alleles in the risk-adjusted patient groups (p = 0.014). The frequency of the S alleles was increased concomitantly with rising risk stratification in the groups, with a statistically higher frequency of the S alleles in HR patients when compared to the control group (p = 0.003) or to the SR group (p = 0.041) (23.8% in the control group; 28.1% in the SR group; 36.7% in the IR group; 60% in the HR group, Figure 4A). Next, we compared the proportion of the SS, SL, and LL genotypes in the patients versus the control group, and found an unequal distribution of those genotypes (p = 0.014). When we combine individuals with the SS and SL genotypes (as individuals with at least one short allele) and compared their proportion between the risk groups, we found the highest number of such patients in the HR group, with significant difference when compared to the control group (p = 0.031) (38.1% in the control group; 56.2% in the SR group; 60% in the IR group; 80% in the HR, Figure 4B). Next, we compared the proportion of homozygous SS individuals in all studied groups. The highest proportion of homozygous SS genotype was observed in the HR risk group, with significant difference when compared to healthy control (p = 0.035) and to the SR group (p = 0.014) (9.5% in the control group; 0% the SR group; 13.3% in the IR group; 40% in the HR group, Figure 4B). These results indicate that the presence of short alleles, especially in the homozygous configuration, is associated with stratification to the HR group, reflecting a higher risk of treatment failure, coherent with a higher risk of relapse (Figure 1A).
We also investigated whether the presence of the S allele could indeed lead to a higher blast cells persistence, measured as MRD. On the 15th day of treatment there was no statistical difference in blast count between patients characterized by the presence of at least one S allele (data not shown). However, on the 33rd day, in the IR group we found that SS/SL patients exhibited higher MRD values (p = 0.009, Figure 5A). Nevertheless, as the difference was found only in the IR group, and only at day 33rd, we doubt that these data might be biologically relevant.

2.5. Chemotherapy-Induced Neutropenia (CIN)

Subsequently, we checked whether the frequency of G-CSF administration cycles, which reflects the number of CIN incidents in a patient, was related to the presence of the certain HMOX1 promoter allele. In the first step, the analysis was carried out in all patients, regardless of the risk group. It was found that patients with the S allele had significantly more neutropenic events that had to be treated by administering G-CSF (p = 0.048, Figure 5B). However, in the HR group, most G-CSF administrations are pre-scheduled in advance, and in the SR and IR groups G-CSF is administrated if necessary. Because the genotype itself relates to the risk groups, we examined the influence of genotype and risk group on a number of CIN incidents as independent variables. We found that the main effect resulted from the risk group (two-way ANOVA, p < 0.001), but we also found the effect of genotype (p = 0.006). Since each risk group is treated with a different therapeutic protocol, and a given type of chemotherapeutic regimens may per se predispose to a different occurrence of CIN, the analysis was also conducted separately in the risk subgroups. Accordingly, in all risk groups the number of cycles of G-CSF treatment tended to be lower among children with the LL genotype, however it was not statistically significant (Figure 5B).

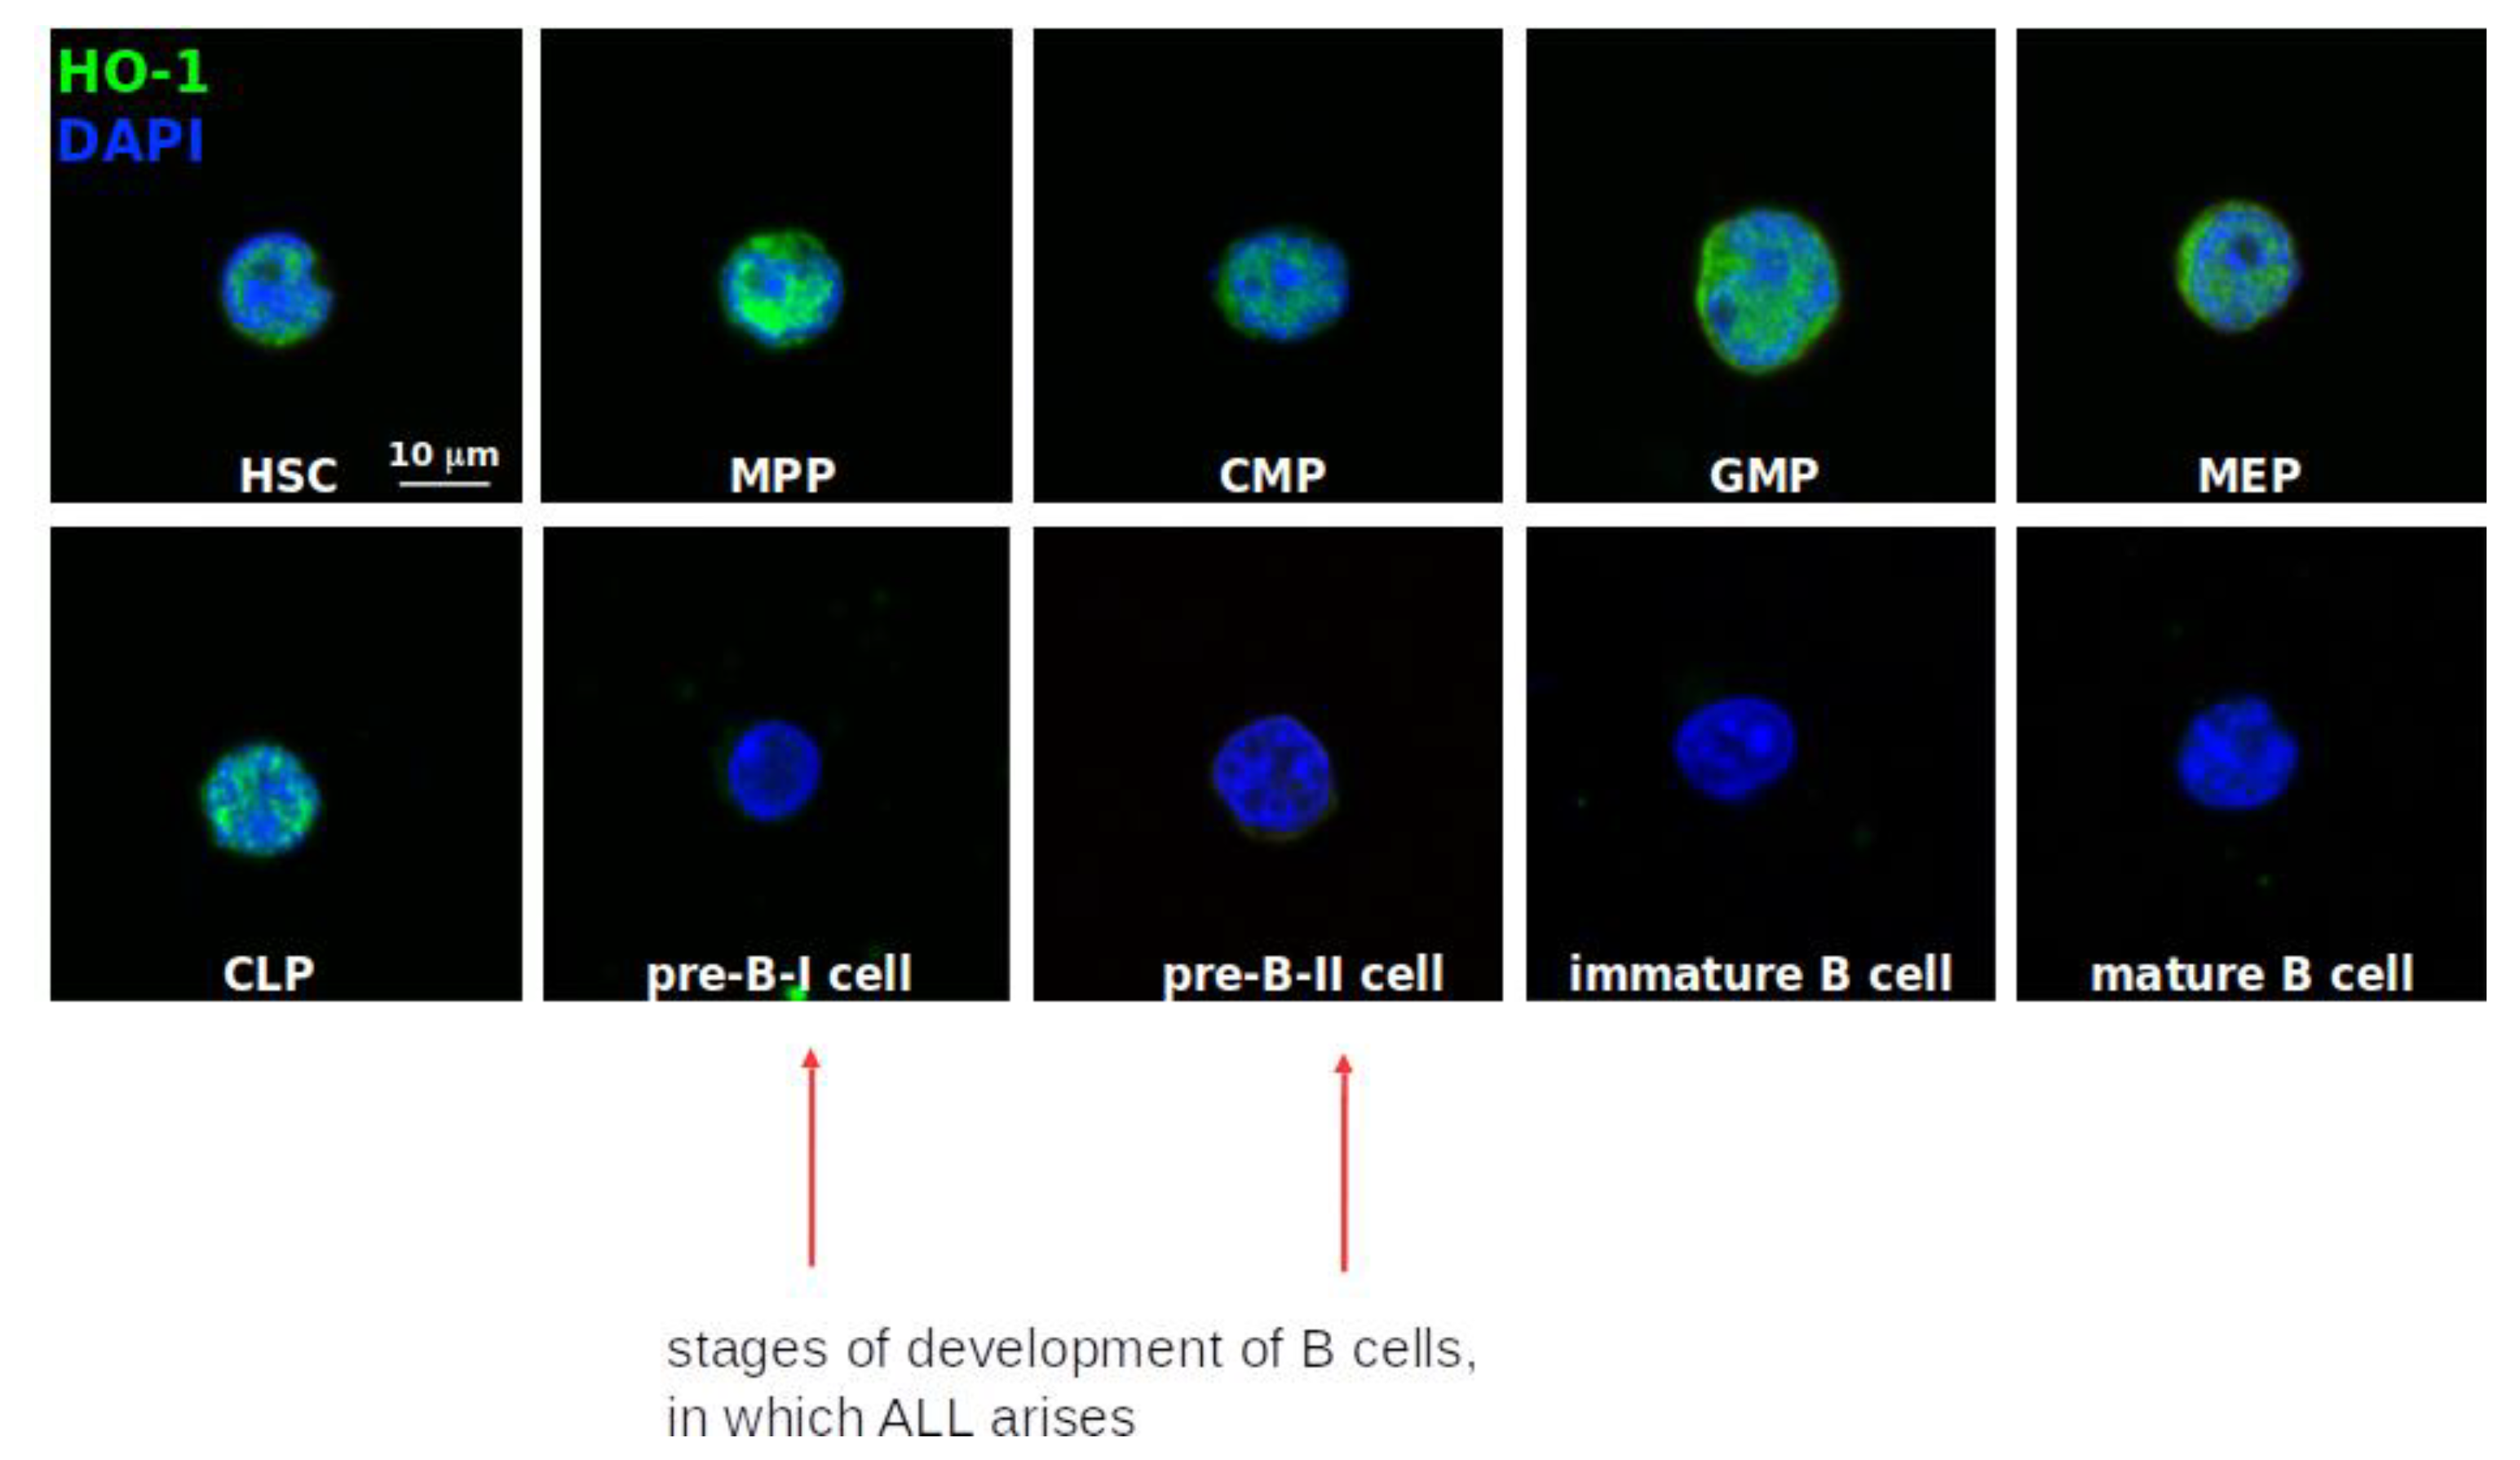
2.6. HO-1 Expression and Its Localization within Normal Human Hematopoietic System

In the last set of experiments, we wanted to assess a possible biological mechanism responsible for a distinct clinical course in patients with different length polymorphisms of HMOX1 promoter. We wanted to assess whether it might be associated with the role of HO-1 in the blast cells per se, or rather in the myeloid compartment.
Since the physiologically relevant HO-1 suppressor—heme-regulated BACH2—is a critical negative mediator at the pre-B cell receptor checkpoint and is a safeguard against leukemogenesis, we addressed the question whether HO-1 might also play a role in physiological lymphopoiesis. For this purpose, we examined the HO-1 expression and its localization within normal human hematopoietic system. We sorted cells of specific immunophenotype and stained HO-1 protein to check its expression by means of confocal microscopy. To distinguish human hematopoietic progenitor subsets, the staining scheme described by Seita et al. was employed [68]:
  • Hematopoietic stem cells (HSC): LinCD34+CD38CD90+CD45RA
  • Multipotent progenitors (MPP): LinCD34+CD38CD90CD45RA
  • Common lymphoid progenitors (CLP): LinCD34+CD38CD10+
  • Common myeloid progenitors (CMP): LinCD34+CD38+CD123+/lowCD45RA
  • Megakaryocyte-erythroid progenitor (MEP): LinCD34+CD38+CD123CD45RA
  • Granulocyte-macrophage progenitor (GMP): LinCD34+CD38CD123+CD45RA+
  • Lymphoid maturation steps were established based on:
    -
    preBI: CD19+CD34+CD10+CD20
    -
    preBII: CD19+CD34CD10+CD20dim
    -
    Immature B cells: CD19+CD34CD10+CD20+
    -
    Mature B cells: CD19+CD34CD10CD20+
Interestingly, we found that in hematopoietic stem cells and in progenitors committed to granulocyte or megakaryocyte lineage HO-1 is mainly located in the nucleus, what may indicate its non-canonical, non-enzymatic role [69]. However, upon maturation into preB-I stage of B-cell development (the stage of normal B-cell development, which is most prone to malignant transformation into BCP-ALL (the pre-pro-B to pre-BI transition) [70], HO-1 expression was barely detectable (Figure 6). This was consistent with the fact that BACH2—HO-1 suppressor—is upregulated at the transition from multipotent progenitor (MPP) into the B cell lineage, before the completion of the heavy chain checkpoint [71]. These data suggest that in physiological conditions HO-1 expression is not required for the maturation of B-cell precursors.

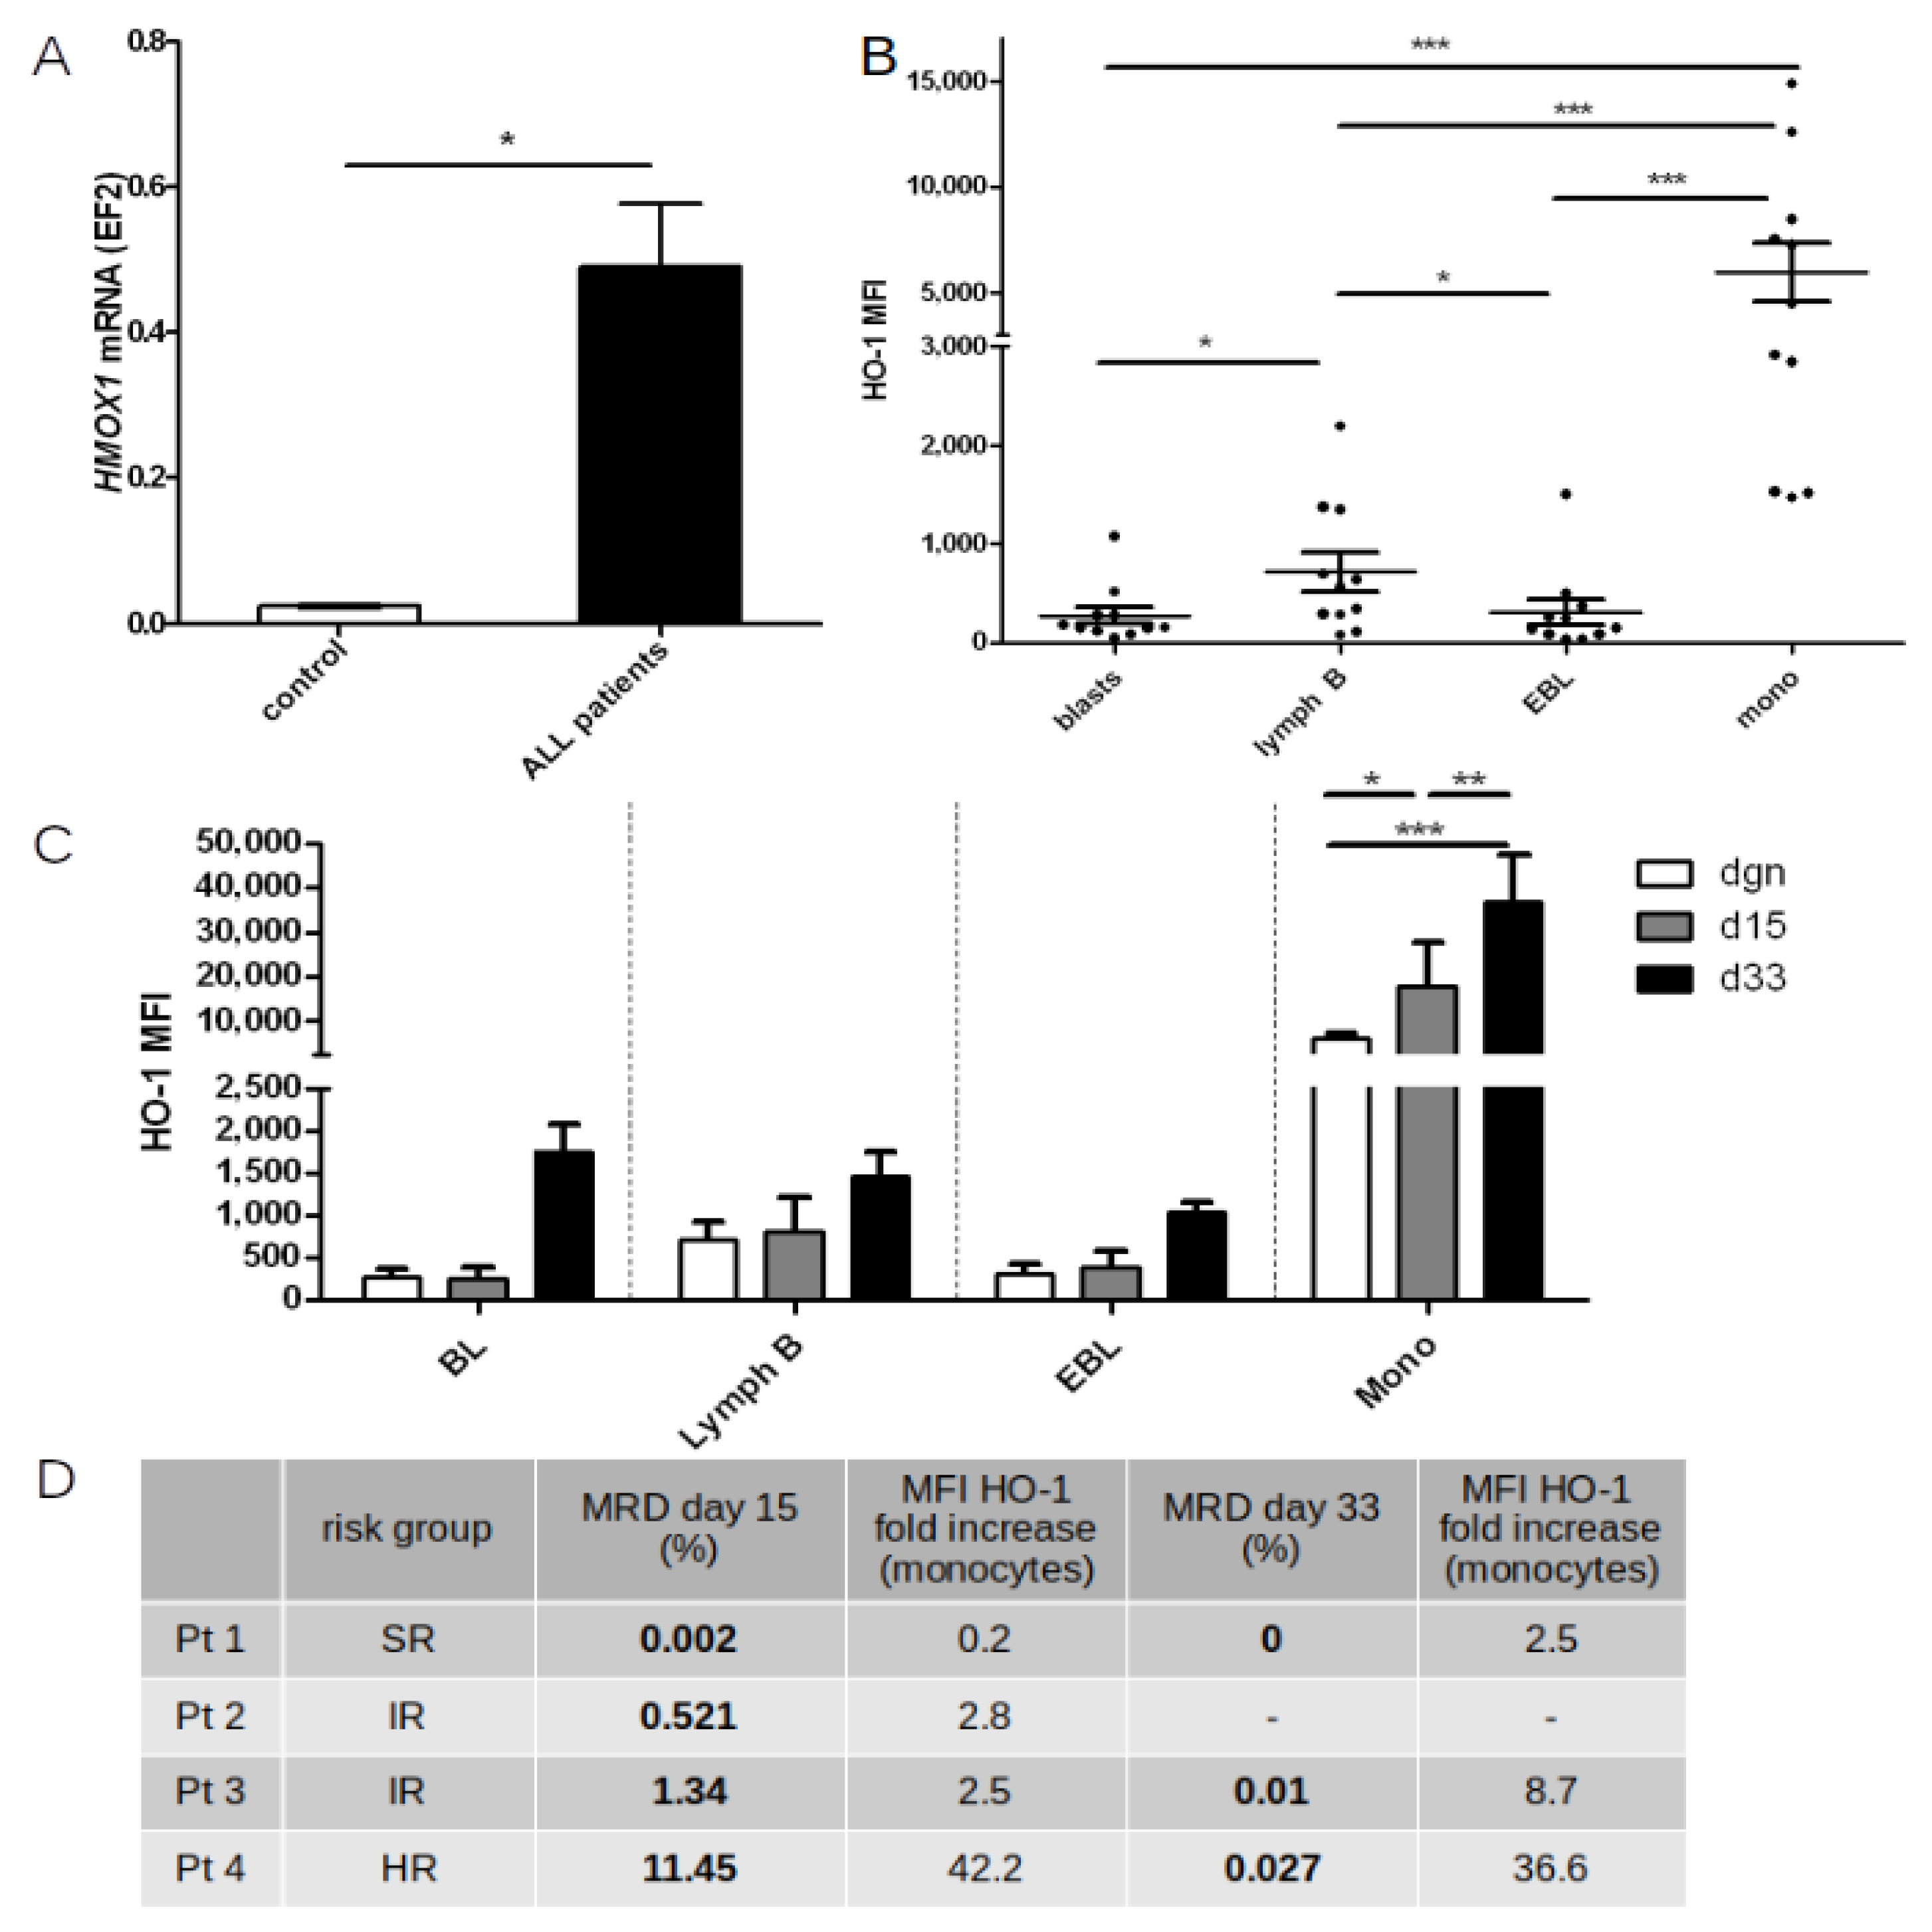
2.7. HO-1 Expression in Peripheral Blood and Bone Marrow Cells before and during Chemotherapy

To check whether chemotherapy protocols used in ALL patients actually induce HO-1 expression in normal cells, regardless of the presence of leukemic cells, HMOX1 mRNA level was measured in peripheral blood samples taken from ALL patients during treatment course, but at the stage of clinical remission, when no blast cells were found in the peripheral blood, and complete blood count was normalized. We found that in comparison to healthy, untreated children, in ALL patients the level of HMOX1 mRNA was significantly elevated (p = 0.017, Figure 7A). It must be noted, however, that HMOX1 mRNA measurements were performed in samples taken from patients at various stages of treatment (including patients just before the end of treatment or after the end of entire treatment course). Hence, in this case many additional factors might have influenced the elevation of HMOX1 expression, not solely the chemotherapeutic agents.
In the next step we compared the level of HO-1 expression (presented as mean fluorescence intensity—MFI) in certain cell subsets within bone marrow at the day of diagnosis (prior to treatment—day 0) and on days 15 and 33 of treatment. To exclude cellular debris, only nucleated cells (syto41+) were taken into analysis. Leukemic blasts were identified as immature B cell population with aberrant immunophenotype, defined individually for each patient (leukemia associated immunophenotype—LAIP). Normal mature B cells were defined as cells within “lymphgate” (bright CD45 expression, low SSC) positive for CD19 and CD20 but negative for CD10 and CD34. Erythroblasts were defined as cells negative for CD45 with low SSC characteristics, simultaneously negative for CD11a, CD19, CD10, CD34, and CD20. Monocytes were defined as cells within “monogate” (bright expression of CD45 and intermediate SSC), negative for CD19, CD10, CD20, positive for CD38, with very bright CD11a expression. Each population was backgated on FSC/SSC dotplot.
At the day of diagnosis we compared the HO-1 MFI between leukemic cells and the residual normal cell subsets present in the sample (Figure 7B). We found that HO-1 expression was the lowest in leukemic blasts, with comparable level of expression as in erythroblasts. The expression of HO-1 in mature B-cells was slightly higher than in the blast cells (p = 0.004), and erythroblasts (p = 0.048). The highest HO-1 expression was detected in monocytes when compared to all analyzed subsets (monocytes in comparison: to blast cells—p < 0.0001, to mature lymphocytes B—p = 0.0002, and to erythroblasts—p = 0.0001). This pattern of HO-1 expression in non-malignant cells was similar to pattern of Hmox1 mRNA expression described in murine hematopoiesis model [72]. As HO-1 is a stress inducible enzyme, we have investigated whether HO-1 expression is indeed elevated in patients during induction chemotherapy, as at this point the regimen intensity is the same, regardless of the risk group. This analysis was done in six patients at day 15th and only three patients at day 33rd, as in the remaining three patients there was an insufficient amount of sample (due to aplastic bone marrow) to perform additional stainings, apart from routine MRD measurement. Only in monocytes was the HO-1 level statistically higher during following induction cycles (two-way Anova with Bonferroni posttests, Figure 7C), we performed further analysis tracking relative changes of HO-1 level in individual patients with distinct early treatment response (Figure 7D). We found that the higher the fold increase of HO-1 in monocytes was observed, the higher level of MRD detected. Based on both HO-1 level directly measured in monocytes at days 15th and 33rd as well as relative HO-1 level changes in individual patients with different early treatment response (expressed as MRD level), we postulate that the altered HO-1 expression in bone marrow monocytes—but not in lymphocytes—may represent a response to stressful conditions, rather reflecting modulation of HO-1 in the tumor microenvironment as a potential mechanism of chemotherapy resistance.

2.8. Supplementary Information—A-SNP-T Polymorphism

Because cut-off point criteria of short, medium and long alleles are inconsistent, we also demonstrated our data as raw values (Supplementary Figure S1). The investigation of A(−413)T SNP (Supplementary Figure S2) revealed no significant difference in the T and A alleles frequencies in ALL patients compared to the control group (Supplementary Figure S3A). We also compared the proportion of the AA, AT and TT genotypes in patients and controls and we did not find statistically significant difference (Supplementary Figure S3B). Similarly, the frequency of alleles A and T between the risk groups was not altered significantly, as well as the proportion of patients with certain genotype AA, AT or TT (Supplementary Figure S4A,B). In the HR group there were only slightly more patients displaying at least one T allele or displaying homozygous TT genotype. However, this result can be attributed to the effect of co-segregation of the T allele with short alleles (which were predominant in the HR group), than to regulatory properties of the T allele per se. Since in contrast to unequivocal S allele distribution, the final distribution of T allele in patients was balanced by the presence of T alleles co-segregated with very long alleles in control group, the difference between the groups was lost.

3. Discussion

Given the concerns about the two most important barriers for survival of BCP-ALL children—therapy resistance and treatment-induced toxicities—the research on predictive markers is of great interest to further guide clinicians on dose individualization during personalized therapy. Recently, some studies explored the prognostic significance of HO-1 expression in human cancers, as well as its possible correlation with tumor clinical features and outcome [73]. The HO-1 expression depends on common HMOX1 promoter polymorphisms [74,75]. Because such a universal modulatory mechanism seems to be an accurate, objective, easy to perform, and a convenient routine clinical utility, we decided to verify the role of HMOX1 promoter polymorphisms as prognostic marker candidates in BCP-ALL children. It has been confirmed in several studies (also from our group: [49]) that HO-1 expression depends on the length of microsatellite sequences in HMOX1 promoter. The lower number of GT repeats allows for a higher HO-1 expression under control conditions and a stronger induction in response to stress. [46,47,50]. Several clinical studies have demonstrated that the length of GT region is associated with increased susceptibility to some human diseases [46]. In contrast, only sparse research has investigated an A(−413)T SNP in terms of clinical investigations [76] and its impact on HMOX1 transcription. To exacerbate, they provide contradictory results, indicating that either A [63] or T [64] is responsible for a higher transcriptional activation. Therefore, in this study we performed both genotyping of the (GT)n microsatellite polymorphism and A(−413)T SNP in the HMOX1 gene promoter in patients with BCP-ALL and in control group of healthy children.
In accordance with the previous data [65], we found high co-segregation of specific subtype of (GT)n microsatellite polymorphisms with A(−413)T SNP variants, both in the control group and in ALL patients. Subjects carrying the most common subtype of L allele (29–30(GT) repeats) possessed mainly A allele, whereas individuals with short (<24 GT) or very long (>30 GT) alleles exhibited very high prevalence of T variant of SNP. 100% co-segregation of the homozygotes SS (considered as more transcriptionally active) with homozygous TT (regarded as less transcriptionally active), and the co-segregation of the most common type of L allele (shown to have low transcriptional activity) with the A allele, might lead to a conclusion that both types of polymorphisms occur usually in a configuration that abolishes their mutual effects. Importantly, most of the research on the clinical significance of SNP polymorphism has not simultaneously investigated the length polymorphisms, so it cannot be ruled out that the described differences, attributed to the certain SNP, could have in fact resulted from co-segregation of SNP with the specific subtypes of length promoter allelic variants which has a predominant role. Only the comparison of homozygous SS patients and homozygous AA or TT patients would fully answer the question. However, the coexistence of the SS alleles with the AA alleles is extremely rare [65], and in our study group there were no patients with such genotype. Due to this inconsistency and difficulties in SNP polymorphism interpretation, we postulate that only the GT microsatellite polymorphism can be considered clinically significant. Analyses carried out as a part of this work also proved the lack of clinical relevance of A(−413)T SNP variants, as there were no differences in RFS rate and A(−413)T SNP distribution among the studied groups.
In its important to note that the literature does not propose consistent classification of the (GT)n length polymorphism [48]—while some studies comprise to “short” category alleles shorter then 25, it was confirmed in molecular studies that promoter with less than 24 (GT) repeats shows both increased HO-1 basal promoter activity and elevated response to stimuli [46,47,49,50]. Hence, in this work, we also used the cut-off <24 GT as “short” category. However, after recalculation of data using cut-off point less than 25 GT, we also obtained a very similar distribution of results, since there were very few patients with the 24 GT allele (data not shown). In term of category “medium” and “long” the exact cut-off point varies even more between studies [46,47,50]. However, precise discrimination between these alleles does not bring any additional information, as it was confirmed that biologically important modulation of HO-1 activity depends on the presence of the short allele [49,66]. Hence, in this study, we also focused on the classification of HMOX1 promoter based on short and long alleles.
First, we examined the association of polymorphic variants of the HMOX1 promoter with RFS. We found that patients with the SS genotype display the poorest RFS, especially when compared with the LL genotype. The SL genotype displayed intermediate risk of relapse. We also analyzed the length polymorphisms in association with childhood ALL prevalence. We demonstrated that in comparison to the control group, in BCP-ALL patients both the S (GT)n allele frequency and the proportion of patients with at least one S allele (SS genotype combined with SL as one group) were higher. However, there was no difference in the proportion of patients and controls with the SS genotype. It indicates that short, more active variants of the HMOX1 promoter, not only do not protect against the initiation of leukogenesis, but on the contrary, may even promote carcinogenesis. Studies on the association between the HMOX1 promoter polymorphism and the prevalence of different types of cancer in humans are inconsistent, showing that the same allelic variants seem to be protective against one type of cancer, while posing high risk for other types [52,54,56,57,58,59,60,61,77,78,79]. Some discrepancies in the HMOX1 promoter polymorphisms and cancer prevalence may stem from a complex physiological role of HO-1, variability of its expression in different tissues (http://www.proteinatlas.org/ENSG00000100292-HMOX1/tissue), and cell-type specific effects of HO-1 on cell differentiation [44,80]. This is especially true for such a complex and heterogenous tissues as bone marrow, where HO-1 is differently expressed in hematopoietic stem and progenitor cells and niche residing cells [72,81].
Although HO-1 is known to be critical for proper antibody production [82] little is known about its function in early B-cells development. Interestingly, its suppressor—BACH2 which is up-regulated at the transition from multipotent progenitor (MPP) to the pro-B [71]—has been shown to execute negative selection of premalignant early B cells that failed VH-DJH rearrangements at the pre-B cell receptor checkpoint. As it was previously suggested that loss of BACH2 in both normal pre-B cells and pre-B ALL may lead to leukemia [83], one could expect that HO-1 would be in turn elevated in leukemic cells. However, we found even decreased level of HO-1 in leukemic blasts in comparison to normal B cells and to monocytes. In normal bone marrow cells HO-1 was present from the stage of HSC, through MPP till CLP and after commitment to B lineage (at preB-I stage) HO-1 was barely detectable till the stage of mature B-cell (in contrast to the progenitors committed to granulocyte or megakaryocyte lineage). These findings were also consistent with the observation made in a murine model, showing that Hmox1 mRNA level was extremely low at B-cell progenitor stage [72]. As HO-1 was almost undetectable at the stage which is most vulnerable to malignant transformation into BCP-ALL (the pre-pro-B to pre-BI transition [70]), and in the malignant cells its expression was very low, we doubt that HO-1 may play a significant role in protection of B progenitors from leukogenesis. Although it is highly unlikely that the presence of certain type of the promoter allelic variants affects HO-1 expression in B-cells and in leukemic blasts, it cannot be however, ruled out that HO-1 activity in stromal cells may indirectly affect B-cells e.g., through modulation of the level of free heme and iron availability in microenvironment [84,85].
HO-1 may be strongly induced in response to radiation, photodynamic therapy, or chemotherapy [33], pointing out the role of HO-1 in cancer chemoresistance [51]. As a better understanding of the mechanisms associated with resistance to therapy is essential to prevent tumor relapse, in the next step we checked the HMOX1 (GT)n genotype distribution within BCP-ALL patients, depending on their relapse-risk group. We found that the frequency of the S alleles was higher is the HR group compared to the control group, as well as to the SR group. Subjects possessing at least one S allele of the HMOX1 promoter were more frequently classified into the HR group than to the SR and IR groups. The HMOX1 SS (GT)n homozygous genotype occurred mostly in the HR group, and has not been observed in the SR group. Additionally, leukemic blasts evaluation revealed that patients from the IR group, who carried at least single S allele, exhibited higher MRD at the 33rd day of therapy, which is consistent with the fact that drug resistance in vivo is reflected by the MRD level [1,2,3]. However, because in another risk group and at day 15th we did not observe a similar relationship, this observation may be biologically irrelevant.
Interestingly, HO-1 overexpression has recently been reported to negatively modulate glucocorticoid receptor pathways in prostate cancer cells [86], and glucocorticoids (prednisone and dexamethasone) play an essential role in the treatment of acute lymphoblastic leukemia (ALL) [87]. In our study, we did not find a significant difference in prednisone response between patients with certain HMOX1 (GT)n genotype (data not shown). However, we showed that, in BCP-ALL children, chemotherapy upregulates HO-1 at both mRNA level (in total peripheral blood cells) and at protein level (selectively in monocytes and not lymphoid cells). Monocytes play an important role in mesenchymal stromal cell-driven immunomodulation. They differentiate into regulatory macrophages and produce many cytokines [88]. Therefore, we assume that HO-1 shifts in monocytes may also reflect macrophage polarization response and—to some extent—may represent shifts in stromal compartment. Hence, we speculate that unequal allelic variant distributions in BCP-ALL patients may be more important in stromal compartment. This supposition could be verified only by examination of trephine biopsy specimens, which are not taken routinely in ALL patients. Nevertheless, many studies have convincingly reported the role of HO-1 in tumor progression [74,89,90,91,92,93,94], pointing to its significance not only in tumor cells per se, but also in stromal compartment, particularly in the tumor-associated macrophages [95,96,97,98].
Interestingly, macrophages have also been shown to have a role in the mobilization of hematopoietic cells into the peripheral blood by G-CSF [99,100], and HO-1 induction has been reported to impair granulocyte mobilization [101]. Cytotoxic chemotherapy itself suppresses the hematopoietic system, dysregulating the physiological granulocyte proliferation and differentiation [102], and leading to chemotherapy-induced neutropenia (CIN) [11]. Hence, in the last step we investigated the effect of (GT)n microsatellite polymorphism on susceptibility to CIN incidents. We found that subjects with at least one short allele variant had significantly higher CIN incidents. Because different chemotherapeutic protocols are used depending on the risk group classification, we checked the length polymorphism distribution in BCP-ALL patients within different risk categories. However, only in the IR group did patients who carry at least single S allele reach a significantly elevated number of CIN incidents, most probably due to the fact that this group was the most numerous.
Under stress conditions, rapid enhancement of granulopoiesis is predominantly regulated by G-CSF-responsive transcription factor C/EBPβ [103]. C/EBPβ enhances proliferation [104], leading to fast adaptation of hematopoietic system to stress response [105]. A study by Suh et al. indicated that activity of C/EBP transcription factors can be inhibited by carbon monoxide (Suh, Jin et al. 2006), which was later confirmed by our group for C/EBPδ [44]. We have also shown a similar mechanism of indirect modulation of C/EBPβ in granulocytic development in HO-1 knock-out mice [45]. As HO-1 degrades heme with concurrent release of carbon monoxide, its increased expression governed by the short (GT)n variant of HMOX1 promoter, might indirectly influence granulocyte maturation and myelocyte proliferation via C/EBPβ mediated pathway. In line with these results, we suppose that short allelic variant of (GT)n HMOX1 promoter predisposes ALL patients to higher number of CIN incidents, and thus may help identify patients at greater risk for such complications. The suggested HO-1-dependent mechanism does not appear to be specific for certain drug, but is generally driven by oxidative stress, being one of the putative pathways that affect susceptibility to chemotherapy-induced myelosuppression.
Because genetic variations can be used to predict drug toxicity, safety, and efficacy [19,106], there have been attempts to identify patients at greater risk for CIN. Interestingly, genome-wide association studies (GWAS) performed in Japanese patients failed to identify genetic variants associated with CIN susceptibility that surpassed the genome-wide significance level [18]. However, only SNPs, but not microsatellite length polymorphisms, were investigated. Concordantly, in our study, we also did not find an association between SNP in the HMOX1 promoter and CIN incidences (data not shown).
The limitation of our research is the relatively small number of patients. However, as our main aim was to check the influence of the HMOX1 gene promoter polymorphisms on the treatment response and its toxicity, we selected a group of patients in whom the entire treatment protocol had been completed and the long follow-up data were available. Although this research brings some new data related to important therapeutic complications of ALL treatment, some of our results are of borderline statistical significance, hence they should be confirmed in larger study.
In summary, we described the effect of HO-1 and HMOX1 gene promoter polymorphisms on the ALL development, chemotherapy resistance and patient risk to CIN incidents. We found that only (GT)n microsatellite polymorphism, but not A(−413)T SNP, is of clinical relevance. The presence of the short (GT)n allelic variant of the HMOX1 promoter correlates with a higher risk and worse prognosis for ALL patients, and is associated with a higher rate of CIN incidents. Therefore, we propose that the presence of the short HMOX1 alleles might help identify the high-risk patients. It also appears that the potential use of HO-1 inhibitors might be considered as a supplementary strategy in the treatment of ALL.

4. Materials and Methods

4.1. Patients

The study group comprised of 60 children with BCP-ALL treated in the Oncology and Hematology Department at the University Children’s Hospital of Krakow, between 2007 and 2015 with ALL IC-BFM 2002 or ALL IC-BFM 2009 therapeutic protocols. Patients were stratified into standard (SR, 18 patients, 30%), intermediate (IR, 32 patients, 53.3%) or high risk group (HR, 10 patients, 16.7%) based on the response to chemotherapy and disease characteristics (i.a. genetic factors, prednisone response). Children who had developed chemotherapy-induced neutropenia (CIN) were treated with G-CSF 24 h following incident until the neutrophil count achieved the level of at least 1000/µL. G-CSF regime ranged from 3 days to a maximum of one week. The frequency of CIN incidences in each patient was recorded. The control group comprised 42 children. Control group was selected from children referred to immunological outpatient clinic with upper respiratory tract infections, in whom after routine clinical and laboratory follow-up immunodeficiency was excluded. The study was approved by the Bioethics Committee of the Jagiellonian University (KBET/76/B/2014, 24 April 2014) and informed consent was obtained for all patients.

4.2. Patients’ Samples

Peripheral blood (PB) and bone marrow (BM) of patients were analyzed. BM samples were analyzed at 15th and 33rd days of treatment to assess the minimal residual disease (MRD) by multicolor flow cytometry. PB samples were taken by the end of treatment to assess HMOX1 promoter polymorphisms and mRNA level.

4.3. DNA Isolation

DNA isolation was performed using Syngen Blood/Cell DNA Mini Kit according to the manufacturer protocol. Final DNA concentration was measured using NanoDrop spectrophotometric technique (Thermo Fisher Scientific, Wilmington, DE, USA).

4.4. Length HMOX1 Gene Promoter Polymorphism

In order to assess the number of (GT)n repeats in the HMOX1 promoter region PCR reaction was done using GoTaq®G2 Flexi DNA Polymerase Kit (Promega, Madison, WI, USA) and the following pair of primers was applied: Forward: 5′-AGA GCC TGC AGC TTC TCA GA-3′, Reverse: 5′-ACA AAG TCT GGC CAT AGG AC-3′, where forward primer was labeled with 6-carboxyfluoresceine (FAM). PCR reaction was conducted under following conditions: 95 °C for 60 s, 37 cycles of 95 °C for 30 s, 58 °C for 15 s, 73 °C for 30 s and final elongation 73 °C for 45 s. DNA fragments analysis was performed by capillary electrophoresis (ABI PRISIM® 310 Genetic Analyzer, Applied Biosystem, Foster City, CA, USA) with GeneScanTM 350 ROXTM dye Size Standard. Fragments sizes were determined with ABI Prism program (Gene Scan Analysis and Genotyper Software, Applied Biosystems, Foster City, CA, USA). In two patients from the SR group and in two patients from IR group, due to technical reasons it was impossible to determine length polymorphism, so data on length polymorphism are available for 56 children.

4.5. SNP HMOX1 Gene Promoter Polymorphism

For identification of SNP A(−413)T polymorphism PCR (GoTaq®G2 Flexi DNA Polymerase Kit (Promega, Madison, WI, USA)) was used with following primers and reaction conditions, Forward: 5′- GGA TGA ACC ATG AAA ATA CTA GAG TC-3′, Reverse: 5′-ATT TTG CTC CTT CCA GAG C-3′; 95 °C for 10 min, 34 cycles of 95 °C for 30 s, 56.1 °C for 30 s, 72 °C for 60 s and final elongation 72 °C for 10 min. To remove remaining primers and free nucleotides Exonuclease I treatment of PCR products was conducted using Exo-BAP Kit (Eurx, Gdańsk, Poland) for 15 min in 37 °C, followed by heat inactivation for 15 min in 80 °C. Sequencing PCR reaction was performed with BigDye® Terminator v3.1 Cycle Sequencing Kit under conditions: 95 °C for 10 min, 25 cycles of 95 °C for 10 s, 50 °C for 5 s and 60 °C for 4 min. PCR products purification was carried out with BigDye® X-Terminator Purification Kit (Applied Biosystems, Foster City, CA, USA). DNA fragments sequencing was analyzed by means of capillary electrophoresis AB3500 Genetic Analyzer (Life Technologies, HITACHI, Tokyo, Japan). In one patient from IR group, due to technical reasons, it was impossible to determine SNP polymorphism. Data on SNP polymorphism are available for 59 patients.

4.6. Cell Sorting, Immunofluorescent Staining and Confocal Analysis

In order to prepare immunofluorescence slides of certain hematopoietic stem or progenitor cell subsets, characterized elsewhere [68,107], normal BM samples were stained using following primary antibodies: Lin-FITC, CD90-PE, CD34-APC, CD38-AlexaFluor700, CD45-APC-H7, CD45RA-PE-Cy-7 or CD38-FITC, CD34-PE, CD19-APC, CD20-APC-H7 (BD Biosciences, San Jose, CA, USA). Cells of defined immunophenotype were sorted using MoFlo-XDP cell sorter (Beckman Coulter, Brea, CA, USA) into 20 mL PBS drops on poly-L-lysine coated slides. After settling, cells were fixed with 4% paraformaldehyde and permeabilized with 0.1% Triton X100. Afterwards, samples were incubated with 0.25% glycine for 30 min, followed by blocking with 3% BSA in PBS for 1 h. Subsequently, samples were stained overnight at 4 °C with primary antibodies recognizing HO-1 (rabbit polyclonal, SPA 896, Enzo, Warszawa, Poland) in a moisture chamber. After 5 washing steps, slides were incubated with goat anti-rabbit secondary antibody conjugated with Alexa Fluor 488 (Life technologies, Carlsbad, CA, USA) and DAPI for 1 h in darkness. After the next 5 washing steps, cells were analyzed using a Zeiss confocal microscope with ZEN Software (Zeiss, Oberkochen, Germany).

4.7. RNA Isolation, qRT-PCR

RNA isolation was performed using RNeasy® Mini Kit. Reverse transcription and polyadenylation reaction were carried out with NCode™ VILO™ miRNA cDNA Synthesis Kit (Life Technologies, Carlsbad, CA, USA). Quantitative PCR reaction was conducted with StepOne Plus cycler (Applied Biosystems, Foster City, CA, USA) and SYBR Green JumpStart™ Taq ReadyMix™ (Sigma-Aldrich, St. Louis, MO, USA) under the following conditions: 95 °C for 10 min, 40 cycles of 95 °C for 30 s (denaturation), 60 °C for 60 s (starters annealing), 72 °C for 45 s (elongation) and 72 °C for 10 min (final elongation). The following primers were used: for HMOX-1 Forward: 5′-TTC TTC ACC TTC CCC AAC ATT G-3′, Reverse: 5′-CAG CTC CTG CAA CTC CTC AAA-3′, and for EF-2 Forward 5′-GAG ATC CAG TGT CCA GAG CAG-3′, Reverse 5′-CTC GTT GAC GGG CAG ATA GG-3′ as an endogenous control.

4.8. MRD Detection Using Flow Cytometry

Multicolor flow cytometry analysis of BM was performed at the day of diagnosis to assess leukemic-associated immunophenotype (LAIP) of blasts cells. A following antibodies were used for cell immunophenotyping: CD34-PE, CD45-PerCP, CD10-PE-Cy7, CD19-APC, CD38-AlexaFluor-700, CD20-APC H7, CD11a-BV510 (BD Biosciences, Waltham, MA, USA), CD58 (Beckman Coulter, Brea, CA, USA). On the day 15th and 33rd BM was analyzed using the same panel of antibodies to determine MRD. To the appropriate amount of BM (106 cells) antibodies listed above were added, samples were incubated for 20 min at room temperature in darkness. Erythrocytes were lysed for 10 min at room temperature in darkness with lysing solution (BD FACS Lysing Solution, Becton Dickinson Biosciences, San Jose, CA, USA), washed twice in PBS, and finally resuspended in 200 μL of PBS. For distinguishing nucleated cells, samples were stained with Syto®41 (Thermo Fisher Scientific, Waltham, MA, USA). FACS analysis was done using FACSCanto or FACSCanto10 with FACSDiva Sorfware v. 8.1 (Becton Dickinson Biosciences, San Jose, CA, USA).

4.9. HO-1 Detection Using Flow Cytometry

HO-1 expression was assessed in BM of 11 patients upon diagnosis. Then in patients in whom, after routine MRD staining, there was a sufficient material for additional staining, an intracellular HO-1 staining was performed (6 children at day 15, 3 children at day 33). In this purpose 106 of bone marrow cells were stained with CD34-PE, CD45-PerCP, CD10-PE-Cy7, CD19-APC, CD38-AlexaFluor-700, CD20-APC H7, CD11a-BV510 (BD Biosciences, San Jose, CA, USA), lysed, fixed, and then permeabilized using a BD Intrasure Kit, according to the manufacturer’s instructions. After permeabilization step, cells were incubated with primary antibodies recognizing HO-1 (rabbit polyclonal, SPA 896, Enzo, Warszawa, Poland), washed twice, and stained with goat anti-rabbit secondary antibody conjugated with Alexa Fluor 488 (Life technologies, HITACHI, Tokyo, Japan). After two washing steps, samples were stained with Syto®41 (Thermo Fisher Scientific, Waltham, MA, USA) and analyzed using FACSCanto10 with FACSDiva Sorfware v 8.0.1 (Becton Dickinson Biosciences, San Jose, CA, USA).

4.10. Statistical Analysis

The results were analyzed using GraphPad Prism 7 software (GraphPad Software, San Diego, CA, USA). Relapse-free survival (RFS) curves were drawn with Kaplan–Meier methods, and differences in curves were analyzed using the log-rank (Mantel–Cox) test. To determine whether there is a significant difference between the observed frequencies in HMOX1 polymorphisms the Fisher’s exact test was used. To compare the distribution between the two groups, the Mann–Whitney U test was used. To examine the influence of two different independent variables (a genotype and a risk group) on a number of CIN incidents, two-way analysis of variance was applied. Differences were considered statistically significant if the significance level (p) was less than 0.05.

Supplementary Materials

Supplementary Materials can be found at https://0-www-mdpi-com.brum.beds.ac.uk/1422-0067/22/3/988/s1. Supplementary Figure S1. Distribution of length polymorphisms in control and patients, presented as actual number of GT repeats. Supplementary Figure S2. Electropherograms showing A(-413)T SNP polymorphisms. Supplementary Figure S3. (A) A and T alleles frequencies in patient and control group. In ALL patients: 64 A alleles (54.2%) and 54 T alleles (45.8%); in control group: 26 A alleles(58.1%) and 26 T alleles (41.9%), (B) Comparison of percentage of patients and controls having at least one A allele to TT genotype. In ALL patients: AA and AT genotype: 47patients (79.7%), TT genotype: 12 patients (20.3%); in control group: AA and AT genotype: 24 individuals (77.4%), TT genotype: 7 individuals (22.6%), (C) Comparison ofpercentage of patients and controls with AA genotype. In ALL patients: AA genotype: 17patients (28.8%), AT and TT genotype: 42 patients (71.2%); in control group: AA genotype: 12 individuals (38.7%), AT and TT genotype: 19 individuals (61.3%). Supplementary Figure S4. (A) A and T alleles frequencies in control group and in patients stratified intoparticular risk group. In SR group: 21 A alleles (58.3%) and 15 T alleles (41,7%); IR group: 35 Aalleles (56.5%) and 27 T alleles (43.5%); HR group: 8 A alleles (40%) and 12 T alleles (60%). (B) Comparison of percentage of individuals having at least one A allele to TT genotype, alike incontrols and in patient stratified into particular risk groups. In SR group: AA and AT genotype: 15patients (83.3%), TT genotype: 3 patients (16.7%); in IR group: AA and AT genotype: 26 patients(83.9%), TT genotype: 5 patients (16.1%); in HR group: AA and AT genotype: 6 patients (60%), TT genotype: 4 patients (40%). (C) Comparison of percentage of individuals with AA genotype alike in controls and in patient stratified into particular risk groups. In SR group: AA genotype: 6 patients(33.3%), AT and TT genotype: 12 patients (66.6%); in IR group: AA genotype: 9 patients (29%), ATand TT genotype: 22 patients (71%); in HR group: AA genotype: 2 patients (20%), AT and TT genotype: 8 patients (80%).

Author Contributions

Conceptualization: K.B.-S. and A.J.; formal analysis: K.B.-S. and A.J.; investigation: K.B.-S., J.W., E.P., A.K.-C., M.C., M.G., A.W., and K.P.-W.; methodology: W.N.; writing of original draft: K.B.-S., A.J., and M.K.; supervision: A.J. and M.S. All authors have read and agreed to the published version of the manuscript.

Funding

This work was supported by grant Parent-Bridge Programme: POMOST/2013-8/2 (KBS), Jagiellonian University grant: K/DSC/002037 (KBS) and grant Harmonia Program: NCN 2015/18/M/NZ3/00387 (A.J.).

Institutional Review Board Statement

The study was conducted according to the guidelines of the Declaration of Helsinki, and approved by the Bioethics Committee of Jagiellonian University (protocol code KBET/76/B/2014, date of approval 24 April 2014).

Informed Consent Statement

Informed consent was obtained from all subjects involved in the study.

Data Availability Statement

The data presented in this study are available on request from the corresponding author.

Conflicts of Interest

The authors declare no conflict of interest.

References

  1. Hunger, S.P.; Mullighan, C.G. Acute Lymphoblastic Leukemia in Children. N. Engl. J. Med. 2015, 373, 1541–1552. [Google Scholar] [CrossRef] [Green Version]
  2. Campana, D. Minimal residual disease in acute lymphoblastic leukemia. Hematol. Am. Soc. Hematol. Educ. Program 2010, 2010, 7–12. [Google Scholar] [CrossRef] [PubMed] [Green Version]
  3. Curran, E.; Stock, W. How I treat acute lymphoblastic leukemia in older adolescents and young adults. Blood 2015, 125, 3702–3710. [Google Scholar] [CrossRef] [PubMed]
  4. Flohr, T.; Schrauder, A.; Cazzaniga, G.; Panzer-Grumayer, R.; van der Velden, V.; Fischer, S.; Stanulla, M.; Basso, G.; Niggli, F.K.; Schafer, B.W.; et al. Minimal residual disease-directed risk stratification using real-time quantitative PCR analysis of immunoglobulin and T-cell receptor gene rearrangements in the international multicenter trial AIEOP-BFM ALL 2000 for childhood acute lymphoblastic leukemia. Leukemia 2008, 22, 771–782. [Google Scholar] [CrossRef] [PubMed] [Green Version]
  5. Pui, C.H.; Yang, J.J.; Hunger, S.P.; Pieters, R.; Schrappe, M.; Biondi, A.; Vora, A.; Baruchel, A.; Silverman, L.B.; Schmiegelow, K.; et al. Childhood Acute Lymphoblastic Leukemia: Progress Through Collaboration. J. Clin. Oncol. 2015, 33, 2938–2948. [Google Scholar] [CrossRef]
  6. Tasian, S.K.; Hunger, S.P. Genomic characterization of paediatric acute lymphoblastic leukaemia: An opportunity for precision medicine therapeutics. Br. J. Haematol. 2017, 176, 867–882. [Google Scholar] [CrossRef]
  7. Chessells, J.M.; Veys, P.; Kempski, H.; Henley, P.; Leiper, A.; Webb, D.; Hann, I.M. Long-term follow-up of relapsed childhood acute lymphoblastic leukaemia. Br. J. Haematol. 2003, 123, 396–405. [Google Scholar] [CrossRef]
  8. Pui, C.H.; Evans, W.E. Treatment of acute lymphoblastic leukemia. N. Engl. J. Med. 2006, 354, 166–178. [Google Scholar] [CrossRef]
  9. Nguyen, K.; Devidas, M.; Cheng, S.C.; La, M.; Raetz, E.A.; Carroll, W.L.; Winick, N.J.; Hunger, S.P.; Gaynon, P.S.; Loh, M.L. Factors influencing survival after relapse from acute lymphoblastic leukemia: A Children’s Oncology Group study. Leukemia 2008, 22, 2142–2150. [Google Scholar] [CrossRef] [Green Version]
  10. Siegel, R.L.; Miller, K.D.; Jemal, A. Cancer statistics, 2016. Cancer J. Clin. 2016, 66, 7–30. [Google Scholar] [CrossRef] [Green Version]
  11. Umerez, M.; Garcia-Obregon, S.; Martin-Guerrero, I.; Astigarraga, I.; Gutierrez-Camino, A.; Garcia-Orad, A. Role of miRNAs in treatment response and toxicity of childhood acute lymphoblastic leukemia. Pharmacogenomics 2018, 19, 361–373. [Google Scholar] [CrossRef]
  12. Lyman, G.H. Chemotherapy dose intensity and quality cancer care. Oncology 2006, 20, 16–25. [Google Scholar] [PubMed]
  13. Beveridge, R.A.; Miller, J.A.; Kales, A.N.; Binder, R.A.; Robert, N.J.; Harvey, J.H.; Windsor, K.; Gore, I.; Cantrell, J.; Thompson, K.A.; et al. A comparison of efficacy of sargramostim (yeast-derived RhuGM-CSF) and filgrastim (bacteria-derived RhuG-CSF) in the therapeutic setting of chemotherapy-induced myelosuppression. Cancer Investig. 1998, 16, 366–373. [Google Scholar] [CrossRef]
  14. Hassan, B.A.; Yusoff, Z.B.; Othman, S.B. Filgrastim and antibiotics treatment reduces neutropenia severity in solid cancer patients. Asian Pac. J. Cancer Prev. 2009, 10, 641–644. [Google Scholar] [PubMed]
  15. Lyman, G.H.; Lyman, C.H.; Agboola, O. Risk models for predicting chemotherapy-induced neutropenia. Oncology 2005, 10, 427–437. [Google Scholar] [CrossRef] [PubMed] [Green Version]
  16. van der Slot, A.J.; Zuurmond, A.M.; Bardoel, A.F.; Wijmenga, C.; Pruijs, H.E.; Sillence, D.O.; Brinckmann, J.; Abraham, D.J.; Black, C.M.; Verzijl, N.; et al. Identification of PLOD2 as telopeptide lysyl hydroxylase, an important enzyme in fibrosis. J. Biol. Chem. 2003, 278, 40967–40972. [Google Scholar] [CrossRef] [PubMed] [Green Version]
  17. Innocenti, R.; Rigacci, L.; Restelli, U.; Scappini, B.; Gianfaldoni, G.; Fanci, R.; Mannelli, F.; Scolari, F.; Croce, D.; Bonizzoni, E.; et al. Lenograstim and filgrastim in the febrile neutropenia prophylaxis of hospitalized patients: Efficacy and cost of the prophylaxis in a retrospective survey. J. Blood Med. 2019, 10, 21–27. [Google Scholar] [CrossRef] [Green Version]
  18. Low, S.K.; Chung, S.; Takahashi, A.; Zembutsu, H.; Mushiroda, T.; Kubo, M.; Nakamura, Y. Genome-wide association study of chemotherapeutic agent-induced severe neutropenia/leucopenia for patients in Biobank Japan. Cancer Sci. 2013, 104, 1074–1082. [Google Scholar] [CrossRef] [PubMed]
  19. Gatti, D.M.; Weber, S.N.; Goodwin, N.C.; Lammert, F.; Churchill, G.A. Genetic background influences susceptibility to chemotherapy-induced hematotoxicity. Pharm. J. 2018, 18, 319–330. [Google Scholar] [CrossRef]
  20. Fu, J.; Si, L.; Zhuang, Y.; Zhang, A.; Sun, N.; Li, D.; Hao, B.; Ju, X. Wnt/betacatenin inhibition reverses multidrug resistance in pediatric acute lymphoblastic leukemia. Oncol. Rep. 2019, 41, 1387–1394. [Google Scholar] [CrossRef] [Green Version]
  21. Simizu, S.; Takada, M.; Umezawa, K.; Imoto, M. Requirement of caspase-3(-like) protease-mediated hydrogen peroxide production for apoptosis induced by various anticancer drugs. J. Biol. Chem. 1998, 273, 26900–26907. [Google Scholar] [CrossRef] [PubMed] [Green Version]
  22. Matsura, T.; Kai, M.; Fujii, Y.; Ito, H.; Yamada, K. Hydrogen peroxide-induced apoptosis in HL-60 cells requires caspase-3 activation. Free Radic. Res. 1999, 30, 73–83. [Google Scholar] [CrossRef] [PubMed]
  23. Yamakawa, H.; Ito, Y.; Naganawa, T.; Banno, Y.; Nakashima, S.; Yoshimura, S.; Sawada, M.; Nishimura, Y.; Nozawa, Y.; Sakai, N. Activation of caspase-9 and -3 during H2O2-induced apoptosis of PC12 cells independent of ceramide formation. Neurol. Res. 2000, 22, 556–564. [Google Scholar] [CrossRef] [PubMed]
  24. Ren, J.G.; Xia, H.L.; Just, T.; Dai, Y.R. Hydroxyl radical-induced apoptosis in human tumor cells is associated with telomere shortening but not telomerase inhibition and caspase activation. FEBS Lett. 2001, 488, 123–132. [Google Scholar] [CrossRef] [Green Version]
  25. Skonieczna, M.; Hejmo, T.; Poterala-Hejmo, A.; Cieslar-Pobuda, A.; Buldak, R.J. NADPH Oxidases: Insights into Selected Functions and Mechanisms of Action in Cancer and Stem Cells. Oxidative Med. Cell. Longev. 2017, 2017, 9420539. [Google Scholar] [CrossRef]
  26. Berberat, P.O.; Dambrauskas, Z.; Gulbinas, A.; Giese, T.; Giese, N.; Kunzli, B.; Autschbach, F.; Meuer, S.; Buchler, M.W.; Friess, H. Inhibition of heme oxygenase-1 increases responsiveness of pancreatic cancer cells to anticancer treatment. Clin. Cancer Res. 2005, 11, 3790–3798. [Google Scholar] [CrossRef] [Green Version]
  27. Chen, S.; Wang, J.; Fang, Q.; Gao, R.; Shi, Q.; Zhang, H.; Zhao, J. Upregulated heme oxygenase-1 expression of mouse mesenchymal stem cells resists to chemotherapy-induced bone marrow suppression. Chin. Med. J. 2014, 127, 1310–1316. [Google Scholar]
  28. Yang, Y.C.; Huang, Y.T.; Hsieh, C.W.; Yang, P.M.; Wung, B.S. Carbon monoxide induces heme oxygenase-1 to modulate STAT3 activation in endothelial cells via S-glutathionylation. PLoS ONE 2014, 9, e100677. [Google Scholar] [CrossRef]
  29. Zhe, N.; Wang, J.; Chen, S.; Lin, X.; Chai, Q.; Zhang, Y.; Zhao, J.; Fang, Q. Heme oxygenase-1 plays a crucial role in chemoresistance in acute myeloid leukemia. Hematology 2015, 20, 384–391. [Google Scholar] [CrossRef]
  30. Kuwano, A.; Ikeda, H.; Takeda, K.; Nakai, H.; Kondo, I.; Shibahara, S. Mapping of the human gene for inducible heme oxygenase to chromosome 22q12. Tohoku J. Exp. Med. 1994, 172, 389–392. [Google Scholar] [CrossRef] [Green Version]
  31. Grochot-Przeczek, A.; Dulak, J.; Jozkowicz, A. Haem oxygenase-1: Non-canonical roles in physiology and pathology. Clin. Sci. 2012, 122, 93–103. [Google Scholar] [CrossRef] [PubMed] [Green Version]
  32. Deshane, J.; Chen, S.; Caballero, S.; Grochot-Przeczek, A.; Was, H.; Li Calzi, S.; Lach, R.; Hock, T.D.; Chen, B.; Hill-Kapturczak, N.; et al. Stromal cell-derived factor 1 promotes angiogenesis via a heme oxygenase 1-dependent mechanism. J. Exp. Med. 2007, 204, 605–618. [Google Scholar] [CrossRef] [PubMed]
  33. Jozkowicz, A.; Was, H.; Dulak, J. Heme oxygenase-1 in tumors: Is it a false friend? Antioxid. Redox Signal. 2007, 9, 2099–2117. [Google Scholar] [CrossRef] [PubMed] [Green Version]
  34. Was, H.; Sokolowska, M.; Sierpniowska, A.; Dominik, P.; Skrzypek, K.; Lackowska, B.; Pratnicki, A.; Grochot-Przeczek, A.; Taha, H.; Kotlinowski, J.; et al. Effects of heme oxygenase-1 on induction and development of chemically induced squamous cell carcinoma in mice. Free Radic. Biol. Med. 2011, 51, 1717–1726. [Google Scholar] [CrossRef] [Green Version]
  35. Na, H.K.; Surh, Y.J. Oncogenic potential of Nrf2 and its principal target protein heme oxygenase-1. Free Radic. Biol. Med. 2014, 67, 353–365. [Google Scholar] [CrossRef]
  36. Nowis, D.; Legat, M.; Grzela, T.; Niderla, J.; Wilczek, E.; Wilczynski, G.M.; Glodkowska, E.; Mrowka, P.; Issat, T.; Dulak, J.; et al. Heme oxygenase-1 protects tumor cells against photodynamic therapy-mediated cytotoxicity. Oncogene 2006, 25, 3365–3374. [Google Scholar] [CrossRef] [Green Version]
  37. Furchgott, R.F.; Jothianandan, D. Endothelium-dependent and -independent vasodilation involving cyclic GMP: Relaxation induced by nitric oxide, carbon monoxide and light. Blood Vessel. 1991, 28, 52–61. [Google Scholar] [CrossRef]
  38. Morita, T.; Kourembanas, S. Endothelial cell expression of vasoconstrictors and growth factors is regulated by smooth muscle cell-derived carbon monoxide. J. Clin. Investig. 1995, 96, 2676–2682. [Google Scholar] [CrossRef]
  39. Morita, T.; Mitsialis, S.A.; Koike, H.; Liu, Y.; Kourembanas, S. Carbon monoxide controls the proliferation of hypoxic vascular smooth muscle cells. J. Biol. Chem. 1997, 272, 32804–32809. [Google Scholar] [CrossRef] [Green Version]
  40. Morita, T.; Perrella, M.A.; Lee, M.E.; Kourembanas, S. Smooth muscle cell-derived carbon monoxide is a regulator of vascular cGMP. Proc. Natl. Acad. Sci. USA 1995, 92, 1475–1479. [Google Scholar] [CrossRef] [Green Version]
  41. Durante, W.; Schafer, A.I. Carbon monoxide and vascular cell function (review). Int. J. Mol. Med. 1998, 2, 255–262. [Google Scholar] [CrossRef] [PubMed]
  42. Ryter, S.W.; Otterbein, L.E.; Morse, D.; Choi, A.M. Heme oxygenase/carbon monoxide signaling pathways: Regulation and functional significance. Mol. Cell. Biochem. 2002, 234-235, 249–263. [Google Scholar] [CrossRef]
  43. Bilban, M.; Haschemi, A.; Wegiel, B.; Chin, B.Y.; Wagner, O.; Otterbein, L.E. Heme oxygenase and carbon monoxide initiate homeostatic signaling. J. Mol. Med. 2008, 86, 267–279. [Google Scholar] [CrossRef]
  44. Kozakowska, M.; Szade, K.; Dulak, J.; Jozkowicz, A. Role of heme oxygenase-1 in postnatal differentiation of stem cells: A possible cross-talk with microRNAs. Antioxid. Redox Signal. 2014, 20, 1827–1850. [Google Scholar] [CrossRef] [PubMed] [Green Version]
  45. Bukowska-Strakova, K.; Ciesla, M.; Szade, K.; Nowak, W.N.; Straka, R.; Szade, A.; Tyszka-Czochara, M.; Najder, K.; Konturek, A.; Siedlar, M.; et al. Heme oxygenase 1 affects granulopoiesis in mice through control of myelocyte proliferation. Immunobiology 2017, 222, 506–517. [Google Scholar] [CrossRef] [PubMed]
  46. Exner, M.; Minar, E.; Wagner, O.; Schillinger, M. The role of heme oxygenase-1 promoter polymorphisms in human disease. Free Radic. Biol. Med. 2004, 37, 1097–1104. [Google Scholar] [CrossRef] [PubMed]
  47. Yamada, N.; Yamaya, M.; Okinaga, S.; Nakayama, K.; Sekizawa, K.; Shibahara, S.; Sasaki, H. Microsatellite polymorphism in the heme oxygenase-1 gene promoter is associated with susceptibility to emphysema. Am. J. Hum. Genet. 2000, 66, 187–195. [Google Scholar] [CrossRef] [Green Version]
  48. Kaplan, M.; Wong, R.J.; Stevenson, D.K. Heme oxygenase-1 promoter polymorphisms: Do they modulate neonatal hyperbilirubinemia? J. Perinatol. Off. J. Calif. Perinat. Assoc. 2017, 37, 901–905. [Google Scholar] [CrossRef]
  49. Taha, H.; Skrzypek, K.; Guevara, I.; Nigisch, A.; Mustafa, S.; Grochot-Przeczek, A.; Ferdek, P.; Was, H.; Kotlinowski, J.; Kozakowska, M.; et al. Role of heme oxygenase-1 in human endothelial cells: Lesson from the promoter allelic variants. Arterioscler. Thromb. Vasc. Biol. 2010, 30, 1634–1641. [Google Scholar] [CrossRef] [Green Version]
  50. Chen, Y.H.; Lin, S.J.; Lin, M.W.; Tsai, H.L.; Kuo, S.S.; Chen, J.W.; Charng, M.J.; Wu, T.C.; Chen, L.C.; Ding, Y.A.; et al. Microsatellite polymorphism in promoter of heme oxygenase-1 gene is associated with susceptibility to coronary artery disease in type 2 diabetic patients. Hum. Genet. 2002, 111, 1–8. [Google Scholar] [CrossRef]
  51. Hirai, H.; Kubo, H.; Yamaya, M.; Nakayama, K.; Numasaki, M.; Kobayashi, S.; Suzuki, S.; Shibahara, S.; Sasaki, H. Microsatellite polymorphism in heme oxygenase-1 gene promoter is associated with susceptibility to oxidant-induced apoptosis in lymphoblastoid cell lines. Blood 2003, 102, 1619–1621. [Google Scholar] [CrossRef] [PubMed]
  52. Kikuchi, A.; Yamaya, M.; Suzuki, S.; Yasuda, H.; Kubo, H.; Nakayama, K.; Handa, M.; Sasaki, T.; Shibahara, S.; Sekizawa, K.; et al. Association of susceptibility to the development of lung adenocarcinoma with the heme oxygenase-1 gene promoter polymorphism. Hum. Genet. 2005, 116, 354–360. [Google Scholar] [CrossRef] [PubMed]
  53. Andersen, V.; Christensen, J.; Overvad, K.; Tjonneland, A.; Vogel, U. Heme oxygenase-1 polymorphism is not associated with risk of colorectal cancer: A Danish prospective study. Eur. J. Gastroenterol. Hepatol. 2011, 23, 282–285. [Google Scholar] [CrossRef] [PubMed]
  54. Murakami, A.; Fujimori, Y.; Yoshikawa, Y.; Yamada, S.; Tamura, K.; Hirayama, N.; Terada, T.; Kuribayashi, K.; Tabata, C.; Fukuoka, K.; et al. Heme oxygenase-1 promoter polymorphism is associated with risk of malignant mesothelioma. Lung 2012, 190, 333–337. [Google Scholar] [CrossRef] [PubMed]
  55. Daenen, K.E.; Martens, P.; Bammens, B. Association of HO-1 (GT)n Promoter Polymorphism and Cardiovascular Disease: A Reanalysis of the Literature. Can. J. Cardiol. 2016, 32, 160–168. [Google Scholar] [CrossRef]
  56. Wang, R.; Shen, J.; Yang, R.; Wang, W.G.; Yuan, Y.; Guo, Z.H. Association between heme oxygenase-1 gene promoter polymorphisms and cancer susceptibility: A meta-analysis. Biomed. Rep. 2018, 8, 241–248. [Google Scholar] [CrossRef] [Green Version]
  57. Chang, K.W.; Lee, T.C.; Yeh, W.I.; Chung, M.Y.; Liu, C.J.; Chi, L.Y.; Lin, S.C. Polymorphism in heme oxygenase-1 (HO-1) promoter is related to the risk of oral squamous cell carcinoma occurring on male areca chewers. Br. J. Cancer 2004, 91, 1551–1555. [Google Scholar] [CrossRef] [Green Version]
  58. Hong, C.C.; Ambrosone, C.B.; Ahn, J.; Choi, J.Y.; McCullough, M.L.; Stevens, V.L.; Rodriguez, C.; Thun, M.J.; Calle, E.E. Genetic variability in iron-related oxidative stress pathways (Nrf2, NQ01, NOS3, and HO-1), iron intake, and risk of postmenopausal breast cancer. Cancer Epidemiol. Biomark. Prev. 2007, 16, 1784–1794. [Google Scholar] [CrossRef] [Green Version]
  59. Lo, S.S.; Lin, S.C.; Wu, C.W.; Chen, J.H.; Yeh, W.I.; Chung, M.Y.; Lui, W.Y. Heme oxygenase-1 gene promoter polymorphism is associated with risk of gastric adenocarcinoma and lymphovascular tumor invasion. Ann. Surg. Oncol. 2007, 14, 2250–2256. [Google Scholar] [CrossRef]
  60. Hu, J.L.; Li, Z.Y.; Liu, W.; Zhang, R.G.; Li, G.L.; Wang, T.; Ren, J.H.; Wu, G. Polymorphism in heme oxygenase-1 (HO-1) promoter and alcohol are related to the risk of esophageal squamous cell carcinoma on Chinese males. Neoplasma 2010, 57, 86–92. [Google Scholar] [CrossRef] [Green Version]
  61. Okamoto, I.; Krogler, J.; Endler, G.; Kaufmann, S.; Mustafa, S.; Exner, M.; Mannhalter, C.; Wagner, O.; Pehamberger, H. A microsatellite polymorphism in the heme oxygenase-1 gene promoter is associated with risk for melanoma. Int. J. Cancer 2006, 119, 1312–1315. [Google Scholar] [CrossRef] [PubMed]
  62. Ono, K.; Goto, Y.; Takagi, S.; Baba, S.; Tago, N.; Nonogi, H.; Iwai, N. A promoter variant of the heme oxygenase-1 gene may reduce the incidence of ischemic heart disease in Japanese. Atherosclerosis 2004, 173, 315–319. [Google Scholar] [CrossRef] [PubMed]
  63. Buis, C.I.; van der Steege, G.; Visser, D.S.; Nolte, I.M.; Hepkema, B.G.; Nijsten, M.; Slooff, M.J.; Porte, R.J. Heme oxygenase-1 genotype of the donor is associated with graft survival after liver transplantation. Am. J. Transplant. 2008, 8, 377–385. [Google Scholar] [CrossRef] [PubMed]
  64. Luo, H.; Shao, Y.; Yao, N.; Chen, X.; Hu, L.; He, T. Association of heme oxygenase-1 polymorphisms with cancer risk: A systematic review and meta-analysis. J. Balk. Union Oncol. 2015, 20, 1142–1153. [Google Scholar]
  65. Bean, C.J.; Boulet, S.L.; Ellingsen, D.; Pyle, M.E.; Barron-Casella, E.A.; Casella, J.F.; Payne, A.B.; Driggers, J.; Trau, H.A.; Yang, G.; et al. Heme oxygenase-1 gene promoter polymorphism is associated with reduced incidence of acute chest syndrome among children with sickle cell disease. Blood 2012, 120, 3822–3828. [Google Scholar] [CrossRef] [PubMed] [Green Version]
  66. Zhang, Z.Y.; Guan, J.; Li, H.; Zhou, Z.Q.; Zhou, G.W. Heme Oxygenase-1 Promoter Polymorphism Protects Liver Allograft. Indian J. Surg. 2016, 78, 14–19. [Google Scholar] [CrossRef] [PubMed] [Green Version]
  67. Rueda, B.; Oliver, J.; Robledo, G.; Lopez-Nevot, M.A.; Balsa, A.; Pascual-Salcedo, D.; Gonzalez-Gay, M.A.; Gonzalez-Escribano, M.F.; Martin, J. HO-1 promoter polymorphism associated with rheumatoid arthritis. Arthritis Rheum. 2007, 56, 3953–3958. [Google Scholar] [CrossRef]
  68. Seita, J.; Weissman, I.L. Hematopoietic stem cell: Self-renewal versus differentiation. Wiley Interdiscip. Rev. Syst. Biol. Med. 2010, 2, 640–653. [Google Scholar] [CrossRef] [Green Version]
  69. Vanella, L.; Barbagallo, I.; Tibullo, D.; Forte, S.; Zappala, A.; Li Volti, G. The non-canonical functions of the heme oxygenases. Oncotarget 2016, 7, 69075–69086. [Google Scholar] [CrossRef] [Green Version]
  70. Good, Z.; Sarno, J.; Jager, A.; Samusik, N.; Aghaeepour, N.; Simonds, E.F.; White, L.; Lacayo, N.J.; Fantl, W.J.; Fazio, G.; et al. Single-cell developmental classification of B cell precursor acute lymphoblastic leukemia at diagnosis reveals predictors of relapse. Nat. Med. 2018, 24, 474–483. [Google Scholar] [CrossRef]
  71. Swaminathan, S.; Duy, C.; Muschen, M. BACH2-BCL6 balance regulates selection at the pre-B cell receptor checkpoint. Trends Immunol. 2014, 35, 131–137. [Google Scholar] [CrossRef] [PubMed] [Green Version]
  72. Seita, J.; Sahoo, D.; Rossi, D.J.; Bhattacharya, D.; Serwold, T.; Inlay, M.A.; Ehrlich, L.I.; Fathman, J.W.; Dill, D.L.; Weissman, I.L. Gene Expression Commons: An open platform for absolute gene expression profiling. PLoS ONE 2012, 7, e40321. [Google Scholar] [CrossRef] [PubMed]
  73. Nitti, M.; Piras, S.; Marinari, U.M.; Moretta, L.; Pronzato, M.A.; Furfaro, A.L. HO-1 Induction in Cancer Progression: A Matter of Cell Adaptation. Antioxidants 2017, 6, 29. [Google Scholar] [CrossRef] [PubMed]
  74. Maines, M.D. Heme oxygenase: Function, multiplicity, regulatory mechanisms, and clinical applications. FASEB J. 1988, 2, 2557–2568. [Google Scholar] [CrossRef] [PubMed] [Green Version]
  75. Alam, J.; Cook, J.L. How many transcription factors does it take to turn on the heme oxygenase-1 gene? Am. J. Respir. Cell Mol. Biol. 2007, 36, 166–174. [Google Scholar] [CrossRef]
  76. Zhang, M.M.; Zheng, Y.Y.; Gao, Y.; Zhang, J.Z.; Liu, F.; Yang, Y.N.; Li, X.M.; Ma, Y.T.; Xie, X. Heme oxygenase-1 gene promoter polymorphisms are associated with coronary heart disease and restenosis after percutaneous coronary intervention: A meta-analysis. Oncotarget 2016, 7, 83437–83450. [Google Scholar] [CrossRef] [Green Version]
  77. Sawa, T.; Mounawar, M.; Tatemichi, M.; Gilibert, I.; Katoh, T.; Ohshima, H. Increased risk of gastric cancer in Japanese subjects is associated with microsatellite polymorphisms in the heme oxygenase-1 and the inducible nitric oxide synthase gene promoters. Cancer Lett. 2008, 269, 78–84. [Google Scholar] [CrossRef]
  78. Vashist, Y.K.; Uzungolu, G.; Kutup, A.; Gebauer, F.; Koenig, A.; Deutsch, L.; Zehler, O.; Busch, P.; Kalinin, V.; Izbicki, J.R.; et al. Heme oxygenase-1 germ line GTn promoter polymorphism is an independent prognosticator of tumor recurrence and survival in pancreatic cancer. J. Surg. Oncol. 2011, 104, 305–311. [Google Scholar] [CrossRef]
  79. Chau, L.Y. Heme oxygenase-1: Emerging target of cancer therapy. J. Biomed. Sci. 2015, 22, 22. [Google Scholar] [CrossRef] [Green Version]
  80. Ciesla, M.; Marona, P.; Kozakowska, M.; Jez, M.; Seczynska, M.; Loboda, A.; Bukowska-Strakova, K.; Szade, A.; Walawender, M.; Kusior, M.; et al. Heme Oxygenase-1 Controls an HDAC4-miR-206 Pathway of Oxidative Stress in Rhabdomyosarcoma. Cancer Res. 2016, 76, 5707–5718. [Google Scholar] [CrossRef] [Green Version]
  81. Szade, K.; Zukowska, M.; Szade, A.; Nowak, W.; Skulimowska, I.; Ciesla, M.; Bukowska-Strakova, K.; Gulati, G.S.; Kachamakova-Trojanowska, N.; Kusienicka, A.; et al. Heme oxygenase-1 deficiency triggers exhaustion of hematopoietic stem cells. EMBO Rep. 2020, 21, e47895. [Google Scholar] [CrossRef] [PubMed]
  82. Kapturczak, M.H.; Wasserfall, C.; Brusko, T.; Campbell-Thompson, M.; Ellis, T.M.; Atkinson, M.A.; Agarwal, A. Heme oxygenase-1 modulates early inflammatory responses: Evidence from the heme oxygenase-1-deficient mouse. Am. J. Pathol. 2004, 165, 1045–1053. [Google Scholar] [CrossRef]
  83. Swaminathan, S.; Huang, C.; Geng, H.; Chen, Z.; Harvey, R.; Kang, H.; Ng, C.; Titz, B.; Hurtz, C.; Sadiyah, M.F.; et al. BACH2 mediates negative selection and p53-dependent tumor suppression at the pre-B cell receptor checkpoint. Nat. Med. 2013, 19, 1014–1022. [Google Scholar] [CrossRef] [Green Version]
  84. Watanabe-Matsui, M.; Muto, A.; Matsui, T.; Itoh-Nakadai, A.; Nakajima, O.; Murayama, K.; Yamamoto, M.; Ikeda-Saito, M.; Igarashi, K. Heme regulates B-cell differentiation, antibody class switch, and heme oxygenase-1 expression in B cells as a ligand of Bach2. Blood 2011, 117, 5438–5448. [Google Scholar] [CrossRef] [Green Version]
  85. Jiang, Y.; Li, C.; Wu, Q.; An, P.; Huang, L.; Wang, J.; Chen, C.; Chen, X.; Zhang, F.; Ma, L.; et al. Iron-dependent histone 3 lysine 9 demethylation controls B cell proliferation and humoral immune responses. Nat. Commun. 2019, 10, 2935. [Google Scholar] [CrossRef] [Green Version]
  86. Leonardi, D.B.; Anselmino, N.; Brandani, J.N.; Jaworski, F.M.; Paez, A.V.; Mazaira, G.; Meiss, R.P.; Nunez, M.; Nemirovsky, S.I.; Giudice, J.; et al. Heme Oxygenase 1 Impairs Glucocorticoid Receptor Activity in Prostate Cancer. Int. J. Mol. Sci. 2019, 20, 1006. [Google Scholar] [CrossRef] [Green Version]
  87. Inaba, H.; Pui, C.H. Glucocorticoid use in acute lymphoblastic leukaemia. Lancet. Oncol. 2010, 11, 1096–1106. [Google Scholar] [CrossRef] [Green Version]
  88. Allen, A.; Vaninov, N.; Li, M.; Nguyen, S.; Singh, M.; Igo, P.; Tilles, A.W.; O’Rourke, B.; Miller, B.L.K.; Parekkadan, B.; et al. Mesenchymal Stromal Cell Bioreactor for Ex Vivo Reprogramming of Human Immune Cells. Sci. Rep. 2020, 10, 10142. [Google Scholar] [CrossRef]
  89. Goodman, A.I.; Choudhury, M.; da Silva, J.L.; Schwartzman, M.L.; Abraham, N.G. Overexpression of the heme oxygenase gene in renal cell carcinoma. Proc. Soc. Exp. Biol. Med. 1997, 214, 54–61. [Google Scholar] [CrossRef]
  90. Mayerhofer, M.; Florian, S.; Krauth, M.T.; Aichberger, K.J.; Bilban, M.; Marculescu, R.; Printz, D.; Fritsch, G.; Wagner, O.; Selzer, E.; et al. Identification of heme oxygenase-1 as a novel BCR/ABL-dependent survival factor in chronic myeloid leukemia. Cancer Res. 2004, 64, 3148–3154. [Google Scholar] [CrossRef] [Green Version]
  91. Was, H.; Cichon, T.; Smolarczyk, R.; Rudnicka, D.; Stopa, M.; Chevalier, C.; Leger, J.J.; Lackowska, B.; Grochot, A.; Bojkowska, K.; et al. Overexpression of heme oxygenase-1 in murine melanoma: Increased proliferation and viability of tumor cells, decreased survival of mice. Am. J. Pathol. 2006, 169, 2181–2198. [Google Scholar] [CrossRef] [PubMed] [Green Version]
  92. Degese, M.S.; Mendizabal, J.E.; Gandini, N.A.; Gutkind, J.S.; Molinolo, A.; Hewitt, S.M.; Curino, A.C.; Coso, O.A.; Facchinetti, M.M. Expression of heme oxygenase-1 in non-small cell lung cancer (NSCLC) and its correlation with clinical data. Lung Cancer 2012, 77, 168–175. [Google Scholar] [CrossRef] [PubMed]
  93. Noh, S.J.; Bae, J.S.; Jamiyandorj, U.; Park, H.S.; Kwon, K.S.; Jung, S.H.; Youn, H.J.; Lee, H.; Park, B.H.; Chung, M.J.; et al. Expression of nerve growth factor and heme oxygenase-1 predict poor survival of breast carcinoma patients. BMC Cancer 2013, 13, 516. [Google Scholar] [CrossRef] [Green Version]
  94. Wang, T.Y.; Liu, C.L.; Chen, M.J.; Lee, J.J.; Pun, P.C.; Cheng, S.P. Expression of haem oxygenase-1 correlates with tumour aggressiveness and BRAF V600E expression in thyroid cancer. Histopathology 2015, 66, 447–456. [Google Scholar] [CrossRef] [PubMed]
  95. Nishie, A.; Ono, M.; Shono, T.; Fukushi, J.; Otsubo, M.; Onoue, H.; Ito, Y.; Inamura, T.; Ikezaki, K.; Fukui, M.; et al. Macrophage infiltration and heme oxygenase-1 expression correlate with angiogenesis in human gliomas. Clin. Cancer Res. 1999, 5, 1107–1113. [Google Scholar] [PubMed]
  96. Torisu-Itakura, H.; Furue, M.; Kuwano, M.; Ono, M. Co-expression of thymidine phosphorylase and heme oxygenase-1 in macrophages in human malignant vertical growth melanomas. Jpn. J. Cancer Res. Gann 2000, 91, 906–910. [Google Scholar] [CrossRef] [PubMed]
  97. Boschetto, P.; Zeni, E.; Mazzetti, L.; Miotto, D.; Lo Cascio, N.; Maestrelli, P.; Marian, E.; Querzoli, P.; Pedriali, M.; Murer, B.; et al. Decreased heme-oxygenase (HO)-1 in the macrophages of non-small cell lung cancer. Lung Cancer 2008, 59, 192–197. [Google Scholar] [CrossRef]
  98. Lavrovsky, Y.; Schwartzman, M.L.; Levere, R.D.; Kappas, A.; Abraham, N.G. Identification of binding sites for transcription factors NF-kappa B and AP-2 in the promoter region of the human heme oxygenase 1 gene. Proc. Natl. Acad. Sci. USA 1994, 91, 5987–5991. [Google Scholar] [CrossRef] [Green Version]
  99. Chow, A.; Lucas, D.; Hidalgo, A.; Mendez-Ferrer, S.; Hashimoto, D.; Scheiermann, C.; Battista, M.; Leboeuf, M.; Prophete, C.; van Rooijen, N.; et al. Bone marrow CD169+ macrophages promote the retention of hematopoietic stem and progenitor cells in the mesenchymal stem cell niche. J. Exp. Med. 2011, 208, 261–271. [Google Scholar] [CrossRef]
  100. Szade, K.; Gulati, G.S.; Chan, C.K.F.; Kao, K.S.; Miyanishi, M.; Marjon, K.D.; Sinha, R.; George, B.M.; Chen, J.Y.; Weissman, I.L. Where Hematopoietic Stem Cells Live: The Bone Marrow Niche. Antioxid. Redox Signal. 2018, 29, 191–204. [Google Scholar] [CrossRef]
  101. Cunnington, A.J.; de Souza, J.B.; Walther, M.; Riley, E.M. Malaria impairs resistance to Salmonella through heme- and heme oxygenase-dependent dysfunctional granulocyte mobilization. Nat. Med. 2011, 18, 120–127. [Google Scholar] [CrossRef] [Green Version]
  102. Crawford, J.; Dale, D.C.; Lyman, G.H. Chemotherapy-induced neutropenia: Risks, consequences, and new directions for its management. Cancer 2004, 100, 228–237. [Google Scholar] [CrossRef]
  103. Zhang, H.; Nguyen-Jackson, H.; Panopoulos, A.D.; Li, H.S.; Murray, P.J.; Watowich, S.S. STAT3 controls myeloid progenitor growth during emergency granulopoiesis. Blood 2010, 116, 2462–2471. [Google Scholar] [CrossRef] [Green Version]
  104. Manz, M.G.; Boettcher, S. Emergency granulopoiesis. Nat. Rev. Immunol. 2014, 14, 302–314. [Google Scholar] [CrossRef]
  105. Kawakami, M.; Tsutsumi, H.; Kumakawa, T.; Abe, H.; Hirai, M.; Kurosawa, S.; Mori, M.; Fukushima, M. Levels of serum granulocyte colony-stimulating factor in patients with infections. Blood 1990, 76, 1962–1964. [Google Scholar] [CrossRef] [Green Version]
  106. Wheeler, H.E.; Maitland, M.L.; Dolan, M.E.; Cox, N.J.; Ratain, M.J. Cancer pharmacogenomics: Strategies and challenges. Nat. Rev. Genet. 2013, 14, 23–34. [Google Scholar] [CrossRef]
  107. Szade, K.; Bukowska-Strakova, K.; Nowak, W.N.; Szade, A.; Kachamakova-Trojanowska, N.; Zukowska, M.; Jozkowicz, A.; Dulak, J. Murine bone marrow Lin(-)Sca(-)1(+)CD45(-) very small embryonic-like (VSEL) cells are heterogeneous population lacking Oct-4A expression. PLoS ONE 2013, 8, e63329. [Google Scholar] [CrossRef]
Figure 1. Relapse-free survival by grouping patients according to the presence of (A) length polymorphism and (B) SNPs polymorphisms. (A) The 5-year actuarial probability of relapse-free survival was 62.5%, 80.7% and 95.5% for patients with SS (red line, n = 8), SL (gray line, n = 26) and LL (black line, n = 22) genotype, respectively. (B) The 5-year actuarial probability of relapse-free survival was 88.2%, 86.7% and 75% for patients with TT (red line, n = 12) genotype, AT (gray line, n = 30) and AA (black line, n = 17), respectively.
Ijms 22 00988 g001
Figure 2. Co-segregation of the A and T alleles with HMOX1 promoter length variants: (A) Shown as a percentage frequency distribution of AA, AT and TT genotype in SS, SL and LL individuals (both patients and control group); (B) distribution of AA and TT in individuals with certain length variants, separately in the patient and control group; S—short alleles (GT n < 24), M—medium alleles (24–28 GT n), L—long alleles (29/30 GT n), L—very long alleles (GT n > 30).
Ijms 22 00988 g002
Figure 3. (A) Frequencies of short and long alleles in the patient and control groups. In ALL patients: 43 short alleles (38.4%) and 69 long alleles (61.6%); in control group: 20 short alleles (23.8%) and 64 long alleles (76.2%). (B) Comparison of percentage of patients and healthy controls with the SS, SL or LL genotype. In ALL patients: SS genotype—8 patients (14.3%), SL genotype—27 patients (48.2%), LL genotype—21 patients (37.5%). In controls group: SS genotype—4 individuals (9.5%), SL genotype—12 individuals (28.6%), LL genotype—26 individuals (61.9%). *—p < 0.05.
Ijms 22 00988 g003
Figure 4. (A) Frequencies of short and long alleles in the control group and in patients stratified into the risk groups. In the control group: 20 short alleles (23.8%) and 64 long alleles (76.2%); in the SR group: 9 short alleles (28.1%) and 23 long alleles (71.9%); in the IR group: 22 short alleles (36.7%) and 38 long alleles (63.3%); in the HR group: 12 short alleles (60%) and 8 long alleles (40%); (B) Comparison of percentage of individuals with the SS, SL and LL genotypes in the control group and in patients stratified into the particular risk groups. In the control group: SS genotype—4 individuals (9.5%), SL genotype—12 individuals (28.6%), LL genotype—26 individuals (61.9%). In the SR group: SS genotype—0 patients, SL genotype—9 patients (56.2%), LL genotype—7 patients (43.8%). In the IR group: SS genotype—4 patients (13.3%), SL genotype—14 patients (46.7%), LL genotype—12 patients (40%). In the HR group: SS genotype—4 patients (40%), SL genotype—4 patients (40%), LL genotype—2 patients (20%). *—p < 0.05; **—p < 0.01.
Ijms 22 00988 g004
Figure 5. (A) MRD level at 33rd day of treatment in association with the presence of short alleles in patients, shown in all patients and separately in patients stratified into the particular risk groups. Mean MRD was 0.086 ± 0.17 in patients with at least one S allele versus mean MRD 0.0033 ± 0.006 in the LL patients. In the SR group—data available for 15 patients, in the IR group for 28 patients, in the HR group for 10 patients. (B) CIN incidences in association with the presence of short alleles in patients, shown in all patients, and separately in patients stratified into the particular risk groups. Then the influence of genotype and a risk group was calculated as independent variables on a number of CIN incidents. It appeared that the main effect resulted from the risk group (two-way ANOVA, p = 0.0005), but there was also an effect of genotype (p = 0.0055). In the SR group—data available for 15 patients, in the IR group for 24 patients, in the HR group for 10 patients. Data are presented as means and SEM * p < 0.05, ** p < 0.01.
Ijms 22 00988 g005
Figure 6. Confocal microscopy slides displaying HO-1 protein (green) and nuclear staining (blue) in normal bone marrow hematopoietic stem and myeloid progenitor cells, as well as B-cell developmental stages. HSC—hematopoietic stem cells, MPP—multipotent progenitors, CMP—common myeloid progenitors, GMP—granulocyte-macrophage progenitor, MEP—megakaryocyte-erythroid progenitor, CLP—common lymphoid progenitor.
Ijms 22 00988 g006
Figure 7. (A) Comparison of HMOX1 mRNA level in peripheral blood samples taken from healthy, untreated children (n = 3) and from ALL children (n = 19) during treatment course, at stage of clinical remission when no blast cells were found in the blood, and complete blood count was normalized. (B) Basal HO-1 expression (shown as MFI) in leukemic cells and the residual normal cell subsets present in the sample at the day of diagnosis (n = 11). (C) MFI of HO-1 in each cell subset before treatment (n = 11) and at day 15th (n = 6) and 33rd (n = 3) of induction. (D) The fold increase of HO-1 expression in monocytes in relation to the risk group and to treatment response, expressed as MRD level. Blasts—leukemic cells, lymph B—mature lymphocytes, EBL—erythroblasts, mono—monocytes. *—p< 0.05; **—p < 0.01; ***—p < 0.001.
Ijms 22 00988 g007
Publisher’s Note: MDPI stays neutral with regard to jurisdictional claims in published maps and institutional affiliations.

