
The BET Inhibitor OTX015 Exhibits In Vitro and In Vivo Antitumor Activity in Pediatric Ependymoma Stem Cell Models

 , , , , , , and
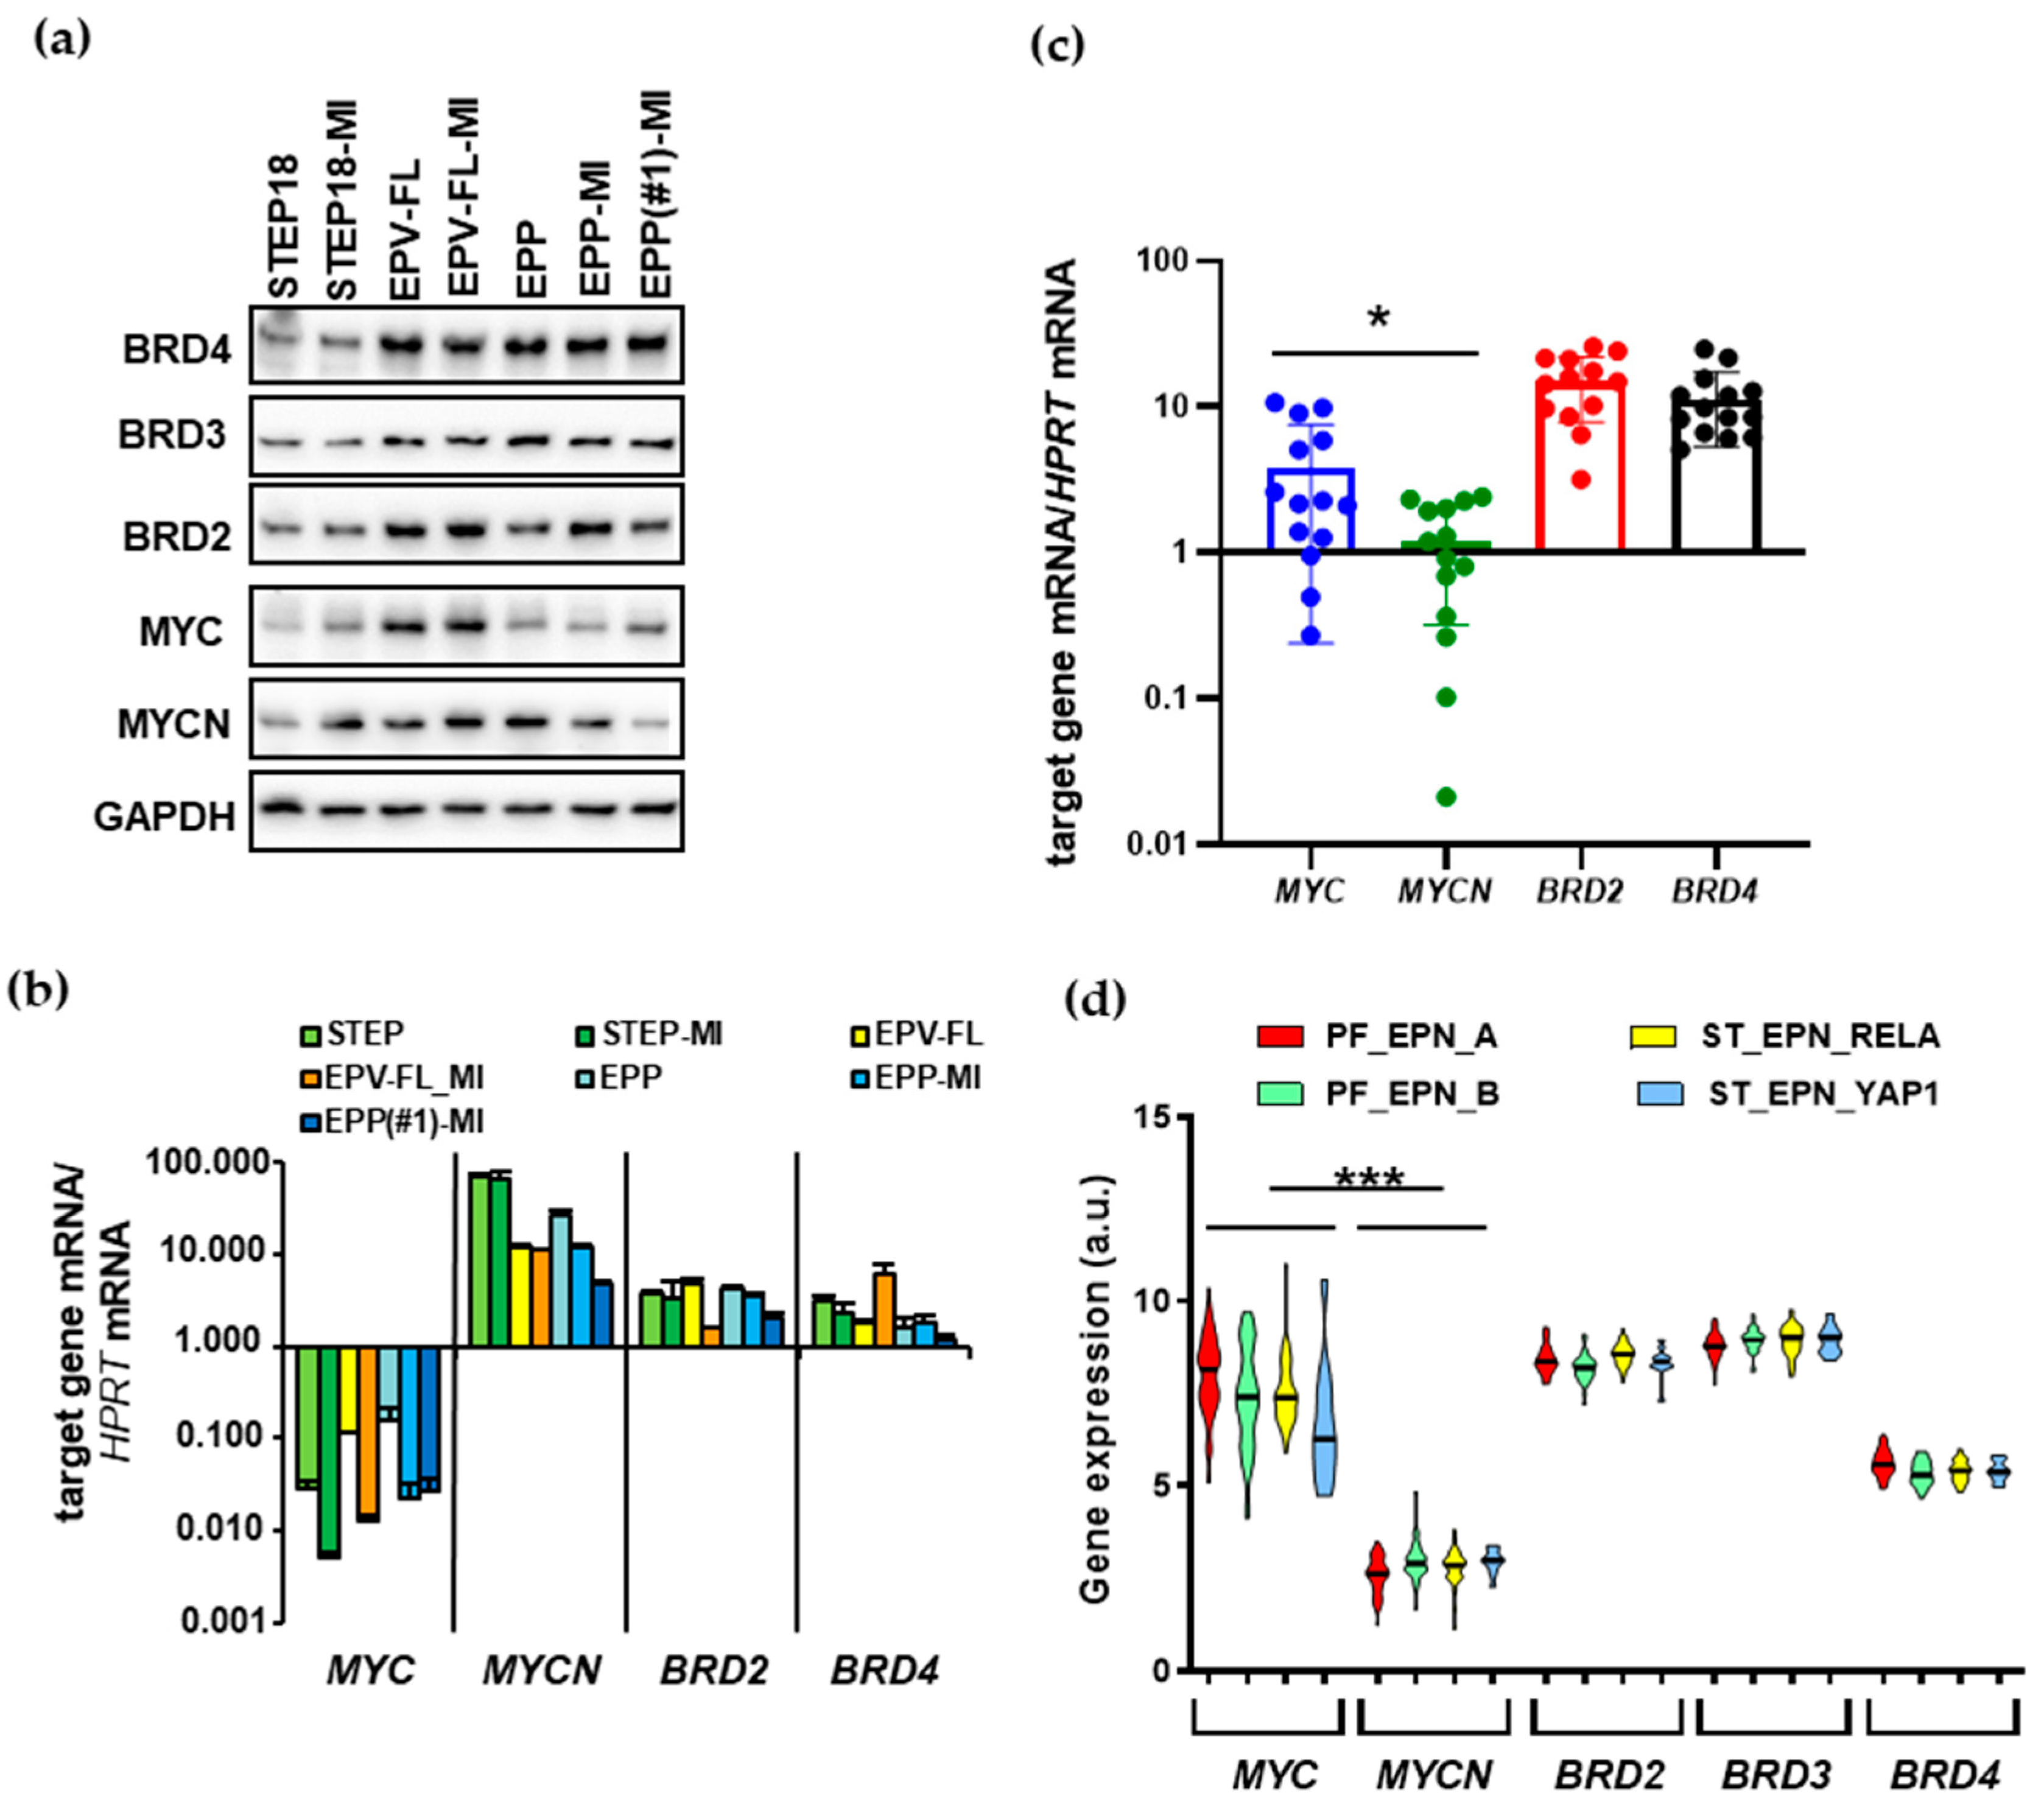
Abstract
:1. Introduction
2. Results
2.1. EPN Patient-Derived SC Lines and Tumors Express OTX015 Targets
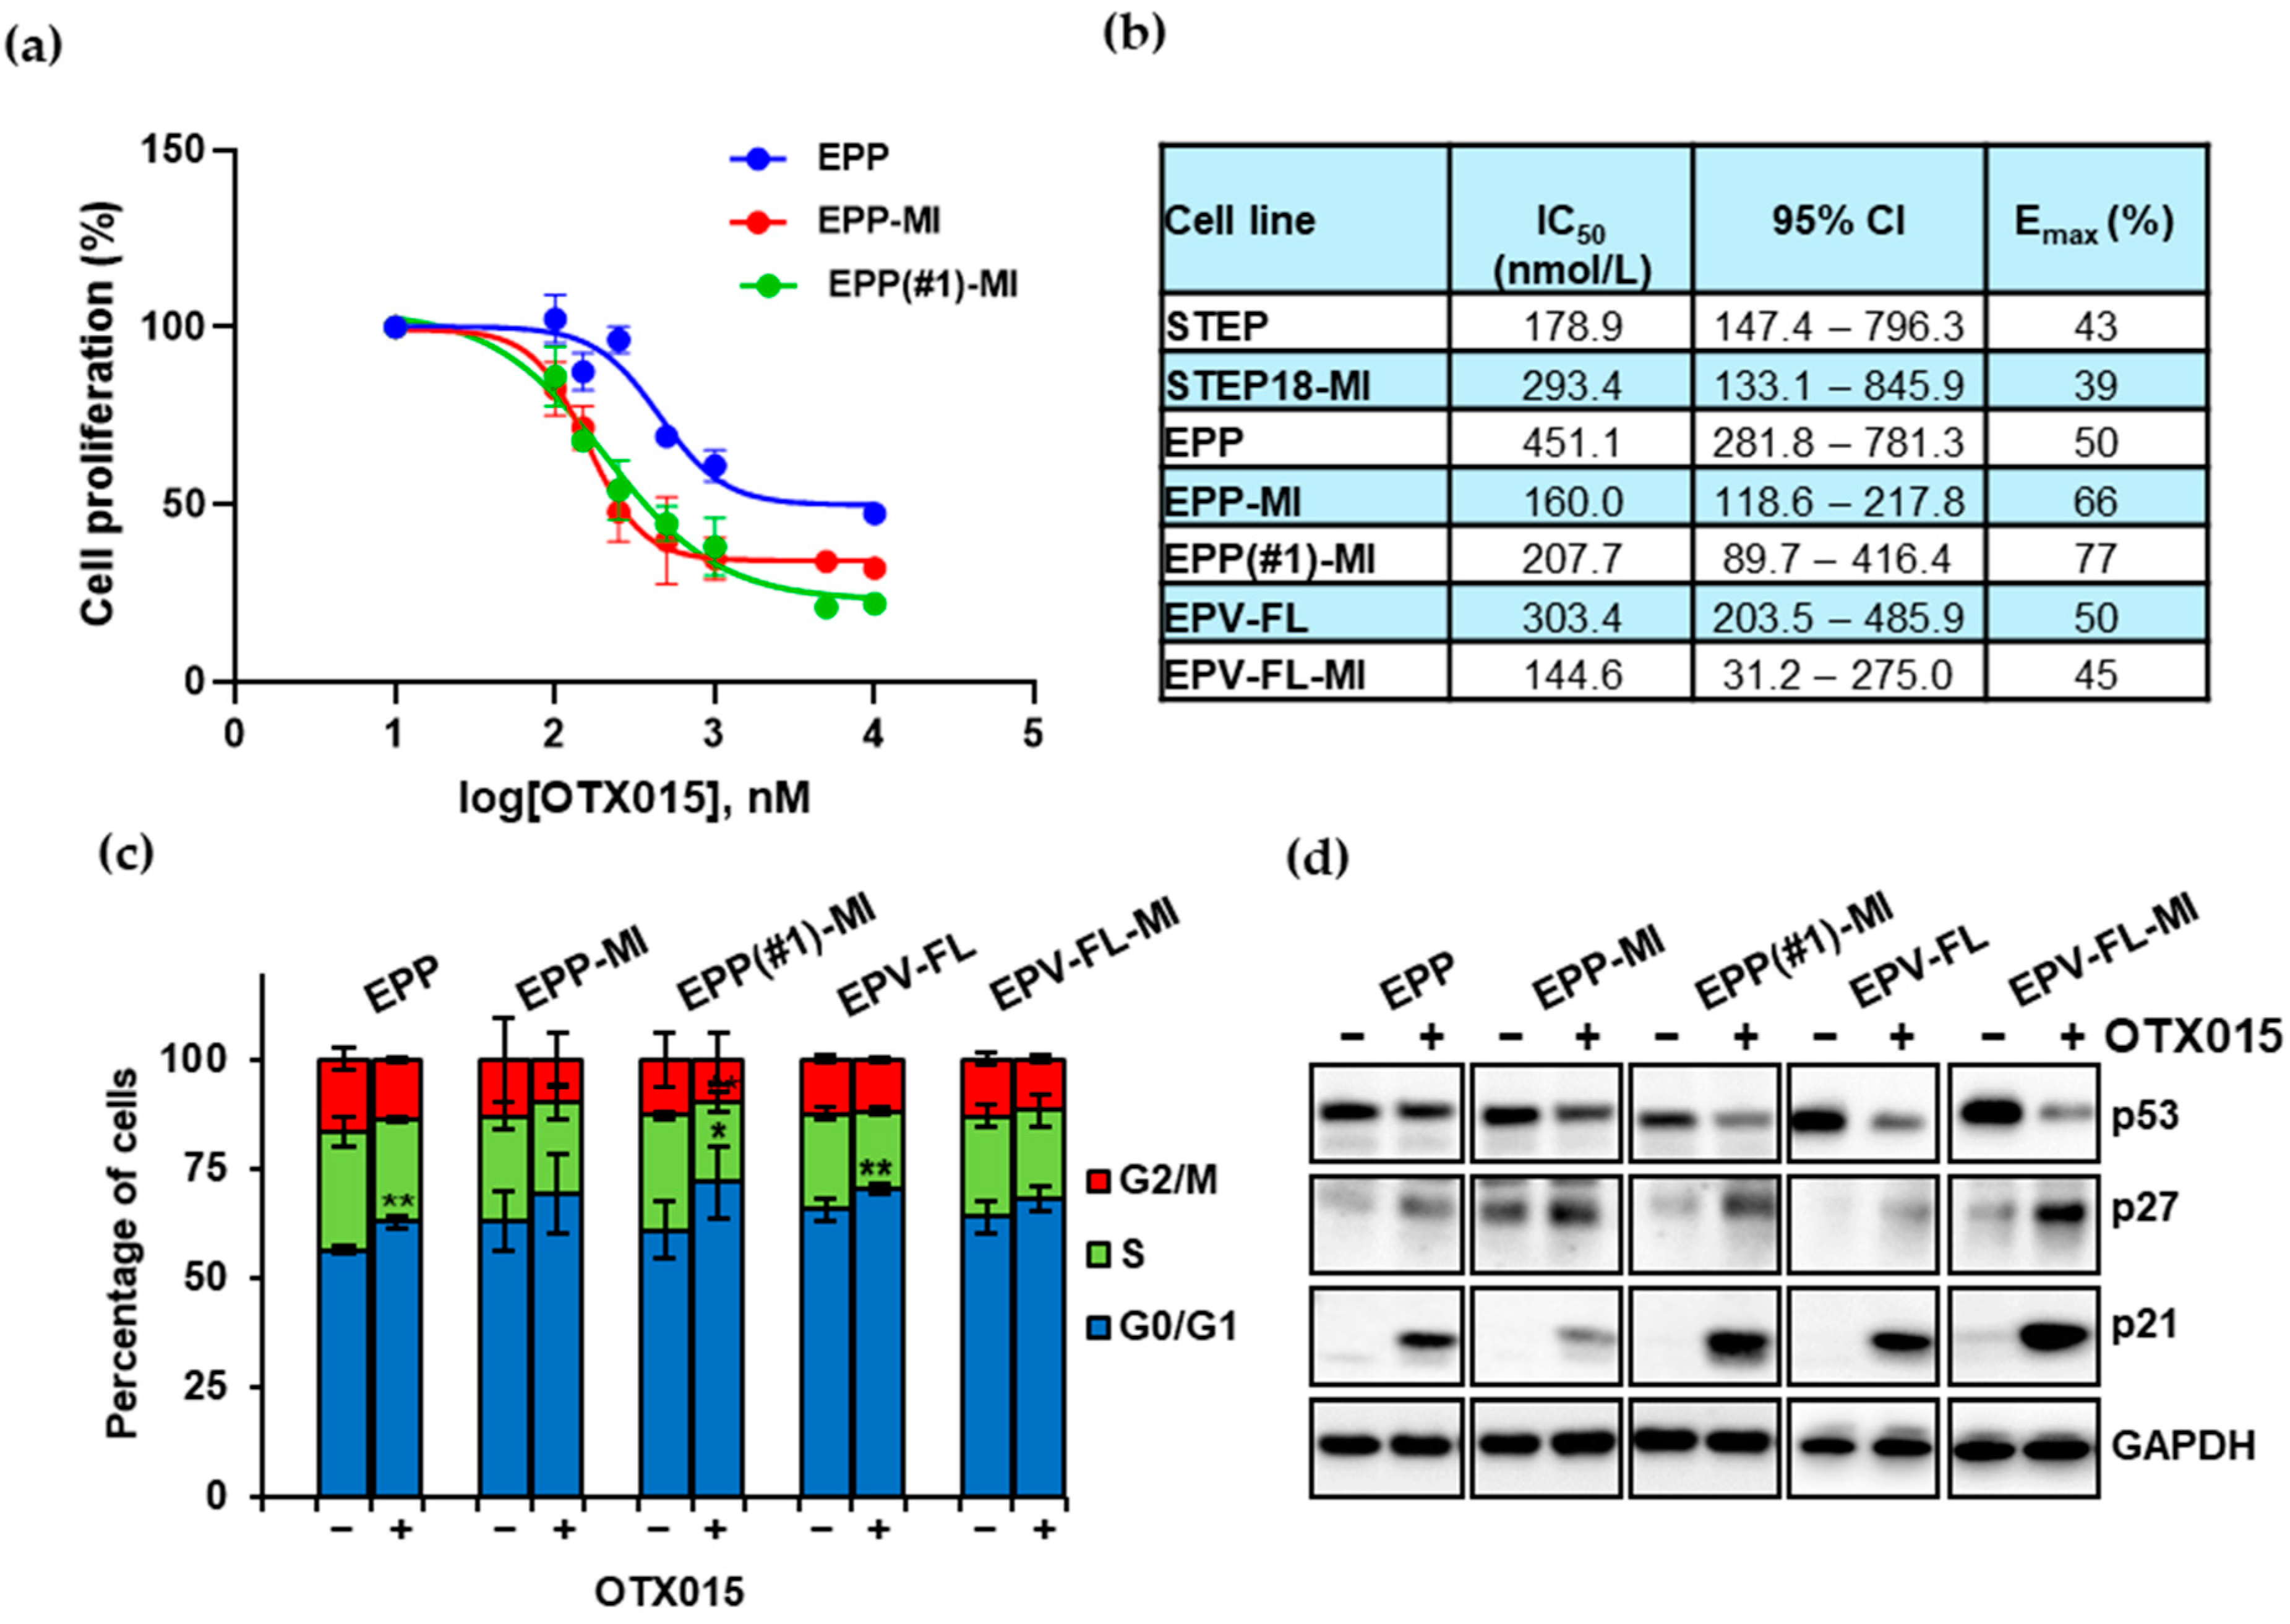
2.2. The BETi OTX015 Hampers Proliferation of EPN SC Lines by Targeting Cell Cycle Checkpoint Proteins p21 and p27
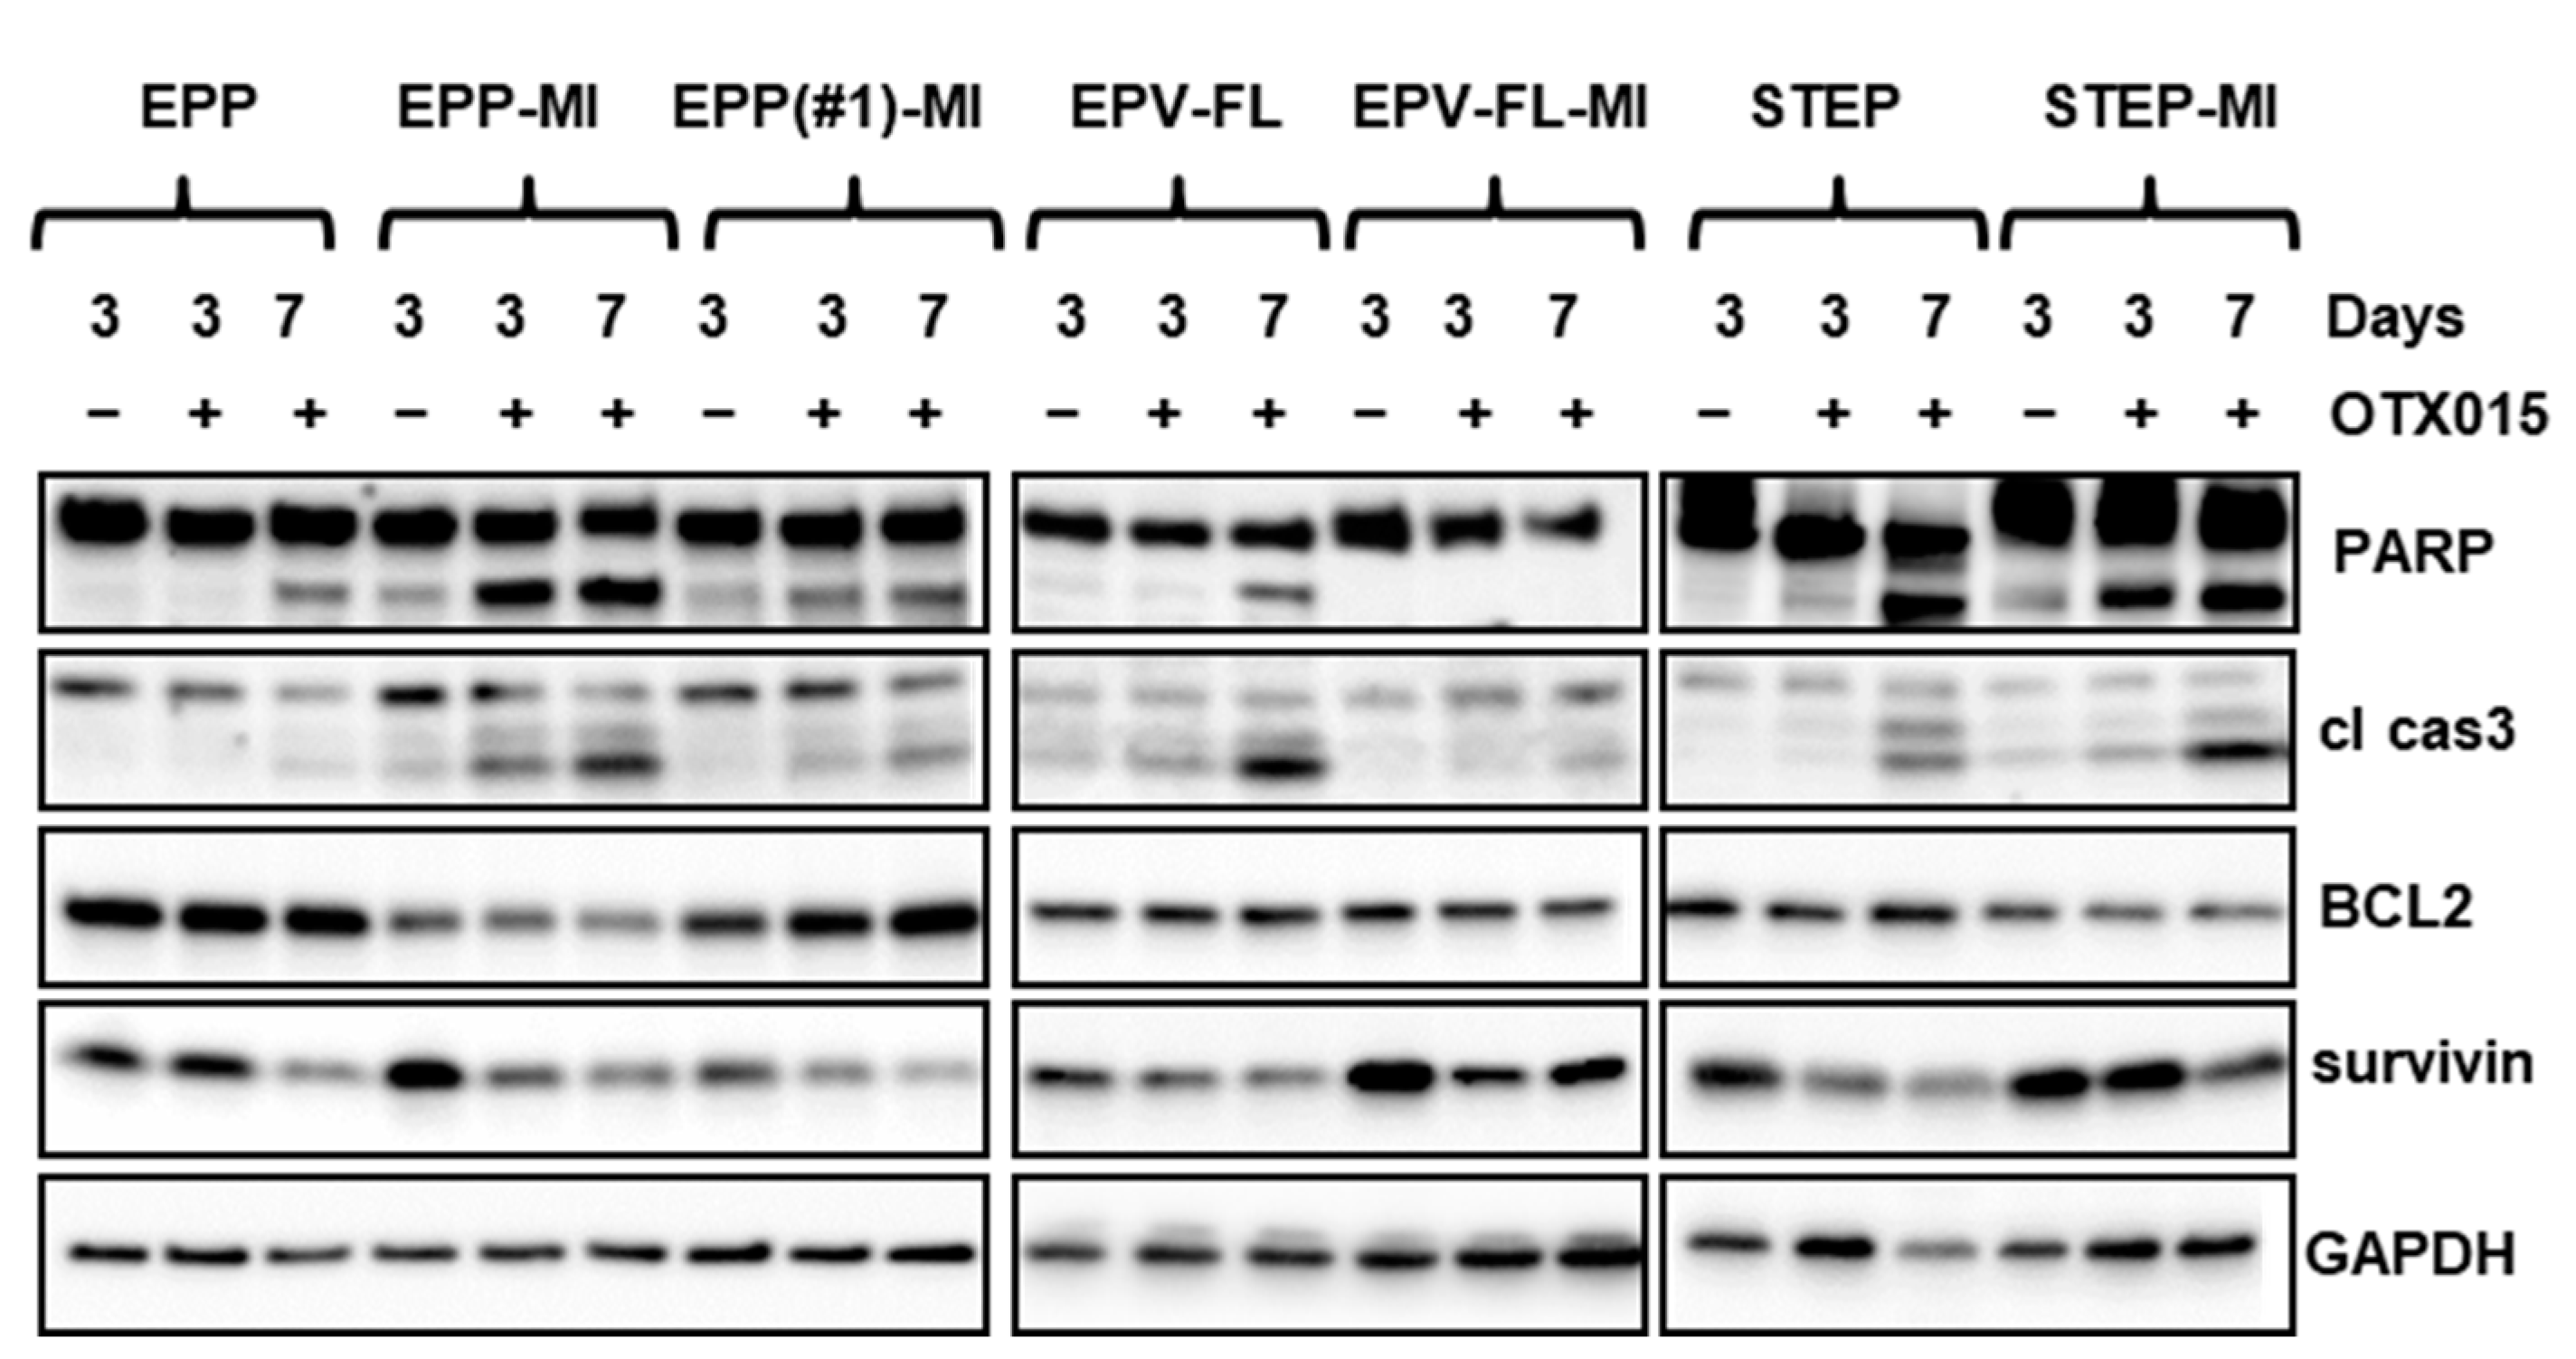
2.3. OTX015 Causes Apoptotic Cell Death in EPN SC Lines
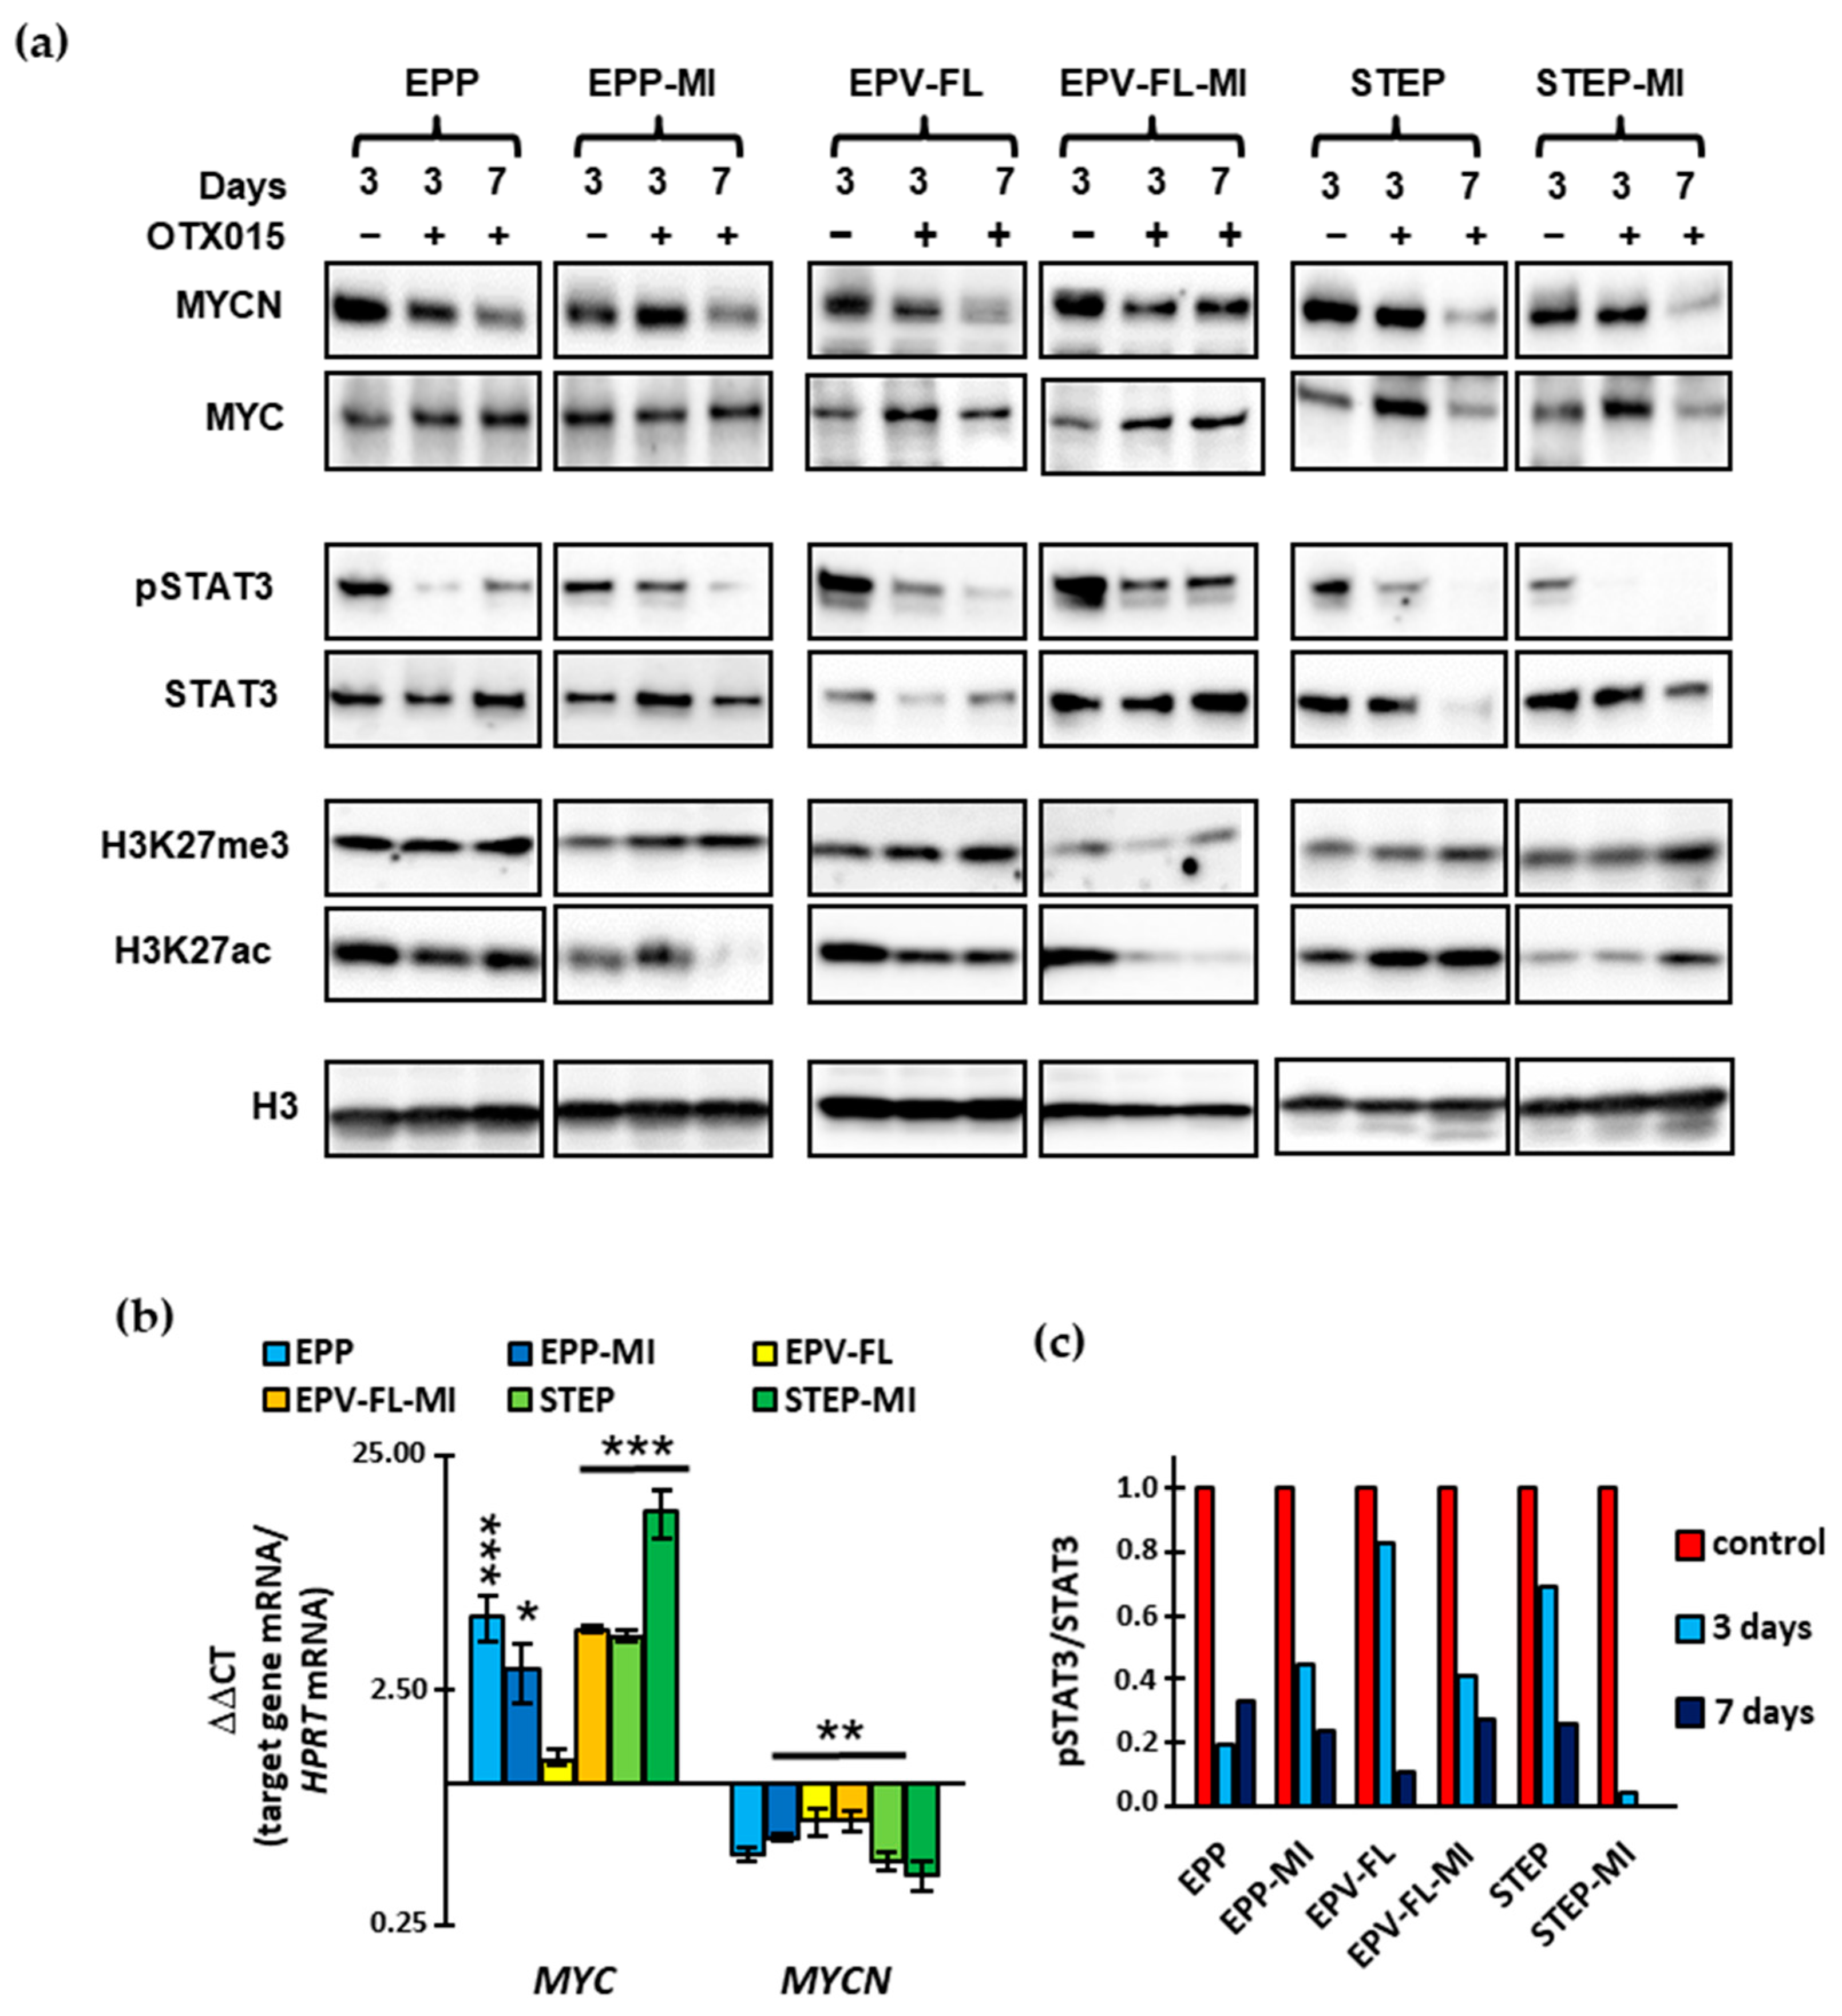
2.4. OTX015 Exerts Minor Effects on the Expression of MYC/MYCN in EPN SC Lines While Markedly Reducing Transcriptionally Active STAT3
2.5. OTX015 Differentially Alters the Expression of Stemness Genes in EPN SC Lines While Consistently Reducing Vascular Endothelial Growth Gactor A (VEGFA) Expression
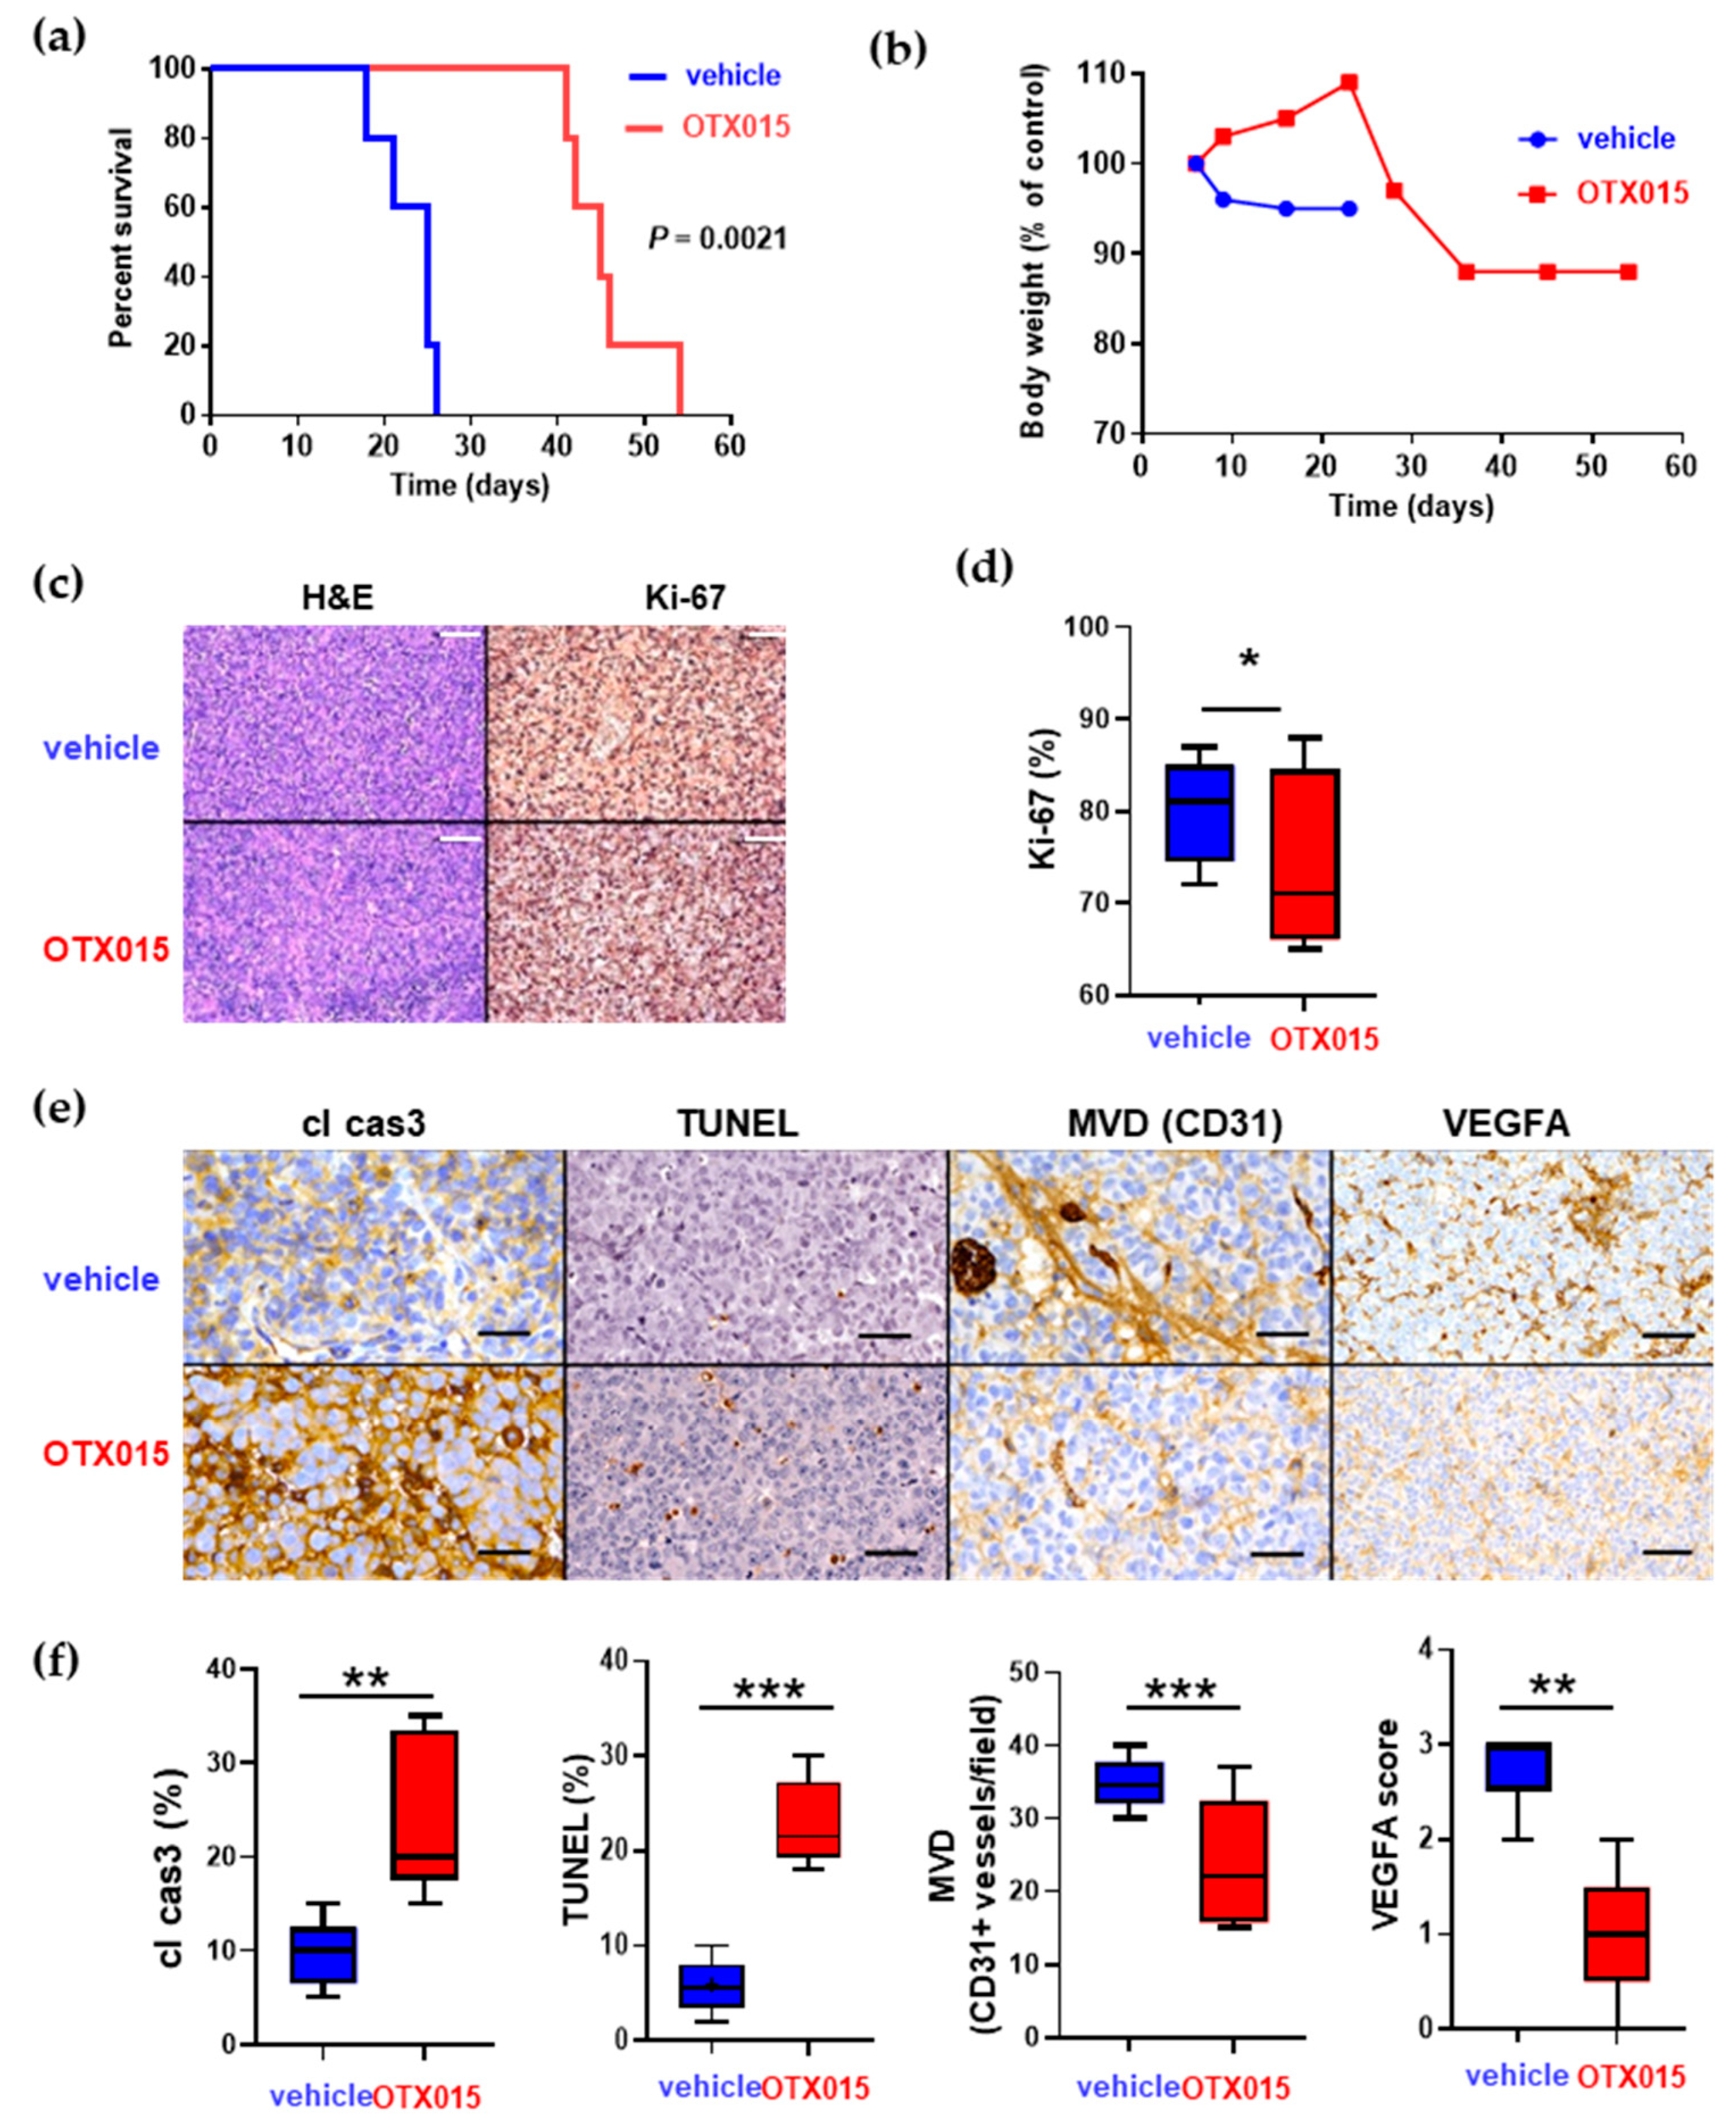
2.6. Oral Admistration of OXT015 Shows Therapeutic Efficacy against Two out of Three Human EPN Orthotopic Xenografts
3. Discussion
4. Materials and Methods
4.1. Cell Cultures and Reagents
4.2. Patients and Tissue Samples
4.3. Cell Viability, Cell Death, and Cycle Analyses
4.4. cDNA Synthesis and Quantitative PCR (qPCR)
4.5. Western Blot Analysis
4.6. In Vivo Models and Animal Treatment
4.7. Immunohistochemical Analyses
4.8. External Gene Expression Validation
4.9. Statistical Methods
5. Conclusions
Supplementary Materials
Author Contributions
Funding
Institutional Review Board Statement
Informed Consent Statement
Data Availability Statement
Acknowledgments
Conflicts of Interest
References
- Pajtler, K.W.; Witt, H.; Sill, M.; Jones, D.T.W.; Hovestadt, V.; Kratochwil, F.; Wani, K.; Tatevossian, R.; Punchihewa, C.; Johann, P.; et al. Molecular Classification of Ependymal Tumors across All CNS Compartments, Histopathological Grades, and Age Groups. Cancer Cell 2015, 27, 728–743. [Google Scholar] [CrossRef] [Green Version]
- Gatta, G.; Botta, L.; Rossi, S.; Aareleid, T.; Bielska-Lasota, M.; Clavel, J.; Dimitrova, N.; Jakab, Z.; Kaatsch, P.; Lacour, B.; et al. Childhood Cancer Survival in Europe 1999-2007: Results of EUROCARE-5--a Population-Based Study. Lancet Oncol. 2014, 15, 35–47. [Google Scholar] [CrossRef]
- Byer, L.; Kline, C.N.; Coleman, C.; Allen, I.E.; Whitaker, E.; Mueller, S. A Systematic Review and Meta-Analysis of Outcomes in Pediatric, Recurrent Ependymoma. J. Neurooncol. 2019, 144, 445–452. [Google Scholar] [CrossRef]
- Pajtler, K.W.; Mack, S.C.; Ramaswamy, V.; Smith, C.A.; Witt, H.; Smith, A.; Hansford, J.R.; von Hoff, K.; Wright, K.D.; Hwang, E.; et al. The Current Consensus on the Clinical Management of Intracranial Ependymoma and Its Distinct Molecular Variants. Acta Neuropathol. 2017, 133, 5–12. [Google Scholar] [CrossRef]
- Rudà, R.; Reifenberger, G.; Frappaz, D.; Pfister, S.M.; Laprie, A.; Santarius, T.; Roth, P.; Tonn, J.C.; Soffietti, R.; Weller, M.; et al. EANO Guidelines for the Diagnosis and Treatment of Ependymal Tumors. Neuro-Oncol. 2018, 20, 445–456. [Google Scholar] [CrossRef] [Green Version]
- Witt, H.; Mack, S.C.; Ryzhova, M.; Bender, S.; Sill, M.; Isserlin, R.; Benner, A.; Hielscher, T.; Milde, T.; Remke, M.; et al. Delineation of Two Clinically and Molecularly Distinct Subgroups of Posterior Fossa Ependymoma. Cancer Cell 2011, 20, 143–157. [Google Scholar] [CrossRef] [PubMed] [Green Version]
- Mack, S.C.; Witt, H.; Piro, R.M.; Gu, L.; Zuyderduyn, S.; Stütz, A.M.; Wang, X.; Gallo, M.; Garzia, L.; Zayne, K.; et al. Epigenomic Alterations Define Lethal CIMP-Positive Ependymomas of Infancy. Nature 2014, 506, 445–450. [Google Scholar] [CrossRef] [PubMed]
- Parker, M.; Mohankumar, K.M.; Punchihewa, C.; Weinlich, R.; Dalton, J.D.; Li, Y.; Lee, R.; Tatevossian, R.G.; Phoenix, T.N.; Thiruvenkatam, R.; et al. C11orf95-RELA Fusions Drive Oncogenic NF-ΚB Signalling in Ependymoma. Nature 2014, 506, 451–455. [Google Scholar] [CrossRef] [Green Version]
- Mack, S.C.; Witt, H.; Wang, X.; Milde, T.; Yao, Y.; Bertrand, K.C.; Korshunov, A.; Pfister, S.M.; Taylor, M.D. Emerging Insights into the Ependymoma Epigenome. Brain Pathol. 2013, 23, 206–209. [Google Scholar] [CrossRef]
- Bayliss, J.; Mukherjee, P.; Lu, C.; Jain, S.U.; Chung, C.; Martinez, D.; Sabari, B.; Margol, A.S.; Panwalkar, P.; Parolia, A.; et al. Lowered H3K27me3 and DNA Hypomethylation Define Poorly Prognostic Pediatric Posterior Fossa Ependymomas. Sci. Transl. Med. 2016, 8, 366ra161. [Google Scholar] [CrossRef] [Green Version]
- Panwalkar, P.; Clark, J.; Ramaswamy, V.; Hawes, D.; Yang, F.; Dunham, C.; Yip, S.; Hukin, J.; Sun, Y.; Schipper, M.J.; et al. Immunohistochemical Analysis of H3K27me3 Demonstrates Global Reduction in Group-A Childhood Posterior Fossa Ependymoma and Is a Powerful Predictor of Outcome. Acta Neuropathol. 2017, 134, 705–714. [Google Scholar] [CrossRef]
- Michealraj, K.A.; Kumar, S.A.; Kim, L.J.Y.; Cavalli, F.M.G.; Przelicki, D.; Wojcik, J.B.; Delaidelli, A.; Bajic, A.; Saulnier, O.; MacLeod, G.; et al. Metabolic Regulation of the Epigenome Drives Lethal Infantile Ependymoma. Cell 2020, 181, 1329–1345.e24. [Google Scholar] [CrossRef] [PubMed]
- Perla, A.; Fratini, L.; Cardoso, P.S.; Nör, C.; Brunetto, A.T.; Brunetto, A.L.; de Farias, C.B.; Jaeger, M.; Roesler, R. Histone Deacetylase Inhibitors in Pediatric Brain Cancers: Biological Activities and Therapeutic Potential. Front. Cell Dev. Biol. 2020, 8, 546. [Google Scholar] [CrossRef]
- Baylin, S.B.; Jones, P.A. Epigenetic Determinants of Cancer. Cold Spring Harb. Perspect. Biol. 2016, 8. [Google Scholar] [CrossRef] [PubMed] [Green Version]
- Taylor, M.D.; Poppleton, H.; Fuller, C.; Su, X.; Liu, Y.; Jensen, P.; Magdaleno, S.; Dalton, J.; Calabrese, C.; Board, J.; et al. Radial Glia Cells Are Candidate Stem Cells of Ependymoma. Cancer Cell 2005, 8, 323–335. [Google Scholar] [CrossRef] [Green Version]
- Muñoz, P.; Iliou, M.S.; Esteller, M. Epigenetic Alterations Involved in Cancer Stem Cell Reprogramming. Mol. Oncol. 2012, 6, 620–636. [Google Scholar] [CrossRef] [PubMed] [Green Version]
- Easwaran, H.; Tsai, H.-C.; Baylin, S.B. Cancer Epigenetics: Tumor Heterogeneity, Plasticity of Stem-like States, and Drug Resistance. Mol. Cell 2014, 54, 716–727. [Google Scholar] [CrossRef] [Green Version]
- Delmore, J.E.; Issa, G.C.; Lemieux, M.E.; Rahl, P.B.; Shi, J.; Jacobs, H.M.; Kastritis, E.; Gilpatrick, T.; Paranal, R.M.; Qi, J.; et al. BET Bromodomain Inhibition as a Therapeutic Strategy to Target C-Myc. Cell 2011, 146, 904–917. [Google Scholar] [CrossRef] [Green Version]
- Cochran, A.G.; Conery, A.R.; Sims, R.J. Bromodomains: A New Target Class for Drug Development. Nat. Rev. Drug Discov. 2019, 18, 609–628. [Google Scholar] [CrossRef] [PubMed]
- Filippakopoulos, P.; Qi, J.; Picaud, S.; Shen, Y.; Smith, W.B.; Fedorov, O.; Morse, E.M.; Keates, T.; Hickman, T.T.; Felletar, I.; et al. Selective Inhibition of BET Bromodomains. Nature 2010, 468, 1067–1073. [Google Scholar] [CrossRef] [Green Version]
- Zaware, N.; Zhou, M.-M. Bromodomain Biology and Drug Discovery. Nat. Struct. Mol. Biol. 2019, 26, 870–879. [Google Scholar] [CrossRef] [PubMed]
- Stathis, A.; Bertoni, F. BET Proteins as Targets for Anticancer Treatment. Cancer Discov. 2018, 8, 24–36. [Google Scholar] [CrossRef] [PubMed] [Green Version]
- Berenguer-Daizé, C.; Astorgues-Xerri, L.; Odore, E.; Cayol, M.; Cvitkovic, E.; Noel, K.; Bekradda, M.; MacKenzie, S.; Rezai, K.; Lokiec, F.; et al. OTX015 (MK-8628), a Novel BET Inhibitor, Displays in Vitro and in Vivo Antitumor Effects Alone and in Combination with Conventional Therapies in Glioblastoma Models. Int. J. Cancer 2016, 139, 2047–2055. [Google Scholar] [CrossRef]
- Han, Y.; Lindner, S.; Bei, Y.; Garcia, H.D.; Timme, N.; Althoff, K.; Odersky, A.; Schramm, A.; Lissat, A.; Künkele, A.; et al. Synergistic Activity of BET Inhibitor MK-8628 and PLK Inhibitor Volasertib in Preclinical Models of Medulloblastoma. Cancer Lett. 2019, 445, 24–33. [Google Scholar] [CrossRef]
- Boi, M.; Gaudio, E.; Bonetti, P.; Kwee, I.; Bernasconi, E.; Tarantelli, C.; Rinaldi, A.; Testoni, M.; Cascione, L.; Ponzoni, M.; et al. The BET Bromodomain Inhibitor OTX015 Affects Pathogenetic Pathways in Preclinical B-Cell Tumor Models and Synergizes with Targeted Drugs. Clin. Cancer Res. 2015, 21, 1628–1638. [Google Scholar] [CrossRef] [Green Version]
- Henssen, A.; Althoff, K.; Odersky, A.; Beckers, A.; Koche, R.; Speleman, F.; Schäfers, S.; Bell, E.; Nortmeyer, M.; Westermann, F.; et al. Targeting MYCN-Driven Transcription By BET-Bromodomain Inhibition. Clin. Cancer Res. 2016, 22, 2470–2481. [Google Scholar] [CrossRef] [Green Version]
- Vázquez, R.; Riveiro, M.E.; Astorgues-Xerri, L.; Odore, E.; Rezai, K.; Erba, E.; Panini, N.; Rinaldi, A.; Kwee, I.; Beltrame, L.; et al. The Bromodomain Inhibitor OTX015 (MK-8628) Exerts Anti-Tumor Activity in Triple-Negative Breast Cancer Models as Single Agent and in Combination with Everolimus. Oncotarget 2017, 8, 7598–7613. [Google Scholar] [CrossRef] [Green Version]
- Asangani, I.A.; Wilder-Romans, K.; Dommeti, V.L.; Krishnamurthy, P.M.; Apel, I.J.; Escara-Wilke, J.; Plymate, S.R.; Navone, N.M.; Wang, S.; Feng, F.Y.; et al. BET Bromodomain Inhibitors Enhance Efficacy and Disrupt Resistance to AR Antagonists in the Treatment of Prostate Cancer. Mol. Cancer Res. 2016, 14, 324–331. [Google Scholar] [CrossRef] [Green Version]
- Riveiro, M.E.; Astorgues-Xerri, L.; Vazquez, R.; Frapolli, R.; Kwee, I.; Rinaldi, A.; Odore, E.; Rezai, K.; Bekradda, M.; Inghirami, G.; et al. OTX015 (MK-8628), a Novel BET Inhibitor, Exhibits Antitumor Activity in Non-Small Cell and Small Cell Lung Cancer Models Harboring Different Oncogenic Mutations. Oncotarget 2016, 7, 84675–84687. [Google Scholar] [CrossRef] [Green Version]
- Mack, S.C.; Pajtler, K.W.; Chavez, L.; Okonechnikov, K.; Bertrand, K.C.; Wang, X.; Erkek, S.; Federation, A.; Song, A.; Lee, C.; et al. Therapeutic Targeting of Ependymoma as Informed by Oncogenic Enhancer Profiling. Nature 2018, 553, 101–105. [Google Scholar] [CrossRef]
- Servidei, T.; Meco, D.; Trivieri, N.; Patriarca, V.; Vellone, V.G.; Zannoni, G.F.; Lamorte, G.; Pallini, R.; Riccardi, R. Effects of Epidermal Growth Factor Receptor Blockade on Ependymoma Stem Cells in Vitro and in Orthotopic Mouse Models. Int. J. Cancer 2012, 131, E791–E803. [Google Scholar] [CrossRef]
- Servidei, T.; Meco, D.; Muto, V.; Bruselles, A.; Ciolfi, A.; Trivieri, N.; Lucchini, M.; Morosetti, R.; Mirabella, M.; Martini, M.; et al. Novel SEC61G-EGFR Fusion Gene in Pediatric Ependymomas Discovered by Clonal Expansion of Stem Cells in Absence of Exogenous Mitogens. Cancer Res. 2017, 77, 5860–5872. [Google Scholar] [CrossRef] [PubMed] [Green Version]
- Antonelli, R.; Jiménez, C.; Riley, M.; Servidei, T.; Riccardi, R.; Soriano, A.; Roma, J.; Martínez-Saez, E.; Martini, M.; Ruggiero, A.; et al. CN133, a Novel Brain-Penetrating Histone Deacetylase Inhibitor, Hampers Tumor Growth in Patient-Derived Pediatric Posterior Fossa Ependymoma Models. Cancers 2020, 12, 1922. [Google Scholar] [CrossRef]
- McGranahan, N.; Swanton, C. Clonal Heterogeneity and Tumor Evolution: Past, Present, and the Future. Cell 2017, 168, 613–628. [Google Scholar] [CrossRef] [PubMed] [Green Version]
- Gillen, A.E.; Riemondy, K.A.; Amani, V.; Griesinger, A.M.; Gilani, A.; Venkataraman, S.; Madhavan, K.; Prince, E.; Sanford, B.; Hankinson, T.C.; et al. Single-Cell RNA Sequencing of Childhood Ependymoma Reveals Neoplastic Cell Subpopulations That Impact Molecular Classification and Etiology. Cell Rep. 2020, 32, 108023. [Google Scholar] [CrossRef]
- Knoepfler, P.S.; Cheng, P.F.; Eisenman, R.N. N-Myc Is Essential during Neurogenesis for the Rapid Expansion of Progenitor Cell Populations and the Inhibition of Neuronal Differentiation. Genes Dev. 2002, 16, 2699–2712. [Google Scholar] [CrossRef] [Green Version]
- Kreso, A.; Dick, J.E. Evolution of the Cancer Stem Cell Model. Cell Stem Cell 2014, 14, 275–291. [Google Scholar] [CrossRef] [Green Version]
- Suvà, M.L.; Tirosh, I. The Glioma Stem Cell Model in the Era of Single-Cell Genomics. Cancer Cell 2020, 37, 630–636. [Google Scholar] [CrossRef]
- Vescovi, A.L.; Galli, R.; Reynolds, B.A. Brain Tumour Stem Cells. Nat. Rev. Cancer 2006, 6, 425–436. [Google Scholar] [CrossRef]
- Odore, E.; Lokiec, F.; Cvitkovic, E.; Bekradda, M.; Herait, P.; Bourdel, F.; Kahatt, C.; Raffoux, E.; Stathis, A.; Thieblemont, C.; et al. Phase I Population Pharmacokinetic Assessment of the Oral Bromodomain Inhibitor OTX015 in Patients with Haematologic Malignancies. Clin. Pharmacokinet. 2016, 55, 397–405. [Google Scholar] [CrossRef] [PubMed]
- Cheng, Z.; Gong, Y.; Ma, Y.; Lu, K.; Lu, X.; Pierce, L.A.; Thompson, R.C.; Muller, S.; Knapp, S.; Wang, J. Inhibition of BET Bromodomain Targets Genetically Diverse Glioblastoma. Clin. Cancer Res. 2013, 19, 1748–1759. [Google Scholar] [CrossRef] [Green Version]
- Xu, L.; Chen, Y.; Mayakonda, A.; Koh, L.; Chong, Y.K.; Buckley, D.L.; Sandanaraj, E.; Lim, S.W.; Lin, R.Y.-T.; Ke, X.-Y.; et al. Targetable BET Proteins- and E2F1-Dependent Transcriptional Program Maintains the Malignancy of Glioblastoma. Proc. Natl. Acad. Sci. USA 2018, 115, E5086–E5095. [Google Scholar] [CrossRef] [PubMed] [Green Version]
- Atkinson, J.M.; Shelat, A.A.; Carcaboso, A.M.; Kranenburg, T.A.; Arnold, L.A.; Boulos, N.; Wright, K.; Johnson, R.A.; Poppleton, H.; Mohankumar, K.M.; et al. An Integrated in Vitro and in Vivo High-Throughput Screen Identifies Treatment Leads for Ependymoma. Cancer Cell 2011, 20, 384–399. [Google Scholar] [CrossRef] [Green Version]
- Kratzsch, T.; Kuhn, S.A.; Joedicke, A.; Hanisch, U.K.; Vajkoczy, P.; Hoffmann, J.; Fichtner, I. Treatment with 5-Azacitidine Delay Growth of Glioblastoma Xenografts: A Potential New Treatment Approach for Glioblastomas. J. Cancer Res. Clin. Oncol. 2018, 144, 809–819. [Google Scholar] [CrossRef]
- Martini, M.; Cenci, T.; D’Alessandris, G.Q.; Cesarini, V.; Cocomazzi, A.; Ricci-Vitiani, L.; De Maria, R.; Pallini, R.; Larocca, L.M. Epigenetic Silencing of Id4 Identifies a Glioblastoma Subgroup with a Better Prognosis as a Consequence of an Inhibition of Angiogenesis. Cancer 2013, 119, 1004–1012. [Google Scholar] [CrossRef] [PubMed]
- Bechter, O.; Schöffski, P. Make Your Best BET: The Emerging Role of BET Inhibitor Treatment in Malignant Tumors. Pharmacol. Ther. 2020, 208, 107479. [Google Scholar] [CrossRef] [PubMed]
- Tang, Y.; Gholamin, S.; Schubert, S.; Willardson, M.I.; Lee, A.; Bandopadhayay, P.; Bergthold, G.; Masoud, S.; Nguyen, B.; Vue, N.; et al. Epigenetic Targeting of Hedgehog Pathway Transcriptional Output through BET Bromodomain Inhibition. Nat. Med. 2014, 20, 732–740. [Google Scholar] [CrossRef] [PubMed] [Green Version]
- Puissant, A.; Frumm, S.M.; Alexe, G.; Bassil, C.F.; Qi, J.; Chanthery, Y.H.; Nekritz, E.A.; Zeid, R.; Gustafson, W.C.; Greninger, P.; et al. Targeting MYCN in Neuroblastoma by BET Bromodomain Inhibition. Cancer Discov. 2013, 3, 308–323. [Google Scholar] [CrossRef] [Green Version]
- Camero, S.; Camicia, L.; Marampon, F.; Ceccarelli, S.; Shukla, R.; Mannarino, O.; Pizer, B.; Schiavetti, A.; Pizzuti, A.; Tombolini, V.; et al. BET Inhibition Therapy Counteracts Cancer Cell Survival, Clonogenic Potential and Radioresistance Mechanisms in Rhabdomyosarcoma Cells. Cancer Lett. 2020, 479, 71–88. [Google Scholar] [CrossRef]
- Tzaridis, T.; Milde, T.; Pajtler, K.W.; Bender, S.; Jones, D.T.W.; Müller, S.; Wittmann, A.; Schlotter, M.; Kulozik, A.E.; Lichter, P.; et al. Low-Dose Actinomycin-D Treatment Re-Establishes the Tumoursuppressive Function of P53 in RELA-Positive Ependymoma. Oncotarget 2016, 7, 61860–61873. [Google Scholar] [CrossRef] [Green Version]
- Coudé, M.-M.; Braun, T.; Berrou, J.; Dupont, M.; Bertrand, S.; Masse, A.; Raffoux, E.; Itzykson, R.; Delord, M.; Riveiro, M.E.; et al. BET Inhibitor OTX015 Targets BRD2 and BRD4 and Decreases C-MYC in Acute Leukemia Cells. Oncotarget 2015, 6, 17698–17712. [Google Scholar] [CrossRef] [Green Version]
- Dang, C.V. MYC on the Path to Cancer. Cell 2012, 149, 22–35. [Google Scholar] [CrossRef] [PubMed] [Green Version]
- Rickman, D.S.; Schulte, J.H.; Eilers, M. The Expanding World of N-MYC–Driven Tumors. Cancer Discov. 2018, 8, 150–163. [Google Scholar] [CrossRef] [PubMed] [Green Version]
- Lin, K.H.; Rutter, J.C.; Xie, A.; Pardieu, B.; Winn, E.T.; Bello, R.D.; Forget, A.; Itzykson, R.; Ahn, Y.-R.; Dai, Z.; et al. Using Antagonistic Pleiotropy to Design a Chemotherapy-Induced Evolutionary Trap to Target Drug Resistance in Cancer. Nat. Genet. 2020, 52, 408–417. [Google Scholar] [CrossRef] [PubMed]
- Lockwood, W.W.; Zejnullahu, K.; Bradner, J.E.; Varmus, H. Sensitivity of Human Lung Adenocarcinoma Cell Lines to Targeted Inhibition of BET Epigenetic Signaling Proteins. Proc. Natl. Acad. Sci. USA 2012, 109, 19408–19413. [Google Scholar] [CrossRef] [PubMed] [Green Version]
- Fagnocchi, L.; Cherubini, A.; Hatsuda, H.; Fasciani, A.; Mazzoleni, S.; Poli, V.; Berno, V.; Rossi, R.L.; Reinbold, R.; Endele, M.; et al. A Myc-Driven Self-Reinforcing Regulatory Network Maintains Mouse Embryonic Stem Cell Identity. Nat. Commun. 2016, 7, 11903. [Google Scholar] [CrossRef] [PubMed]
- Laurenti, E.; Wilson, A.; Trumpp, A. Myc’s Other Life: Stem Cells and Beyond. Curr. Opin. Cell Biol. 2009, 21, 844–854. [Google Scholar] [CrossRef] [PubMed]
- Yu, H.; Pardoll, D.; Jove, R. STATs in Cancer Inflammation and Immunity: A Leading Role for STAT3. Nat. Rev. Cancer 2009, 9, 798–809. [Google Scholar] [CrossRef]
- Phi, J.H.; Choi, S.-A.; Kim, S.-K.; Wang, K.-C.; Lee, J.Y.; Kim, D.G. Overcoming Chemoresistance of Pediatric Ependymoma by Inhibition of STAT3 Signaling. Transl. Oncol. 2015, 8, 376–386. [Google Scholar] [CrossRef] [Green Version]
- Griesinger, A.M.; Josephson, R.J.; Donson, A.M.; Mulcahy Levy, J.M.; Amani, V.; Birks, D.K.; Hoffman, L.M.; Furtek, S.L.; Reigan, P.; Handler, M.H.; et al. Interleukin-6/STAT3 Pathway Signaling Drives an Inflammatory Phenotype in Group A Ependymoma. Cancer Immunol. Res. 2015, 3, 1165–1174. [Google Scholar] [CrossRef] [Green Version]
- Wu, T.; Kamikawa, Y.F.; Donohoe, M.E. Brd4’s Bromodomains Mediate Histone H3 Acetylation and Chromatin Remodeling in Pluripotent Cells through P300 and Brg1. Cell Rep. 2018, 25, 1756–1771. [Google Scholar] [CrossRef] [Green Version]
- Liu, F.; Hon, G.C.; Villa, G.R.; Turner, K.M.; Ikegami, S.; Yang, H.; Ye, Z.; Li, B.; Kuan, S.; Lee, A.Y.; et al. EGFR Mutation Promotes Glioblastoma through Epigenome and Transcription Factor Network Remodeling. Mol. Cell 2015, 60, 307–318. [Google Scholar] [CrossRef] [PubMed] [Green Version]
- Gojo, J.; Englinger, B.; Jiang, L.; Hübner, J.M.; Shaw, M.L.; Hack, O.A.; Madlener, S.; Kirchhofer, D.; Liu, I.; Pyrdol, J.; et al. Single-Cell RNA-Seq Reveals Cellular Hierarchies and Impaired Developmental Trajectories in Pediatric Ependymoma. Cancer Cell 2020, 38, 44–59.e9. [Google Scholar] [CrossRef]
- Ghasemi, D.R.; Sill, M.; Okonechnikov, K.; Korshunov, A.; Yip, S.; Schutz, P.W.; Scheie, D.; Kruse, A.; Harter, P.N.; Kastelan, M.; et al. MYCN Amplification Drives an Aggressive Form of Spinal Ependymoma. Acta Neuropathol. 2019, 138, 1075–1089. [Google Scholar] [CrossRef] [PubMed] [Green Version]
- Raffeld, M.; Abdullaev, Z.; Pack, S.D.; Xi, L.; Nagaraj, S.; Briceno, N.; Vera, E.; Pittaluga, S.; Lopes Abath Neto, O.; Quezado, M.; et al. High Level MYCN Amplification and Distinct Methylation Signature Define an Aggressive Subtype of Spinal Cord Ependymoma. Acta Neuropathol. Commun. 2020, 8, 101. [Google Scholar] [CrossRef]
- Singh, S.K.; Clarke, I.D.; Terasaki, M.; Bonn, V.E.; Hawkins, C.; Squire, J.; Dirks, P.B. Identification of a Cancer Stem Cell in Human Brain Tumors. Cancer Res. 2003, 63, 5821–5828. [Google Scholar]
- Milde, T.; Kleber, S.; Korshunov, A.; Witt, H.; Hielscher, T.; Koch, P.; Kopp, H.-G.; Jugold, M.; Deubzer, H.E.; Oehme, I.; et al. A Novel Human High-Risk Ependymoma Stem Cell Model Reveals the Differentiation-Inducing Potential of the Histone Deacetylase Inhibitor Vorinostat. Acta Neuropathol. 2011, 122, 637–650. [Google Scholar] [CrossRef] [Green Version]
- Meco, D.; Servidei, T.; Lamorte, G.; Binda, E.; Arena, V.; Riccardi, R. Ependymoma Stem Cells Are Highly Sensitive to Temozolomide in Vitro and in Orthotopic Models. Neuro-Oncol. 2014, 16, 1067–1077. [Google Scholar] [CrossRef] [PubMed] [Green Version]


Publisher’s Note: MDPI stays neutral with regard to jurisdictional claims in published maps and institutional affiliations. |
© 2021 by the authors. Licensee MDPI, Basel, Switzerland. This article is an open access article distributed under the terms and conditions of the Creative Commons Attribution (CC BY) license (http://creativecommons.org/licenses/by/4.0/).
Share and Cite
Servidei, T.; Meco, D.; Martini, M.; Battaglia, A.; Granitto, A.; Buzzonetti, A.; Babini, G.; Massimi, L.; Tamburrini, G.; Scambia, G.; et al. The BET Inhibitor OTX015 Exhibits In Vitro and In Vivo Antitumor Activity in Pediatric Ependymoma Stem Cell Models. Int. J. Mol. Sci. 2021, 22, 1877. https://0-doi-org.brum.beds.ac.uk/10.3390/ijms22041877
Servidei T, Meco D, Martini M, Battaglia A, Granitto A, Buzzonetti A, Babini G, Massimi L, Tamburrini G, Scambia G, et al. The BET Inhibitor OTX015 Exhibits In Vitro and In Vivo Antitumor Activity in Pediatric Ependymoma Stem Cell Models. International Journal of Molecular Sciences. 2021; 22(4):1877. https://0-doi-org.brum.beds.ac.uk/10.3390/ijms22041877
Chicago/Turabian StyleServidei, Tiziana, Daniela Meco, Maurizio Martini, Alessandra Battaglia, Alessia Granitto, Alexia Buzzonetti, Gabriele Babini, Luca Massimi, Gianpiero Tamburrini, Giovanni Scambia, and et al. 2021. "The BET Inhibitor OTX015 Exhibits In Vitro and In Vivo Antitumor Activity in Pediatric Ependymoma Stem Cell Models" International Journal of Molecular Sciences 22, no. 4: 1877. https://0-doi-org.brum.beds.ac.uk/10.3390/ijms22041877