Article

Lysophosphatidic Acid Accelerates Bovine In Vitro-Produced Blastocyst Formation through the Hippo/YAP Pathway

1
Farm Animal Health, Department Population Health Sciences, Faculty of Veterinary Medicine, Utrecht University, 3584 CM Utrecht, The Netherlands
2
Equine Sciences, Department Clinical Sciences, Faculty of Veterinary Medicine, Utrecht University, 3584 CM Utrecht, The Netherlands
3
Embryology, Anatomy and Physiology, Department Clinical Sciences, Faculty of Veterinary Medicine, Utrecht University, 3584 CL Utrecht, The Netherlands
*
Author to whom correspondence should be addressed.
Int. J. Mol. Sci. 2021, 22(11), 5915; https://0-doi-org.brum.beds.ac.uk/10.3390/ijms22115915
Submission received: 26 April 2021 / Revised: 17 May 2021 / Accepted: 21 May 2021 / Published: 31 May 2021
(This article belongs to the Special Issue Regulation of Gene Expression during Embryonic Development 2.0)

Abstract

:
The segregation of trophectoderm (TE) and inner cell mass in early embryos is driven primarily by the transcription factor CDX2. The signals that trigger CDX2 activation are, however, less clear. In mouse embryos, the Hippo-YAP signaling pathway is important for the activation of CDX2 expression; it is less clear whether this relationship is conserved in other mammals. Lysophosphatidic acid (LPA) has been reported to increase YAP levels by inhibiting its degradation. In this study, we cultured bovine embryos in the presence of LPA and examined changes in gene and protein expression. LPA was found to accelerate the onset of blastocyst formation on days 5 and 6, without changing the TE/inner cell mass ratio. We further observed that the expression of TAZ and TEAD4 was up-regulated, and YAP was overexpressed, in LPA-treated day 6 embryos. However, LPA-induced up-regulation of CDX2 expression was only evident in day 8 embryos. Overall, our data suggest that the Hippo signaling pathway is involved in the initiation of bovine blastocyst formation, but does not affect the cell lineage constitution of blastocysts.

1. Introduction

During mammalian development, the first cell lineage specification is initiated at the compact morula stage, resulting in the formation of a blastocyst with an outer trophectoderm (TE) and an inner cell mass (ICM). During lineage segregation, the transcription factor CDX2 is crucial for proper TE specification [1], whereas OCT4, NANOG, and SOX2 are core regulators of ICM formation [2]. However, the mechanisms that control the expression of these transcription factors are not well understood.
The Hippo signaling pathway is highly conserved in mammals and was initially described as a pathway involved in specifying organ size by controlling cell proliferation and apoptosis [3,4,5,6]. Recently, studies have revealed that the Hippo pathway is involved in follicular activation and follicle growth [7,8,9]. In addition, emerging evidence has indicated that the Hippo-YAP signaling pathway also plays an essential role in controlling the expression of the key transcription factors in first-lineage segregation (ICM and TE differentiation) during mouse preimplantation development [10,11,12,13]. In the cells on the outside of the morula, where the Hippo pathway is inactive, YAP/TAZ remain unphosphorylated and migrate to the nucleus to bind the transcriptional coactivator TEAD4 facilitating Cdx2 expression, and subsequently driving them to a TE fate [11,13,14]. Moreover, it has been reported that both maternal and zygotic-derived YAP promote CDX2 expression, and that Tead4-deleted mouse embryos fail to develop TE [10,15]. When the Hippo pathway is active, YAP/TAZ are phosphorylated, remain cytoplasmic and become ubiquitinated. As a result, there is no Cdx2 expression in these cells, driving them towards an ICM fate [16,17].
Interestingly, unlike in the mouse, YAP is localized to the nucleus of both the ICM and TE cells of human blastocysts. In addition, YAP overexpression has been reported to promote naïve pluripotency in human embryonic, and induced pluripotent, stem cells [18]. These data indicate that role of the Hippo/YAP pathway in first-lineage determination differs among mammalian species.
Lysophosphatidic acid (LPA) is a bioactive phospholipid that regulates a broad range of cellular effects by activating specific G protein-coupled receptors [19,20,21]. It has been demonstrated that LPA-mediated signaling plays a crucial role in embryo spacing and the timing of implantation in mice [22,23]. Recent studies have demonstrated that LPA inhibits the Hippo pathway kinases LATS1 and LATS2 via Ga12/13-coupled receptors [18,24,25]. Phosphorylation of YAP/TAZ via LATS1/2 leads to ubiquitination-dependent degradation [24,26], a process that is inhibited by LPA.
To understand the role of the Hippo signaling pathway in bovine preimplantation embryo development, we cultured bovine in vitro produced embryos in the presence of 10nM LPA from the timing of fertilization. The results suggest that in the presence of LPA, blastocyst formation starts earlier, YAP expression is up-regulated and CDX2 expression is subsequently increased. Combined, the data suggest that in bovine embryos the Hippo/YAP signaling pathway plays an important role in blastocoel formation and the first cell lineage segregation event.

2. Results

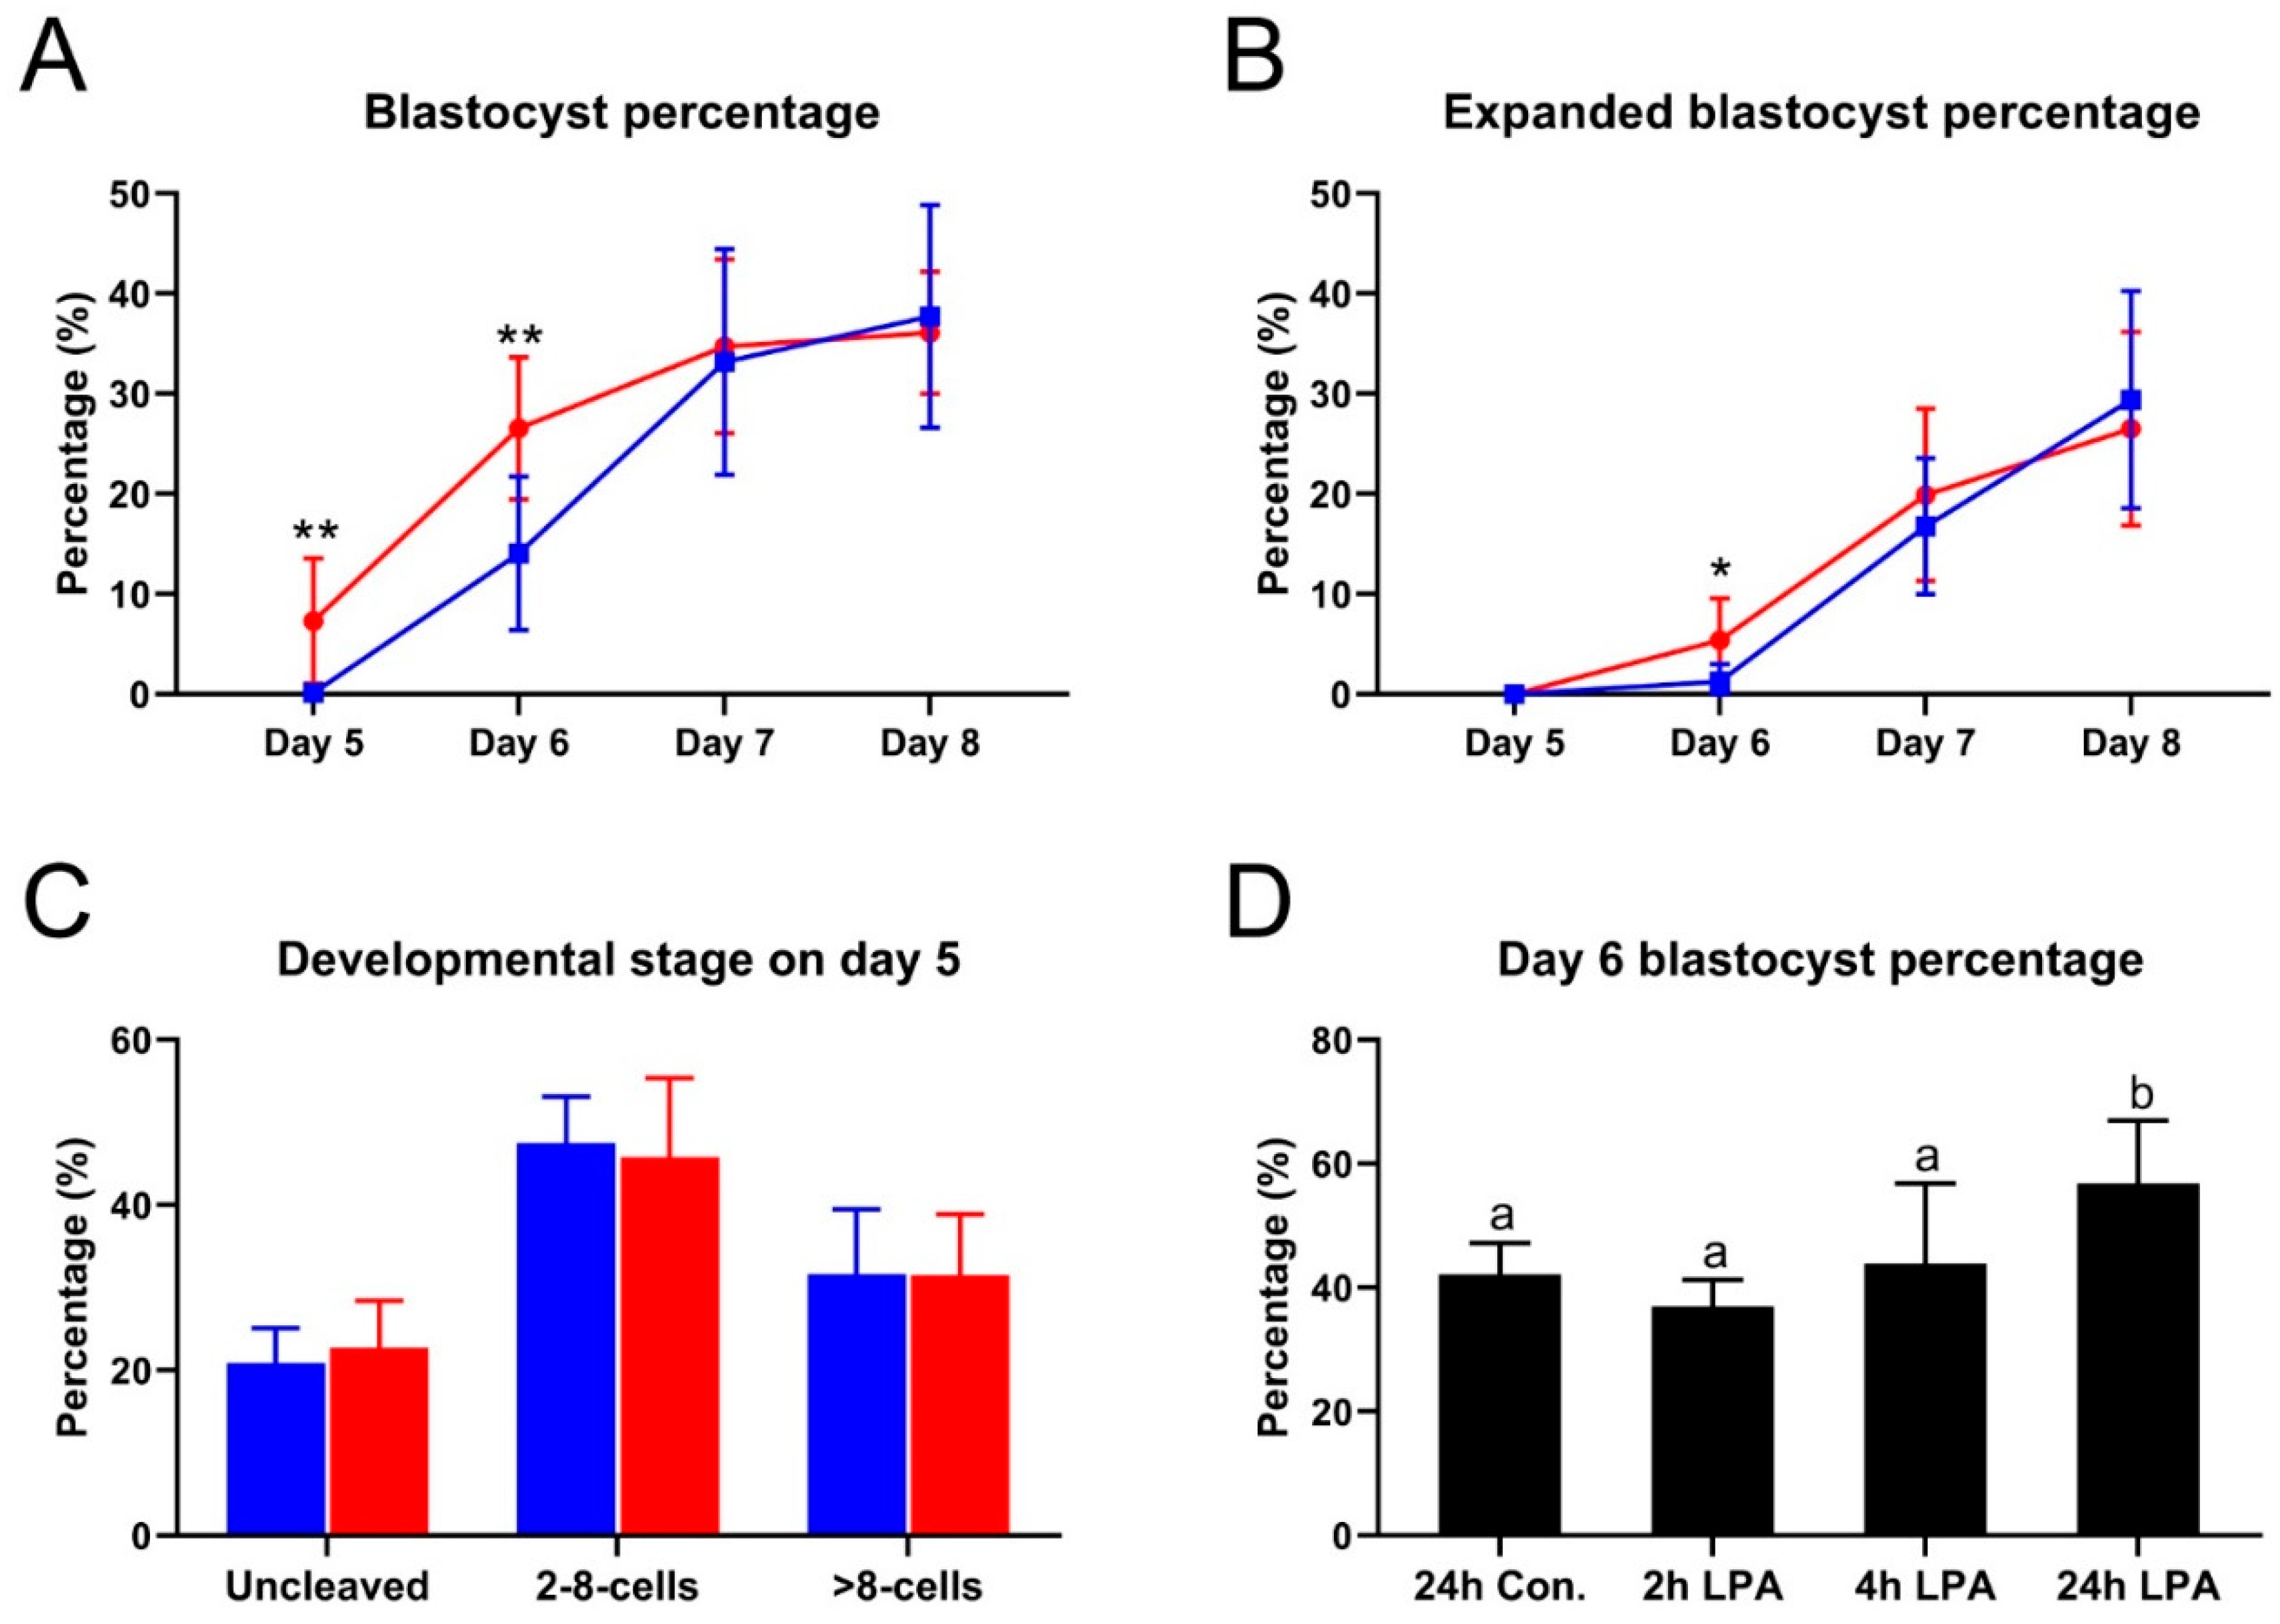
2.1. LPA Accelerates Blastocyst Formation

To examine how the Hippo pathway is involved in embryo development, bovine oocytes were fertilized in vitro and then cultured to the day 8 blastocyst stage in the presence of 10−5 M LPA. Blastocyst formation was first detected on day 6 in the control group. In the presence of LPA, however, blastocysts were already formed at day 5 (Figure 1A). In addition, the blastocyst percentage on day 6 was 14.1% in the control group, whereas in the LPA group it had increased to 26.6% (p < 0.01). A consistently higher (p < 0.05) expanded blastocyst percentage was detected on day 6 for embryos cultured with LPA (5.4%), compared to control embryos (1.3%) (Figure 1B). However, the percentages of both blastocysts and expanded blastocysts on days 7 and 8 of culture were similar between embryos cultured with and without LPA (Figure 1A,B). Similar to our observation on days 7 and 8 of embryo culture, no significant differences were found in the percentages of uncleaved zygotes, 2–8-cell embryos and >8-cell embryos at day 5 of culture (Figure 1C).
To further determine whether LPA stimulation only affects the developmental status of embryos on days 5 and 6 and is time-dependent, embryos were first cultured until day 5 in the absence of LPA; >8-cell stage embryos were then randomly selected and cultured in the presence of LPA. The blastocyst percentage from these >8-cell embryos was not significantly different between the control group (42.1%) and embryos stimulated with LPA for 2 h (37.0%) or 4 h (43.9%), whereas the blastocyst percentage was significantly higher (p < 0.05) when the embryos were exposed to LPA for 24 h (56.8%) (Figure 1D). These data indicate that LPA accelerates blastocyst formation at around day 5 and may therefore affect the first lineage segregation event.

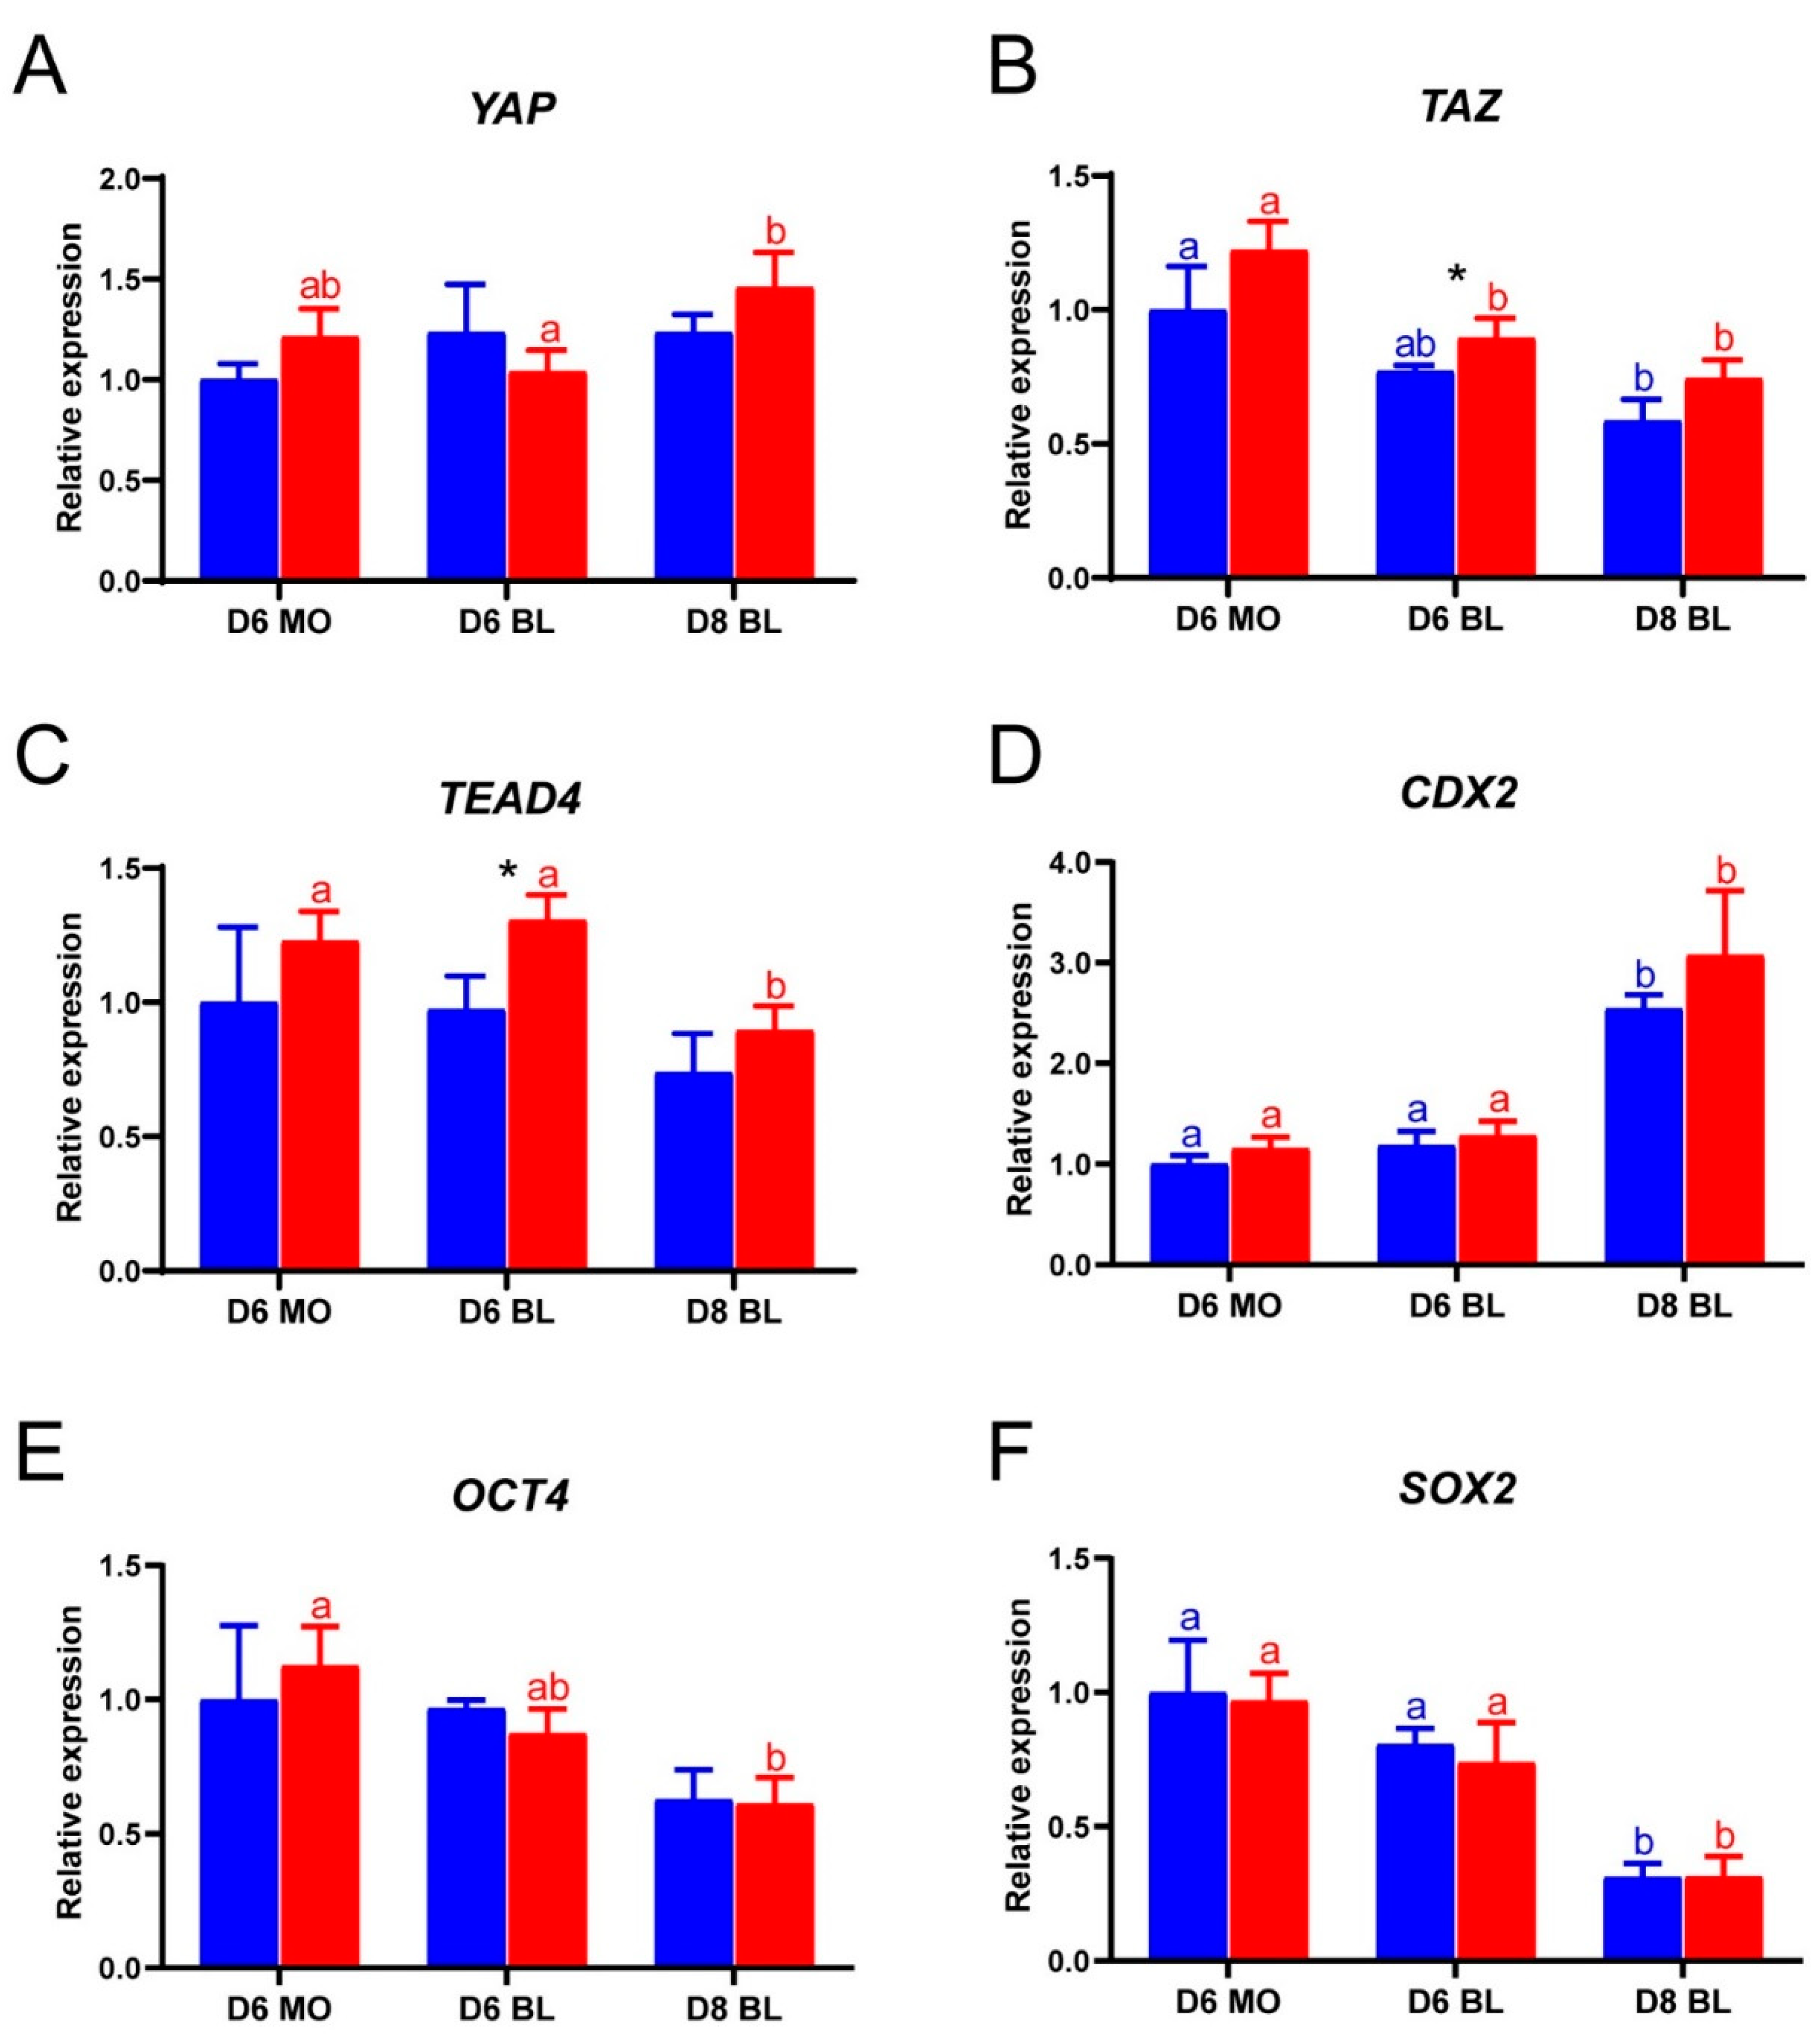
2.2. Gene Expression Levels of LPA-Cultured Embryos

To evaluate how LPA accelerates blastocyst formation, we next quantified gene expression for YAP, TAZ, TEAD4 and of the lineage-specific genes CDX2, OCT4 and SOX2 in day 6 and day 8 embryos. Expression of all the selected genes was detected by quantitative RT-PCR in both LPA-stimulated and control embryos (Figure 2A–F). The YAP expression levels were similar between LPA-stimulated and control embryos at days 6 and 8 (Figure 2A). The expression of TAZ and TEAD4 was significantly higher in day 6 LPA stimulated blastocysts than in control embryos, but there was no difference between-treatment difference in day 6 morulae and day 8 blastocysts (Figure 2B,C). No significant differences in expression of CDX2, OCT4 and SOX2 were detected between LPA-stimulated and control embryos at days 6 and 8 (Figure 2D,E).

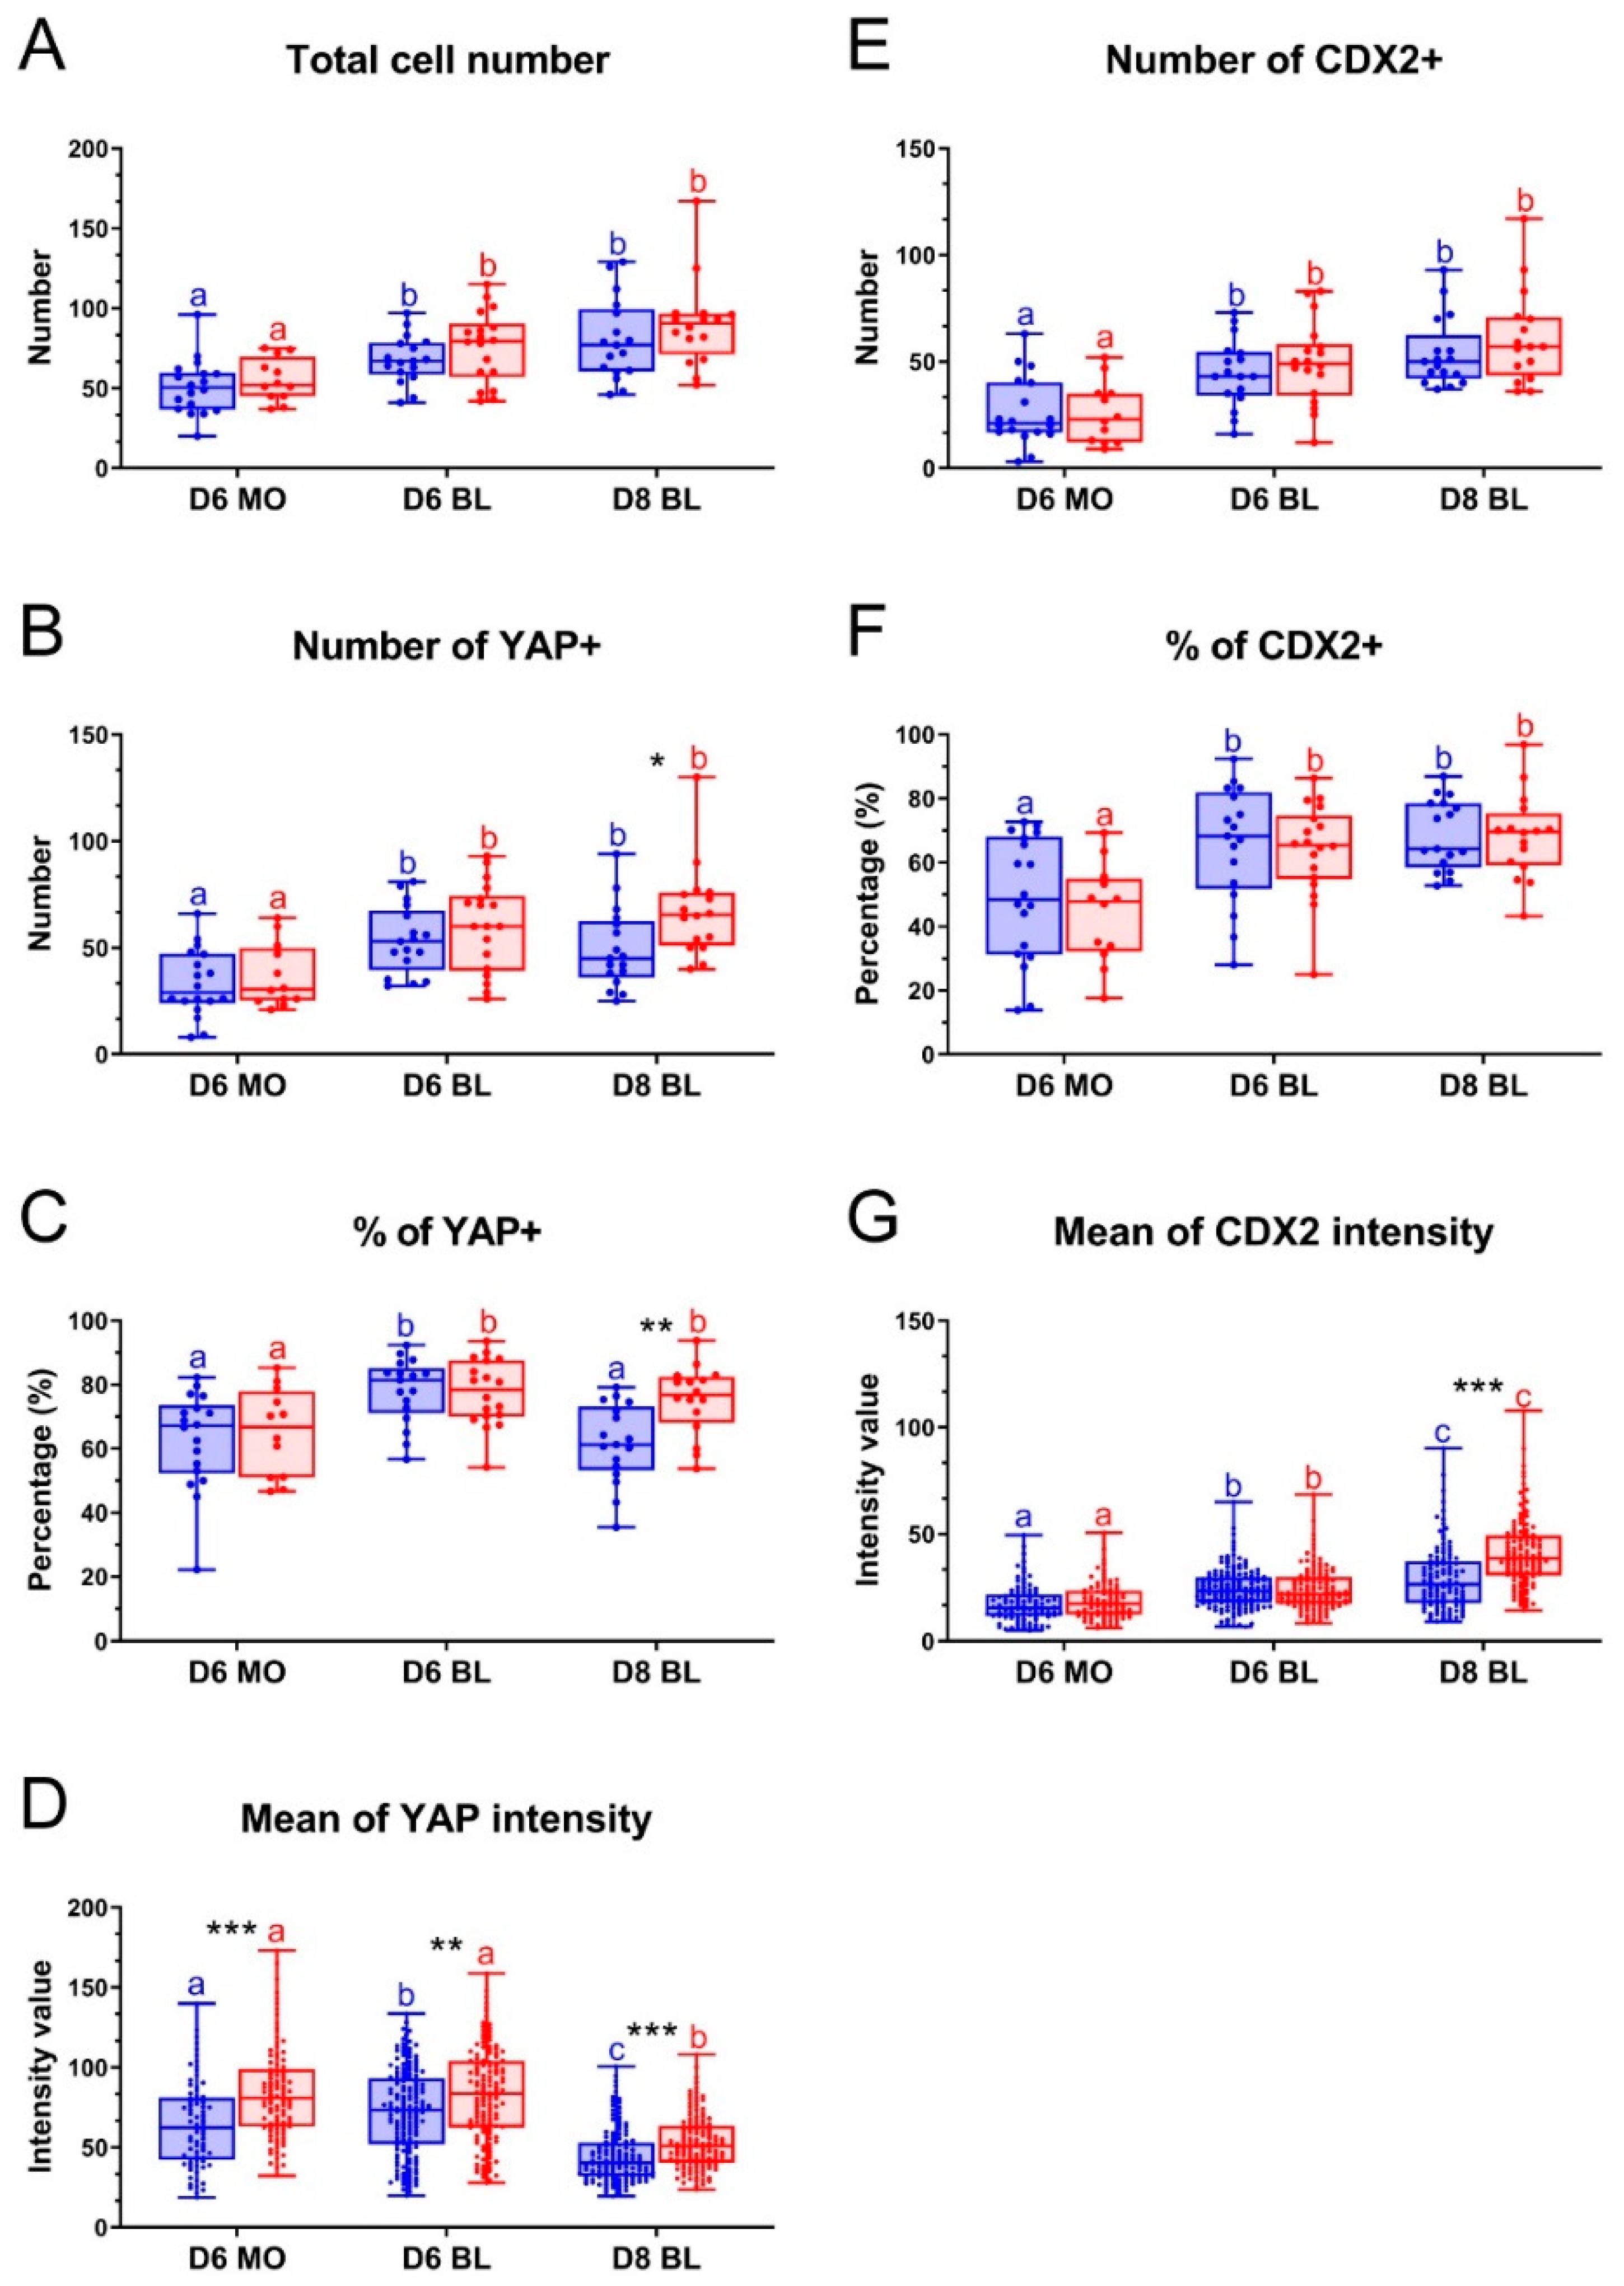
2.3. Effect of LPA on YAP and CDX2 Protein Expression

To investigate the localization of YAP, whole-mount immunofluorescence was performed on day 6 and day 8 bovine embryos. In agreement with the qRT-PCR results, YAP was detected in day 6 morulae and blastocysts, and in day 8 blastocysts (Figure 3). However, unlike in the mouse, we only detected nuclear YAP staining, even in cells spatially located in the inner part of the embryo (Figure 3). To assess the correlation between YAP and CDX2 localization and to evaluate YAP expression in ICM cells, embryos were simultaneously immunostained for CDX2. Interestingly, nuclear YAP was detected in both CDX2-positive and -negative cells in day 6 morulae and blastocysts (Figure 3), suggesting that nuclear YAP alone is not sufficient to drive CDX2 expression.
To examine whether LPA affects YAP expression, we determined the percentages of YAP expressing cells in day 6 and day 8 embryos. The total cell numbers were similar between embryos cultured with and without LPA for day 6 morulae, day 6 blastocysts and day 8 blastocysts (Figure 4A). A similar and high percentage of YAP positive cells was detected after culture with and without LPA in day 6 morulae (65.1% vs. 62.8% respectively) and day 6 blastocysts (77.6% vs. 78.1% respectively) (Figure 4B,C). By contrast, a significantly higher percentage of YAP positive cells was detected in day 8 blastocysts after LPA exposure (75.2%) compared to control medium (61.7%) (Figure 4B,C). The percentages of YAP positive cells were similar between day 6 and day 8 blastocysts after LPA exposure, but were significantly decreased from day 6 to day 8 in control conditions (Figure 4C), indicating that YAP degradation was inhibited by LPA exposure. To compare YAP expression in cells between embryos cultured with and without LPA, the average fluorescence intensity of a total of 5656 YAP positive cells from 98 embryos was analyzed. The fluorescence intensity, quantified as relative fluorescence units (RFU), was significantly higher when embryos were cultured with LPA, compared to control medium for day 6 morulae (83.5 RFU vs. 52.0 RFU), day 6 blastocysts (82.7 RFU vs. 72.2 RFU) and day 8 blastocysts (52.9 RFU vs. 44.5 RFU) (Figure 4D).
Since absence of Hippo signaling can lead to CDX2 expression via YAP, we compared the percentages of CDX2 positive cells in day 6 and day 8 embryos cultured in the presence and absence of LPA. Contrary to expectations, the percentages of CDX2 positive cells were similar between embryos cultured with and without LPA for day 6 morulae (44.3% vs. 48.7%, respectively), day 6 blastocysts (63.9% vs. 65.7%, respectively) and day 8 blastocysts (68.2% vs. 68.7%, respectively) (Figure 4E,F). Moreover, the average CDX2 fluorescence intensity within nuclei were similar between embryos cultured with and without LPA for day 6 morulae (18.6 RFU vs. 15.8 RFU) and day 6 blastocysts (24.1 RFU vs. 23.8 RFU). However, the CDX2 intensity was significantly higher in day 8 blastocysts cultured in the presence of LPA (41.3 RFU), compared to control medium (24.9 RFU) (Figure 4G).

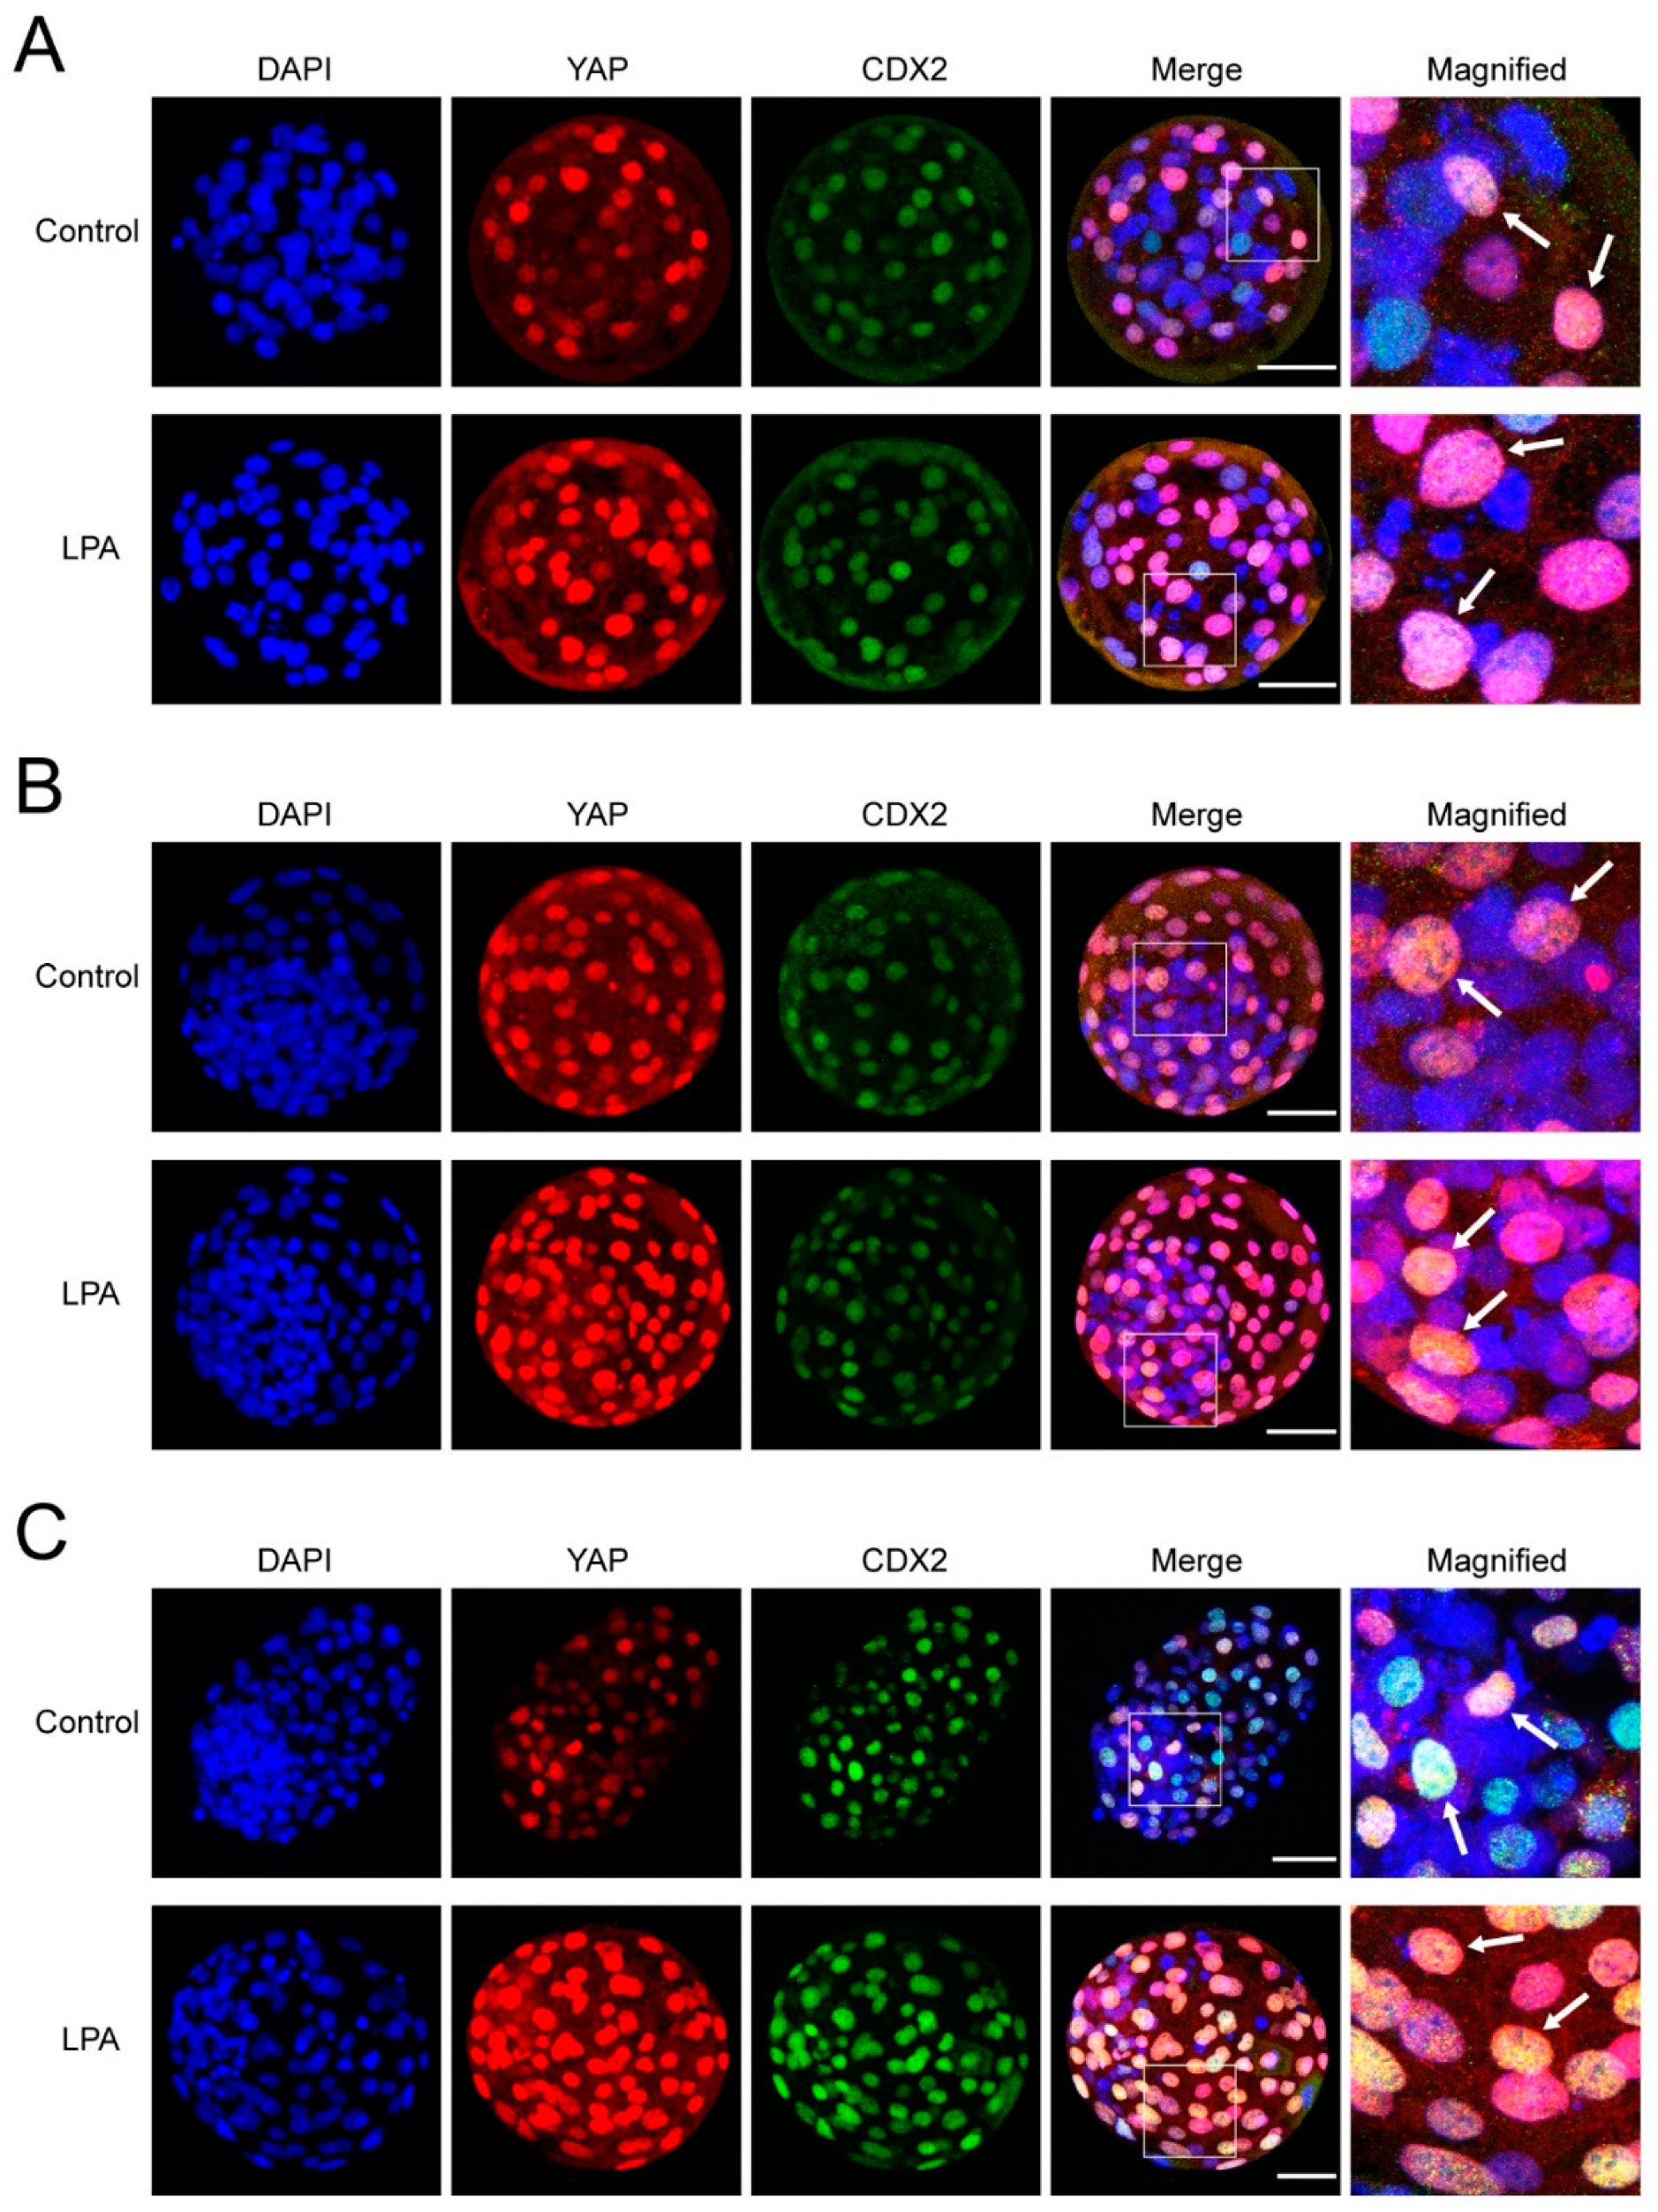
2.4. Colocalization of YAP and CDX2 in Bovine Embryos

We next focused on the relative localization of YAP and CDX2 in day 6 and day 8 embryos. A similar percentage of cells with colocalization of YAP and CDX2 was detected in embryos cultured, respectively, with or without LPA for day 6 morulae (43.3% vs. 43.7%), day 6 blastocysts (62.0% vs. 60.8%) and day 8 blastocysts (63.3% vs. 56.7%) (Figure 5A,B). In addition, the percentages of cells positive for YAP but negative for CDX2 expression was similar between embryos cultured with and without LPA for day 6 morulae (20.8% vs. 19.1%) and day 6 blastocysts (15.5% vs. 18.0%). However, for day 8 blastocysts, a significantly higher percentage of YAP positive but CDX2 negative cells was detected when embryos were cultured in the presence of LPA (11.5%), compared to control medium (4.9%) (Figure 5C,D). In addition, significantly lower percentages of CDX2 positive but YAP negative cells were present in embryos cultured with LPA, compared to control medium for day 6 morulae (1.1% vs. 5.0%), day 6 blastocysts (1.9% vs. 4.9%) and day 8 blastocysts (4.9% vs. 10.6%) (Figure 5E,F). Combined, the data suggest that CDX2 expression in the nucleus lags behind the nuclear localization of YAP.

3. Discussion

In mouse development, nuclear YAP is important for CDX2 expression and TE specification [13]. In human embryonic stem cells, however, YAP overexpression induces naïve pluripotency [18], indicating that the role of YAP in early cell lineage segregation may not be conserved among mammals. Since YAP/TAZ signaling can be enhanced by LPA [18,24,27], we studied the role of the Hippo/YAP pathway in embryonic development and lineage segregation by culturing bovine embryos in the presence of LPA.
LPA is present in all mammalian cells and tissues and can induce a broad range of cellular effects, such as proliferation, survival, and migration [20,28,29]. Our results demonstrate that LPA stimulation accelerates bovine blastocyst formation on days 5 and day 6 of in vitro culture, without changing the total cell number at day 6 or day 8. This indicates that YAP signaling does not affect the rate of cell division during bovine embryo development. In mouse embryos, similarly, LPA did not alter cleavage rates but increased the percentage of 2-cell stage embryos that developed to blastocysts [30]. In porcine parthenogenetic embryos, LPA increased the cleavage and blastocyst rates and total cell numbers [31]; all of which suggests that the function of LPA in embryos varies between different mammalian species.
In general, unphosphorylated YAP translocates to the nucleus, whereas phosphorylated YAP undergoes cytoplasmic inactivation [11,13,14]. Here we detected YAP only in nuclei in day 6 and day 8 bovine embryos, when using an anti-YAP antibody that recognizes both phosphorylated and unphosphorylated YAP; it is possible that YAP is rapidly removed from the cytoplasm after phosphorylation.
LPA has been shown to increase YAP expression by inhibiting the Hippo pathway kinases LATS1/2 [18,24]. Indeed, by comparing the intensity of fluorescence, we showed that YAP expression levels were higher in day 6 and 8 embryos cultured in the presence of LPA than in embryos cultured without LPA. No difference in YAP gene expression was detected between embryos cultured with and without LPA, indicating that LPA does not affect YAP transcription.
The transcription factor CDX2 is essential for TE specification and blastocyst formation [32]. Indeed, the percentage of CDX2 positive cells, and average CDX2 intensity within single nuclei, were higher in day 6 blastocysts than day 6 morulae. In the presence of LPA, the percentage of embryos that had developed into blastocysts at day 6 was almost doubled, indicating that more cells within those individual embryos reached the CDX2 expression threshold for TE differentiation in the presence of LPA. However, the intensity of fluorescence after CDX2 immunostaining was not different in LPA-exposed embryos, suggesting other mechanisms are involved in maintaining CDX2 expression at a certain level. Of the embryos that had reached the blastocyst stage at day 6, no difference in the percentage of CDX2-expressing cells was observed after LPA exposure, indicating that the TE/ICM ratio is not affected by the Hippo signaling pathway.

4. Materials and Methods

4.1. Chemicals

All chemicals were purchased from Sigma Aldrich (St. Louis, MO, USA) unless otherwise stated.

4.2. In Vitro Embryo Production and LPA Stimulation

Cumulus oocyte complexes (COCs) collection, oocyte recovery and in vitro fertilization were performed as described previously [33]. In short, COCs were aspirated from 2-8mm follicles from cattle ovaries, which were collected from a local slaughterhouse. the COCs were then cultured in maturation medium for 23 h at 38.5 °C, in an atmosphere of 5% CO2-in-air, after which oocytes were fertilized with sperm for 20–22 h and fertilization day was considered as day 0 of embryo development. After removal of the cumulus cells, zygotes were randomly allocated to one of two experimental groups: (i) cultured in synthetic oviductal fluid (SOF) [34]; and (ii) LPA, cultured in SOF supplemented with 10−5 M LPA for further development at 38.5 °C, in a humidified atmosphere containing 5% CO2 and 7% O2. On day 5, embryos were transferred to fresh SOF or SOF supplemented with 10−5 M LPA respectively, and cultured until day 8.
Developmental stage on day 5 and blastocyst percentage from days 5 to 8 were analyzed by 2 independent researchers (double-blinded).

4.3. RNA Isolation, cDNA Generation and Quantitative Reverse Transcription-PCR

Groups of 20–22 embryos were collected and stored in 100 µL RLT buffer (Qiagen, Venlo, The Netherlands) at −80 °C until RNA isolation. Total RNA isolation and cDNA generation was performed as described previously [34].
The quantitative reverse transcription PCR was performed as described previously [34] using specific primer sequences and annealing temperatures for amplification (Table S1). Three independent biological cDNA samples were analyzed in duplicate. Expression of RPL15, SDHA and YWHAZ was used for normalization.

4.4. Immunofluorescence

Immunofluorescence was performed as described previously [34]. In short, after fixation, samples were incubated with mouse monoclonal antibody against CDX2 (Biogenex, CA, USA; CDX2-88; 1:200) and rabbit monoclonal antibody against YAP (Cell signaling technologies, Leiden, The Netherlands; #14074; 1:100) in dilution buffer (1× PBS, 1% BSA, 0.3% Triton X-100) overnight. Samples were incubated with the secondary antibodies: goat anti mouse Alexa488 (Invitrogen, Venlo, The Netherlands) and goat anti rabbit Alexa568 (Invitrogen, Venlo, The Netherlands) at 37 °C for 1 h after washings. Subsequently, nuclei were stained with DAPI for 20 min in the dark. After sample mounting, fluorescent images were obtained from a confocal laser microscope (SPE-II-DMI4000; Leica, Son, The Netherlands) with a Z-stack scanning and were further analyzed using IMARIS software (Bitplane, Zürich, Switzerland). Total cell number of individual embryo was determined by DAPI staining. Presumptive ICM cells and presumptive TE cells were determined by CDX2 negative and positive staining, respectively.

4.5. Statistical Analysis

Results are shown as means ± standard deviation in bar graphs. Excel and GraphPad Prism 8 (https://www.graphpad.com/scientific-software/prism/; accessed on 6 February 2019) was used to perform statistical analysis. Differences between two groups were analyzed by two-tailed unpaired Student’s t-tests. One-way ANOVA was performed to examine the differences between multiple groups and a post-hoc Tukey test was used to test significant differences for individual differences. Statistical significance was set at p < 0.05.

5. Conclusions

This study has demonstrated for the first time insightful and strongly evidence-based recognition of LPA-induced mechanisms underlying and identification of Hippo/YAP signaling pathway-related factors affecting not only onset and acceleration of blastocyst formation but also promotion of blastomere commitment and differentiation to ICM and TE cell lineages in bovine in vitro fertilization (IVF)-derived embryos. As a consequence, the LPA-triggered and Hippo/YAP pathway-mediated approaches could be widely applied to expedite the blastocyst formation by mammalian embryos that have been generated using other assisted reproductive technologies such as somatic cell nuclear transfer (SCNT) [35,36,37].

Supplementary Materials

The following are available online at https://0-www-mdpi-com.brum.beds.ac.uk/article/10.3390/ijms22115915/s1, Table S1 List of primers used for quantitative RT-PCR. Sense and anti-sense sequences are indicated by ‘s’ and ‘as’ respectively. Ta = annealing temperature.

Author Contributions

Conceptualization, B.Y., H.T.A.v.T. and B.A.J.R.; methodology, B.Y., H.T.A.v.T. and B.A.J.R.; funding acquisition, B.A.J.R. and B.Y.; investigation, B.Y., H.T.A.v.T. and C.H.Y.O.; resources, B.A.J.R.; data curation, B.Y.; writing—original draft preparation, B.Y.; writing—review and editing, T.A.E.S. and B.A.J.R.; visualization, B.Y.; supervision, T.A.E.S. and B.A.J.R.; project administration, B.A.J.R. All authors have read and agreed to the published version of the manuscript.

Funding

Please B.Y. is supported by a PhD scholarship from the Chinese Scholarship Council (CSC).

Institutional Review Board Statement

Not applicable.

Informed Consent Statement

Not applicable.

Data Availability Statement

Data is contained within the article.

Acknowledgments

We thank Arend Rijneveld for assistance with oocyte recovery. The Center for Cell Imaging (CCI) of the Faculty of Veterinary Medicine is thanked for valuable assistance with microscopy.

Conflicts of Interest

The authors declare no conflict of interest.

Abbreviations

TETrophectoderm
ICMInner cell mass
LPALysophosphatidic acid
RFURelative fluorescence units
COCsCumulus-oocyte complexes
IVFin vitro fertilization
SOFSynthetic oviductal fluid
SCNTSomatic cell nuclear transfer

References

  1. Huang, D.; Guo, G.; Yuan, P.; Ralston, A.; Sun, L.; Huss, M.; Mistri, T.; Pinello, L.; Ng, H.H.; Yuan, G.; et al. The role of Cdx2 as a lineage specific transcriptional repressor for pluripotent network during the first developmental cell lineage segregation. Sci. Rep. 2017, 7, 17156. [Google Scholar] [CrossRef] [PubMed] [Green Version]
  2. Boyer, L.A.; Lee, T.I.; Cole, M.F.; Johnstone, S.E.; Levine, S.S.; Zucker, J.P.; Guenther, M.G.; Kumar, R.M.; Murray, H.L.; Jenner, R.G.; et al. Core Transcriptional Regulatory Circuitry in Human Embryonic Stem Cells. Cell 2005, 122, 947–956. [Google Scholar] [CrossRef] [Green Version]
  3. Watt, K.I.; Harvey, K.F.; Gregorevic, P. Regulation of Tissue Growth by the Mammalian Hippo Signaling Pathway. Front. Physiol. 2017, 8, 942. [Google Scholar] [CrossRef] [PubMed] [Green Version]
  4. Chen, Y.; Han, H.; Seo, G.; Vargas, R.E.; Yang, B.; Chuc, K.; Zhao, H.; Wang, W. Systematic analysis of the Hippo pathway organization and oncogenic alteration in evolution. Sci. Rep. 2020, 10, 1–12. [Google Scholar] [CrossRef] [PubMed] [Green Version]
  5. Zheng, Y.; Pan, D. The Hippo Signaling Pathway in Development and Disease. Dev. Cell 2019, 50, 264–282. [Google Scholar] [CrossRef] [PubMed]
  6. Zhao, B.; Tumaneng, K.; Guan, K.-L. The Hippo pathway in organ size control, tissue regeneration and stem cell self-renewal. Nat. Cell Biol. 2011, 13, 877–883. [Google Scholar] [CrossRef]
  7. Kawashima, I.; Kawamura, K. Regulation of follicle growth through hormonal factors and mechanical cues mediated by Hippo signaling pathway. Syst. Biol. Reprod. Med. 2018, 64, 3–11. [Google Scholar] [CrossRef] [Green Version]
  8. Grosbois, J.; Demeestere, I. Dynamics of PI3K and Hippo signaling pathways during in vitro human follicle activation. Hum. Reprod. 2018, 33, 1705–1714. [Google Scholar] [CrossRef]
  9. Masciangelo, R.; Hossay, C.; Chiti, M.C.; Manavella, D.D.; Amorim, C.A.; Donnez, J.; Dolmans, M.-M. Role of the PI3K and Hippo pathways in follicle activation after grafting of human ovarian tissue. J. Assist. Reprod. Genet. 2020, 37, 101–108. [Google Scholar] [CrossRef] [PubMed]
  10. Frum, T.; Murphy, T.M.; Ralston, A. HIPPO signaling resolves embryonic cell fate conflicts during establishment of pluripotency in vivo. eLife 2018, 7. [Google Scholar] [CrossRef]
  11. Karasek, C.; Ashry, M.; Driscoll, C.S.; Knott, J.G. A tale of two cell-fates: Role of the Hippo signaling pathway and transcription factors in early lineage formation in mouse preimplantation embryos. Mol. Hum. Reprod. 2020, 26, 653–664. [Google Scholar] [CrossRef]
  12. Bergsmedh, A.; Donohoe, M.E.; Hughes, R.-A.; Hadjantonakis, A.-K. Understanding the Molecular Circuitry of Cell Lineage Specification in the Early Mouse Embryo. Genes 2011, 2, 420–448. [Google Scholar] [CrossRef] [Green Version]
  13. Nishioka, N.; Inoue, K.-I.; Adachi, K.; Kiyonari, H.; Ota, M.; Ralston, A.; Yabuta, N.; Hirahara, S.; Stephenson, R.O.; Ogonuki, N.; et al. The Hippo Signaling Pathway Components Lats and Yap Pattern Tead4 Activity to Distinguish Mouse Trophectoderm from Inner Cell Mass. Dev. Cell 2009, 16, 398–410. [Google Scholar] [CrossRef] [Green Version]
  14. Yao, C.; Zhang, W.; Shuai, L. The first cell fate decision in pre-implantation mouse embryos. Cell Regen. 2019, 8, 51–57. [Google Scholar] [CrossRef]
  15. Nishioka, N.; Yamamoto, S.; Kiyonari, H.; Sato, H.; Sawada, A.; Ota, M.; Nakao, K.; Sasaki, H. Tead4 is required for specification of trophectoderm in pre-implantation mouse embryos. Mech. Dev. 2008, 125, 270–283. [Google Scholar] [CrossRef] [PubMed]
  16. Lorthongpanich, C.; Issaragrisil, S. Emerging Role of the Hippo Signaling Pathway in Position Sensing and Lineage Specification in Mammalian Preimplantation Embryos1. Biol. Reprod. 2015, 92, 143. [Google Scholar] [CrossRef]
  17. Chen, Y.-A.; Lu, C.-Y.; Cheng, T.-Y.; Pan, S.-H.; Chen, H.-F.; Chang, N.-S. WW Domain-Containing Proteins YAP and TAZ in the Hippo Pathway as Key Regulators in Stemness Maintenance, Tissue Homeostasis, and Tumorigenesis. Front. Oncol. 2019, 9, 60. [Google Scholar] [CrossRef] [PubMed] [Green Version]
  18. Qin, H.; Hejna, M.; Liu, Y.; Percharde, M.; Wossidlo, M.; Blouin, L.; Durruthy-Durruthy, J.; Wong, P.; Qi, Z.; Yu, J.; et al. YAP Induces Human Naive Pluripotency. Cell Rep. 2016, 14, 2301–2312. [Google Scholar] [CrossRef] [PubMed] [Green Version]
  19. Frisca, F.; Sabbadini, R.A.; Goldshmit, Y.; Pébay, A. Biological Effects of Lysophosphatidic Acid in the Nervous System. Int. Rev. Cell Mol. Biol. 2012, 296, 273–322. [Google Scholar] [CrossRef] [PubMed]
  20. Lin, M.-E.; Herr, D.R.; Chun, J. Lysophosphatidic acid (LPA) receptors: Signaling properties and disease relevance. Prostaglandins Other Lipid Mediat. 2010, 91, 130–138. [Google Scholar] [CrossRef] [Green Version]
  21. Sheng, X.; Yung, Y.C.; Chen, A.; Chun, J. Lysophosphatidic acid signalling in development. Development 2015, 142, 1390–1395. [Google Scholar] [CrossRef] [PubMed] [Green Version]
  22. Hama, K.; Aoki, J.; Inoue, A.; Endo, T.; Amano, T.; Motoki, R.; Kanai, M.; Ye, X.; Chun, J.; Matsuki, N.; et al. Embryo Spacing and Implantation Timing Are Differentially Regulated by LPA3-Mediated Lysophosphatidic Acid Signaling in Mice1. Biol. Reprod. 2007, 77, 954–959. [Google Scholar] [CrossRef] [PubMed]
  23. Ye, X.; Hama, K.; Contos, J.J.A.; Anliker, B.; Inoue, A.; Skinner, M.K.; Suzuki, H.; Amano, T.; Kennedy, G.; Arai, H.; et al. LPA3-mediated lysophosphatidic acid signalling in embryo implantation and spacing. Nat. Cell Biol. 2005, 435, 104–108. [Google Scholar] [CrossRef]
  24. Yu, F.-X.; Zhao, B.; Panupinthu, N.; Jewell, J.L.; Lian, I.; Wang, L.H.; Zhao, J.; Yuan, H.; Tumaneng, K.; Li, H.; et al. Regulation of the Hippo-YAP Pathway by G-Protein-Coupled Receptor Signaling. Cell 2012, 150, 780–791. [Google Scholar] [CrossRef] [PubMed] [Green Version]
  25. Felley-Bosco, E.; Stahel, R. Hippo/YAP pathway for targeted therapy. Transl. Lung Cancer Res. 2014, 3, 75–83. [Google Scholar]
  26. Liu, H.; Du, S.; Lei, T.; Wang, H.; He, X.; Tong, R.; Wang, Y. Multifaceted regulation and functions of YAP/TAZ in tumors (Review). Oncol. Rep. 2018, 40, 16–28. [Google Scholar] [CrossRef]
  27. Moroishi, T.; Park, H.W.; Qin, B.; Chen, Q.; Meng, Z.; Plouffe, S.W.; Taniguchi, K.; Yu, F.-X.; Karin, M.; Pan, D.; et al. A YAP/TAZ-induced feedback mechanism regulates Hippo pathway homeostasis. Genes Dev. 2015, 29, 1271–1284. [Google Scholar] [CrossRef] [Green Version]
  28. Teo, S.T.; Yung, Y.C.; Herr, D.R.; Chun, J. Lysophosphatidic acid in vascular development and disease. IUBMB Life 2009, 61, 791–799. [Google Scholar] [CrossRef] [PubMed] [Green Version]
  29. Kim, D.; Li, H.Y.; Lee, J.H.; Oh, Y.S.; Jun, H.-S. Lysophosphatidic acid increases mesangial cell proliferation in models of diabetic nephropathy via Rac1/MAPK/KLF5 signaling. Exp. Mol. Med. 2019, 51, 1–10. [Google Scholar] [CrossRef] [PubMed] [Green Version]
  30. Kobayashi, T.; Yamano, S.; Murayama, S.; Ishikawa, H.; Tokumura, A.; Aono, T. Effect of lysophosphatidic acid on the preimplantation development of mouse embryos. FEBS Lett. 1994, 351, 38–40. [Google Scholar] [CrossRef] [Green Version]
  31. Zhu, X.; Li, L.; Gao, B.; Zhang, D.; Ren, Y.; Zheng, B.; Li, M.; Shi, D.; Huang, B. Early development of porcine parthenogenetic embryos and reduced expression of primed pluripotent marker genes under the effect of lysophosphatidic acid. Reprod. Domest. Anim. 2018, 53, 1191–1199. [Google Scholar] [CrossRef] [PubMed]
  32. Wu, G.; Gentile, L.; Fuchikami, T.; Sutter, J.; Psathaki, K.; Esteves, T.C.; Araúzo-Bravo, M.J.; Ortmeier, C.; Verberk, G.; Abe, K.; et al. Initiation of trophectoderm lineage specification in mouse embryos is independent of Cdx2. Development 2010, 137, 4159–4169. [Google Scholar] [CrossRef] [Green Version]
  33. Brinkhof, B.; Van Tol, H.T.A.; Koerkamp, M.J.A.G.; Riemers, F.M.; Ijzer, S.G.; Mashayekhi, K.; Haagsman, H.P.; Roelen, B.A.J. A mRNA landscape of bovine embryos after standard and MAPK-inhibited culture conditions: A comparative analysis. BMC Genom. 2015, 16, 277. [Google Scholar] [CrossRef] [PubMed] [Green Version]
  34. Yu, B.; Van Tol, H.T.A.; Stout, T.A.E.; Roelen, B.A.J. Cellular Fragments in the Perivitelline Space Are Not a Predictor of Expanded Blastocyst Quality. Front. Cell Dev. Biol. 2021, 8, 616801. [Google Scholar] [CrossRef] [PubMed]
  35. Zhang, Y.; Gao, E.; Guan, H.; Wang, Q.; Zhang, S.; Liu, K.; Yan, F.; Tian, H.; Shan, D.; Xu, H.; et al. Vitamin C treatment of embryos, but not donor cells, improves the cloned embryonic development in sheep. Reprod. Domest. Anim. 2019, 55, 255–265. [Google Scholar] [CrossRef]
  36. Samiec, M.; Skrzyszowska, M.; Opiela, J. Creation of cloned pig embryos using contact-inhibited or serum-starved fibroblast cells analysed intravitam for apoptosis occurrence/Uzyskiwanie klonalnych zarodków świni z wykorzystaniem komórek fibroblastycznych poddanych inhibicji kontaktowej lub deprywacji troficznej oraz analizowanych przyżyciowo w kierunku apoptozy. Ann. Anim. Sci. 2013, 13, 275–293. [Google Scholar] [CrossRef] [Green Version]
  37. Olivera, R.; Moro, L.N.; Jordan, R.; Luzzani, C.; Miriuka, S.; Radrizzani, M.; Donadeu, F.X.; Vichera, G. In Vitro and In Vivo Development of Horse Cloned Embryos Generated with iPSCs, Mesenchymal Stromal Cells and Fetal or Adult Fibroblasts as Nuclear Donors. PLoS ONE 2016, 11, e0164049. [Google Scholar] [CrossRef] [Green Version]
Figure 1. Effect of lysophosphatidic acid (LPA) on bovine embryo development. Blastocyst percentage (A) and expanded blastocyst percentage (B) after in vitro culture in the absence (blue) or presence (red) of 10−5 M LPA. Significant differences are individual time points are indicated by * (p < 0.05) and ** (p < 0.01). (C) Embryo development at day 5 after culture without (blue) and with (red) LPA. (D) Blastocyst percentage on day 6. Embryos with >8 cells were collected on day 5 and cultured without LPA (control) and with LPA for different time periods as indicated, and further cultured without LPA to complete the 24 h. Significant differences among columns are indicated by different letters above the bars. Data are depicted as mean ± standard deviation of more than three biological replicates. Con. = control, h = hours.
Ijms 22 05915 g001
Figure 2. The relative expression of Hippo pathway and pluripotency genes in bovine embryos cultured in the absence of LPA (blue) and in the presence of 10−5 M LPA (red), as determined by quantitative RT-PCR. (A) YAP, (B) TAZ, (C) TEAD4, (D) CDX2, (E) OCT4, (F) SOX2. Relative expression from control embryos was set at 1; * (p < 0.05) indicates a significant difference between embryos cultured with and without LPA. Significant differences between developmental stages are presented by different letters with the same color (p < 0.05). Error bars indicate standard deviations of three biological replicates. D = day, MO = morula, BL = blastocyst.
Ijms 22 05915 g002
Figure 3. YAP and CDX2 immunofluorescence in bovine embryos cultured in the absence (control) or presence of 10−5 M LPA. Day 6 morula (A), day 6 blastocyst (B) and day 8 blastocyst (C). The areas in the white boxes are presented at higher magnification in the right column. YAP and CDX2 colocalization is indicated (arrows). Scale bar = 50 μm.
Ijms 22 05915 g003
Figure 4. Effect of LPA on YAP and CDX2 expression in bovine embryos. Embryos were cultured in the absence of LPA (blue) or in the presence of 10−5 M LPA (red). Total cell number (A), number of YAP positive cells (B), percentage of YAP positives out of total cell population (C), Mean YAP intensity (RFU) in single nuclei (D), number of CDX2 positive cells (E), percentage of CDX2 positives of total cell population (F), Mean CDX2 intensity (RFU) in single nuclei (G). * (p < 0.05), ** (p < 0.01) and *** (p < 0.005) indicate significant differences between embryos cultured with and without LPA. Significant differences among embryos cultured under the same conditions are indicated by different letters with the same color (p < 0.05). Error bars indicate standard deviations of embryos or single cells, collected from three biological replicates. D = day, MO = morula, BL = blastocyst.
Ijms 22 05915 g004
Figure 5. Effect of LPA on YAP and CDX2 localization in bovine embryos. Embryos were cultured in the absence of LPA (blue) or in the presence of 10−5 M LPA (red). Number of cells with colocalized YAP and CDX2 (A), percentage of YAP and CDX2 colocalization out of total cells (B), number of YAP positive (YAP+) but CDX2 negative (CDX2-) cells (C), percentage of YAP positive but CDX2 negative cells (D), number of YAP negative (YAP-) but CDX2 positive (CDX2+) cells (E), percentage of YAP negative but CDX2 positive cells (F). * (p < 0.05) and ** (p < 0.01) indicate significant differences between embryos cultured with and without LPA. Significant differences among embryos cultured under the same conditions are indicated by different letters with the same color (p < 0.05). Error bars indicate standard deviations for embryos, collected from three biological replicates. D = day, MO = morula, BL = blastocyst.
Ijms 22 05915 g005
Publisher’s Note: MDPI stays neutral with regard to jurisdictional claims in published maps and institutional affiliations.

