Article

Metabolite Profiling and Transcriptome Analysis Provide Insight into Seed Coat Color in Brassica juncea

1
Chongqing Rapeseed Engineering Research Center, College of Agronomy and Biotechnology, Southwest University, Chongqing 400715, China
2
Academy of Agricultural Sciences, Southwest University, Chongqing 400715, China
3
Engineering Research Center of South Upland Agriculture, Ministry of Education, Chongqing 400715, China
4
Academy of Agricultural and Forestry Sciences, Qinghai University, Xining 810016, China
*
Authors to whom correspondence should be addressed.
These authors contributed equally to this work.
Int. J. Mol. Sci. 2021, 22(13), 7215; https://0-doi-org.brum.beds.ac.uk/10.3390/ijms22137215
Submission received: 18 May 2021 / Revised: 29 June 2021 / Accepted: 29 June 2021 / Published: 5 July 2021
(This article belongs to the Special Issue Genetics of Plant Metabolism)

Abstract

:
The allotetraploid species Brassica juncea (mustard) is grown worldwide as oilseed and vegetable crops; the yellow seed-color trait is particularly important for oilseed crops. Here, to examine the factors affecting seed coat color, we performed a metabolic and transcriptomic analysis of yellow- and dark-seeded B. juncea seeds. In this study, we identified 236 compounds, including 31 phenolic acids, 47 flavonoids, 17 glucosinolates, 38 lipids, 69 other hydroxycinnamic acid compounds, and 34 novel unknown compounds. Of these, 36 compounds (especially epicatechin and its derivatives) accumulated significantly different levels during the development of yellow- and dark-seeded B. juncea. In addition, the transcript levels of BjuDFR, BjuANS,BjuBAN, BjuTT8, and BjuTT19 were closely associated with changes to epicatechin and its derivatives during seed development, implicating this pathway in the seed coat color determinant in B. juncea. Furthermore, we found numerous variations of sequences in the TT8A genes that may be associated with the stability of seed coat color in B. rapa, B. napus, and B. juncea, which might have undergone functional differentiation during polyploidization in the Brassica species. The results provide valuable information for understanding the accumulation of metabolites in the seed coat color of B. juncea and lay a foundation for exploring the underlying mechanism.

1. Introduction

Brassica juncea L. (AABB, n = 18), also called mustard, is an important crop that was formed by means of the hybridization of the ancestors of the diploid species Brassica rapa (AA, n = 10) and Brassica nigra (BB, n = 8) [1]. B. juncea has a long history of cultivation and is cultivated worldwide in countries such as China, India, Canada, and Europe. Different varieties and cultivars have been classified for root-use, stem-use, leaf-use and oil-use based on different edible organs [2,3,4]. In Brassica oilseed crops, the yellow-seeded varieties are preferred over the dark-seeded varieties due to their thin seed coat and high oil content [5,6]. Among the oilseed Brassica species, the naturally yellow-seeded germplasm recourses usually exist in the diploid B. rapa (Yellow Sarson type) and allotetraploid B. juncea varieties [7,8] but are not found in Brassica oleracea and Brassica napus. Furthermore, numerous studies have shown that the regulatory mechanisms underlying seed coat color significantly differ among the different species of the Brassica genus [7,8,9,10,11,12,13,14,15,16].
In Brassica species, the seed pigments are predominantly flavonoid metabolites, i.e., flavonols, anthocyanins, and proanthocyanidins (PAs), which are mainly produced through the pathway of flavonoid biosynthesis [10,17,18]. PAs are the most numerous and widely distributed polyphenols in plants and determine seed coat color in Arabidopsis thaliana [9,10,11], Medicago truncatula [19,20], sheepgrass (Leymus chinensis) [21], and B. napus [13,16,22]. In addition, advances in metabolomics technologies have led to numerous flavonoids being identified in B. oleracea [23], B. rapa [24], B. napus [14,25], and B. juncea [26,27]. However, the pathway of flavonoid biosynthesis has been well studied by the TT (TRANSPARENT TESTA) loci in model plant A. thaliana [18,28,29,30,31,32,33,34], providing valuable resources and references for elucidating the mechanism of seed coat color. Meanwhile, homologs of these TT genes have been reported in B. rapa [12], B. napus [13,15], and B. juncea [8,35]. Generally, the flavonoid biosynthesis genes are mainly divided into two categories: structural genes and regulatory genes [18]. Among the structural genes, chalcone synthase (CHS), chalcone isomerase (CHI), flavanone 3-hydroxylase (F3H), and flavanone 3′-hydroxylase (F3′H) are involved in the production of common precursors (i.e., flavonols and other flavonoid compounds) and have also been called the early biosynthetic genes (EBGs), while the downstream genes of the pathway, including dihydroflavonol reductase (DFR), anthocyanidin synthase (ANS; synonym leucocyanidin dioxygenase, LDOX), and anthocyanidin reductase (ANR/BAN), are usually called the late biosynthetic genes (LBGs) [36,37,38]. Another regulatory genes category mainly includes a series of transcription factor genes (TT1, TT2, TT8, TT16, and TTG1), which are involved in the control of the production of anthocyanin/PAs [18,30]. For example, the transcription factors TT2 (R2R3-MYB), TT8 (basic helix-loop-helix, bHLH), and TTG1 (WD40) [39]. These form the ternary MYB–bHLH–WDR (MBW) complex, which plays a pivotal role in the flavonoid biosynthesis pathway by regulating the expression levels and patterns of the structural genes [39,40,41,42]. Among them, the expression of BjuTT8 is closely associated with seed coat color [8], as seen in A. thaliana [34] and B. rapa [43]. In addition, the R2R3-MYB transcription factors, i.e., PAP1/MYB75, PAP2, MYB113, and MYB114, also positively regulate the accumulation of anthocyanin [44,45]. In addition, some gene encoding transfer proteins, such as transporters glutathione S-transferase 26 (GST26/TT19), auto-inhibited H+-ATPase isoform 10 (AHA10), MATE transporter (TT12), and a laccase gene, laccase 15 (LAC15) have been found to be involved in flavonoid transport [18,29,30,46,47,48]. These results lay a foundation for elucidating the mechanisms of seed coloration in Brassica species.
Recently, multi-omics analysis (integrating transcriptomics, metabolomics, proteomics, and genomics) has become an effective tool for screening and analyzing the key genes of various metabolic pathways in plants [42,49,50]. Furthermore, the gene to metabolite networks are well understood, especially in the flavonoid biosynthesis pathways of many species, including A. thaliana [51], red and green kale (B. oleracea) [52], red mustard greens [27], and purple tumorous stem mustard [42]. However, the metabolome and transcriptome of yellow- and dark B. juncea seeds remain to be explored, and this will provide important clues for elucidating the molecular mechanism underlying seed coat color formation of B. juncea.
Brassica species are ideal models for studying polyploid genome evolution [53], and B. juncea has the yellow-seeded trait genus naturally [8]. Therefore, we used the genome sequence of B. juncea [1,54] to perform comprehensive transcriptome and metabolic profiling of developing seeds in yellow- and dark-seeded B. juncea. In this study, our results identified differentially abundant metabolic compounds, including phenolic acids, flavonoids, lipid compounds, hydroxycinnamic acids, and novel unknown compounds. Moreover, the expression profiles of some genes were investigated by transcriptomic analysis and RT-qPCR and were highly consistent with the accumulation patterns of differential metabolites during seed development in yellow- and dark-seeded B. juncea. In addition, the different variants of TT8A are associated with the seed coat color among the Brassica species, indicating that TT8 underwent functional differentiation during polyploid genome evolution. Our results provide insight into the function of the key genes involved in flavonoid biosynthesis and help to elucidate the molecular mechanisms of seed coat coloration in B. juncea.

2. Results

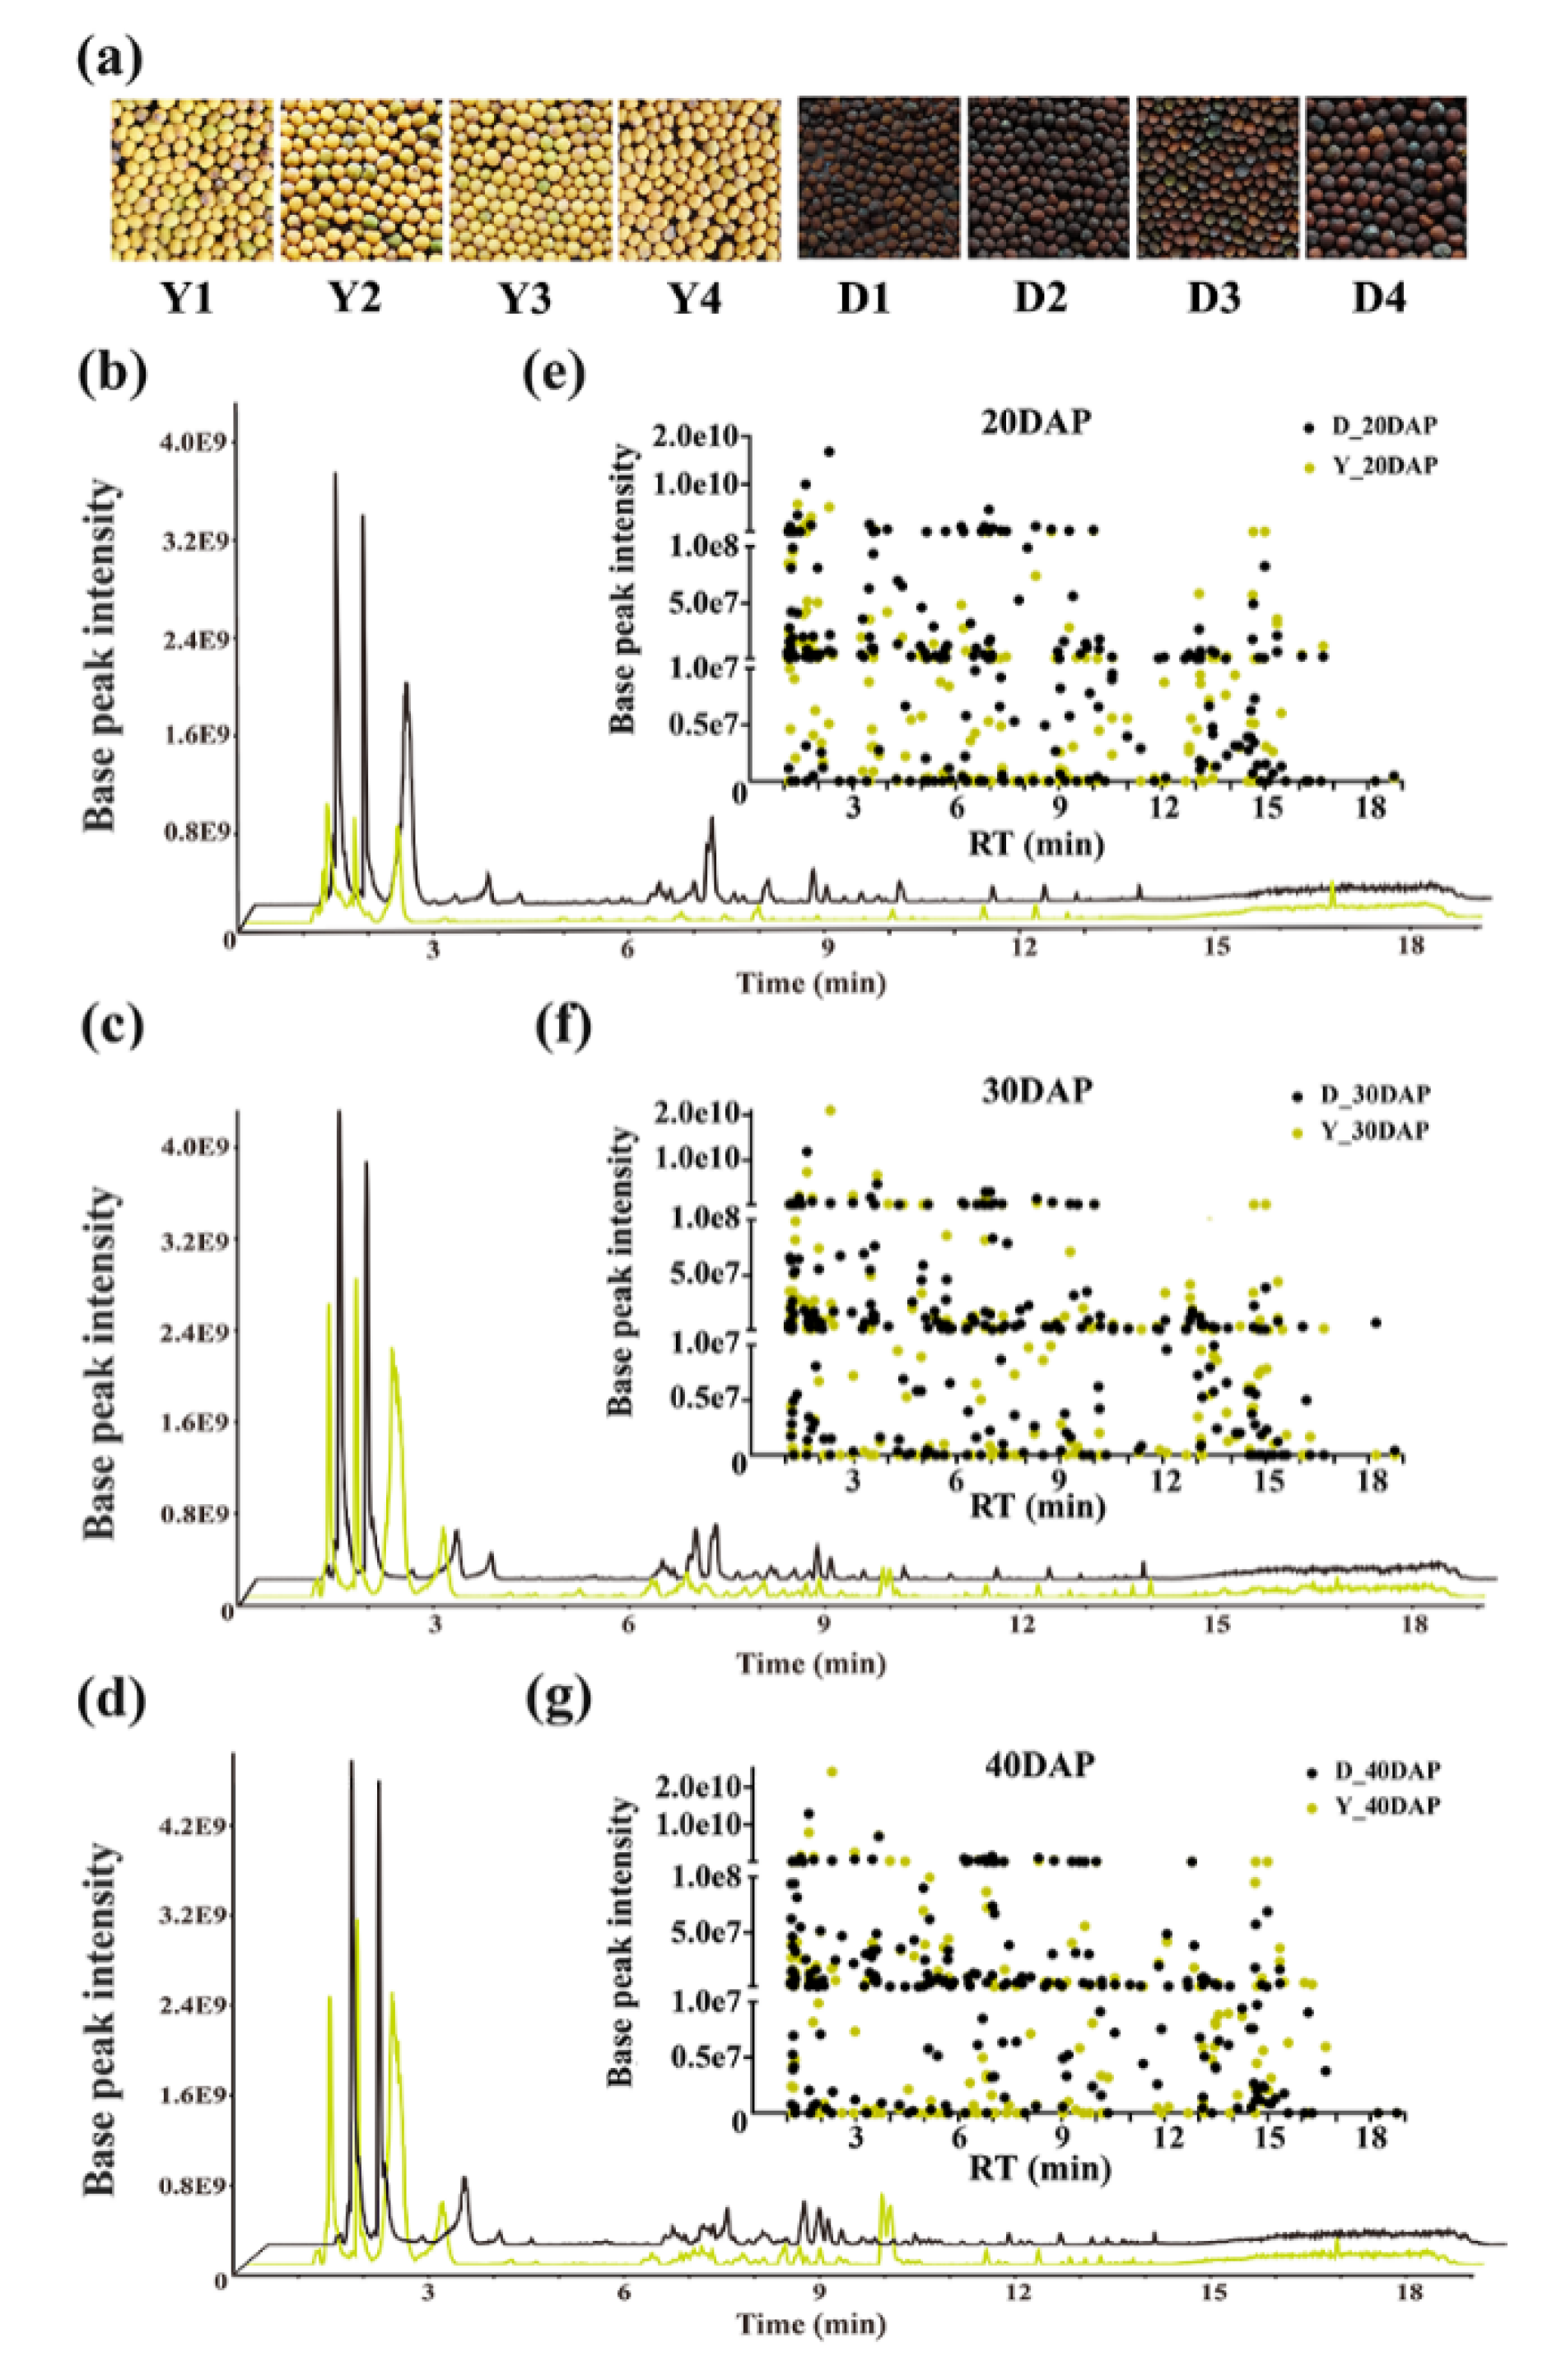
2.1. Metabolite Profiling of Developing B. juncea Seeds

To investigate the metabolic differences between yellow- and dark-seeded B. juncea, we selected eight B. juncea seed samples at different stages of development (20, 30, and 40 DAP), which showed obvious differences in seed coat color (Figure 1a). The relative metabolite contents of all of the samples were analyzed by UPLC-HESI-MS/MS in negative mode. A total of 13,574 base peak chromatograms identified by MS-DIAL version 4.18 software were produced from seeds at different developmental stages in yellow- and dark-seeded B. juncea (Figure 1b–d). Among them, 1440 could be identified and recorded by MS-DIAL ver. 4.18 software with a mass bank negative MS/MS database. We extracted 236 discernible base peak chromatograms according to their retention times (RT), accurate MS, and MS/MS spectral data together with the available key standards and previously reported information in this study, including 31 phenolic acids, 47 flavonoids, 17 glucosinolates, 38 lipid compounds, 69 other hydroxycinnamic acid compounds, and 34 unknown compounds (Figure 1e–g, Supplementary Table S1). Both the total base peak chromatograms and the base peak intensity of the extracted compounds differed between the dark mustard seeds and the yellow mustard seeds (Figure 1b–g).

2.2. Differential Metabolic Profiling Analysis Based on OPLS-DA

All of the peak areas of the discernible chromatograms were calculated using Xcalibur 3.1 software. The PCA score plot revealed a clear separation between the developing seeds from the yellow- and dark-seeded B. juncea, which was indicated by PCA1 (32%) and PCA2 (21%) (Supplementary Figure S1a), suggesting a significantly different metabolic profile among them, with a dynamic change accumulation during seed development. Meanwhile, the biological replicates of the same sample types showed a good stability and high reliability through the UPLC-HESI-MS/MS detection (Supplementary Figure S1a).
To identify metabolites that were differentially abundant between the yellow- and dark-seeded B. juncea, we performed differential analysis on the samples from three developmental stages based on OPLS-DA. The OPLS-DA model compared the metabolite content of the samples in pairs to evaluate the differences the between yellow- and dark-seeded B. juncea at 20 DAP (R2X = 0.488, R2Y = 0.979, Q2 = 0.915), 30 DAP (R2X = 0.453, R2Y = 0.989, Q2 = 0.958) and 40 DAP (R2X = 0.408, R2Y = 0.996, Q2 = 0.977). All Q2 values of the model were close to 1, and all blue Q2 values to the left are lower than the original points to the right (Supplementary Figure S2a–c), indicating that these models could be used to further screen for differentially abundant metabolites.
We conducted a subsequent analysis of the differential metabolites that accumulated in the yellow- versus the dark-seeded B. juncea, with a VIP value ≥ 1, p value < 0.05, and a fold change value ≥ 1.6 or ≤ 0.625 for each group (Supplementary Table S2). As shown in the scatter diagram (Figure 2a–c), there were 63 significantly differentially abundant metabolites at 20 DAP (23 down-regulated, 40 up-regulated), 82 at 30 DAP (41 down-regulated, 41 up-regulated), and 70 at 40 DAP (23 down-regulated, 47 up-regulated). In addition, the principal component analysis (PCA) of the metabolite profiles showed that these metabolite profiles were obviously distinct at the three stages development of both the yellow- and dark-seeded varieties (Supplementary Figure S1b), and the metabolite profiles at 30 DAP and 40 DAP were closer than the profiles at 20 DAP in the yellow-seeded variety, indicating that the metabolite contents have dynamic variation during seed development. Meanwhile, the Venn diagram shows that 36 common differentially abundant metabolites were observed at all three stages (Figure 2d, Supplementary Table S3). As expected, there were 17 different metabolites in the flavonoid group, which is more than any other group (Table 1). At 40 DAP, epicatechin (243.94-fold), [DP2]-1 (549.83-fold), [DP2]-2 (263.83-fold), [DP3]-2 (643.99-fold), [DP3]-1 (1926.20-fold), and [DP4] (7.948-fold) were produced in greater concentrations in the dark-seeded variety than in the yellow-seeded variety, respectively (Table 1, Supplementary Table S4). In addition, the eriodictyol contents (615.06-fold) had higher accumulation levels in the dark-seeded variety than in yellow-seeded variety. Our results support that epicatechin and PAs are important factors affecting seed coat formation in B. juncea.

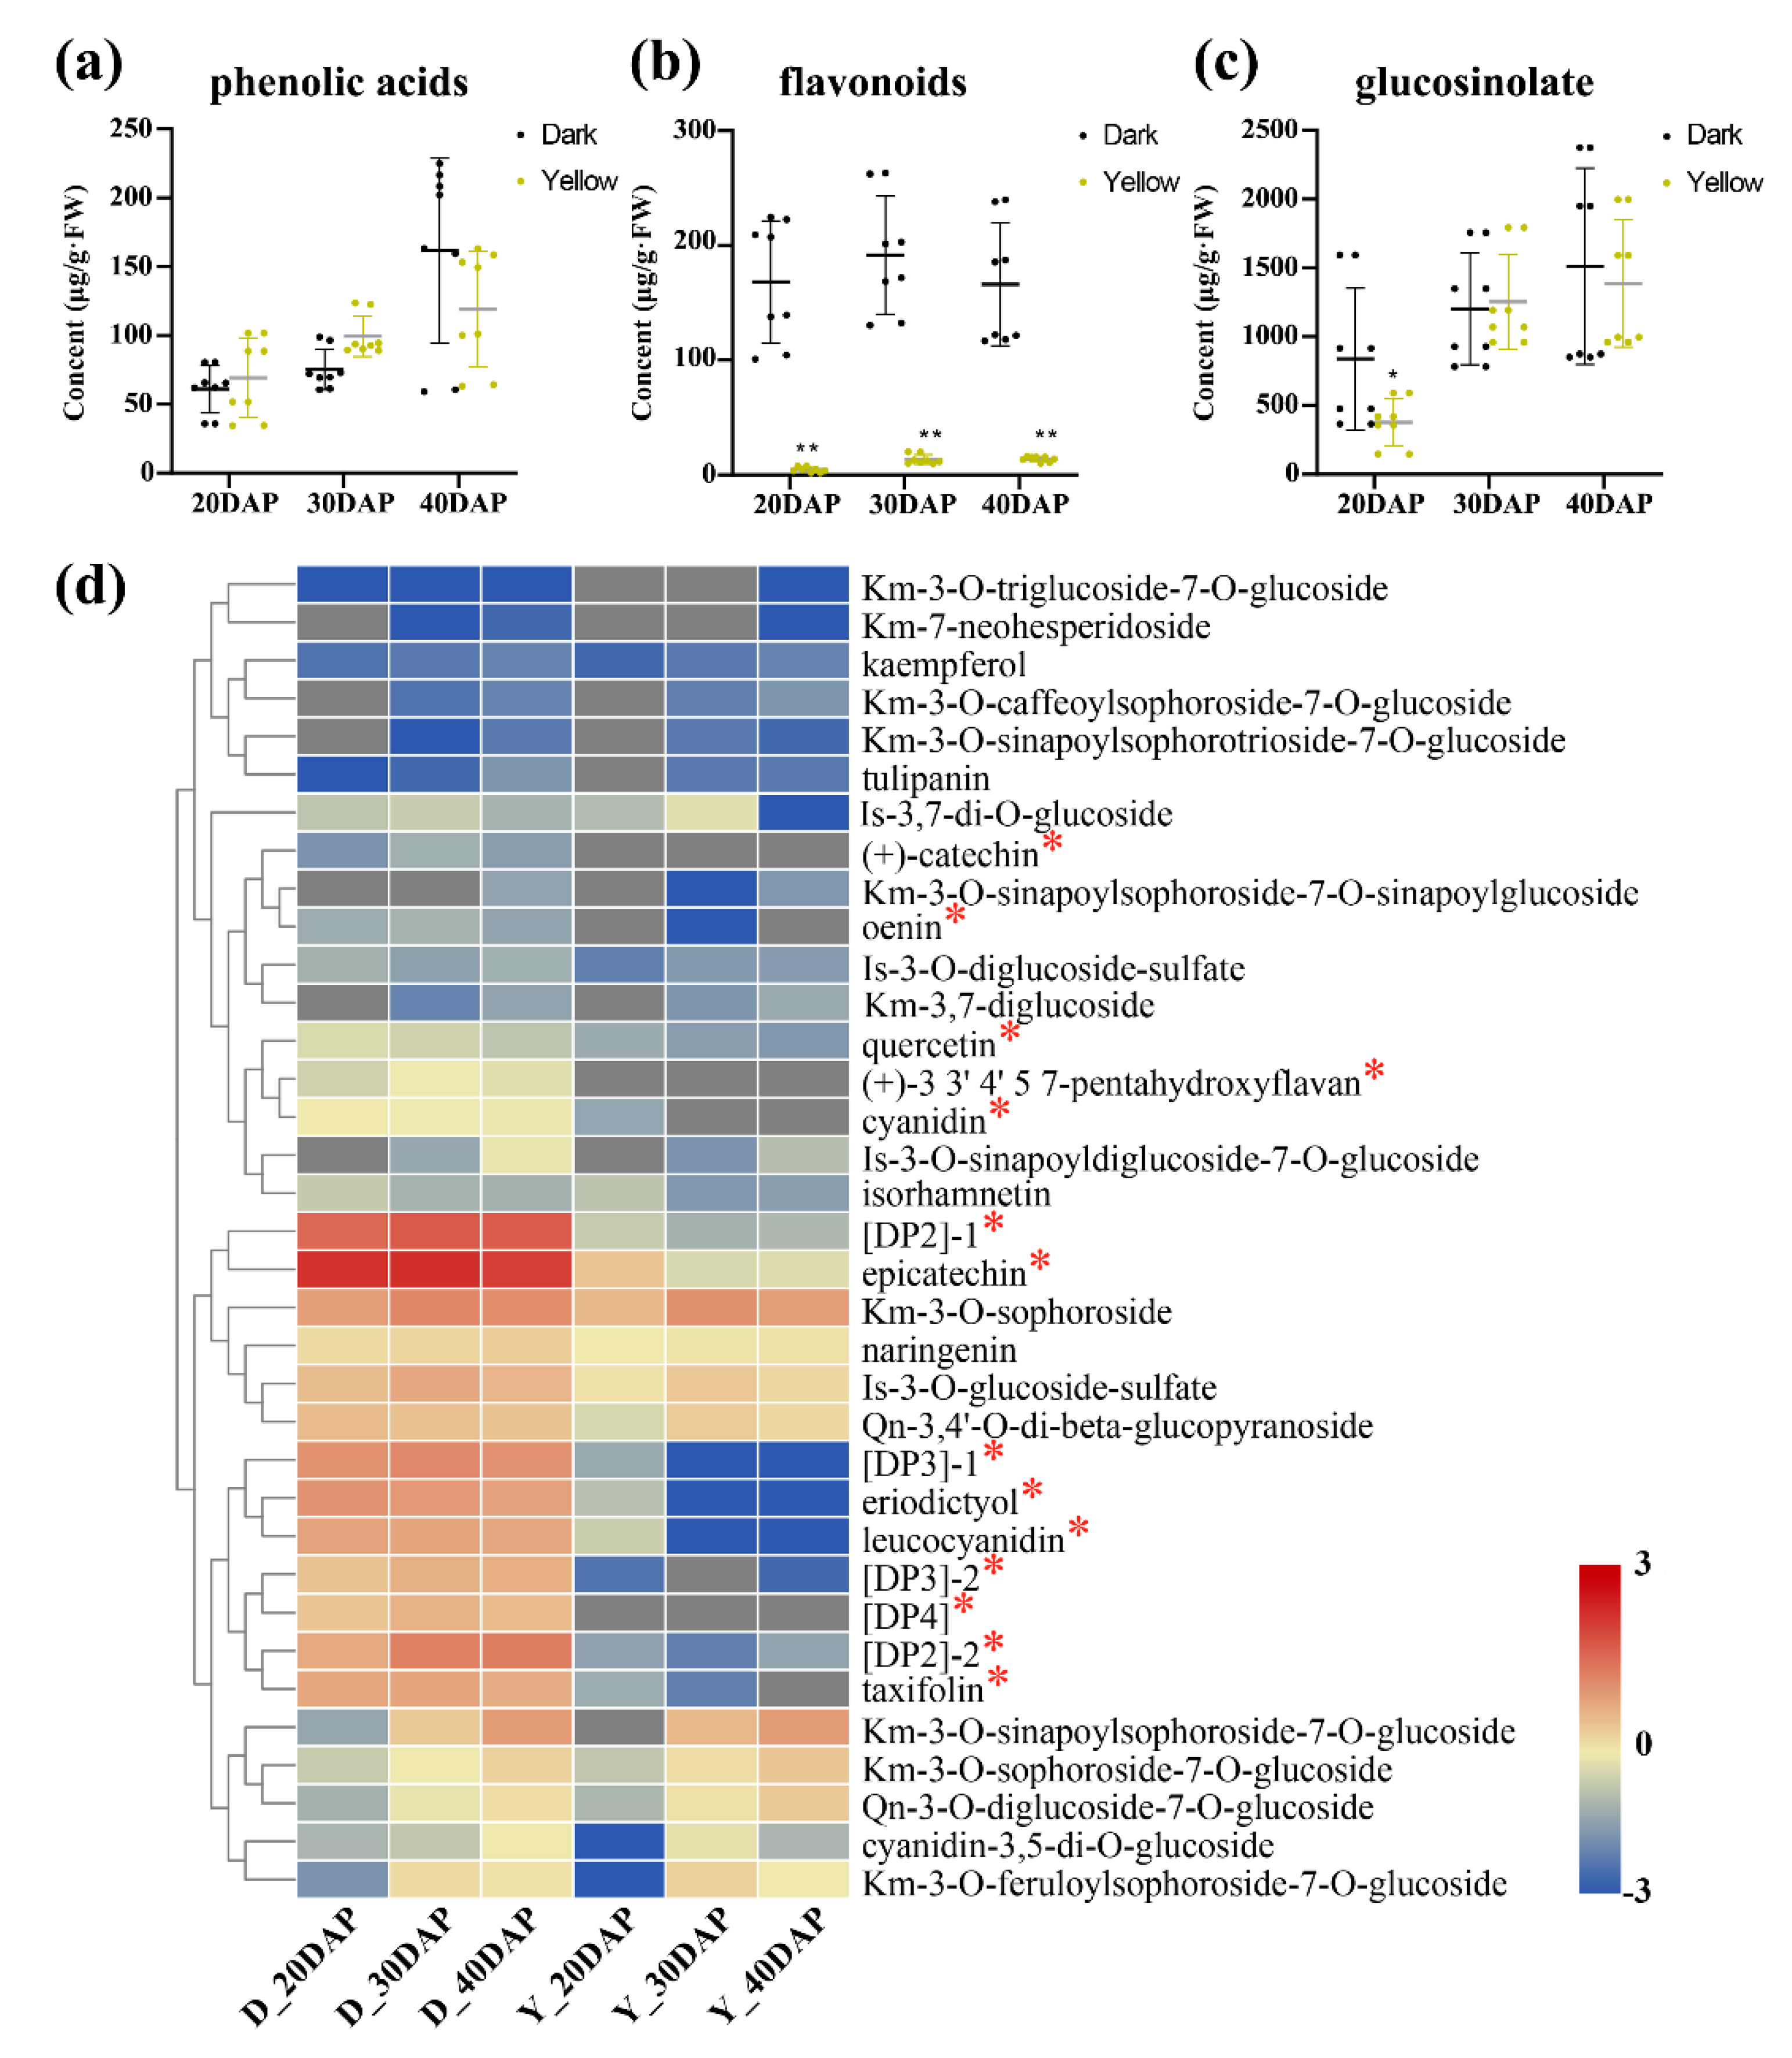
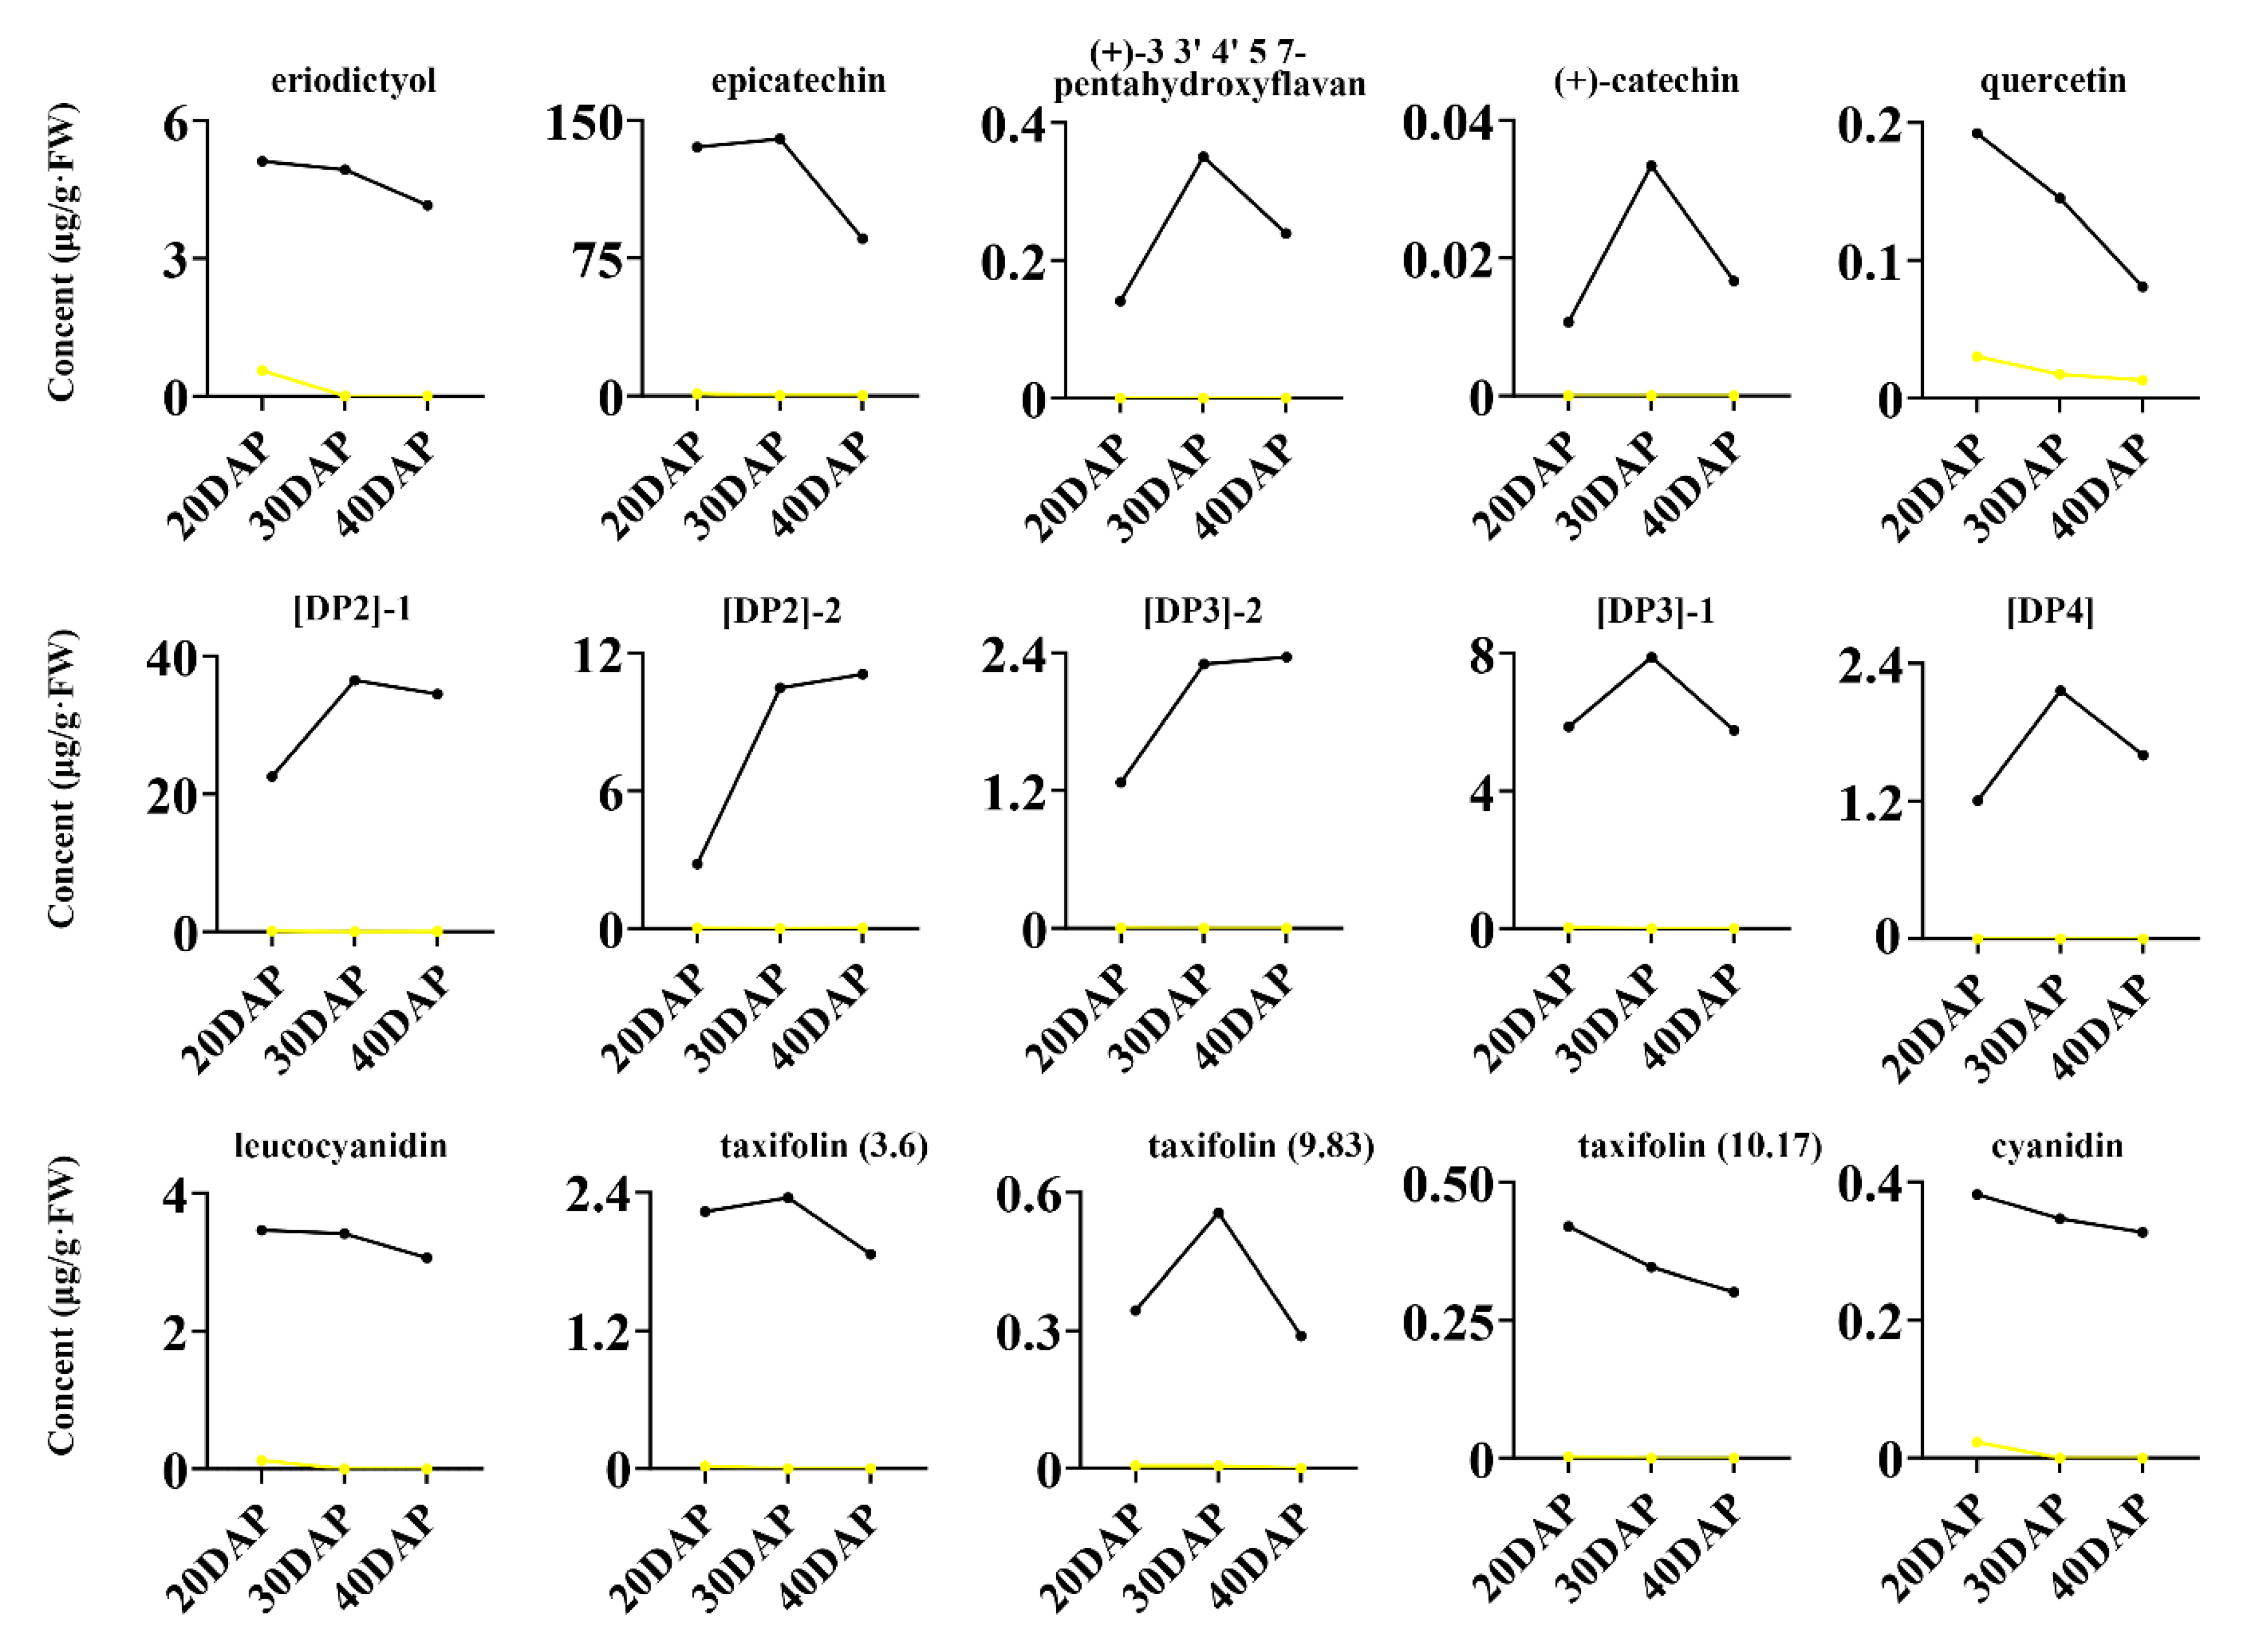
2.3. Metabolite Accumulation Patterns

To investigate the dynamic accumulation of the differential metabolites, these compounds were quantified from the calibration curve of corresponding or similar standard compounds. In this study, 92 metabolites could be relatively quantified using 9 commercial standards in B. juncea (Supplementary Table S1). Furthermore, we subjected the remaining 78 metabolites to PCA analysis after omitting the trace contents (<0.01 µg/g FW), which included 22 phenolic acids, 39 flavonoids, and 17 glucosinolates. The PCA results were similar to those obtained by peak-surface analysis (Supplementary Figure S1b) and revealed clear separation between the dark- and yellow-seeded samples as well as the samples from different developmental stages (Supplementary Figure S1b, Supplementary Table S4). In terms of seed development, the contents of glucosinolates and phenolic acids tended to accumulate in yellow- and dark-seeded B. juncea (Figure 3a,c), while the total flavonoid contents were significantly different (p < 0.01) between the yellow- and dark-seeded B. juncea during seed development (Figure 3b). These results indicate that flavonoids might be involved in the determination of seed coat color in B. juncea.
To determine whether the dark seed coat color is caused by flavonoids, we analyzed 16 soluble flavonoids that were differentially abundant between yellow- and dark-seeded B. juncea seeds throughout development (Figure 4). Among them, Is-3-O-glucoside-7-O-glucoside (<0.01 µg/g FW) and oenin (0.02 µg/g FW) were omitted because they were present in trace amounts. These common differentially abundant metabolites showed various accumulation patterns during seed development in yellow- and dark-seeded B. juncea, and their levels were higher in the dark variety seeds than in the yellow B. juncea seeds throughout development (Figure 3d). For example, the larger amount of components, including epicatechin (139.975 µg/g FW), [DP2]-1 (36.52 µg/g FW), [DP2]-2 (10.495 µg/g FW), and [DP3]-1 (7.893 µg/g FW), were abundant in the dark-seeded variety at 30 DAP (Supplementary Table S4, Supplementary Figure S3). Our results indicate that the differentially abundant epicatechin and PAs might be associated with the seed coat coloration of B. juncea.

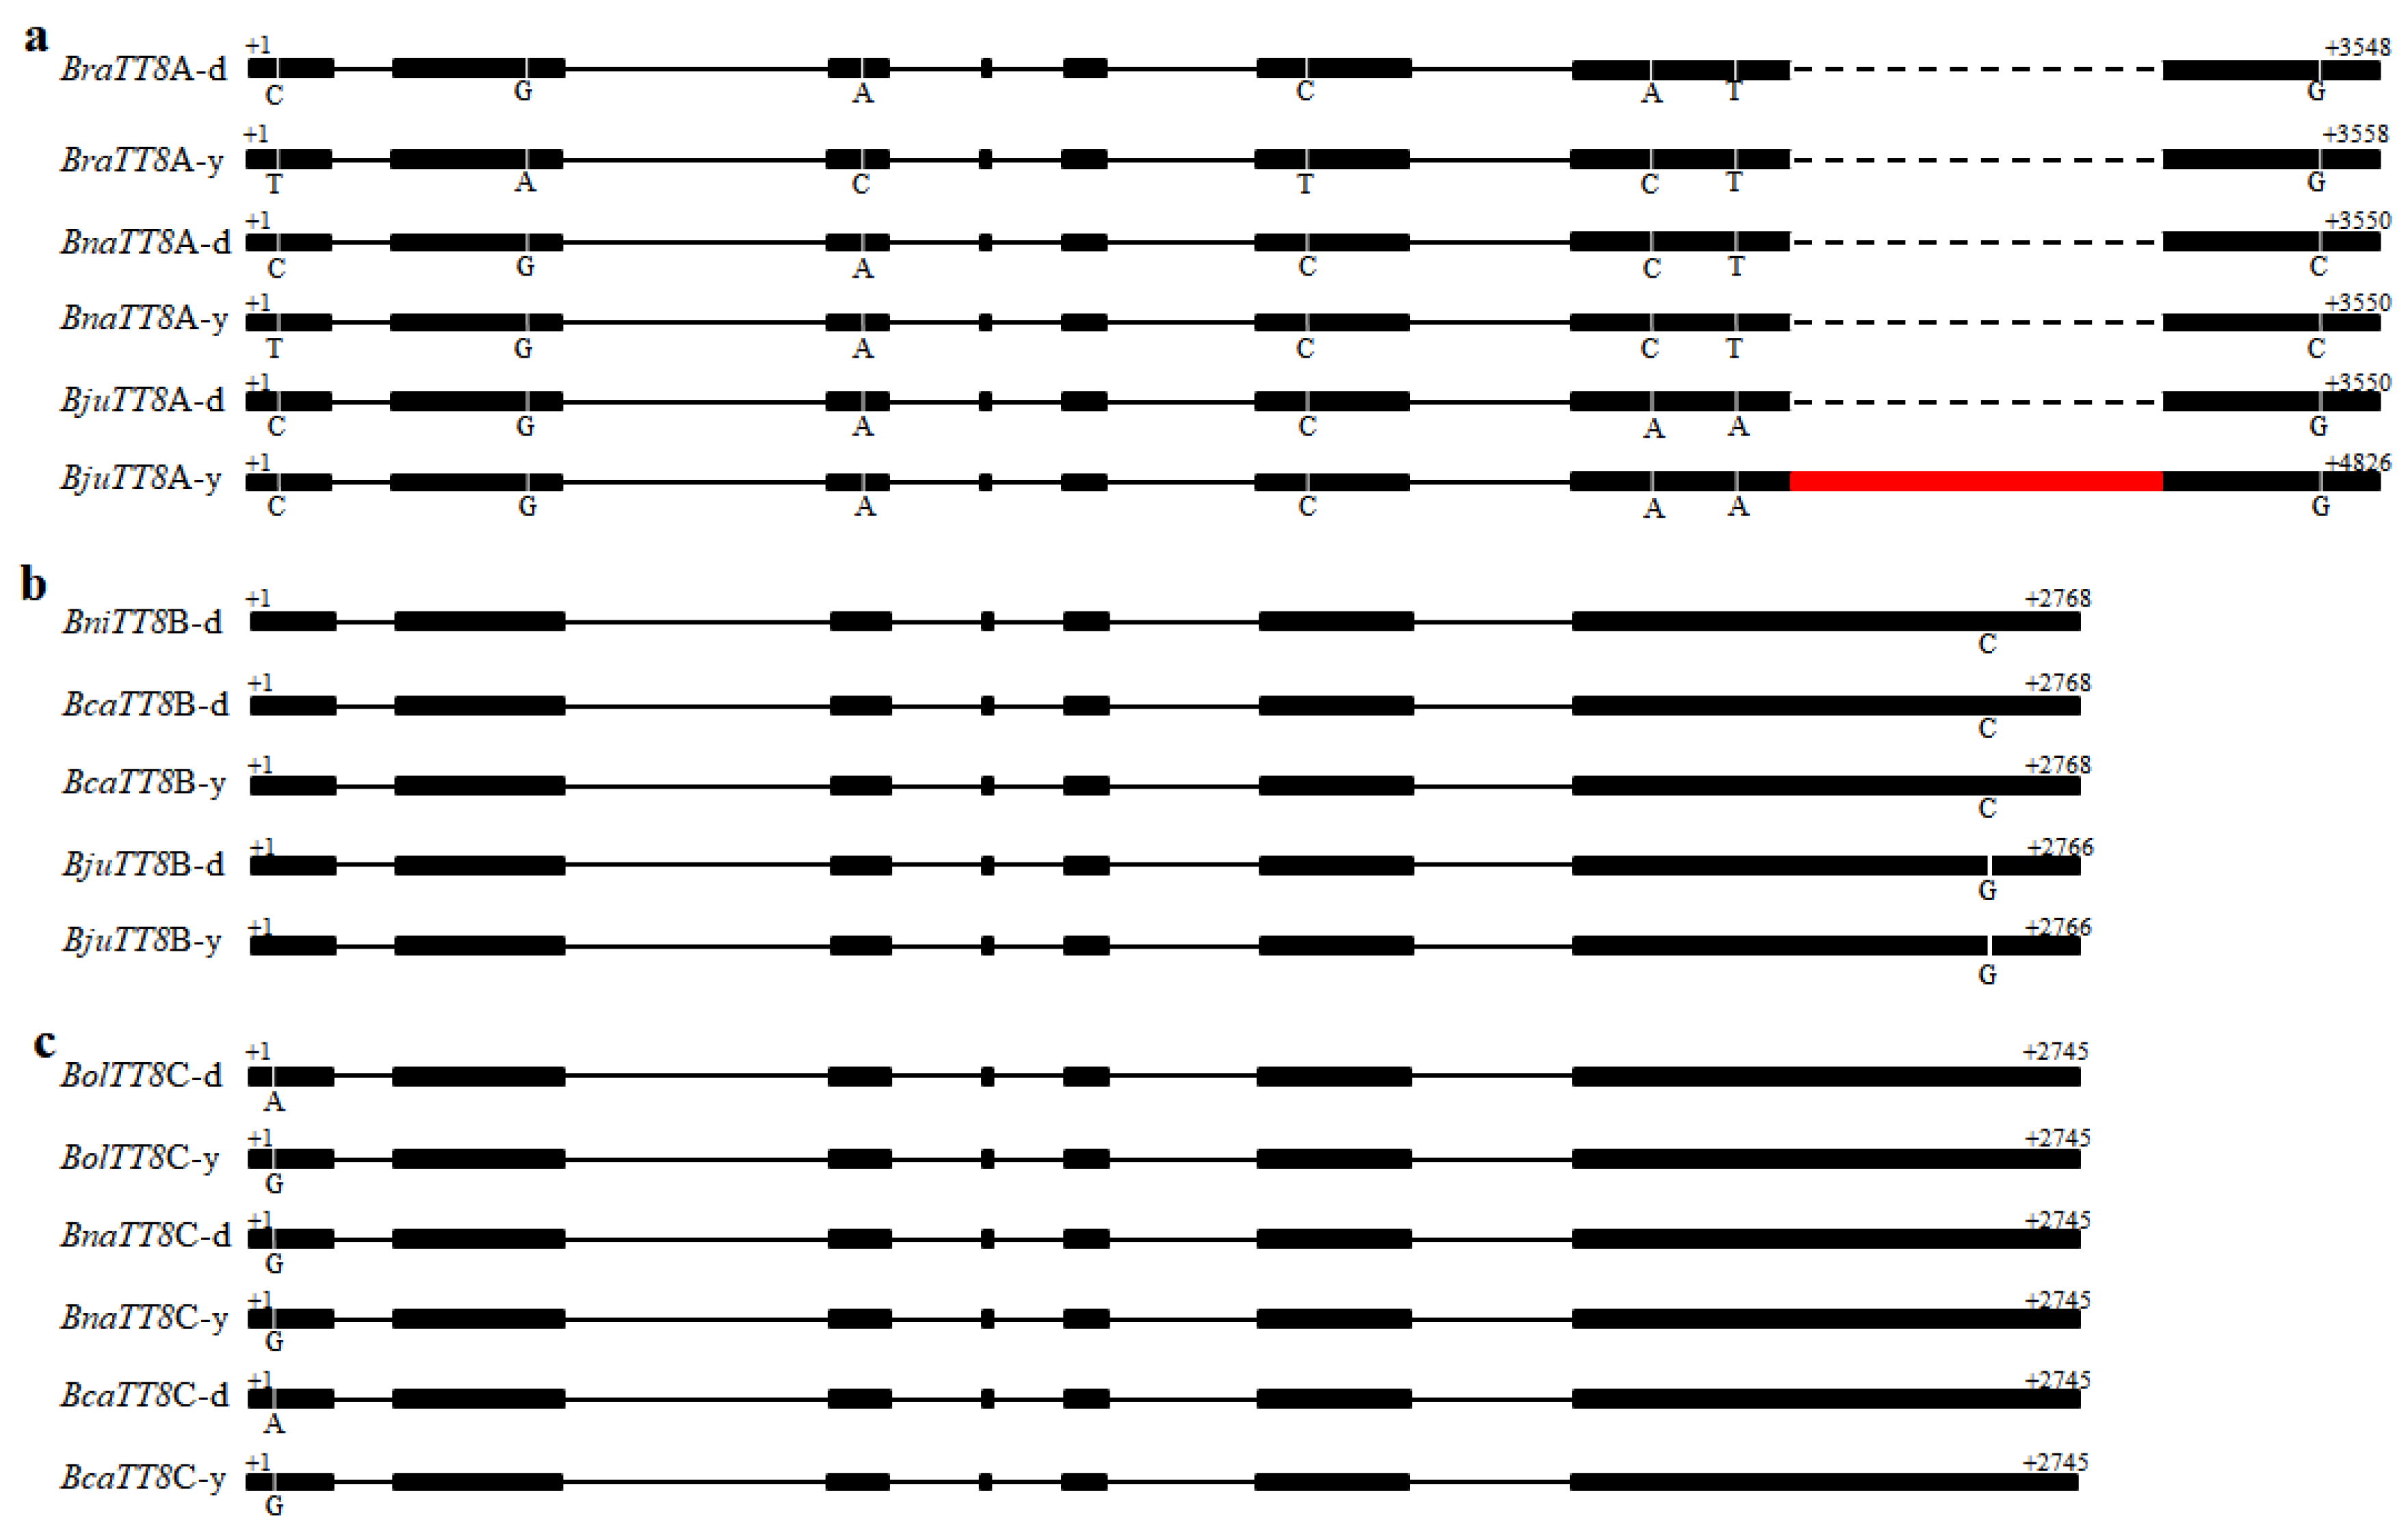
2.4. Transcriptome Analysis of Flavonoid Biosynthesis Genes in B. juncea

Flavonoids are responsible for the coloration of fruits, flowers, and seeds, and some genes regulating flavonoid biosynthesis have been found in Brassica species [35,55]. Therefore, we performed RNA-seq analysis to elucidate the differences in the expression patterns of flavonoid biosynthesis genes during seed development in yellow- and dark-seeded B. juncea. Based on the flavonoid biosynthesis gene and protein sequences of 31 A. thaliana obtained from the TAIR10 database (Supplementary Table S5), a total of 101 homologous genes were identified in this study (Supplementary Table S5, Supplementary Figure S4), and the functionally relevant amino acid residues of these identified genes had highly conserved positions (Supplementary Table S6). Subsequently, we investigated their transcript levels during seed development in yellow- and dark-seeded B. juncea using RNA-seq analysis (BioProject ID: PRJNA723131). To validate RNA-Seq results, 12 flavonoid biosynthesis genes with seed coat color formation were selected for RT-qPCR analysis, which had high expression levels with obvious differences (Figure 5b). Linear regression analysis indicated that the fold changes for gene expression investigated by RT-qPCR and RNA-Seq data were significantly positively correlated (R2 = 0.75; Figure 5a), suggesting that these results were reliable.
According to the FPKM values of 101 flavonoid biosynthesis genes, 25 of these had almost no expression in B. juncea, and different copies of homologous genes displayed different expression profiles (FPKM < 1, Figure 5a, Supplementary Table S7), possibly suggesting that they possess different biological functions. Consistently, most of the structural genes (BjuCHSs, BjuCHIs, BjuF3Hs, BjuDFRs, BjuANSs, and BjuBANs) were more abundant in the dark-seeded than in yellow-seeded B. juncea seeds, while BjuCHI_D, BjuCHI_E, BjuF3H_A, BjuF3H_B, BjuANS_C, and BjuBAN_A had almost no expression in the B. juncea seeds (Figure 5a, Supplementary Table S6), supporting that these homologous copies are likely not related to seed coat color formation in B. juncea. In addition, BjuFLS3_A showed a contrary expression pattern, which had relatively high expression levels in the yellow-seeded variety, and other FLSs were highly expressed in the dark-seeded variety (Figure 5). Among them, structural genes (BjuCHSs, BjuCHIs, and BjuF3Hs), also named the EBGs [36], play a role in the common precursors of flavonoids [31,32,33,48], indicating that these structural genes may determine the accumulation levels of the common precursors of flavonoids. However, structural genes, BjuDFRs, BjuANSs, and BjuBANs, leading to anthocyanin and proanthocyanidin [35,36,37,38] were expressed at very low levels in yellow-seeded B. juncea seeds, and they were expressed at much higher levels in dark-seeded B. juncea seeds; meanwhile, the transcription levels of BjuTT19 also displayed an obvious difference, with a continuous decline during seed development in both the yellow- and dark-seeded varieties (Figure 5). Our findings suggest that trace PA accumulation in the yellow seeds is associated with the low expression level of flavonoid biosynthesis genes, in accordance with previous results [35,56].
Previous results showed that LBGs were also positively activated by MBW complexes [39,40,41,48]. In this study, the dynamic expression of BjuTT2, BjuTT8, and BjuTTG1 showed similar expression patterns with LBGs (Figure 6). Among them, studies have also shown that TT8 is required to positively activate the transcription of LBGs, which is involved in the seed coat color of B. juncea [8], B. rapa [12], and B. napus [7,11,13]. However, the yellow-seeded trait had different variations in Brassica species. Therefore, we further compared the sequences of TT8 from dark-seeded B. nigra and yellow- and dark-seeded B. rapa, B. oleracea, B. napus, B. juncea, and B. carinata (Figure 6, Supplementary File S1). The results showed that the length of the TT8 varied among Brassica species from 3548 bp in dark-seeded B. rapa (BraTT8A-d) to 4826 bp in yellow-seeded B. juncea (BjuTT8A-y). An insertion of 1276 bp was located in exon 7 of the yellow-seeded B. juncea sequence (BjuTT8A-y) (Figure 6a, Supplementary File S1). Five SNPs were also identified in the exons (exons 1, 2, 3, 6, and 7) of the TT8A gene between yellow- and dark-seeded B. rapa, but only one SNP was detected between the yellow- and dark-seeded B. napus (Figure 6a, Supplementary Figure S5). Many other SNPs and indels were also found among the TT8A sequences (Supplementary Figure S5), but the extron sequences of TT8B and TT8C copies were highly conserved among these Brassica species. For example, one SNP was detected in the seventh extron of BjuTT8B and BcaTT8B between B. juncea and B. carinata, and one SNP in first extrons of BolTT8C and BcaTT8C was detected in yellow- and dark-seeded B. oleracea and B. carinata (Figure 6b,c, Supplementary Figures S6 and S7). Our results support the idea that variants in the TT8A gene might be a crucial factor for seed coat color in Brassica species. Additionally, the gene BjuTT19s, which encodes a protein reported to be involved in procyanidin transport [57,58], also had relatively low expression levels in yellow- B. juncea (Figure 5a), supporting the low accumulation of PAs in the yellow-seeded B. juncea (Table 1). Our results thus suggest that genes for the accumulation of PAs play an important role in seed coat color of B. juncea.
To further explore the regulatory network of flavonoids in yellow- and dark-seeded B. juncea, we analyzed the identified flavonoids using UPLC-HESI-MS/MS and the expression patterns of differentially expressed genes related to flavonoid biosynthesis by means of RNA-seq analysis (BioProject ID: PRJNA723131). At the first dedicated step of the flavonoid biosynthetic pathway, the expression levels of BjuCHIs, BjuF3Hs, and BjuTT7s showed different expression patterns in yellow- and dark-seeded B. juncea (Figure 5a), and the corresponding metabolites (i.e., naringenin, eriodictyol, quercetin isorhamnetin, and its corresponding derivatives) also had relatively low accumulation levels in the yellow seeds (Supplementary Table S4), indicating that these EBGs play important roles in promoting the production of enzymes to catalyze the metabolism of the substrates. Importantly, we found that the epicatechin and procyanidin oligomers ([DP2]-1, [DP2]-2, [DP3]-2, [DP3]-1, and [DP4]) had trace content (< 0.01 µg/g FW) in yellow seeds. Transcriptome data showed that BjuDFR, BjuANS, and BjuBAN had almost no expression in the yellow seeds, indicating that these genes might be suppressed in promoting yellow seed pigmentation. We therefore speculated that the lower expression levels of the LBGs (BjuDFR, BjuANS, and BjuBAN) resulted in a deficiency of epicatechin and PAs, which predominantly determined the seed coat color formation in B. juncea. Meanwhile, BjuTT19 encoding glutathione transferase were remarkably down-regulated or not expressed in the yellow-seeded variety (Figure 5), indicating that the accumulation of PAs is inhibited in the yellow-seeded variety. Overall, a diagram of the flavonoid metabolomics pathways in B. juncea shows that the expression patterns of most flavonoid biosynthesis genes were consistent with the metabolite accumulation patterns (Figure 7), while epicatechin and PAs contribute to dark seed coat color formation in B. juncea.

3. Discussion

Brassica juncea, a crop plant cultivated worldwide, produces black, brown, or yellow seeds; these colors are produced by flavonoids, the largest group of specialized metabolites, including flavonols, flavones, isoflavones, flavanols, and PAs [6,8,35,42]. To date, many phenolic compounds have been investigated in the Brassica species [13,14,16,59,60,61], but they are still not well understood in B. juncea seeds. Cultivated Brassica species include three diploid species (B. rapa, B. nigra, and B. oleracea) and three amphidiploid species (B. juncea, B. napus, and B. carinata), which are closely interrelated and well understood by the theory of the ‘triangle of U’ [62]. Therefore, these results provide important clues to discover the biochemical mechanisms of the flavonoid biosynthesis pathway in B. juncea. In addition, most metabolites involved in the seed coat color, such as epicatechin, isorhamnetin, kaempferol, quercetin, and their derivatives, are widely detected in Brassica crops [13,14,16,27,52,59,60,61,63], suggesting that they might share a common metabolic pathway. In this study, a total of 1440 major metabolic base peak chromatograms using UPLC-HESI-MS/MS analysis, and 236 metabolites were well-identified in the developmental seeds of B. juncea, including 31 phenolic acids, 47 flavonoids, 17 glucosinolates, 38 lipid compounds, 69 other hydroxycinnamic acid compounds, and 34 unknown compounds (Figure 1e–g, Supplementary Table S1). Previous studies highlighted the role of PAs in the seed coat of the Brassica species [13,14,16,27,52,59,60,61]. Based on levels of the identified metabolic compounds, yellow- and dark-seeded B. juncea could be distinguished (Supplementary Figure S1). Among them, we found that flavonoids are the predominately different metabolites between the yellow- and dark-seeded varieties (Table 1, Figure 3b), suggesting that they were involved in the modulating seed coat color formation of B. juncea. Meanwhile, we found that the greatest number of differentially expressed compounds was detected at 30 DAP (Figure 2b), indicating that most different metabolites might be catalyzed in this stage [13]. Importantly, 36 differential metabolic compounds were significantly accumulated throughout seed development (Figure 2d, Table 1), suggesting that they might be closely associated with the formation of seed coat color in B. juncea. Among them, 17 common differentially abundant metabolites were grouped into flavonoids (Table 1) such as eriodictyol, epicatechin, [DP2]-2, [DP3]-2, [DP3]-1 and [DP4]. Moreover, eriodictyol is a substrate of F3H/TT6 that catalyzes the synthesis of the dihydroflavonols that ar involved in plant coloration [64,65]; epicatechin and PAs have often been reported to be involved in the seed coat color of Brassica species [11,13,14,16]. In addition, 13 of 36 unknown compounds were detected and showed significant differences in the yellow- and dark-seeded B. juncea seeds (Table 1, Supplementary Table S1). In summary, our findings found that epicatechin and its corresponding derivatives were important in the seed coat color variation of B. juncea seeds, but additional studies are needed to verify whether these unknown metabolites are responsible for the seed coat color of B. juncea seeds.
In plants, flavonoids are widely distributed and contribute to coloration, which is well understood in Arabidopsis and Brassica [10,30,35,37,38,43,52,57,66]. The release of the genomic data for B. juncea [1,41], B. rapa [67,68], and B. nigra [69] offered us a chance to elucidate the flavonoid biosynthetic pathway at a genome-wide level in B. juncea. In this study, 101 flavonoid biosynthesis genes were identified based on the released B. juncea genome sequence (Supplementary Table S5). In addition, the color of the flowers, fruits, and seeds are mainly determined by the flavonoids, which are the most widely used metabolic pathway in plants [10,55]. Herein, we compared the expression patterns of these flavonoid biosynthesis genes during seed development in yellow- and dark-seeded B. juncea (Figure 5). In general, 25 genes were expressed at low levels in both yellow- and dark-seeded B. juncea, while 76 genes showed higher expression in the dark-seed variety than in the yellow-seed variety (Figure 5a). Interestingly, we found that transcripts of the structural genes (BjuCHSs, BjuCHIs, BjuF3Hs, and BjuTT7s), the first dedicated step of the flavonoid biosynthetic pathway, were more abundant in dark-seeded than in yellow-seeded B. juncea, while the LBGs, such as BjuDFRs, BjuANSs, and BjuBANs, had hardly or almost no expression in yellow-seeded B. juncea (Figure 5a), indicating that these were important factors affecting seed coat formation in B. juncea [35]. Similarly, numerous studies on the mechanism of seed coat color in Brassica species have shown that seed coat color is mainly influenced by the lower expression of the genes that regulate the flavonoid biosynthesis pathway [7,11,13,14,70,71]. Therefore, we speculate that these genes used for PA biosynthesis lead to the different seed coat color variation in B. juncea.
To examine flavonoid accumulation during seed development, we performed further correlation analysis between the transcriptome and metabolite profiling, and the expression patterns of some flavonoid biosynthetic genes showed a high association with the accumulation of some flavonoids and their derivatives. Previous studies showed that TT8 is a central component of MYB–bHLH–WD repeat complexes and is essential in the flavonoid biosynthetic pathway [8,12,43]. As expected, BjuTT8 also had significantly higher expression levels in the dark-seeded variety than in yellow-seeded variety of B. juncea (Figure 7), consistent with previous findings that TT8 accounted for increasing levels of anthocyanin accumulation in plants [12,35,38,43]. In addition, recent studies suggest that BjuTT8 could promote the expression of BjuDFR and BjuTT19 thus increasing anthocyanin accumulation and conferring the purple color of B. juncea leaves [38], which also acts as a major regulator of flavonoid biosynthesis pathways in Brassica plants [42,72,73,74]. Herein, BjuTT8 and LBGs (BjuDFRs, BjuANSs, and BjuBANs) are also closely related to epicatechin and its derivatives in this study (Figure 7). In Chinese cabbage, the yellow-seeded trait is due to a deletion of TTG1 [75] and in yellow sarson, a trait is due to the insertion of a transposable element in TT8 [12]. Therefore, we further investigated the variation of TT8 structure and identified substantial variation among the sequences in B. rapa, B. napus, and B. juncea (Figure 6a, Supplementary Figures S5–S7). In fact, the alignment of the BjuTT8A gene revealed an insertion of 1276 bp in exon 7, similar to published results (Supplementary Figure S5) [8], but there is no mutation in BjuTT8B gene members, indicating that TT8 homologous genes may have different functions in different B. juncea varieties. In addition, a large insertion was detected in the yellow-seeded B. rapa [12], while we found the obviously SNP variation between the yellow- and dark-seeded plants by alignment of BraTT8A (Figure 6a, Supplementary Figure S5) but no presence of BnaTT8A, suggesting that TT8A showed different functional variations in B. rapa, B. juncea, and B. napus. However, the sequences of the TT8 genes were highly conserved in B. nigra, B. oleracea, B. napus, and B. carinata (Figure 6b,c, Supplementary Figures S6 and S7). Therefore, our findings propose that TT8A genes play important roles in the stability of the seed coat color among the Brassica species, which has undergone functional differentiation during the evolution of the Brassica genome.
In this study, we also identified other differences that shed light on seed color in B. juncea. For example, four copies of the transport gene BjuTT19 were also significantly up-regulated in dark-seeded B. juncea relative to yellow-seeded B. juncea (Figure 5), and the low levels of metabolites were detected in yellow-seeded B. juncea (Supplementary Table S2). Hence, we hypothesized that low expression levels of BjuTT19 may be involved in the seed coat color through the inhibition of anthocyanin/PAs transport in the flavonoid biosynthesis pathway of B. juncea. In addition, the metabolites oenin and tulipanin were preliminarily identified in the developing seeds using accurate MS and MS/MS spectral data, which was catalyzed by the flavanone 3’,5’-hydroxylase (F3′5′H) [76]. Previous results have shown that multiple F3′5′H evolutions from F3′H have occurred in dicotyledonous plants [76] and have shown that F3′H and F3′5′H belong to cytochrome P450-dependent enzymes (CYP), a diverse class of heme-containing oxidases that are present in all types of organisms [77], indicating that the F3′H may have a redundant role in the control of the 3’5’-hydroxylated flavonoids of Arabidopsis and Brassica plants. Therefore, abundant metabolites were detected (Supplementary Table S1) and need to be further identified. In summary, our results improve our understanding of the molecular mechanism of seed coat color formation in Brassica species and demonstrate that combining metabolome and transcriptome analysis is an effective method for identifying key genes involved in flavonoid biosynthesis.

4. Materials and Methods

4.1. Plant Materials and Culture Conditions

Eight yellow- and dark-seeded B. juncea accessions (Figure 1a, Supplementary Table S8) were used in this study and were obtained from The Research Institute of Oil Crops in Guizhou. All eight accessions were sown in late September 2019 and grown under normal environmental conditions in the experimental field in Guiyang, Guizhou, China, located at the coordinates of 26°44′ N, 106°43′ W and at an altitude of 1250 m. Each accession was grown in randomized complete blocks with three rows at each site (0.4 m between rows and 0.2 m between plants) under normal field conditions. To investigate the dynamic metabolites of the seeds during maturation, the flowers were marked with different colored wool to keep the seeds at the same development stages together. At 20, 30, and 40 days after pollination (DAP), the immature seeds were gently harvested from five individual plants and pooled into a 5-mL centrifuge tube, immediately frozen in liquid nitrogen, and then stored at −80 °C until total RNA and crude metabolite extraction.

4.2. Chemicals and Calibration Curve

All commercial standards, including caffeic acid, ferulic acid, epicatechin (Ep), kaempferol (Km), isorhamnetin (Is), p-coumaric acid, quercetin (Qn), sinapic acid, and sinigrin of least LC/MS grade (purity > 99%) were purchased from Sigma-Aldrich Trading Co., Ltd. (Shanghai, China). The stock solutions for each standard were prepared individually in aqueous methanol and stored in the dark at −20 °C. A mixed stock solution for each standard was then prepared in aqueous methanol at 5 mg L⁻1. Spiked calibration curves at eight levels (0.001, 0.005, 0.01, 0.05, 0.20, 0.50, 1.0, and 2.0 mg L⁻1) were prepared in triplicate for calibration curve construction [14,25].

4.3. Metabolite Extraction and Analysis

Metabolites were extracted using the previously described methods [14] with slight modifications. Fresh seeds (100 mg) were weighed in pre-cooled microfuge tubes with liquid nitrogen (2-mL, Eppendorf, Germany), quickly crushed into powder, and homogenized in an aqueous solution of formic acid (0.1% (v/v)) in aqueous methanol (1 mL; 80% (v/v)). Samples were then sonicated (KQ-100E, Kunshan, China) for 1 h, and the crude extracts were centrifuged for 15 min at 10,000 × g. Subsequently, the precipitate was extracted again using the same method. Finally, the pooled supernatants were filtered via a 0.22-μm nylon filter and analyzed using ultra-high-performance liquid chromatography–heated electrospray ionization–tandem mass spectrometry (UPLC-HESI-MS/MS). All samples were analyzed in four biological duplicates.
After filtering, 10 μL samples were analyzed using a Dionex UltiMateTM 3000 UHPLC system (Thermo Fisher Scientific, Waltham, MA, USA) connected to a Thermo Scientific Q-Exactive System equipped with an S-Lens ionizer source (Thermo Scientific, USA) in negative mode. An Acquity UPLC BEH C18 chromatography column (2.1 i.d. × 150 mm, 1.7-μm particle size) (Waters, Ireland) was used with a guard column (Acquity UPLC BEH C18 1.7 μm VanGuardTM Pre-Column 2.1 × 5 mm, Waters, Ireland) controlled at 30 °C. The composition of the mobile phase was as follows: solutions A (0.1% (v/v) formic acid in H2O) and B (0.1% (v/v) formic acid in acetonitrile). The following mobile phase gradient was employed: 0–2 min, 5–10% solution B; 2–10 min, 10–25% solution B; 10–15 min, 25–50% solution B; 15– 0 min, 50–95% solution B; 20–23 min, 95% solution B; 23–23.5 min, 95–5% solution B; and 23.5–28 min, 5% solution B. The flow rate was set to 0.300 mL min−1. The spectra were recorded using full scan mode, covering a mass range from m/z 100 to 1500. The operation parameters were as follows: source voltage, 3.5 kV; sheath gas, 35 (arbitrary units); auxiliary gas, 10 (arbitrary units); sweep gas, 0 (arbitrary units); and capillary temperature, 350 °C.
All raw data were converted for free for use in the MS data analysis tool using the ABF (Analysis Base File) converter (http://www.reifycs.com/AbfConverter/index.html, accessed on 22 March 2020). The datasets were then analyzed using MS-DIAL version 4.18 software with a mass bank negative database (http://prime.psc.riken.jp/compms/msdial/main.html#MSP, accessed on 22 March 2020) [78]. Meanwhile, the raw UPLC-HESI-MS/MS data were further analyzed using Xcalibur 3.1 software. Discernible base peak areas from the built-in analyst quantitation wizard were manually corrected. Finally, the compounds were confirmed by comparing their retention times, accurate MS, and MS/MS spectral data together with the commercial standards and previously reported information [14,25]. Based on their mass spectrum, the concentrations of the identified compounds were quantified using calibration curves obtained with the corresponding or similar standards in this study.

4.4. Statistical Analysis

Principal component analysis (PCA) and t-tests were performed on the web-based sever Metabolite Sets Enrichment Analysis 4.0 (MSEA 4.0 or MetaboAnalyst 4.0; http://www.metaboanalyst.ca, accessed on 22 March 2020) [79]. Multiple regression orthogonal partial least-squares discriminant analysis (OPLS-DA) was performed using SIMCA V14.1 (https://umetrics.com/, accessed on 22 March 2020) with the default parameters. The significantly differential metabolites were screened using the variable importance in the projection (VIP) value of the first principal component in the OPLS-DA model combined with fold change (FC). The metabolites with variable importance in projection value (VIP) ≥ 1, p value < 0.05, and fold change (FC) of ≥1.6 (up-regulated) or ≤0.625 (down-regulated) were considered to be differential metabolites. Volcano plots were used to filter metabolites of interest based on the log2(FC) of the metabolites [80,81]. Data were expressed as the mean ± standard deviation (SD) of four biological replicates.

4.5. Identification of Flavonoid Biosynthesis Genes in B. juncea

A total of 31 gene sequences in A. thaliana related to flavonoid biosynthesis were downloaded from The Arabidopsis Information Resource (TAIR) database (https://www.arabidopsis.org/, accessed on 22 July 2020). The B. juncea reference genome sequence (Bju15: Brassica juncea V1.5) and gene sequences from BRAD (http://brassicadb.cn, accessed on 22 July 2020) were used to identify the flavonoid biosynthesis genes in B. juncea. We used the flavonoid biosynthesis gene and protein sequences of 31 A. thaliana to align with the B. juncea genome and protein sequences using BLASTn and BLASTp with a cutoff E-value of ≤1 × 10⁻²⁰, respectively. The homologous gene pairs were confirmed through multiple alignments performed using Geneious 4.8.5 software (http://www.geneious.com/, accessed on 22 July 2020; Biomatters, Auckland, New Zealand), which showed the syntenic analysis results across B. juncea and each A. thaliana. The conserved motifs of flaovonoid biosynthesis genes (Supplementary Figure S4) were characterized using Multiple Em for Motif Elicitation (MEME) 4.11.4 (http://meme-suite.org/tools/meme, accessed on 22 July 2020) with the following parameters: any repetitions; maximum 5 motifs; and 6 and 300 residues width of each motif [82]. Genes with an E-value of <1 × 10⁻²⁰ were used for further analysis. Eventually, these identified flavonoid biosynthesis genes were confirmed through the knowledge-based identification of pathway enzymes (KIPEs; https://github.com/bpucker/KIPEs, accessed on 22 July 2020) [83]

4.6. Transcriptome Sequencing Analysis of Differentially Expressed Genes in the Flavonoid Pathway

To better understand the pathways of flavonoid biosynthesis in B. juncea, we performed BLASTP searches in the Brassica database (B. juncea genome V1.5; http://brassicadb.cn, accessed on 22 July 2020) [1] using the protein sequences related to flavonoid synthesis genes in Arabidopsis [28,30,84] as queries. Subsequently, the expression profiles of flavonoid biosynthesis genes were further revealed using transcriptome analysis based on RNA-seq data. For each developmental stage of each B. juncea line (20, 30 and 40 DAP), total RNA was extracted from the seed samples (approximately 100 mg) stored at −80 °C using an EZ-10 DNAaway RNA Mini-Preps Kit (Sangon Biotech Co., Ltd., Shanghai, China). The RNA quality was validated using 1% agarose gel, and the purity, concentration, and integrity were confirmed using a Nanodrop spectrophotometer (Thermo Fisher Scientific, Inc., Worcester, MA, USA) and an Agilent 2100 Bioanalyzer (Agilent Technologies, Inc., Santa Clara, CA, USA), respectively. The mRNA was enriched using the NEBNext® Poly(A) mRNA Magnetic Isolation Module, and a cDNA library was constructed using the recommended program, NEBNext® mRNA Library Prep Master Mix Set, following manufacturer’s recommendations. The libraries were sequenced on an Illumina HiSeq2000 sequencing platform by Novogene Bioinformatic Technology Co. Ltd. (Tianjin, China). Two biological replicates were used for the transcriptome analysis.
The adapter sequences and unknown or low-quality reads were filtered using Trimmomatic version 0.32 [85], and clean reads were mapped to the B. juncea reference genome sequence [1] (Bju15: Brassica juncea V1.5; http://brassicadb.cn, accessed on 22 July 2020) using HISAT (hierarchical indexing for spliced alignment of transcripts; version 2.1.0) with the default parameters (phred33-p5—sensitive—no-discordant—no-mixed-I 1-X 1000) [86], and the number of mapped reads was quantified using HTseq [87]. Analysis of differential gene expression between the yellow- and dark-seeded varieties were performed with the DESeq2 (version 1.16.1) [88] with R version 3.2.3 (Supplementary Table S9). Genes with an adjusted p-value that was ≤ 0.05 and fold changes ≥ 2 were considered as differentially expressed. The gene expression profiles were evaluated using FPKM (fragments per kilo base of exon model per million) values. The heatmap was generated using TBtools (version 1.055) [89].

4.7. Reverse-Transcription Quantitative PCR (RT-qPCR) Analysis

To validate the transcriptome data and to characterize the flavonoid genes that were differentially expressed in the developing seeds of yellow- and dark-seeded B. juncea, total RNA was isolated from the samples using a DNA away RNA Mini-Prep Kit (Sangon Biotech, Shanghai, China). Subsequently, the cDNAs were synthesized using an RNA PCR Kit (AMV, v3.0) based on the manufacturer’s protocols (Takara, Dalian, China). The cDNA was subjected to RT-qPCR analysis using SYBR qPCR SuperMix Plus (NovoStart) on a Bio-Rad CFX96 Real-Time System (Bio-Rad Laboratories, Hercules, CA, USA), as previously described [13]. Tonoplastic intrinsic proteins-41 (TIPS-41) was used as a reference gene to normalize the gene expression levels via the 2−∆∆Ct method [90]. Three biological replicates were performed for all experiments. The specific primer sequences used in this study were obtained from the RT-qPCR Primer Database [91] and are listed in Supplementary Table S10.

4.8. Gene Cloning and Multi-Sequence Analysis

The genomic DNA and open reading frame of TT8 were amplified using the genomic DNA and cDNA of dark-seeded B. nigra and yellow- and dark-seeded B. rapa, B. oleracea, B. napus, B. juncea, and B. carinata as templates, respectively. Subsequently, the sequences of TT8 were subjected to multiple sequence alignments using ClustalW software (version 2.0) with default settings [92]. PCR, cloning of PCR production and the selection of positive clones were performed in three biological repetitions. Positive clones were sequenced using M13F/M13R primer (Tsingke Biological Technology Company, Beijing, China). The specific primer sequences used in this study are listed in Supplementary Table S10.

5. Conclusions

In this study, 236 metabolite compounds were identified from B. juncea seeds, including 31 phenolic acids, 47 flavonoids, 17 glucosinolates, 38 lipids, 69 other hydroxycinnamic acid compounds, and 34 novel unknown compounds. 35 of them showed significant differences in yellow and dark B. juncea seeds, especially with regard to flavonoids. In addition, 101 homologous flavonoid genes were identified, and their expression patterns were investigated using RNA-Seq and RT-qPCR analysis, most of them showed significant expression levels in yellow and dark B. juncea seeds. Importantly, comparative transcriptome and metabolome analyses of yellow and dark B. juncea revealed high consistent changes in flavonoid biosynthesis genes (BjuDFR, BjuANS and BjuBAN, BjuTT8 and BjuTT19) and the levels of flavonoids (epicatechin and its derivatives). Further, TT8 plays a crucial role in the seed coat color of Brassica species. Our results provide new insights into the understanding of the synthesis and accumulation of flavonoids in B. juncea seeds as well as lay a solid biological foundation for breeding improvements for the Brassica species.

Supplementary Materials

Author Contributions

J.L. and C.Q. conceptualized the project; L.L. and K.L. helped to review and edit the manuscript; S.S. and Y.T. carried out the laboratory work and data analysis and wrote the first draft of the manuscript; C.Z. contributed to sample preparation; N.Y. and G.S. verified the analytical methods; C.Z., Y.M., and F.S. carried out the experiments; S.C., R.H. and X.L. cloned genes and analyzed the data. J.L. and C.Q. had overall responsibility of this project and funding acquisition. All authors have read and agreed to the published version of the manuscript.

Funding

This research was funded by the National Science Foundation of China (32072093, 31830067), the China Agriculture Research System of MOF and MARA, the Fundamental Research Funds for the Central Universities, China (XDJK2020B030), the Innovation and Entrepreneurship Training Program for Undergraduates (S202010635197), and the 111 Project (B12006).

Institutional Review Board Statement

Not applicable.

Informed Consent Statement

Not applicable.

Data Availability Statement

The data presented in this study are available upon request from the corresponding author. The RNA seq Illumina paired-end reads of the transcriptome for this study have been submitted to NCBI BioProject PRJNA723131.

Acknowledgments

The authors would like to thank Yan Zhou for her assistance with our experiments.

Conflicts of Interest

The authors declare no conflict of interest.

References

  1. Yang, J.H.; Liu, D.Y.; Wang, X.W.; Ji, C.M.; Cheng, F.; Liu, B.N.; Hu, Z.Y.; Chen, S.; Pental, D.; Ju, Y.H.; et al. The genome sequence of allopolyploid Brassica juncea and analysis of differential homoeolog gene expression influencing selection. Nat. Genet. 2018, 50, 1616. [Google Scholar] [CrossRef] [Green Version]
  2. Wu, X.; Chen, B.; Lu, G.; Wang, H.; Xu, K.; Gao, G.; Song, Y. Genetic diversity in oil and vegetable mustard (Brassica juncea) landraces revealed by SRAP markers. Genet. Resour. Crop Evol. 2009, 56, 1011. [Google Scholar] [CrossRef]
  3. Gladis, T.; Hammer, K. Die Gaterslebener Brassica-Kollektion—Brassica juncea, B. napus, B. nigra und B. rapa. Feddes Repert. 1992, 103, 469–507. [Google Scholar] [CrossRef]
  4. Oram, R.; Kirk, J.; Veness, P.; Hurlstone, C.; Edlington, J.; Halsall, D. Breeding Indian mustard [Brassica juncea (L.) Czern.] for cold-pressed, edible oil production—A review. Aust. J. Agric. Res. 2005, 56, 581–596. [Google Scholar] [CrossRef]
  5. Liu, Z.; Guan, C.; Chen, S.; Liu, S.; Yang, L. Transfer of superior traits from Brassica juncea into Brassica napus. Agric. Sci. Technol. Hunan 2010, 11, 49–52. [Google Scholar]
  6. Yan, M.; Liu, Z.; Guan, C.; Chen, S.; Yuan, M.; Liu, X. Inheritance and molecular markers for the seed coat color in Brassica juncea. Front. Agric. China 2009, 3, 1–6. [Google Scholar] [CrossRef]
  7. Hong, M.; Hu, K.; Tian, T.; Li, X.; Chen, L.; Zhang, Y.; Yi, B.; Wen, J.; Ma, C.; Shen, J.; et al. Transcriptomic Analysis of Seed Coats in Yellow-Seeded Brassica napus Reveals Novel Genes That Influence Proanthocyanidin Biosynthesis. Front. Plant Sci. 2017, 8, 1674. [Google Scholar] [CrossRef] [PubMed] [Green Version]
  8. Padmaja, L.K.; Agarwal, P.; Gupta, V.; Mukhopadhyay, A.; Sodhi, Y.S.; Pental, D.; Pradhan, A.K. Natural mutations in two homoeologous TT8 genes control yellow seed coat trait in allotetraploid Brassica juncea (AABB). Theor. Appl. Genet. 2014, 127, 339–347. [Google Scholar] [CrossRef] [PubMed]
  9. Akhov, L.; Ashe, P.; Tan, Y.; Datla, R.; Selvaraj, G. Proanthocyanidin biosynthesis in the seed coat of yellow-seeded, canola quality Brassica napus YN01-429 is constrained at the committed step catalyzed by dihydroflavonol 4-reductase. Botany 2009, 87, 616–625. [Google Scholar] [CrossRef] [Green Version]
  10. Auger, B.; Marnet, N.; Gautier, V.; Maia-Grondard, A.; Leprince, F.; Renard, M.; Guyot, S.; Nesi, N.; Routaboul, J.M. A detailed survey of seed coat flavonoids in developing seeds of Brassica napus L. J. Agric. Food Chem. 2010, 58, 6246–6256. [Google Scholar] [CrossRef]
  11. Jiang, J.; Shao, Y.; Li, A.; Lu, C.; Zhang, Y.; Wang, Y. Phenolic composition analysis and gene expression in developing seeds of yellow-and black-seeded Brassica napus. J. Integr. Plant Biol. 2013, 55, 537–551. [Google Scholar] [CrossRef]
  12. Li, X.; Chen, L.; Hong, M.; Zhang, Y.; Zu, F.; Wen, J.; Yi, B.; Ma, C.; Shen, J.; Tu, J. A large insertion in bHLH transcription factor BrTT8 resulting in yellow seed coat in Brassica rapa. PLoS ONE 2012, 7, e44145. [Google Scholar] [CrossRef]
  13. Qu, C.; Fu, F.; Lu, K.; Zhang, K.; Wang, R.; Xu, X.; Wang, M.; Lu, J.; Wan, H.; Zhanglin, T.; et al. Differential accumulation of phenolic compounds and expression of related genes in black- and yellow-seeded Brassica napus. J. Exp. Bot. 2013, 64, 2885–2898. [Google Scholar] [CrossRef] [Green Version]
  14. Qu, C.; Yin, N.; Chen, S.; Wang, S.; Chen, X.; Zhao, H.; Shen, S.; Fu, F.; Zhou, B.; Xu, X.; et al. Comparative Analysis of the Metabolic Profiles of Yellow- versus Black-Seeded Rapeseed Using UPLC-HESI-MS/MS and Transcriptome Analysis. J. Agric. Food Chem. 2020, 68, 3033–3049. [Google Scholar] [CrossRef]
  15. Wang, J.; Xian, X.; Xu, X.; Qu, C.; Lu, K.; Li, J.; Liu, L. Genome-Wide Association Mapping of Seed Coat Color in Brassica napus. J. Agric. Food Chem. 2017, 65, 5229–5237. [Google Scholar] [CrossRef] [PubMed]
  16. Wang, Y.; Meng, G.S.; Chen, S.L.; Chen, Y.J.; Jiang, J.J.; Wang, Y.P. Correlation Analysis of Phenolic Contents and Antioxidation in Yellow- and Black-Seeded Brassica napus. Molecules 2018, 23, 1815. [Google Scholar] [CrossRef] [PubMed] [Green Version]
  17. Yu, D.; Huang, T.; Tian, B.; Zhan, J. Advances in Biosynthesis and Biological Functions of Proanthocyanidins in Horticultural Plants. Foods 2020, 9, 1774. [Google Scholar] [CrossRef] [PubMed]
  18. Lepiniec, L.; Debeaujon, I.; Routaboul, J.M.; Baudry, A.; Pourcel, L.; Nesi, N.; Caboche, M. Genetics and biochemistry of seed flavonoids. Annu. Rev. Plant Biol. 2006, 57, 405–430. [Google Scholar] [CrossRef] [PubMed]
  19. Li, P.; Chen, B.; Zhang, G.; Chen, L.; Dong, Q.; Wen, J.; Mysore, K.S.; Zhao, J. Regulation of anthocyanin and proanthocyanidin biosynthesis by Medicago truncatula bHLH transcription factor MtTT8. New Phytol. 2016, 210, 905–921. [Google Scholar] [CrossRef]
  20. Pang, Y.; Peel, G.J.; Wright, E.; Wang, Z.; Dixon, R.A. Early steps in proanthocyanidin biosynthesis in the model legume Medicago truncatula. Plant Physiol. 2007, 145, 601–615. [Google Scholar] [CrossRef] [Green Version]
  21. Zhao, P.; Li, X.; Jia, J.; Yuan, G.; Chen, S.; Qi, D.; Cheng, L.; Liu, G. bHLH92 from sheepgrass acts as a negative regulator of anthocyanin/proanthocyandin accumulation and influences seed dormancy. J. Exp. Bot. 2019, 70, 269–284. [Google Scholar] [CrossRef] [PubMed] [Green Version]
  22. Fang, J.; Reichelt, M.; Hidalgo, W.; Agnolet, S.; Schneider, B. Tissue-specific distribution of secondary metabolites in rapeseed (Brassica napus L.). PLoS ONE 2012, 7, e48006. [Google Scholar] [CrossRef]
  23. Llorach, R.; Gil-Izquierdo, A.; Ferreres, F.; Tomás-Barberán, F.A. HPLC-DAD-MS/MS ESI Characterization of Unusual Highly Glycosylated Acylated Flavonoids from Cauliflower (Brassica oleracea L. var. botrytis) Agroindustrial Byproducts. J. Agric. Food Chem. 2003, 51, 3895–3899. [Google Scholar] [CrossRef] [PubMed]
  24. Harbaum, B.; Hubbermann, E.M.; Wolff, C.; Herges, R.; Zhu, Z.; Schwarz, K. Identification of flavonoids and hydroxycinnamic acids in pak choi varieties (Brassica campestris L. ssp. chinensis var. communis) by HPLC-ESI-MSn and NMR and their quantification by HPLC-DAD. J. Agric. Food Chem. 2007, 55, 8251–8260. [Google Scholar] [CrossRef] [PubMed]
  25. Yin, N.W.; Wang, S.X.; Jia, L.D.; Zhu, M.C.; Yang, J.; Zhou, B.J.; Yin, J.M.; Lu, K.; Wang, R.; Li, J.N.; et al. Identification and Characterization of Major Constituents in Different-Colored Rapeseed Petals by UPLC-HESI-MS/MS. J. Agric. Food Chem. 2019, 67, 11053–11065. [Google Scholar] [CrossRef]
  26. Bajpai, P.K.; Reichelt, M.; Augustine, R.; Gershenzon, J.; Bisht, N.C. Heterotic patterns of primary and secondary metabolites in the oilseed crop Brassica juncea. Heredity 2019, 123, 318–336. [Google Scholar] [CrossRef]
  27. Lin, L.Z.; Sun, J.H.; Chen, P.; Harnly, J. UHPLC-PDA-ESI/HRMS/MSn Analysis of Anthocyanins, Flavonol Glycosides, and Hydroxycinnamic Acid Derivatives in Red Mustard Greens (Brassica juncea Coss Variety). J. Agric. Food Chem. 2011, 59, 12059–12072. [Google Scholar] [CrossRef] [PubMed] [Green Version]
  28. Tohge, T.; Souza, L.P.; Fernie, A.R. Current understanding of the pathways of flavonoid biosynthesis in model and crop plants. J. Exp. Bot. 2017, 68, 4013–4028. [Google Scholar] [CrossRef]
  29. Appelhagen, I.; Thiedig, K.; Nordholt, N.; Schmidt, N.; Huep, G.; Sagasser, M.; Weisshaar, B. Update on transparent testa mutants from Arabidopsis thaliana: Characterisation of new alleles from an isogenic collection. Planta 2014, 240, 955–970. [Google Scholar] [CrossRef] [PubMed]
  30. Saito, K.; Yonekura-Sakakibara, K.; Nakabayashi, R.; Higashi, Y.; Yamazaki, M.; Tohge, T.; Fernie, A.R. The flavonoid biosynthetic pathway in Arabidopsis: Structural and genetic diversity. Plant Physiol. Biochem. 2013, 72, 21–34. [Google Scholar] [CrossRef] [PubMed] [Green Version]
  31. Austin, M.B.; Noel, J.P. The chalcone synthase superfamily of type III polyketide synthases. Nat. Prod. Rep. 2003, 20, 79. [Google Scholar] [CrossRef]
  32. Jiang, W.; Yin, Q.; Wu, R.; Zheng, G.; Liu, J.; Dixon, R.A.; Pang, Y. Role of a chalcone isomerase-like protein in flavonoid biosynthesis in Arabidopsis thaliana. J. Exp. Bot. 2015, 66, 7165–7179. [Google Scholar] [CrossRef] [PubMed] [Green Version]
  33. Schoenbohm, C.; Martens, S.; Eder, C.; Forkmann, G.; Weisshaar, B. Identification of the Arabidopsis thaliana flavonoid 3′-hydroxylase gene and functional expression of the encoded P450 enzyme. Biol. Chem. 2000, 381, 749–753. [Google Scholar] [CrossRef] [PubMed]
  34. Nesi, N.; Debeaujon, I.; Jond, C.; Pelletier, G.; Caboche, M.; Lepiniec, L. The TT8 gene encodes a basic helix-loop-helix domain protein required for expression of DFR and BAN genes in Arabidopsis siliques. Plant Cell 2000, 12, 1863–1878. [Google Scholar] [CrossRef] [PubMed] [Green Version]
  35. Liu, X.; Lu, Y.; Yuan, Y.; Liu, S.; Guan, C.; Chen, S.; Liu, Z. De novo transcriptome of Brassica juncea seed coat and identification of genes for the biosynthesis of flavonoids. PLoS ONE 2013, 8, e71110. [Google Scholar] [CrossRef] [PubMed] [Green Version]
  36. Saigo, T.; Wang, T.; Watanabe, M.; Tohge, T. Diversity of anthocyanin and proanthocyanin biosynthesis in land plants. Curr. Opin. Plant Biol. 2020, 55, 93–99. [Google Scholar] [CrossRef]
  37. Zou, S.; Wu, J.; Shahid, M.Q.; He, Y.; Lin, S.; Liu, Z.; Yang, X. Identification of key taste components in loquat using widely targeted metabolomics. Food Chem. 2020, 323, 126822. [Google Scholar] [CrossRef] [PubMed]
  38. Zhang, D.W.; Liu, L.L.; Zhou, D.G.; Liu, X.J.; Liu, Z.S.; Yan, M.L. Genome-wide identification and expression analysis of anthocyanin biosynthetic genes in Brassica juncea. J. Integr. Agric. 2020, 19, 1250–1260. [Google Scholar] [CrossRef]
  39. Xu, W.; Dubos, C.; Lepiniec, L. Transcriptional control of flavonoid biosynthesis by MYB-bHLH-WDR complexes. Trends Plant Sci. 2015, 20, 176–185. [Google Scholar] [CrossRef] [PubMed]
  40. Hichri, I.; Barrieu, F.; Bogs, J.; Kappel, C.; Delrot, S.; Lauvergeat, V. Recent advances in the transcriptional regulation of the flavonoid biosynthetic pathway. J. Exp. Bot. 2011, 62, 2465–2483. [Google Scholar] [CrossRef] [PubMed] [Green Version]
  41. Colanero, S.; Perata, P.; Gonzali, S. The Gene Encodes an R3-MYB Protein Repressing Anthocyanin Synthesis in Tomato Plants. Front. Plant Sci. 2018, 9, 830. [Google Scholar] [CrossRef] [PubMed] [Green Version]
  42. Chen, W.; Gao, Y.; Xie, W.; Gong, L.; Lu, K.; Wang, W.; Li, Y.; Liu, X.; Zhang, H.; Dong, H.; et al. Genome-wide association analyses provide genetic and biochemical insights into natural variation in rice metabolism. Nat. Genet. 2014, 46, 714–721. [Google Scholar] [CrossRef] [PubMed]
  43. Zhang, Y.; Wang, G.; Li, L.; Li, Y.; Zhou, B.; Yan, H. Identification and expression analysis of BrTT8 during anthocyanin biosynthesis and exposure to abiotic stress in turnip (Brassica rapa subsp. rapa ‘Tsuda’). Sci. Hort. 2020, 268, 109332. [Google Scholar] [CrossRef]
  44. Onkokesung, N.; Reichelt, M.; Doorn, A.; Schuurink, R.C.; Loon, J.J.A.; Dicke, M. Modulation of flavonoid metabolites in Arabidopsis thaliana through overexpression of the MYB75 transcription factor: Role of kaempferol-3,7-dirhamnoside in resistance to the specialist insect herbivore Pieris brassicae. J. Exp. Bot. 2014, 65, 2203–2217. [Google Scholar] [CrossRef] [PubMed] [Green Version]
  45. Gonzalez, A.; Zhao, M.; Leavitt, J.M.; Lloyd, A.M. Regulation of the anthocyanin biosynthetic pathway by the TTG1/bHLH/Myb transcriptional complex in Arabidopsis seedlings. Plant J. 2008, 53, 814–827. [Google Scholar] [CrossRef]
  46. Sun, Y.; Li, H.; Huang, J. Arabidopsis TT19 functions as a carrier to transport anthocyanin from the cytosol to tonoplasts. Mol. Plant 2012, 5, 387–400. [Google Scholar] [CrossRef]
  47. Xu, W.; Bobet, S.; Gourrierec, J.; Grain, D.; Vos, D.; Berger, A.; Salsac, F.; Kelemen, Z.; Boucherez, J.; Rolland, A.; et al. TRANSPARENT TESTA 16 and 15 act through different mechanisms to control proanthocyanidin accumulation in Arabidopsis testa. J. Exp. Bot. 2017, 68, 2859–2870. [Google Scholar] [CrossRef] [PubMed] [Green Version]
  48. Debeaujon, I.; Peeters, A.J.M.; Léon-Kloosterziel, K.M.; Koornneef, M. The TRANSPARENT TESTA12 gene of Arabidopsis encodes a multidrug secondary transporter-like protein required for flavonoid sequestration in vacuoles of the seed coat endothelium. Plant Cell 2001, 13, 853–872. [Google Scholar] [CrossRef] [PubMed] [Green Version]
  49. Liu, H.; Su, J.; Zhu, Y.; Yao, G.; Allan, A.C.; Ampomah-Dwamena, C.; Shu, Q.; Kui, L.; Zhang, S.; Wu, J. The involvement of PybZIPa in light-induced anthocyanin accumulation via the activation of PyUFGT through binding to tandem G-boxes in its promoter. Hortic. Res. 2019, 6, 134. [Google Scholar] [CrossRef] [Green Version]
  50. Ying, S.; Su, M.; Wu, Y.; Zhou, L.; Fu, R.; Li, Y.; Guo, H.; Luo, J.; Wang, S.; Zhang, Y. Trichome regulator SlMIXTA-like directly manipulates primary metabolism in tomato fruit. Plant Biotechnol. J. 2020, 18, 354–363. [Google Scholar] [CrossRef] [PubMed]
  51. Tohge, T.; Nishiyama, Y.; Hirai, M.Y.; Yano, M.; Nakajima, J.; Awazuhara, M.; Inoue, E.; Takahashi, H.; Goodenowe, D.B.; Kitayama, M.; et al. Functional genomics by integrated analysis of metabolome and transcriptome of Arabidopsis plants over-expressing an MYB transcription factor. Plant J. 2005, 42, 218–235. [Google Scholar] [CrossRef] [PubMed]
  52. Jeon, J.; Kim, J.K.; Kim, H.; Kim, Y.J.; Park, Y.J.; Kim, S.J.; Kim, C.; Park, S.U. Transcriptome analysis and metabolic profiling of green and red kale (Brassica oleracea var. acephala) seedlings. Food Chem. 2018, 241, 7–13. [Google Scholar] [CrossRef] [PubMed]
  53. Liu, S.; Liu, Y.; Yang, X.; Tong, C.; Edwards, D.; Parkin, I.A.P.; Zhao, M.; Ma, J.; Yu, J.; Huang, S.; et al. The Brassica oleracea genome reveals the asymmetrical evolution of polyploid genomes. Nat. Commun. 2014, 5, 3930. [Google Scholar] [CrossRef] [PubMed]
  54. Paritosh, K.; Yadava, S.K.; Singh, P.; Bhayana, L.; Mukhopadhyay, A.; Gupta, V.; Bisht, N.C.; Zhang, J.; Kudrna, D.A.; Copetti, D.; et al. A chromosome-scale assembly of allotetraploid Brassica juncea (AABB) elucidates comparative architecture of the A and B genomes. Plant Biotechnol. J. 2020, 19, 602–614. [Google Scholar] [CrossRef]
  55. Qu, C.; Zhao, H.; Fu, F.; Wang, Z.; Zhang, K.; Zhou, Y.; Wang, X.; Wang, R.; Xu, X.; Tang, Z.; et al. Genome-Wide Survey of Flavonoid Biosynthesis Genes and Gene Expression Analysis between Black- and Yellow-Seeded Brassica napus. Front. Plant Sci. 2016, 7, 1755. [Google Scholar] [CrossRef] [PubMed] [Green Version]
  56. Yan, M.L.; Liu, X.J.; Liu, Z.S.; Guan, C.Y.; Xiong, X.H. Cloning and Expression Analysis of Dihydroflavonol 4-Reductase Gene in Brassica juncea. Acta Agron. Sin. 2008, 34, 1–7. [Google Scholar]
  57. Kitamura, S.; Matsuda, F.; Tohge, T.; Yonekura-Sakakibara, K.; Yamazaki, M.; Saito, K.; Narumi, I. Metabolic profiling and cytological analysis of proanthocyanidins in immature seeds of Arabidopsis thaliana flavonoid accumulation mutants. Plant J. 2010, 62, 549–559. [Google Scholar] [CrossRef] [PubMed]
  58. Li, X.; Gao, P.; Cui, D.; Wu, L.; Parkin, I.; Saberianfar, R.; Menassa, R.; Pan, H.; Westcott, N.; Gruber, M.Y. The Arabidopsis tt19-4 mutant differentially accumulates proanthocyanidin and anthocyanin through a 3’ amino acid substitution in glutathione S-transferase. Plant Cell Environ. 2011, 34, 374–388. [Google Scholar] [CrossRef] [PubMed]
  59. Gratacós-Cubarsí, M.; Ribas-Agustí, A.; García-Regueiro, J.A.; Castellari, M. Simultaneous evaluation of intact glucosinolates and phenolic compounds by UPLC-DAD-MS/MS in Brassica oleracea L. var. botrytis. Food Chem. 2010, 121, 257–263. [Google Scholar] [CrossRef]
  60. Martínezsánchez, A.; Gilizquierdo, A.; Gil, M.I.; Ferreres, F.A. Comparative Study of Flavonoid Compounds, Vitamin C, and Antioxidant Properties of Baby Leaf Brassicaceae Species. J. Agric. Food Chem. 2008, 56, 2330. [Google Scholar] [CrossRef] [PubMed]
  61. Thomas, M.; Badr, A.; Desjardins, Y.; Gosselin, A.; Angers, P. Characterization of industrial broccoli discards (Brassica oleracea var. italica) for their glucosinolate, polyphenol and flavonoid contents using UPLC MS/MS and spectrophotometric methods. Food Chem. 2018, 245, 1204–1211. [Google Scholar] [CrossRef] [PubMed]
  62. Nagaharu, U. Genome analysis in Brassica with special reference to the experimental formation of B. napus and peculiar mode of fertilisation. J. Japan Bot. 1935, 7, 389–452. [Google Scholar]
  63. Cartea, M.E.; Francisco, M.; Soengas, P.; Velasco, P. Phenolic Compounds in Brassica Vegetables. Molecules 2011, 16, 251–280. [Google Scholar] [CrossRef] [PubMed]
  64. Grotewold, E. The genetics and biochemistry of floral pigments. Annu. Rev. Plant Biol. 2006, 57, 761–780. [Google Scholar] [CrossRef]
  65. Han, Y.; Vimolmangkang, S.; Soria-Guerra, R.E.; Rosales-Mendoza, S.; Zheng, D.; Lygin, A.V.; Korban, S.S. Ectopic expression of apple F3’H genes contributes to anthocyanin accumulation in the Arabidopsis tt7 mutant grown under nitrogen stress. Plant Physiol. 2010, 153, 806–820. [Google Scholar] [CrossRef] [Green Version]
  66. Fraser, C.M.; Chapple, C. The phenylpropanoid pathway in Arabidopsis. Arab. Book 2011, 9, e0152. [Google Scholar] [CrossRef] [PubMed] [Green Version]
  67. Wang, X.; Wang, H.; Wang, J.; Sun, R.; Wu, J.; Liu, S.; Bai, Y.; Mun, J.H.; Bancroft, I.; Cheng, F.; et al. The genome of the mesopolyploid crop species Brassica rapa. Nat. Genet. 2011, 43, 1035–1039. [Google Scholar] [CrossRef] [PubMed] [Green Version]
  68. Zhang, L.; Cai, X.; Wu, J.; Liu, M.; Grob, S.; Cheng, F.; Liang, J.; Cai, C.; Liu, Z.; Liu, B.; et al. Improved Brassica rapa reference genome by single-molecule sequencing and chromosome conformation capture technologies. Hortic. Res. 2018, 5, 50. [Google Scholar] [CrossRef] [Green Version]
  69. Perumal, S.; Koh, C.S.; Jin, L.; Buchwaldt, M.; Higgins, E.E.; Zheng, C.; Sankoff, D.; Robinson, S.J.; Kagale, S.; Navabi, Z.K.; et al. A high-contiguity Brassica nigra genome localizes active centromeres and defines the ancestral Brassica genome. Nat. Plants 2020, 6, 929–941. [Google Scholar] [CrossRef]
  70. Ren, Y.; Zhang, N.; Li, R.; Ma, X.; Zhang, L. Comparative transcriptome and flavonoids components analysis reveal the structural genes responsible for the yellow seed coat color of Brassica rapa L. PeerJ 2021, 9, e10770. [Google Scholar] [CrossRef]
  71. Zhai, Y.; Yu, K.; Cai, S.; Hu, L.; Amoo, O.; Xu, L.; Yang, Y.; Ma, B.; Jiao, Y.; Zhang, C.; et al. Targeted mutagenesis of BnTT8 homologs controls yellow seed coat development for effective oil production in Brassica napus L. Plant Biotechnol. J. 2020, 18, 1153–1168. [Google Scholar] [CrossRef] [Green Version]
  72. Ahmed, N.U.; Park, J.I.; Jung, H.J.; Hur, Y.; Nou, I.S. Anthocyanin biosynthesis for cold and freezing stress tolerance and desirable color in Brassica rapa. Funct. Integr. Genomics 2015, 15, 383–394. [Google Scholar] [CrossRef]
  73. Mushtaq, M.A.; Pan, Q.; Chen, D.; Zhang, Q.; Ge, X.; Li, Z. Comparative Leaves Transcriptome Analysis Emphasizing on Accumulation of Anthocyanins in Brassica: Molecular Regulation and Potential Interaction with Photosynthesis. Front. Plant Sci. 2016, 7, 311. [Google Scholar] [CrossRef] [PubMed] [Green Version]
  74. Zhang, Y.; Hu, Z.; Zhu, M.; Zhu, Z.; Wang, Z.; Tian, S.; Chen, G. Anthocyanin Accumulation and Molecular Analysis of Correlated Genes in Purple Kohlrabi (Brassica oleracea var. gongylodes L.). J. Agric. Food Chem. 2015, 63, 4160–4169. [Google Scholar] [CrossRef] [PubMed]
  75. Zhang, J.F.; Lu, Y.; Yuan, Y.X.; Zhang, X.W.; Geng, J.F.; Chen, Y.; Cloutier, S.; McVetty, P.B.E.; Li, G.Y. Map-based cloning and characterization of a gene controlling hairiness and seed coat color traits in Brassica rapa. Plant Mol. Biol. 2009, 69, 553–563. [Google Scholar] [CrossRef] [PubMed]
  76. Seitz, C.; Ameres, S.; Schlangen, K.; Forkmann, G.; Halbwirth, H. Multiple evolution of flavonoid 3′,5′-hydroxylase. Planta 2015, 242, 561–573. [Google Scholar] [CrossRef] [PubMed]
  77. Nelson, D.; Werck-Reichhart, D. A P450-centric view of plant evolution. Plant J. 2011, 66, 194–211. [Google Scholar] [CrossRef]
  78. Tsugawa, H.; Nakabayashi, R.; Mori, T.; Yamada, Y.; Takahashi, M.; Rai, A.; Sugiyama, R.; Yamamoto, H.; Nakaya, T.; Yamazaki, M.; et al. A cheminformatics approach to characterize metabolomes in stable-isotope-labeled organisms. Nat. Methods 2019, 16, 295–298. [Google Scholar] [CrossRef]
  79. Chong, J.; Soufan, O.; Li, C.; Caraus, I.; Li, S.; Bourque, G.; Wishart, D.S.; Xia, J. MetaboAnalyst 4.0: Towards more transparent and integrative metabolomics analysis. Nucleic Acids Res. 2018, 46, W486–W494. [Google Scholar] [CrossRef] [Green Version]
  80. Cao, M.; Liu, Y.; Jiang, W.; Meng, X.; Zhang, W.; Chen, W.; Peng, D.; Xing, S. UPLC/MS-based untargeted metabolomics reveals the changes of metabolites profile of Salvia miltiorrhiza bunge during Sweating processing. Sci. Rep. 2020, 10, 19524. [Google Scholar] [CrossRef]
  81. Li, X.; Zhang, X.; Ye, L.; Kang, Z.; Jia, D.; Yang, L.; Zhang, B. LC-MS-Based Metabolomic Approach Revealed the Significantly Different Metabolic Profiles of Five Commercial Truffle Species. Front. Microbiol. 2019, 10, 2227. [Google Scholar] [CrossRef] [PubMed]
  82. Bailey, T.L.; Boden, M.; Buske, F.A.; Frith, M.; Grant, C.E.; Clementi, L.; Ren, J.; Li, W.W.; Noble, W.S. MEME SUITE: Tools for motif discovery and searching. Nucleic Acids Res. 2009, 37, W202–W208. [Google Scholar] [CrossRef] [PubMed]
  83. Pucker, B.; Reiher, F.; Schilbert, H.M. Automatic Identification of Players in the Flavonoid Biosynthesis with Application on the Biomedicinal Plant Croton tiglium. Plants 2020, 9, 1103. [Google Scholar] [CrossRef] [PubMed]
  84. Owens, D.K.; Alerding, A.B.; Crosby, K.C.; Bandara, A.B.; Westwood, J.H.; Winkel, B.S.J. Functional analysis of a predicted flavonol synthase gene family in Arabidopsis. Plant Physiol. 2008, 147, 1046–1061. [Google Scholar] [CrossRef] [Green Version]
  85. Bolger, A.M.; Lohse, M.; Usadel, B. Trimmomatic: A flexible trimmer for Illumina sequence data. Bioinformatics 2014, 30, 2114–2120. [Google Scholar] [CrossRef] [Green Version]
  86. Kim, D.; Langmead, B.; Salzberg, S.L. HISAT: A fast spliced aligner with low memory requirements. Nat. Methods 2015, 12, 357–360. [Google Scholar] [CrossRef] [Green Version]
  87. Anders, S.; Pyl, P.T.; Huber, W. HTSeq--a Python framework to work with high-throughput sequencing data. Bioinformatics 2015, 31, 166–169. [Google Scholar] [CrossRef]
  88. Love, M.I.; Huber, W.; Anders, S. Moderated estimation of fold change and dispersion for RNA-seq data with DESeq2. Genome Biol. 2014, 15, 550. [Google Scholar] [CrossRef] [Green Version]
  89. Chen, C.; Chen, H.; Zhang, Y.; Thomas, H.R.; Frank, M.H.; He, Y.; Xia, R. TBtools: An Integrative Toolkit Developed for Interactive Analyses of Big Biological Data. Mol. Plant 2020, 13, 1194–1202. [Google Scholar] [CrossRef]
  90. Chandna, R.; Augustine, R.; Bisht, N.C. Evaluation of Candidate Reference Genes for Gene Expression Normalization in Brassica juncea Using Real Time Quantitative RT-PCR. PLoS ONE 2012, 7, e36918. [Google Scholar] [CrossRef]
  91. Lu, K.; Li, T.; He, J.; Chang, W.; Zhang, R.; Liu, M.; Yu, M.N.; Fan, Y.H.; Ma, J.Q.; Sun, W.; et al. qPrimerDB: A thermodynamics-based gene-specific qPCR primer database for 147 organisms. Nucleic Acids Res. 2018, 46, D1229–D1236. [Google Scholar] [CrossRef]
  92. Larkin, M.A.; Blackshields, G.; Brown, N.; Chenna, R.; McGettigan, P.A.; McWilliam, H.; Valentin, F.; Wallace, I.M.; Wilm, A.; Lopez, R. Clustal W and Clustal X version 2.0. Bioinformatics 2007, 23, 2947–2948. [Google Scholar] [CrossRef] [PubMed] [Green Version]
Figure 1. MS data analysis in yellow- and dark-seeded B. juncea. (a) Seed coat color of yellow- and dark-seeded B. juncea. (b–d) Base peak chromatograms of seeds under full scanning (m/z =100–1500) at 20, 30, and 40 days after pollination (DAP), respectively. The black and green lines indicate dark- and yellow-seeded B. juncea, respectively. (e–g) All of the detected compounds were generated from seeds at 20, 30, and 40 DAP, respectively. The green and black dots represent compounds from yellow- and dark-seeded B. juncea, respectively. The horizontal and vertical coordinates represent the retention times (RTs) and peak areas of the corresponding compounds, respectively.
Ijms 22 07215 g001
Figure 2. Identification of common differentially abundant metabolites in developing seeds of B. juncea. (a–c) Volcano plots of differentially abundant metabolites. Each point in a volcano plot represents a metabolite; the abscissa represents the logarithm of the quantitative difference multiples of a metabolite in two samples, and the ordinate represents the variable importance in project (VIP) value. The green dots represent down-regulated differentially abundant metabolites, the red dots represent up-regulated differentially abundant metabolites, and the black dots represent metabolites with no difference. (d) Venn diagram of differentially abundant metabolites in developing seeds of B. juncea. DAP = days after pollination.
Ijms 22 07215 g002
Figure 3. Analysis of metabolite accumulation patterns in B. juncea. (ac) Distribution and accumulation pattern of phenolic acids (a), flavonoids (b), and glucosinolates (c) in yellow- and dark-seeded B. juncea. The horizontal and vertical coordinates represent the content of the constituent and the developmental stage, respectively. Error bars represent the SDs of the replications among the biological samples in this study. Statistical significance was calculated using Student’s t-test: *, p < 0.05; **, p < 0.01, respectively. (d) The accumulation patterns of flavonoid compounds in yellow- and dark-seeded B. juncea. Red indicates high abundance; blue indicates relatively low metabolite abundance. The bar represents the log2 contents (μg/g FW). DAP, days after pollination. The red asterisk indicates significantly different metabolites at three stages. DP2, procyanidin B; DP3, procyanidin C; DP4, procyanidin D.
Ijms 22 07215 g003
Figure 4. Qualitative and quantitative analysis of the common differentially abundant metabolites in yellow- and dark-seeded B. juncea. Accumulation of differentially abundant metabolites during seed development in yellow- and dark-seeded B. juncea. The black and yellow lines represent dark- and yellow-seeded B. juncea, respectively. The title number represents the code of proposed compounds and the related information is listed in Supplementary Table S1. DAP, days after pollination. DP2, procyanidin B; DP3, procyanidin C; DP4, procyanidin D.
Ijms 22 07215 g004
Figure 5. Analysis of the expression pattern of flavonoid genes in yellow and dark B. juncea seeds at various developmental stages. (a) Expression profiles of the flavonoid genes in yellow- and dark-seeded B. juncea at 20, 30, and 40 days after pollination (DAP). The scale bar denotes the log2 (FPKM + 1). The heatmap was generated using TBtools (version 1.055). The color represents relative gene expression levels. (b) RT-qPCR validation of flavonoid gene expression from the RNA-seq data at 20, 30, and 40 DAP. The candidate genes were named using the species abbreviation of the source organism (italicized), the gene family name, and the capital letter for the identified homologous, e.g., BjuTT1_A.
Ijms 22 07215 g005
Figure 6. Structural organization of TT8 sequences from Brassica species. (a) Structure of TT8 sequences from B. rapa, B. napus, and B. juncea; (b) Structure of TT8 sequences from B. nigra, B. carinata, and B. juncea; (c) Structure of TT8 sequences from B. oleracea, B. napus, and B. carinata. The black rectangles represent the exons. The red rectangle represents the insertion in BjuTT8A-y. The lowercase letter y and d at the end of gene name represent the yellow- and dark-seeded seed coat color, respectively. Details of the sequence and structural organization of TT8 are shown in Supplementary File S1.
Ijms 22 07215 g006
Figure 7. Schematic diagram of the flavonoid biosynthetic pathway in B. juncea. The scale bar denotes the log2 (FPKM + 1). Table 1. 055). The color represents relative gene expression levels.
Ijms 22 07215 g007
Table 1. Common differentially abundant metabolites in yellow- and dark-seeded B. juncea at three developmental stages.
IDType 1Proposed Compound 2RT 3Average MassD/Y-20DAPD/Y-30DAPD/Y-40DAP
FC 4VIP-Value 5p-ValueFCVIP-Valuep-ValueFCVIP-Valuep-Value
3012,5-dihydroxybenzoic acid3.49153.0182608.611.4170.007281.691.4170.023106.511.4110.069
1052eriodictyol6.98287.056545.6341.97402732.31.9740615.061.9510
1062epicatechin6.97289.072360.9211.8890494.351.8890243.941.9340
1082(+)-3,3′,4′,5,7-pentahydroxyflavan5.58289.07284.6771.81704.7531.81702.7292.0050
1102(+)-catechin13.16289.07283.4301.1300.1709.1291.13004.8561.7950
1182quercetin13.12301.03652.3101.8540.0024.8011.85402.9371.8330
1822oenin12.69491.121579.5721.358015.8391.35807.8141.4150
1972[DP2]-29.52577.136241.5181.1350.2651168.51.1350263.831.8580
1982[DP2]-16.30577.1363114.181.5360527.471.8690549.831.8510
2332[DP3]-29.41865.2006110.571.54401783.31.5440643.991.8050
2352[DP3]-17.47865.201657.9171.54701854.91.54701926.21.5590
2492[DP4]7.841153.26405.6951.56408.0641.56407.9481.6030
2612Is-3-O-glucoside-7-O-glucoside5.16639.15768.7401.1420.21525.9231.14208.5581.7030
3092leucocyanidin3.6305.065638.7401.923016501.90009.5041.7800
3102taxifolin3.6303.053339.7001.736098181.880011.541.7900
3112taxifolin9.83303.053322.0801.914041.791.74006.6591.7600
3122taxifolin10.17303.053332.8501.83703.0861.94002.3231.700
3132cyanidin3.6285.0397280.2001.87807.3831.79008.9281.6600
334pimelic acid6.3159.06530.2391.2980.0010.1731.29800.2761.0110.003
1714LysoPE 16:015.36452.27860.2611.0720.0100.0271.07200.1081.4200
754-Chlorophenol3.25127.00240.3401.23400.4251.23400.5731.1290.033
1295thymidine-5′-monophosphate13.13321.04462.0901.5580.1194.7141.558010.2391.6730
2876un1312.11461.108214.2251.366032.6251.36604.9231.6530
2886un1411.91461.108390.4491.653085.9581.653096.9661.5310
2946un203.47368.0614154.7201.86605.5681.86601693.31.5780
2956un213.6403.0335109.031.92805.9661.92803.9311.9070
2966un223.54437.109358.712.0060985.412.0060581.942.010
2976un235.09447.1416413.21.929014.7011.929038.9251.1650
2986un245.68447.14161613.91.94012.5541.94017.161.1560
2996un253.29468.042576.271.97901897.91.9790736.61.8580
3006un263.56524.176925.9561.93605.5741.93602.8272.0050
3016un277.07579.1514613.781.7330305701.73306037.41.6990
3026un289.63623.14105.0231.5780847.061.5780334.751.7930
3036un296.43645.122477.3431.70697.361.70506.531.8360
3046un308.09720.16095292.11.3080299.541.3080183.11.3950
3056un3110.18720.16091484.91.31701971.11.3170392.681.3850
1 Type 1, phenolic acids; type 2, flavonoids; type 4, lipid compounds; type 5, other hydroxycinnamic acid compounds; type 6, unknown compounds. 2 Is= isorhamnetin; DP, degree of polymerization of the epicatechin unit; DP2, procyanidin B; DP3, procyanidin C; DP4, procyanidin D; un, unknown metabolites. 3 RT, retention time (min). 4 FC, fold change. 5 VIP, variable importance in projection.
Publisher’s Note: MDPI stays neutral with regard to jurisdictional claims in published maps and institutional affiliations.

