
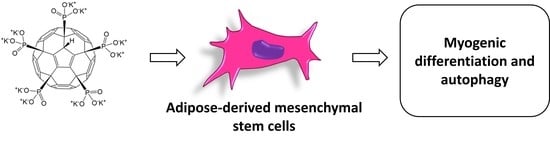
The Phosphonate Derivative of C60 Fullerene Induces Differentiation towards the Myogenic Lineage in Human Adipose-Derived Mesenchymal Stem Cells

 , , ,
, , ,
Abstract
:
1. Introduction
2. Results
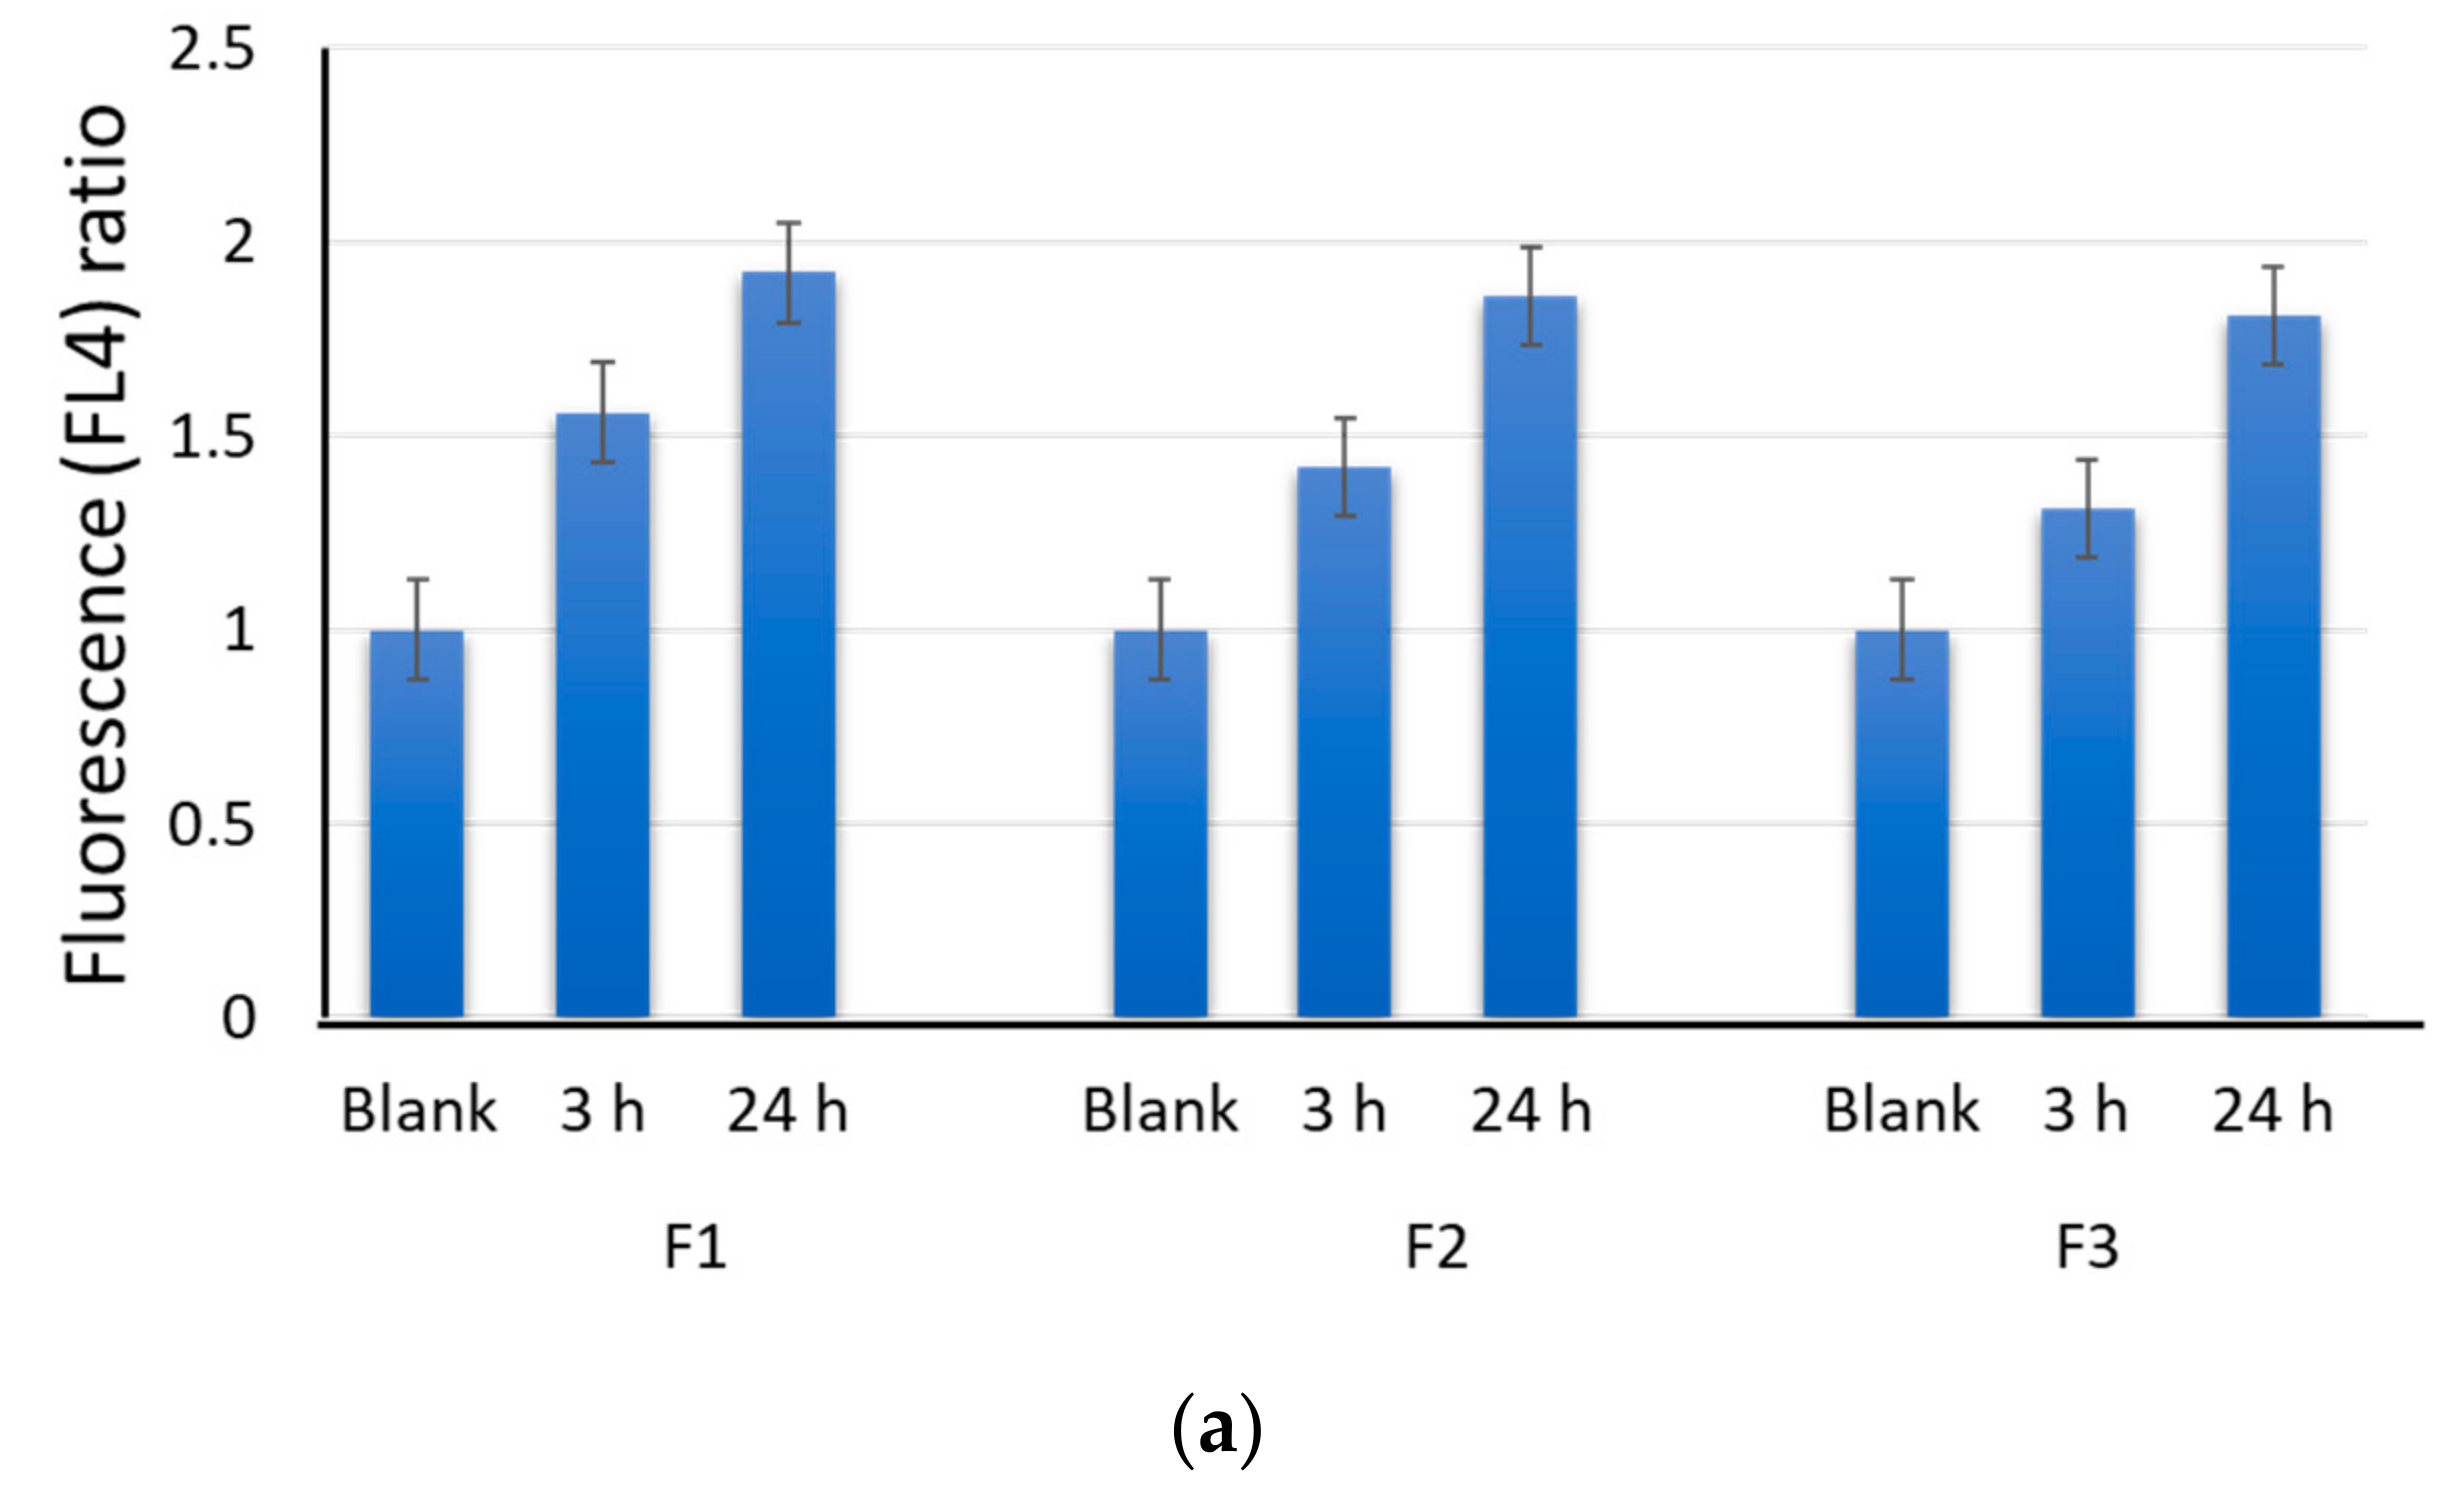
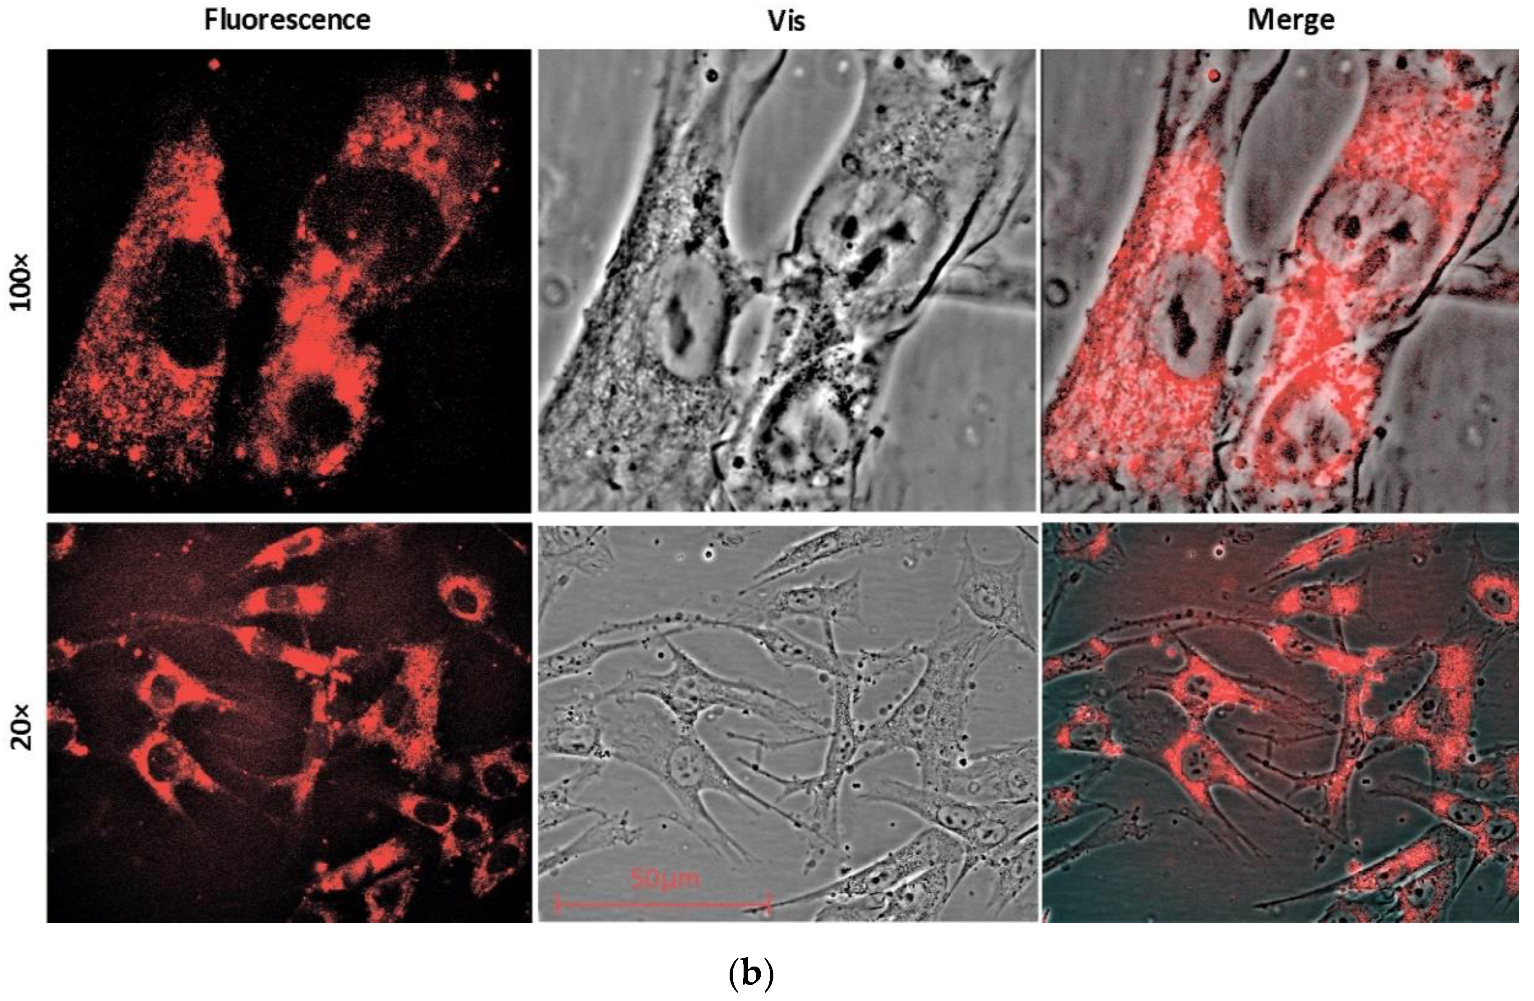
2.1. Permeation and Distribution of Fullerenes in Cells
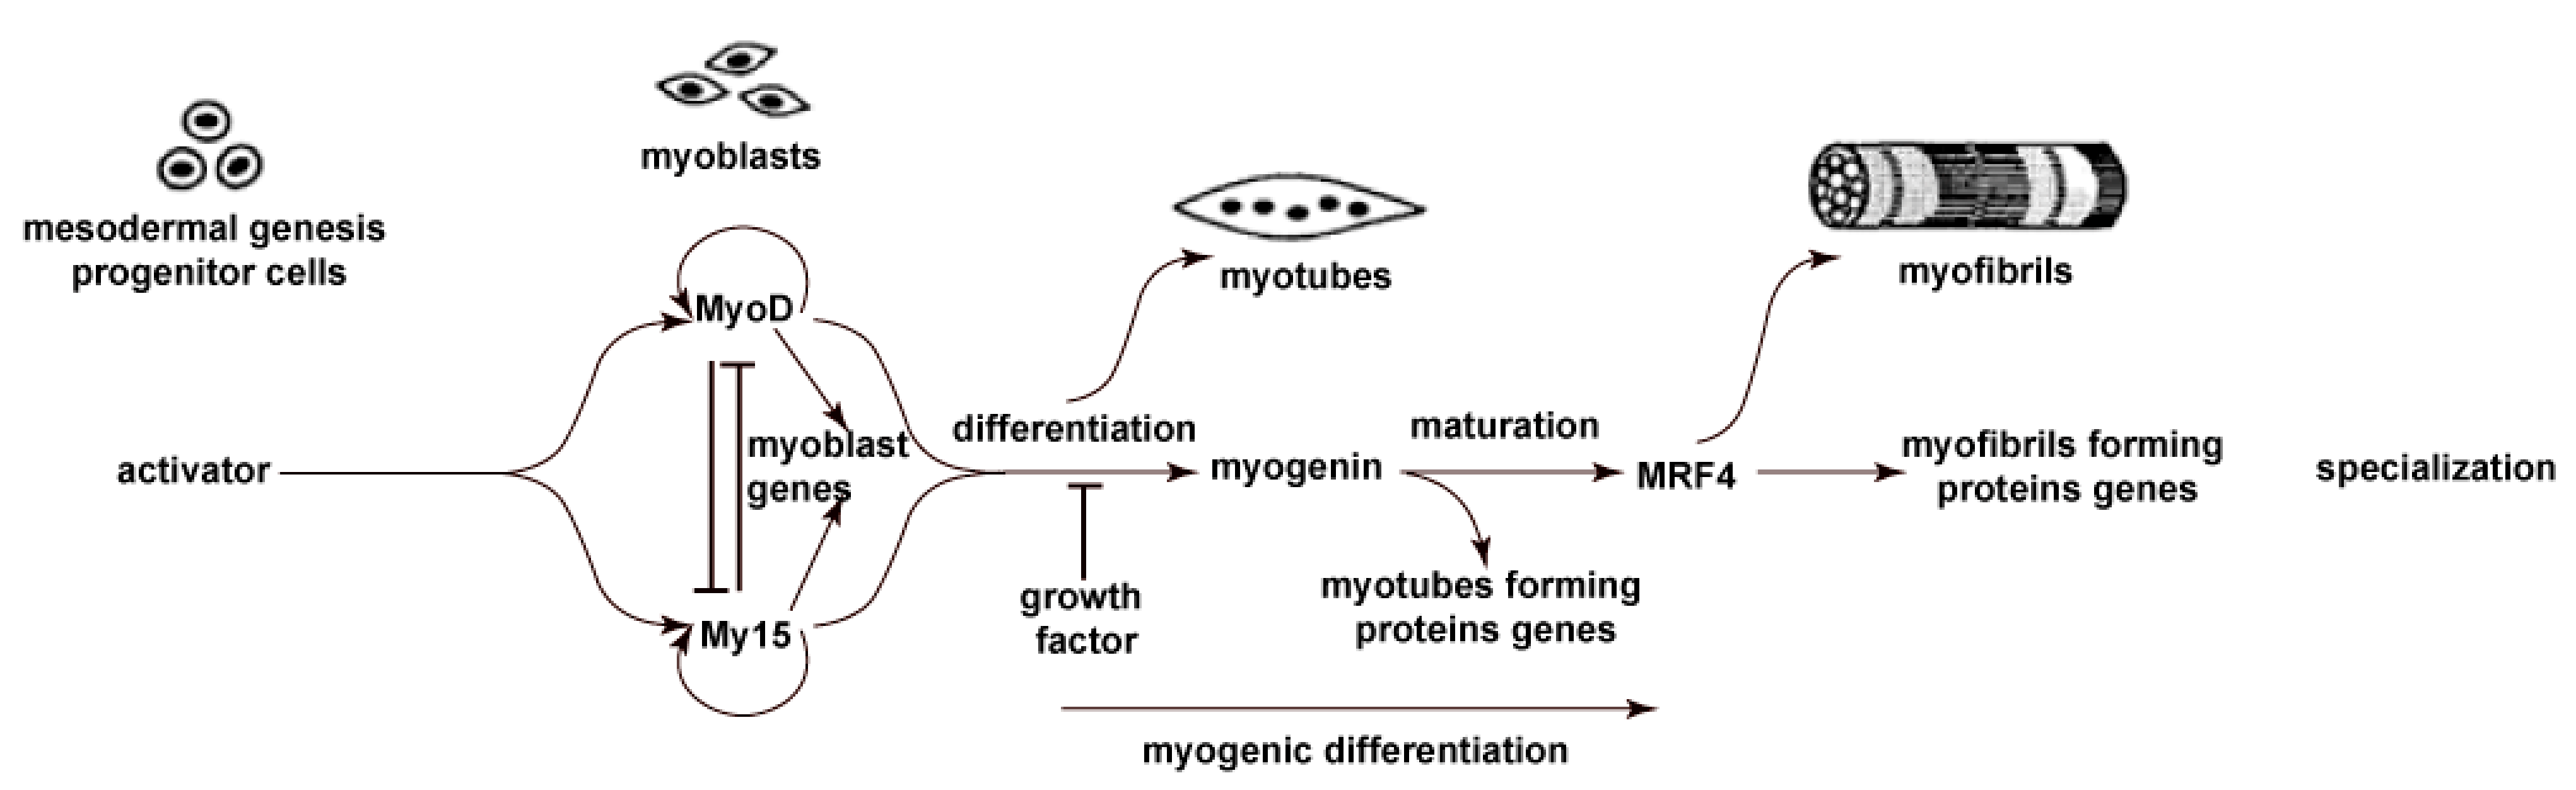
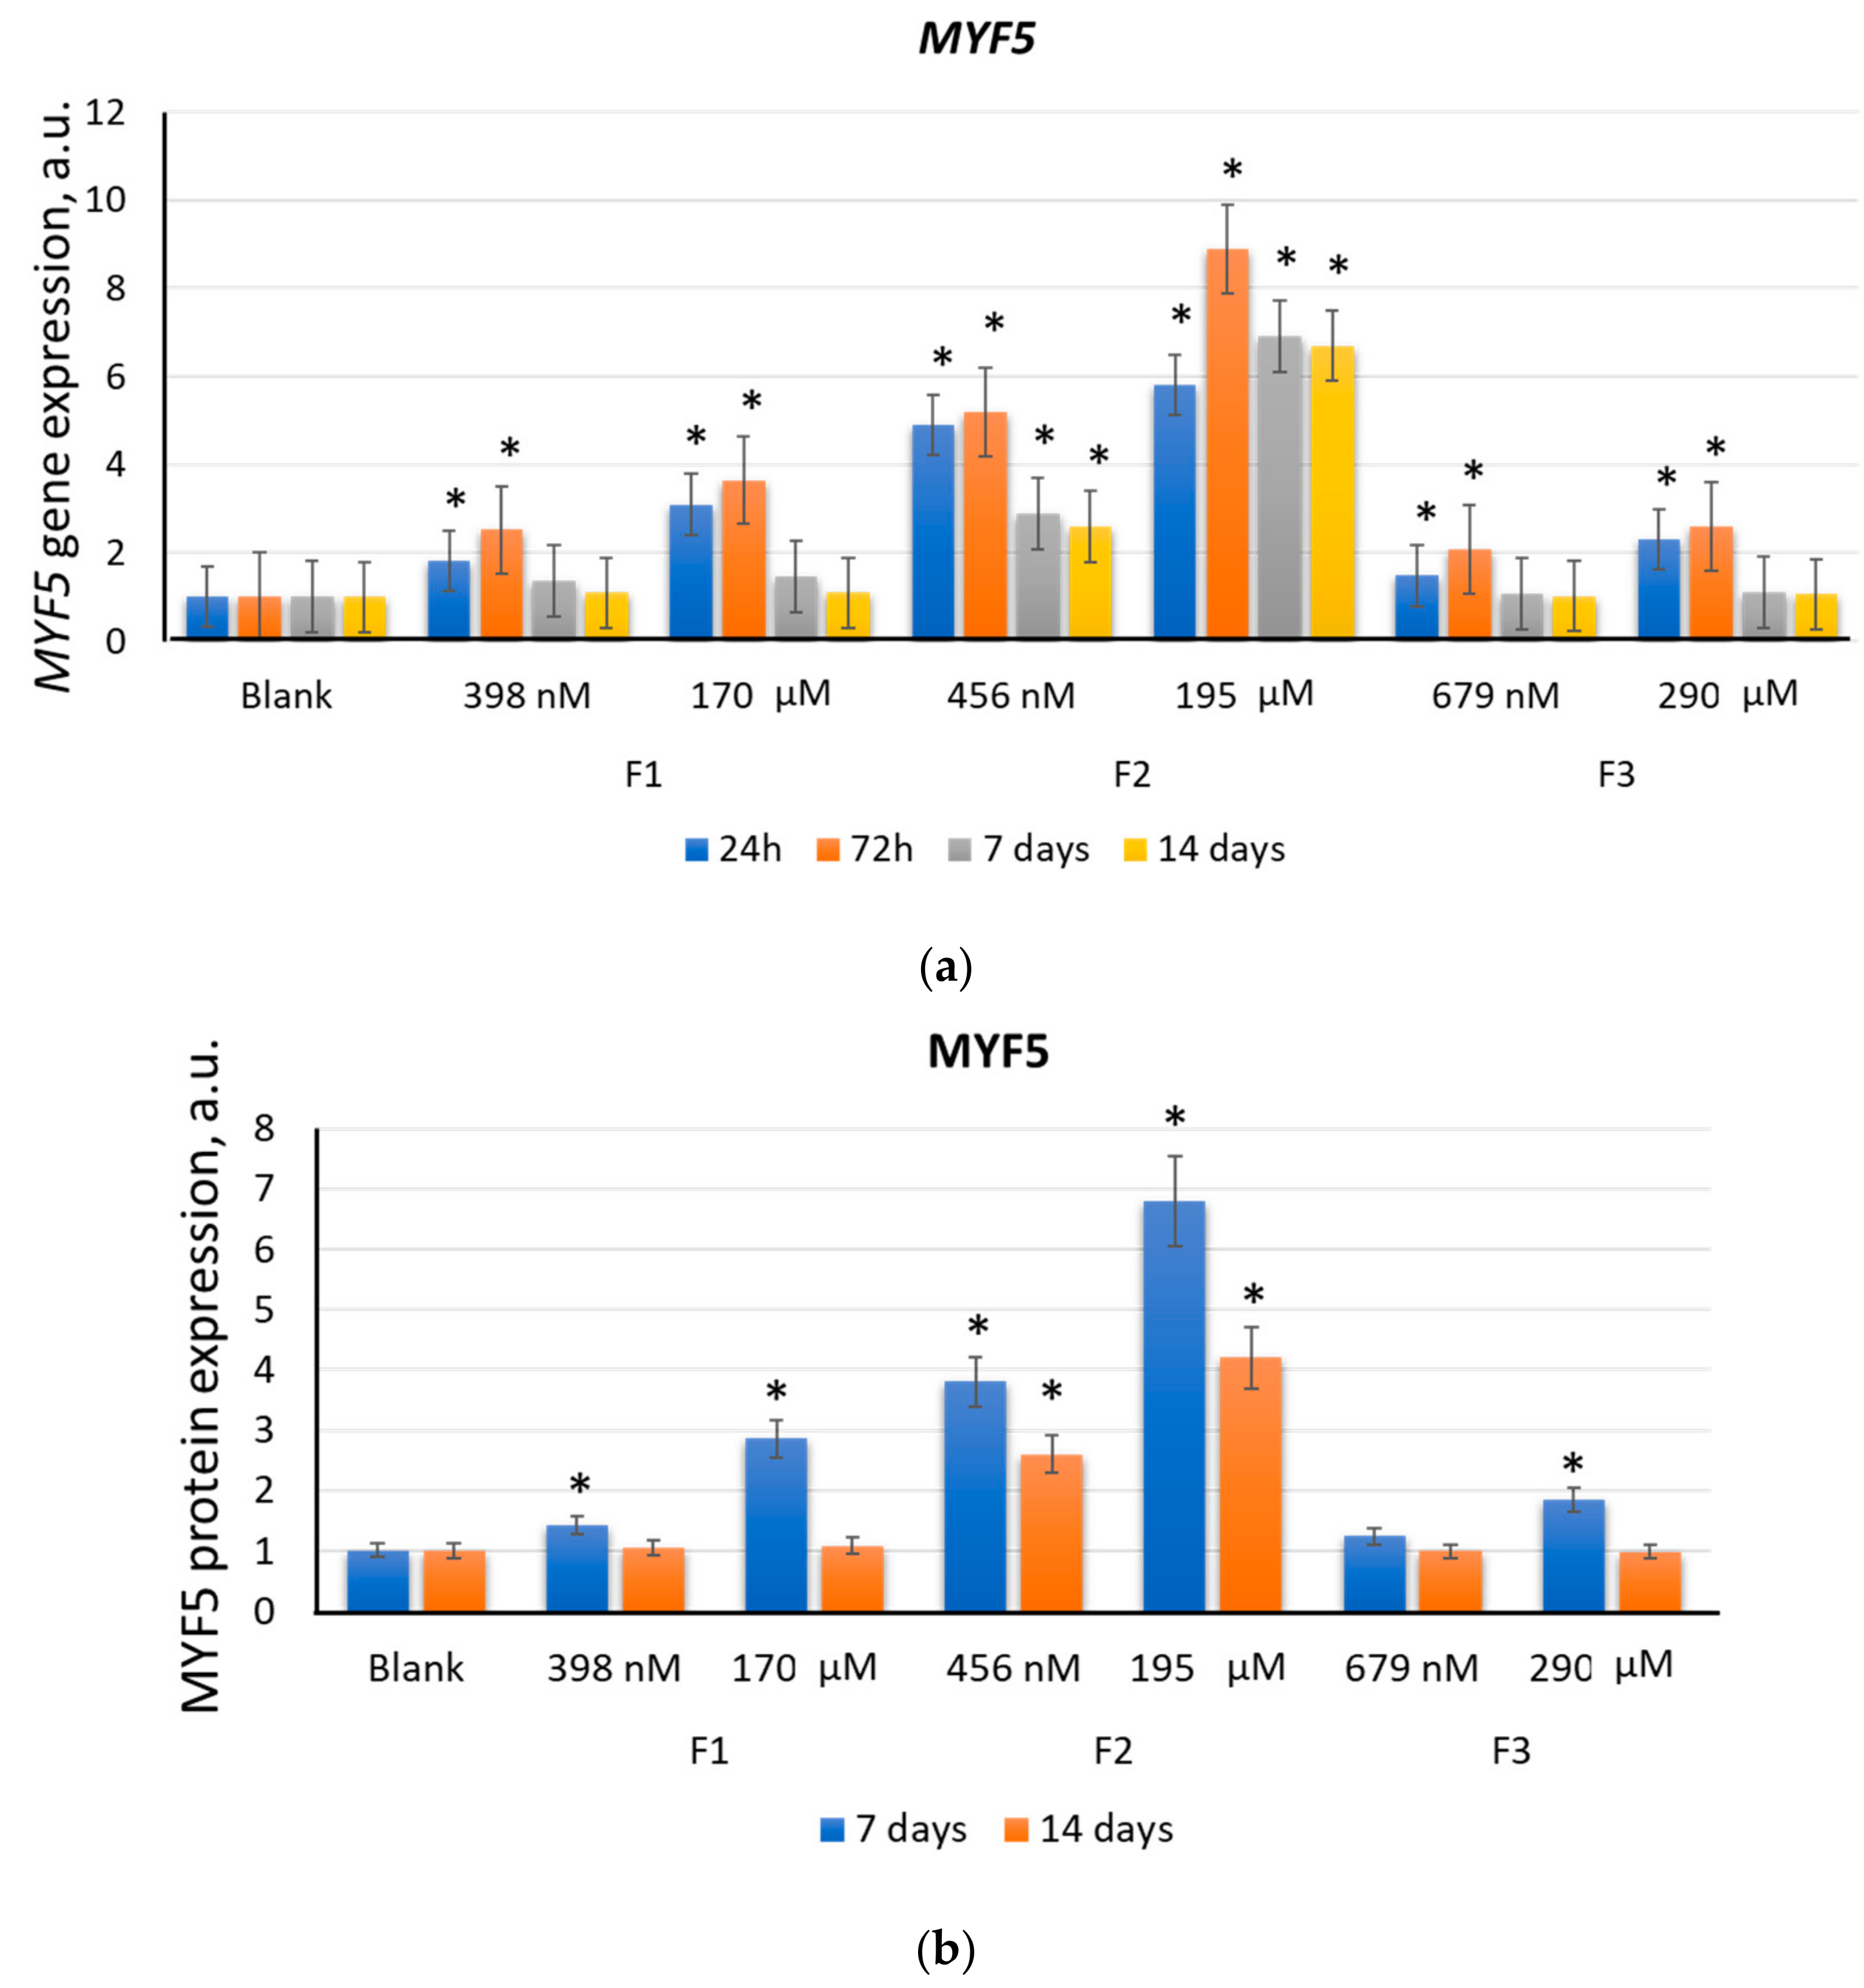
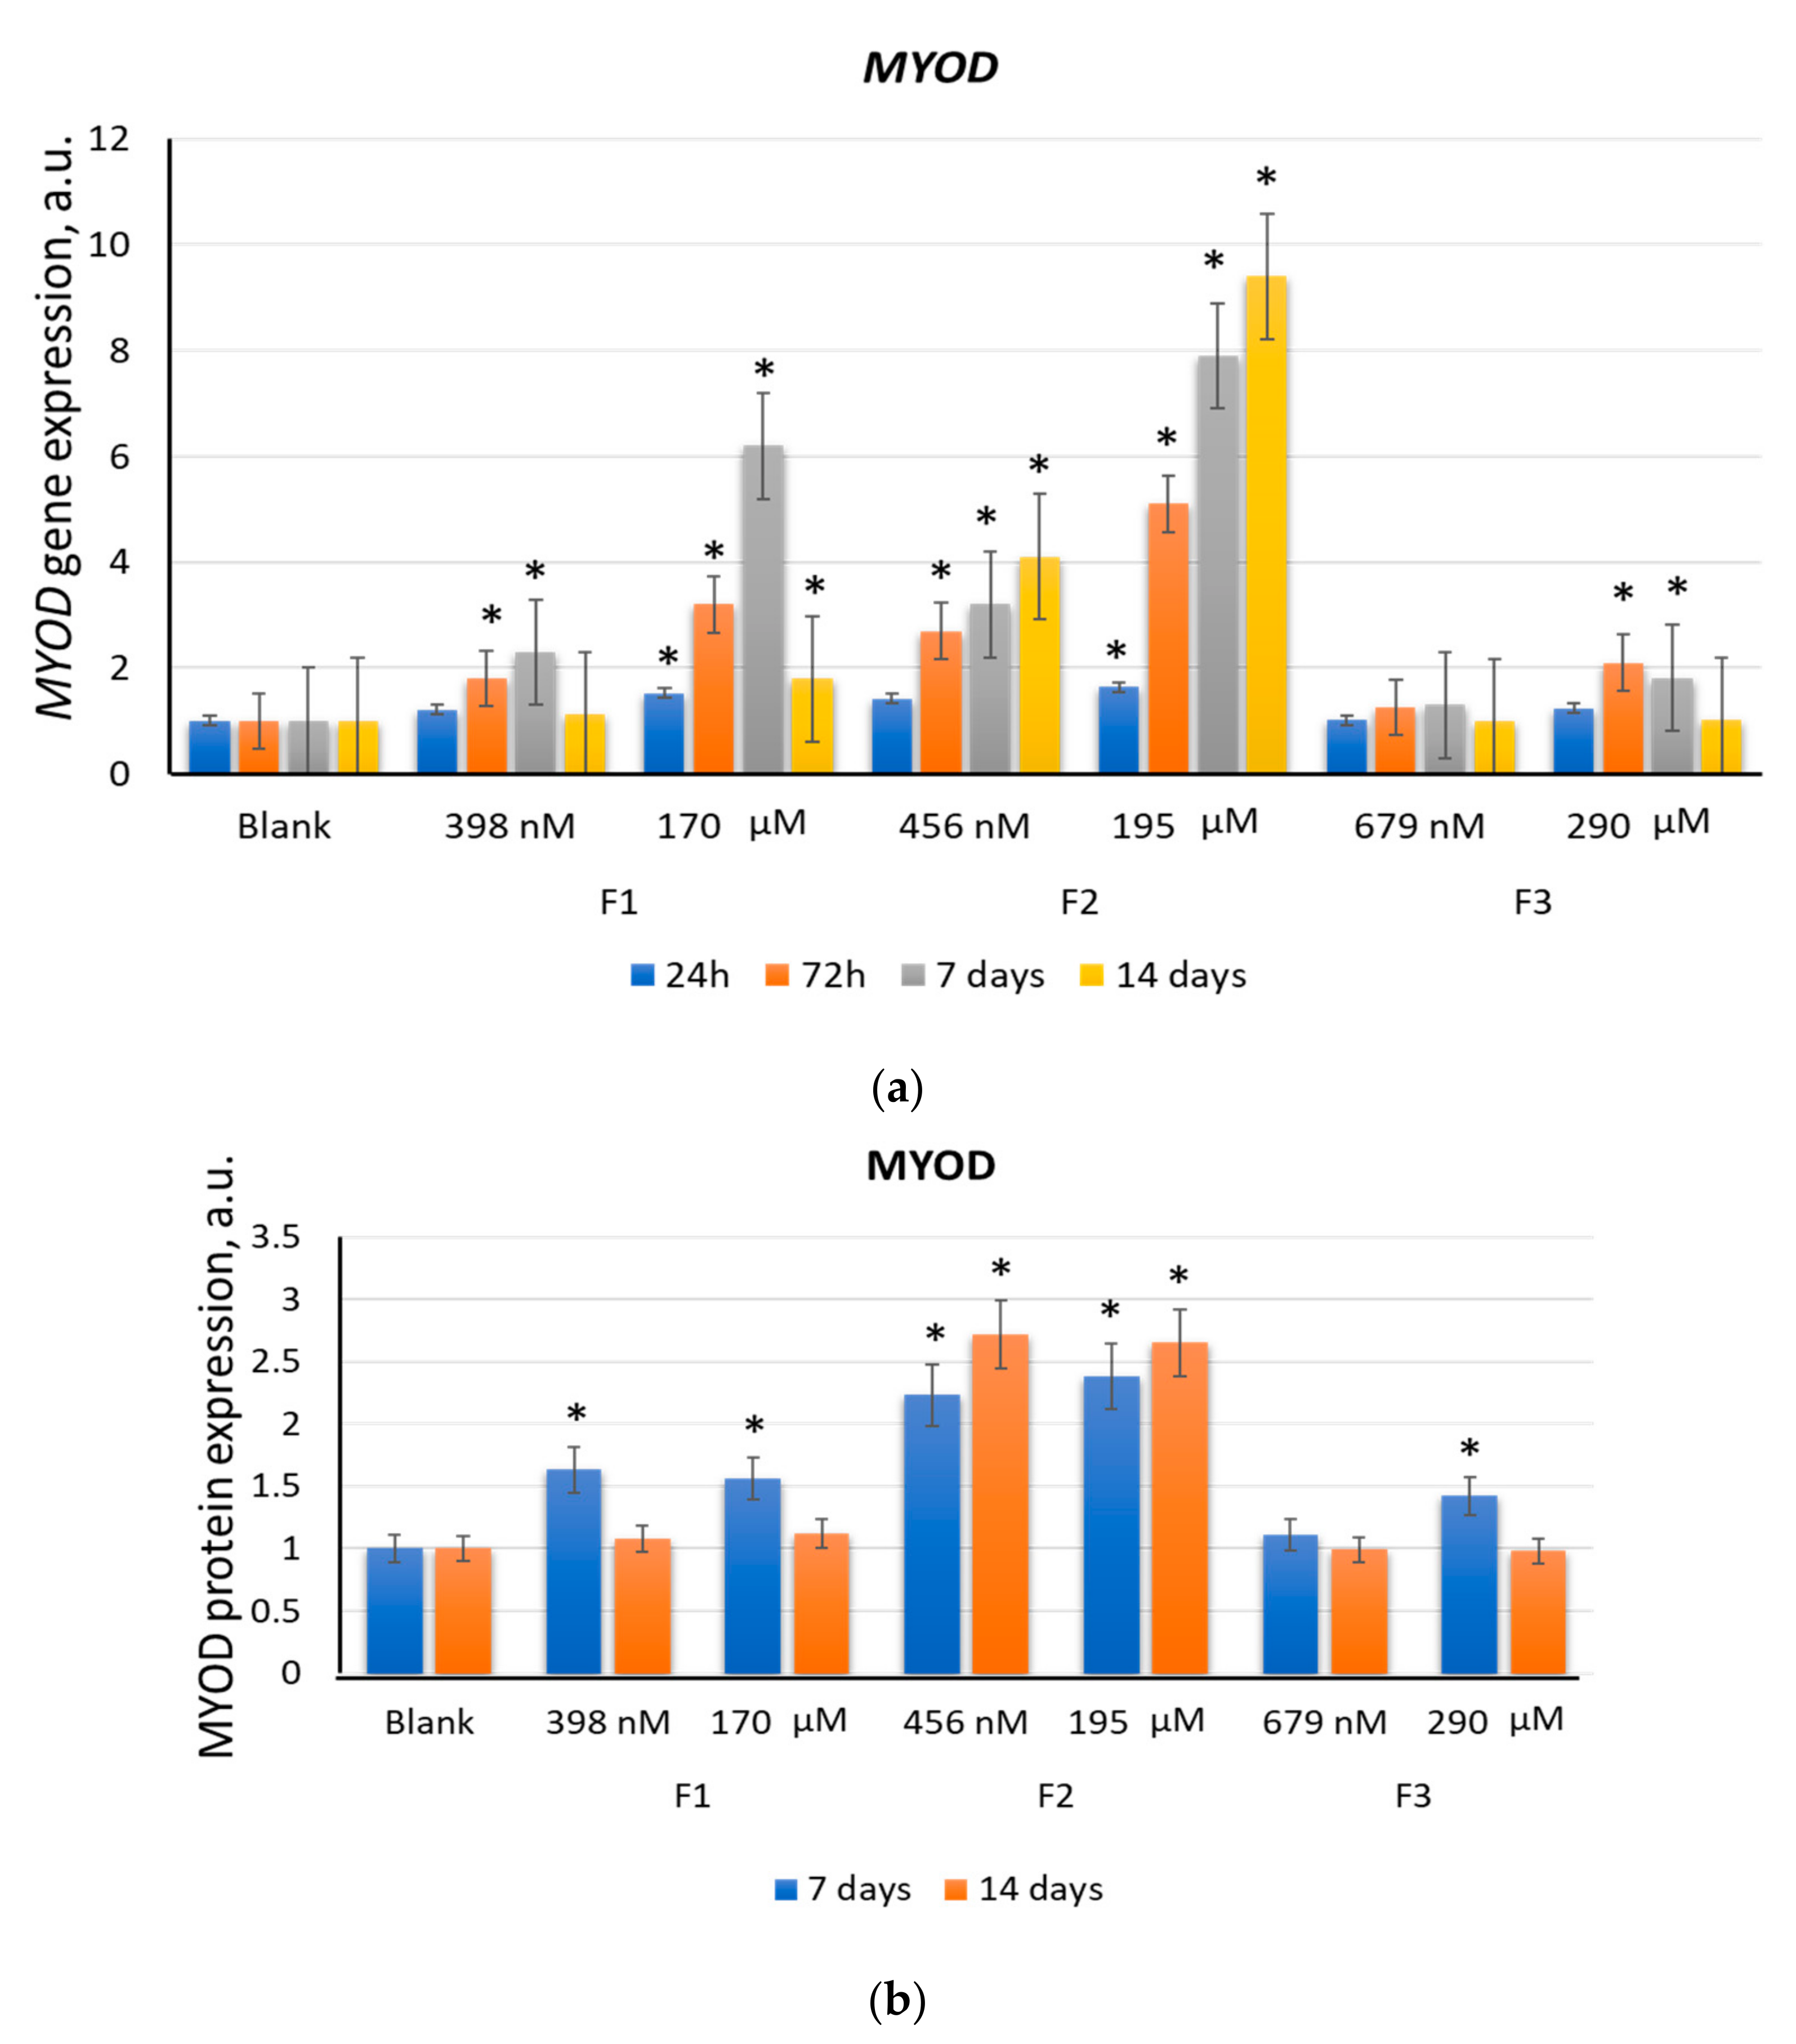
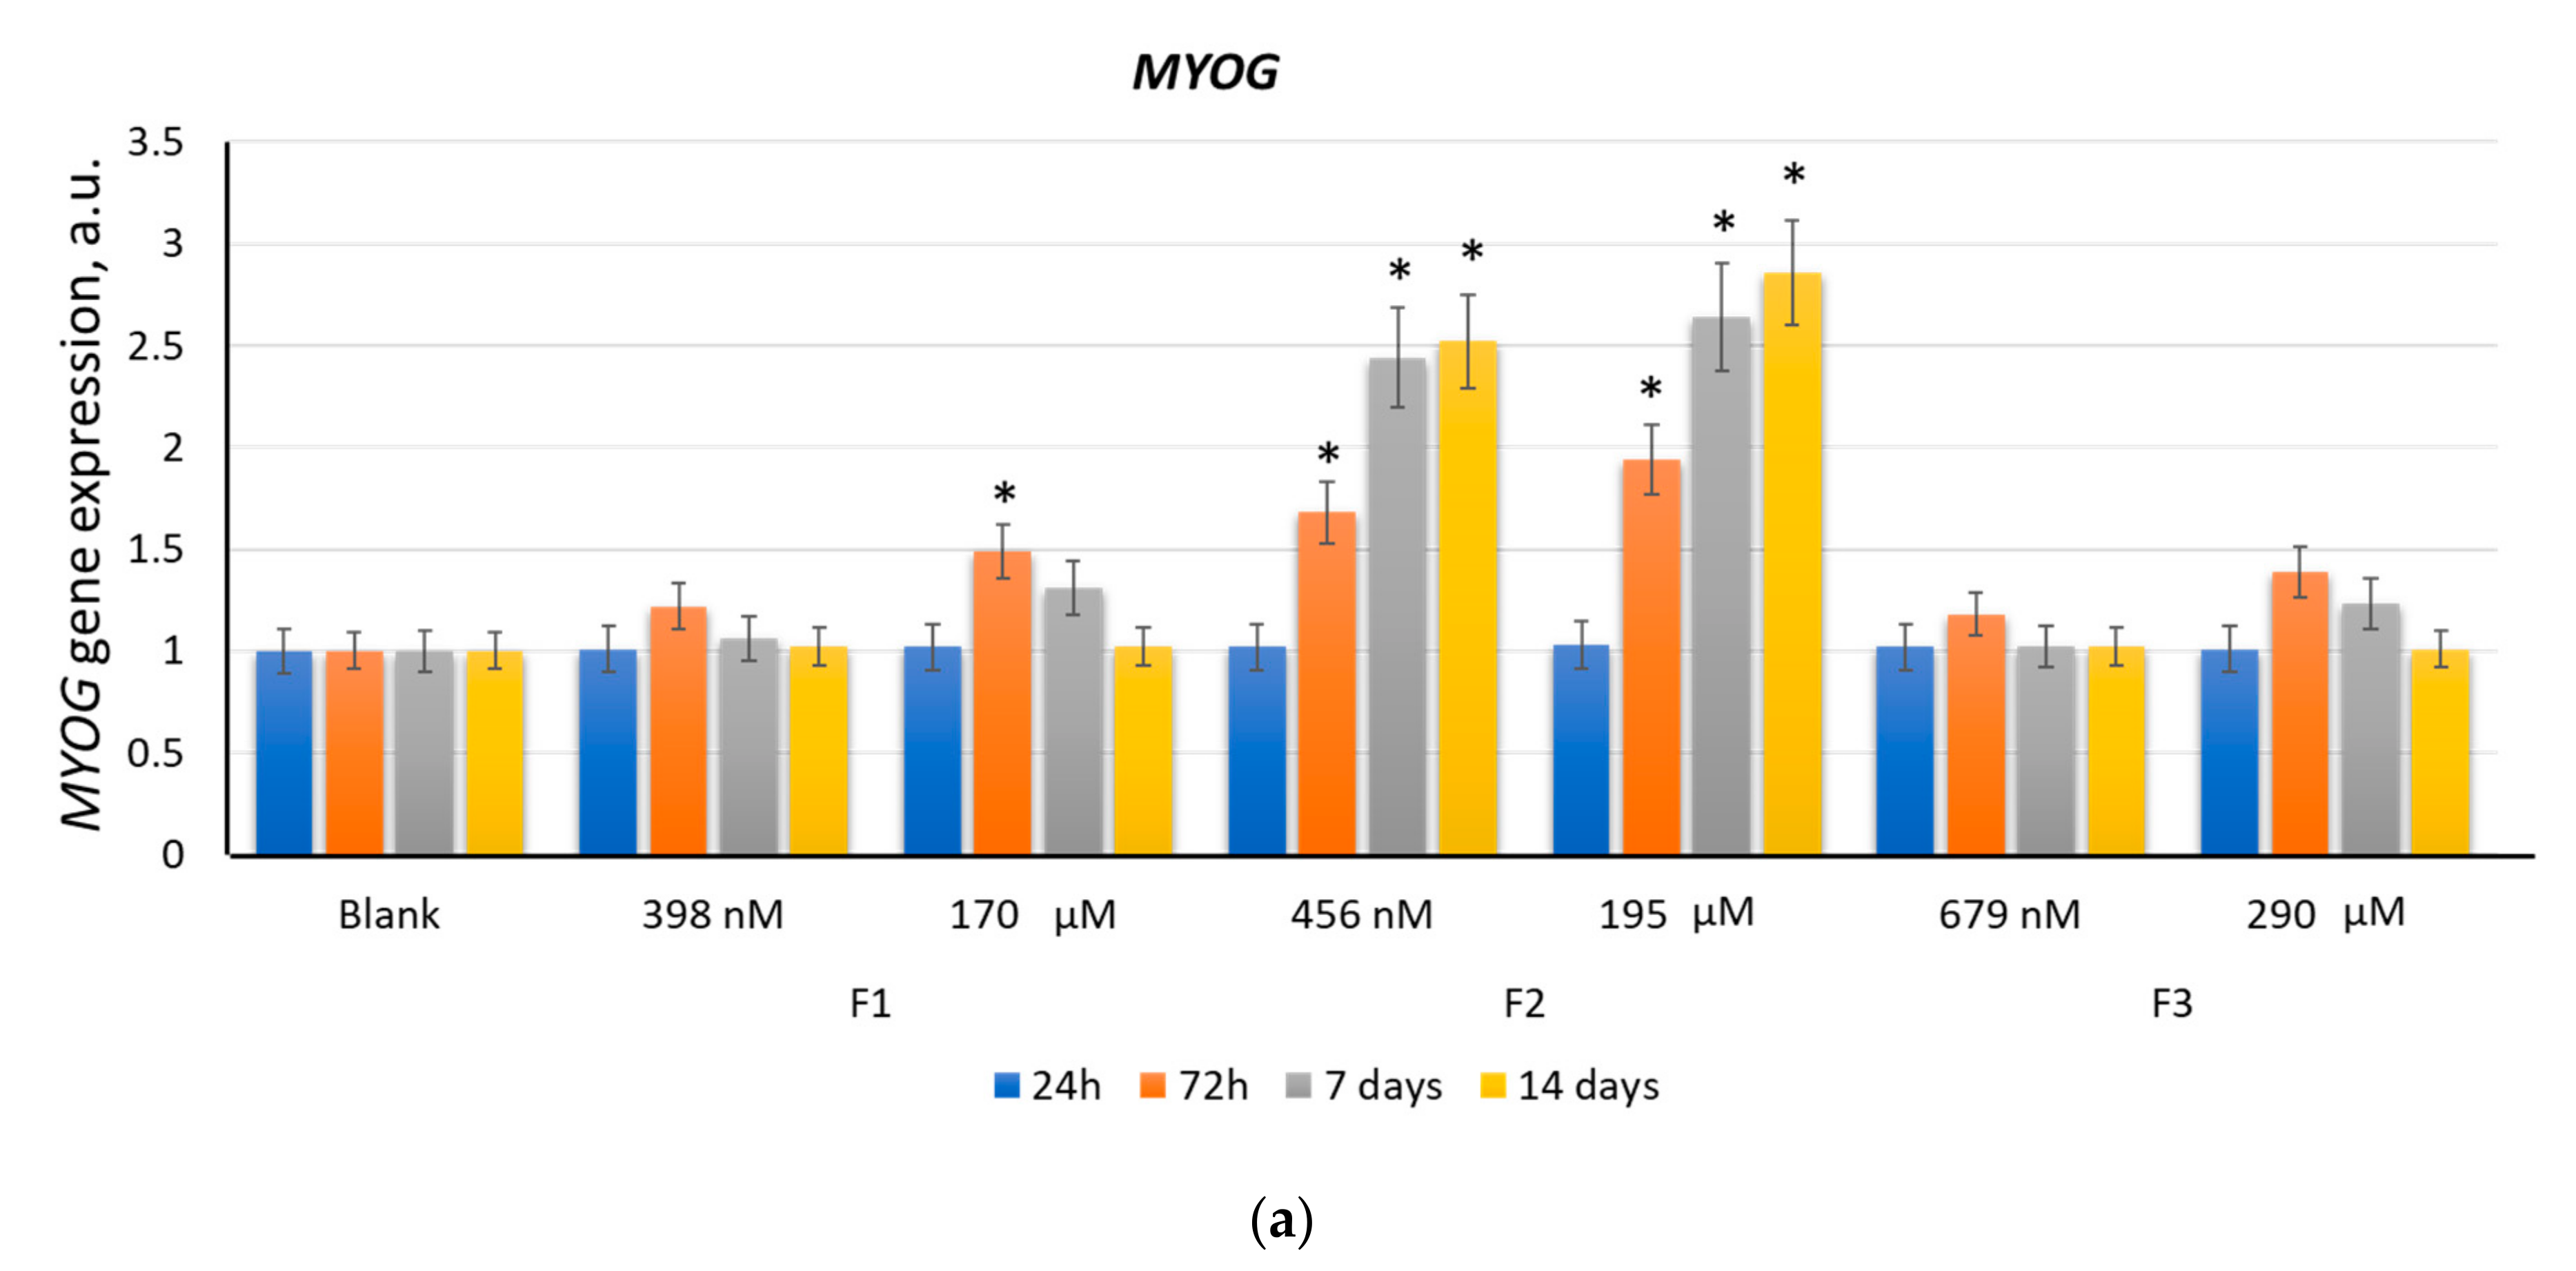
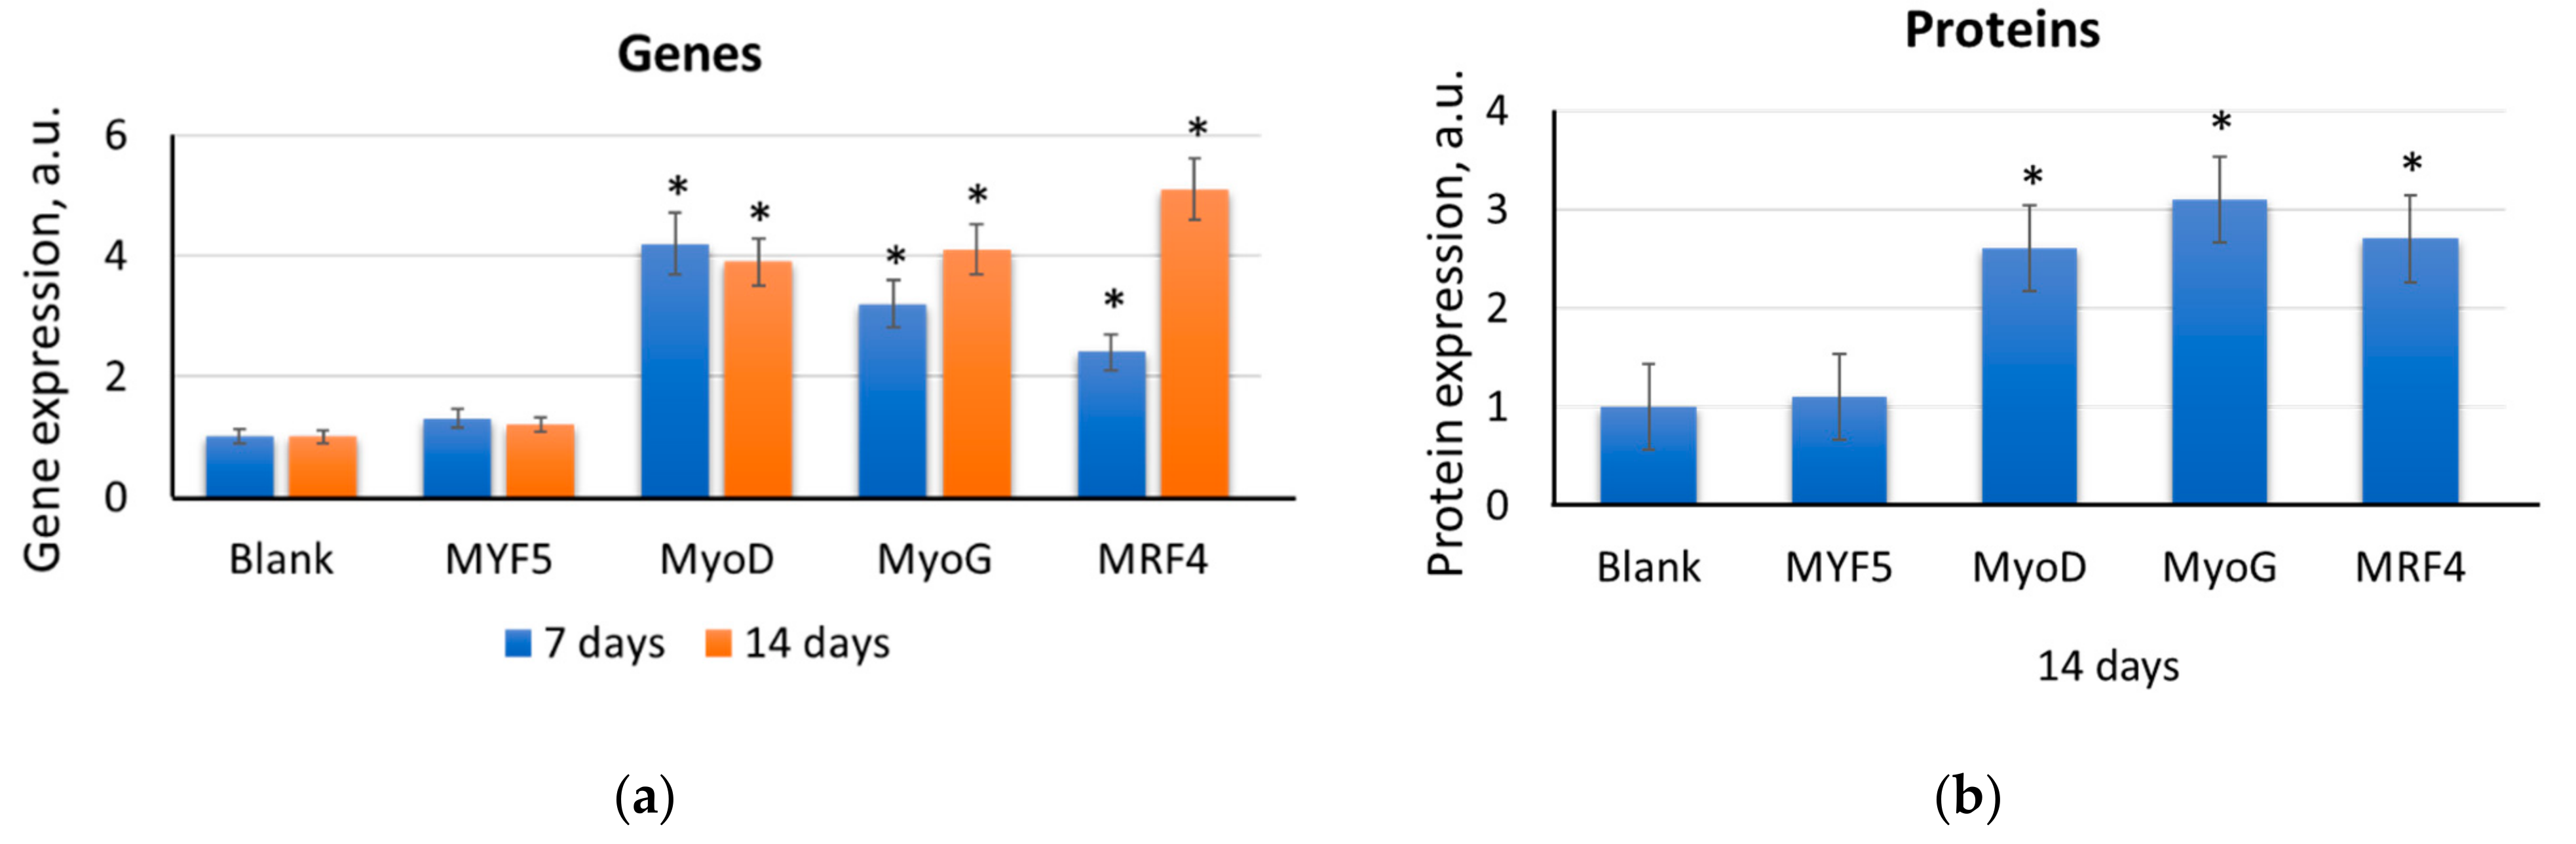
2.2. F1, F2, and F3 Stimulate the Expression of Transcription Factors of Myogenic Differentiation in MSCs to Varying Degrees
2.2.1. MYF5
2.2.2. MYOD
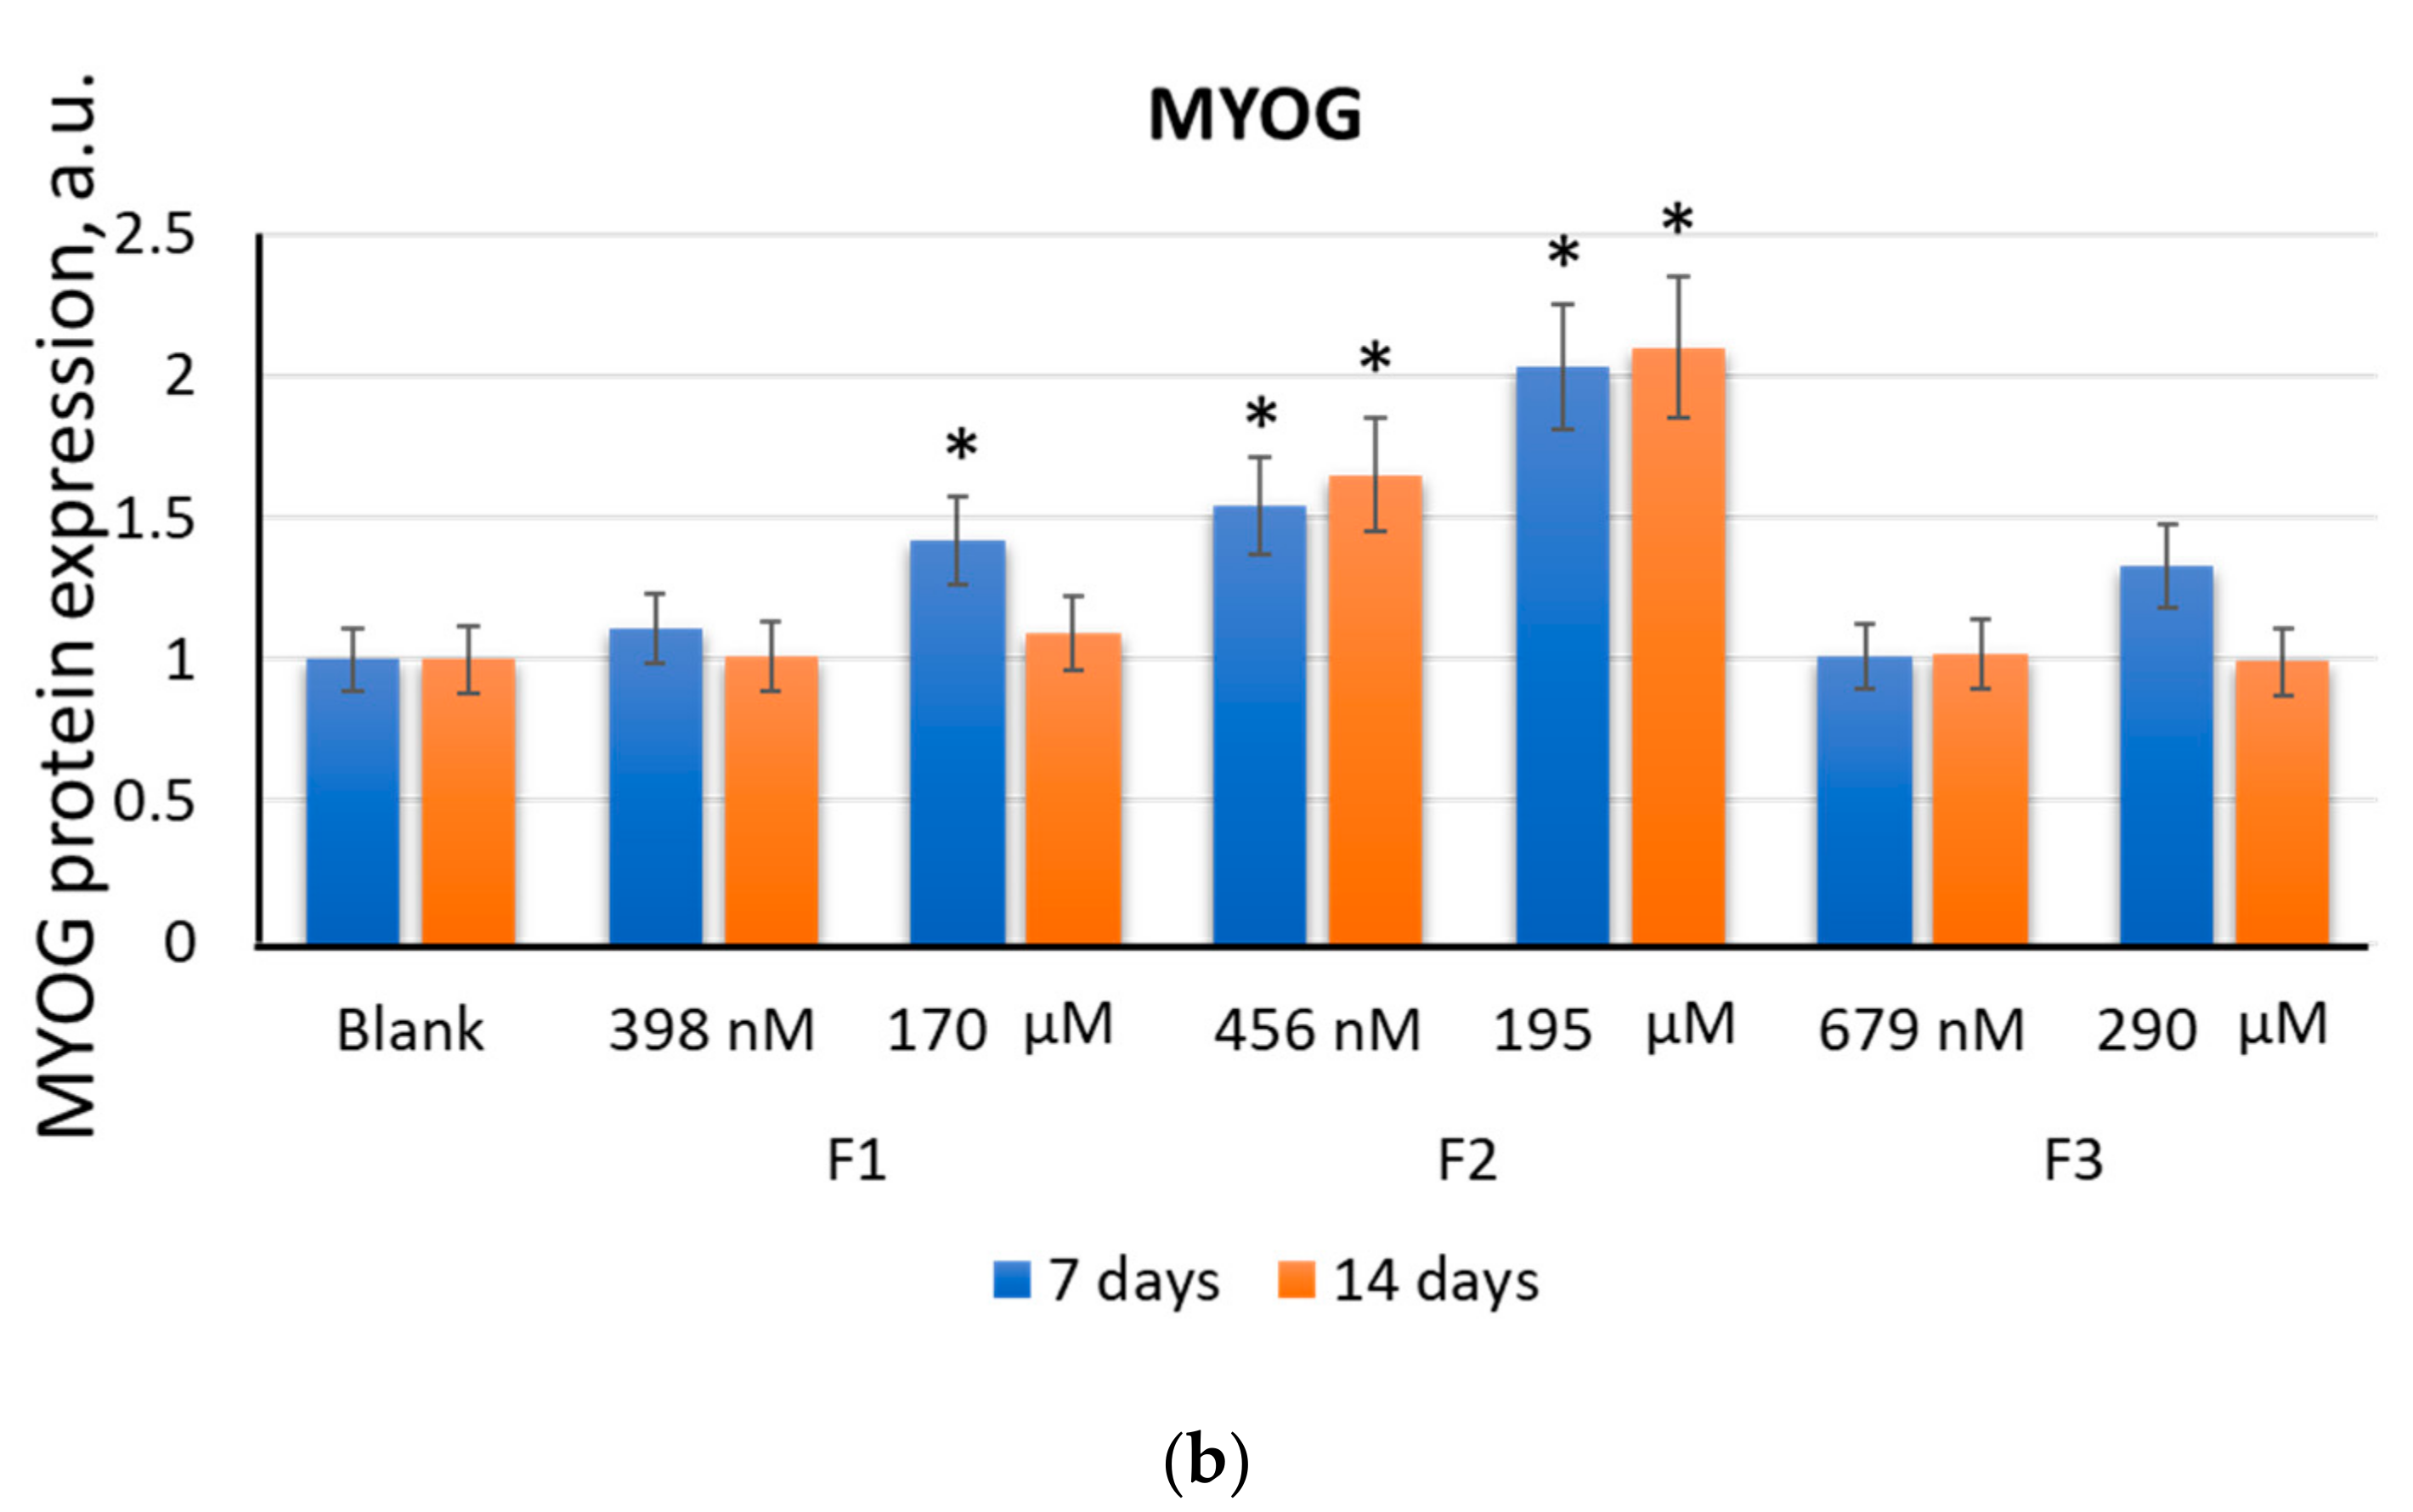
2.2.3. MYOG
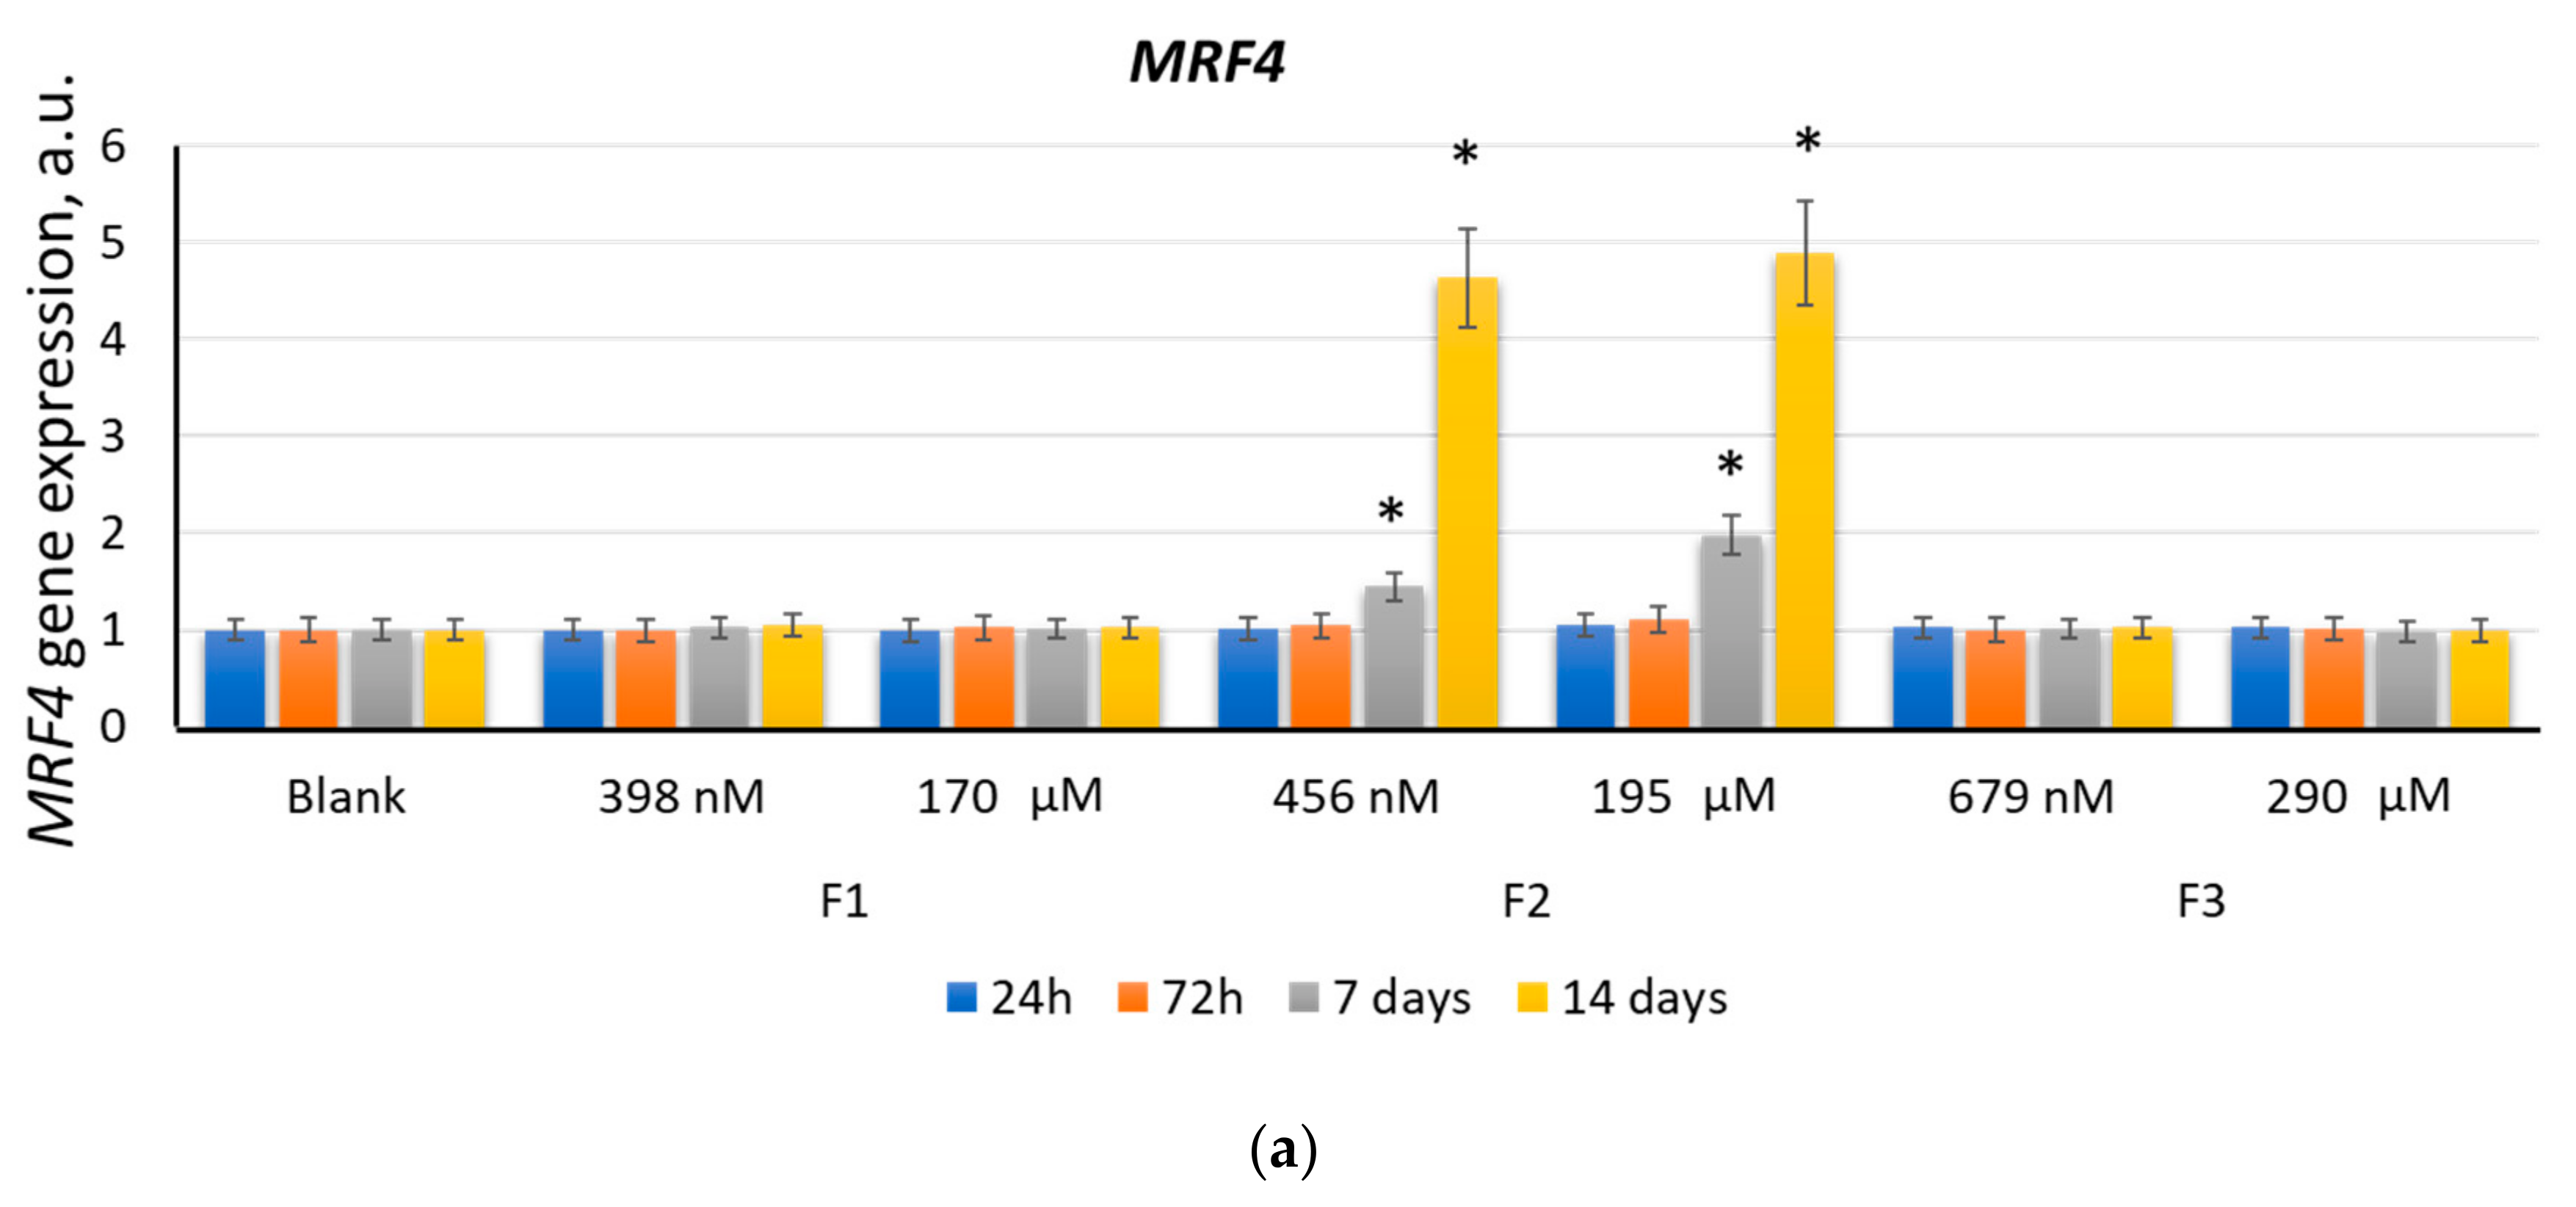
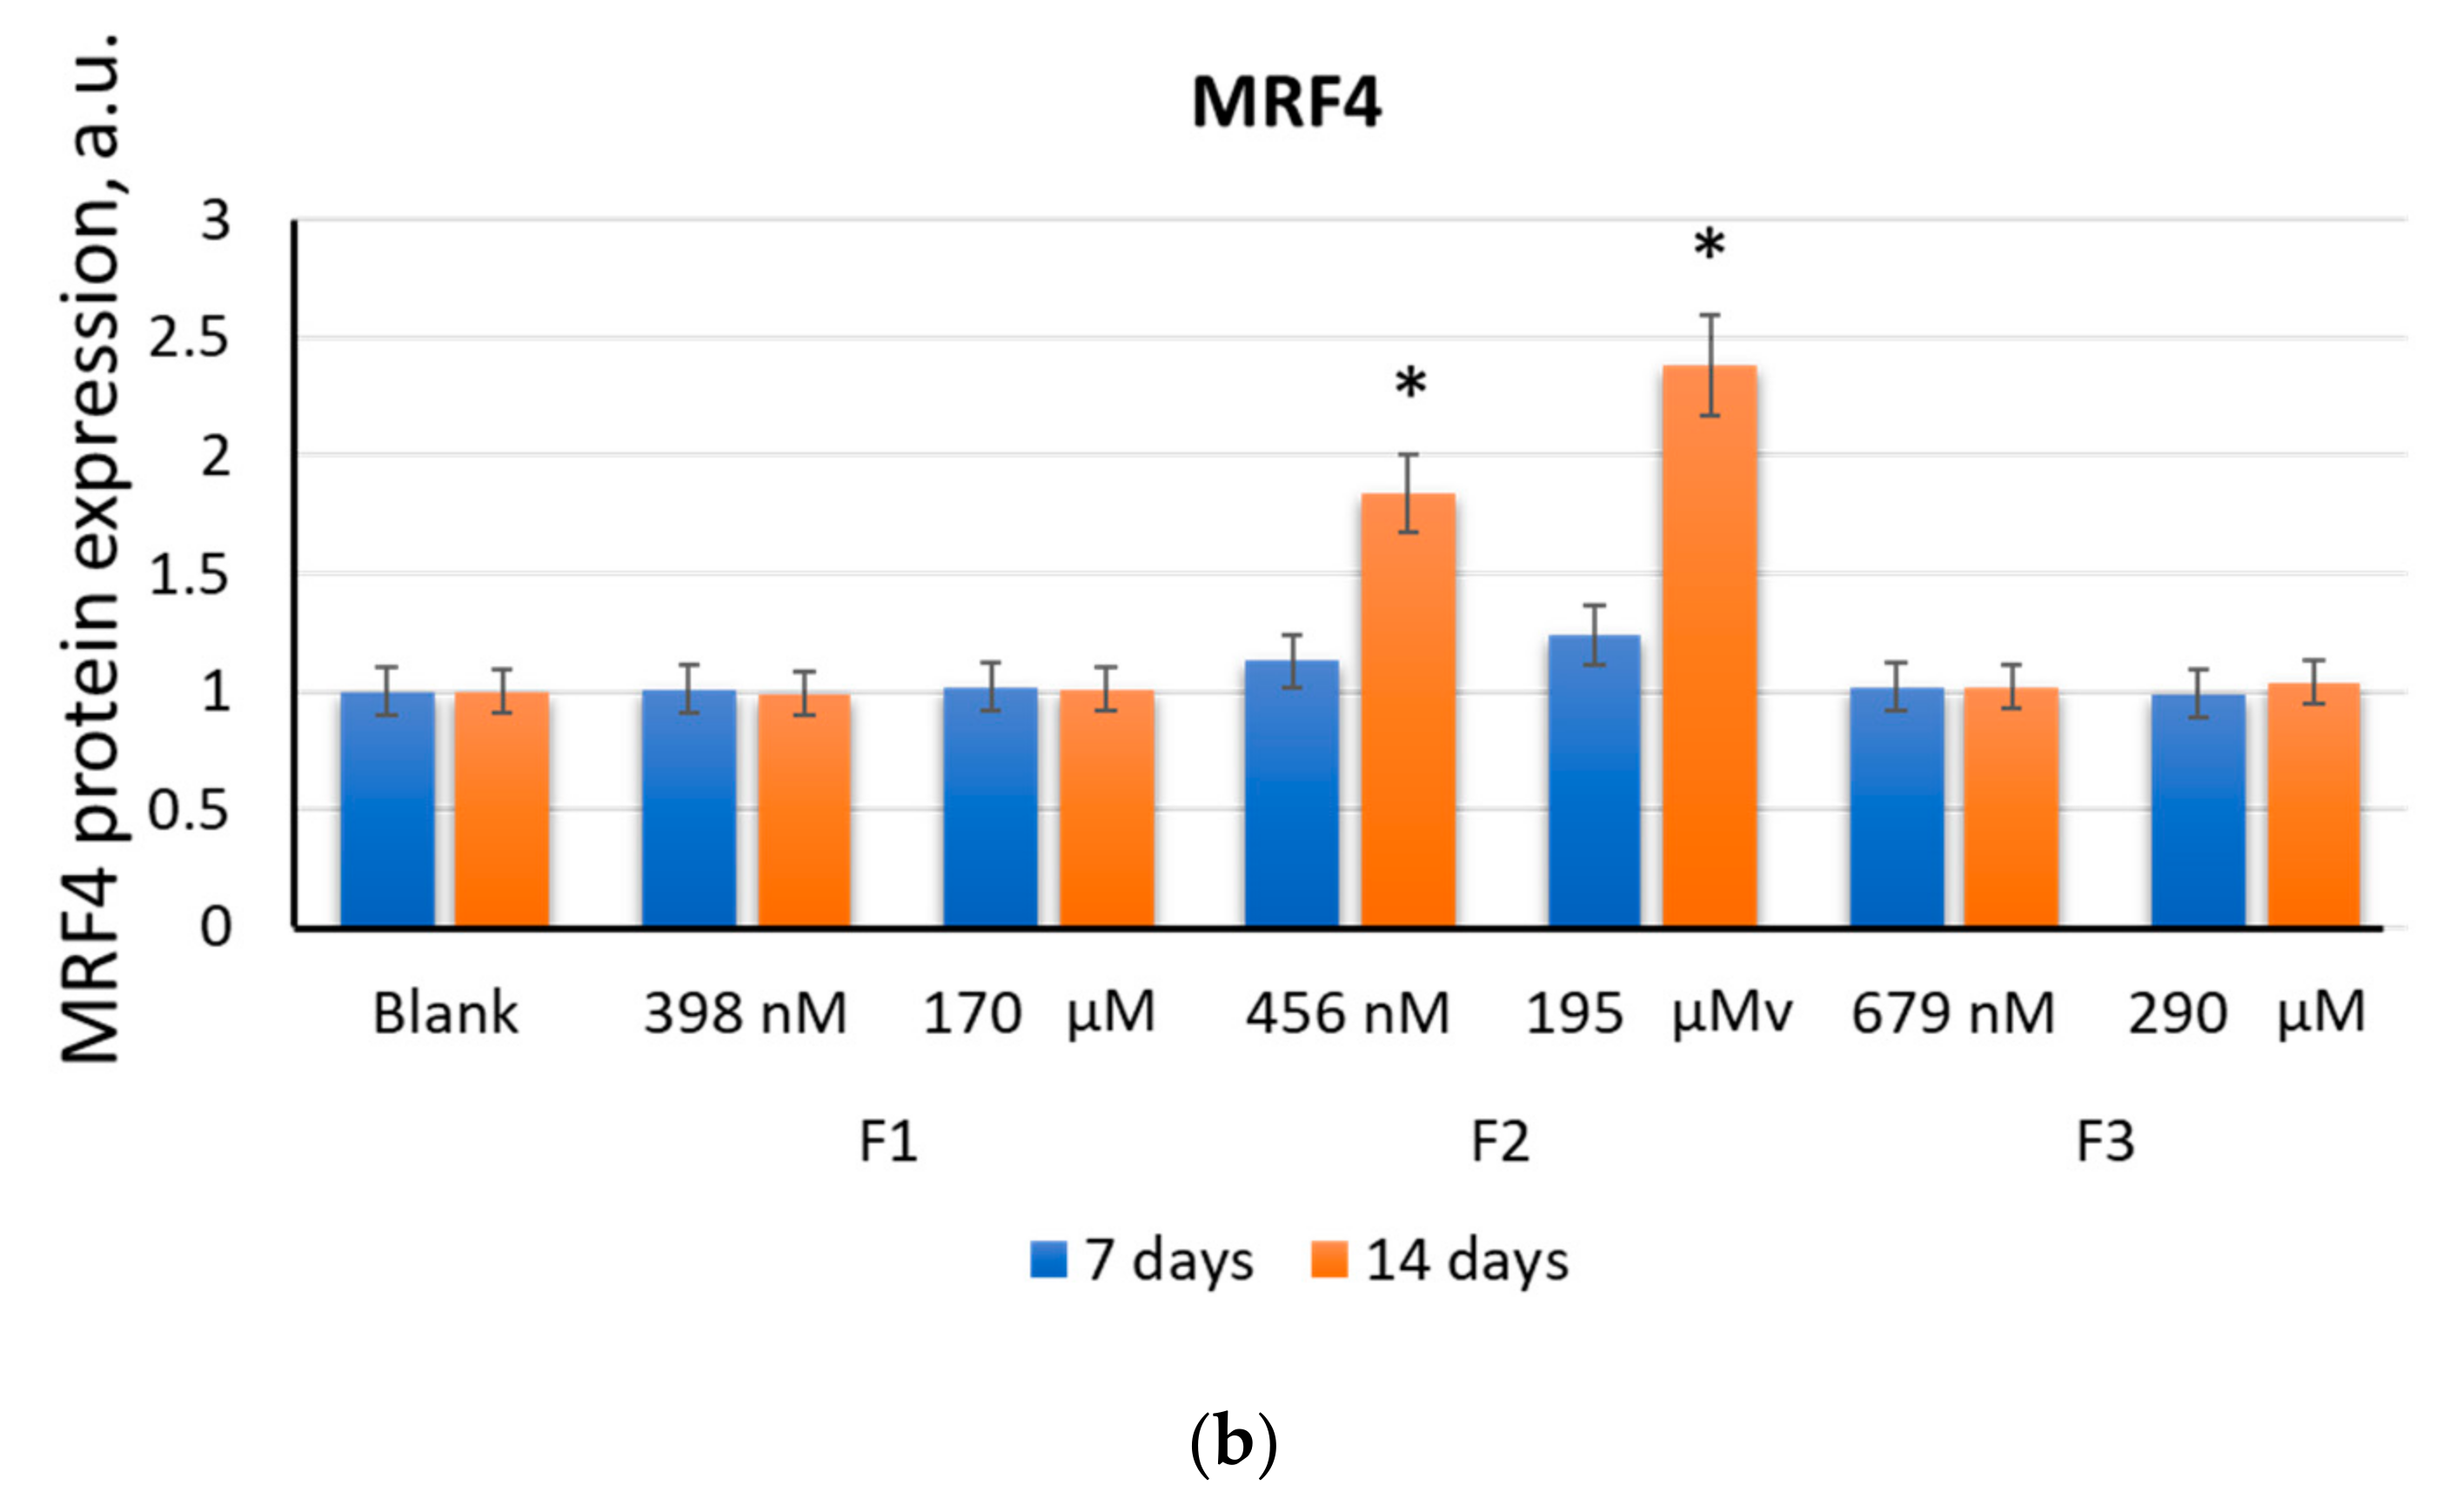
2.2.4. MRF4
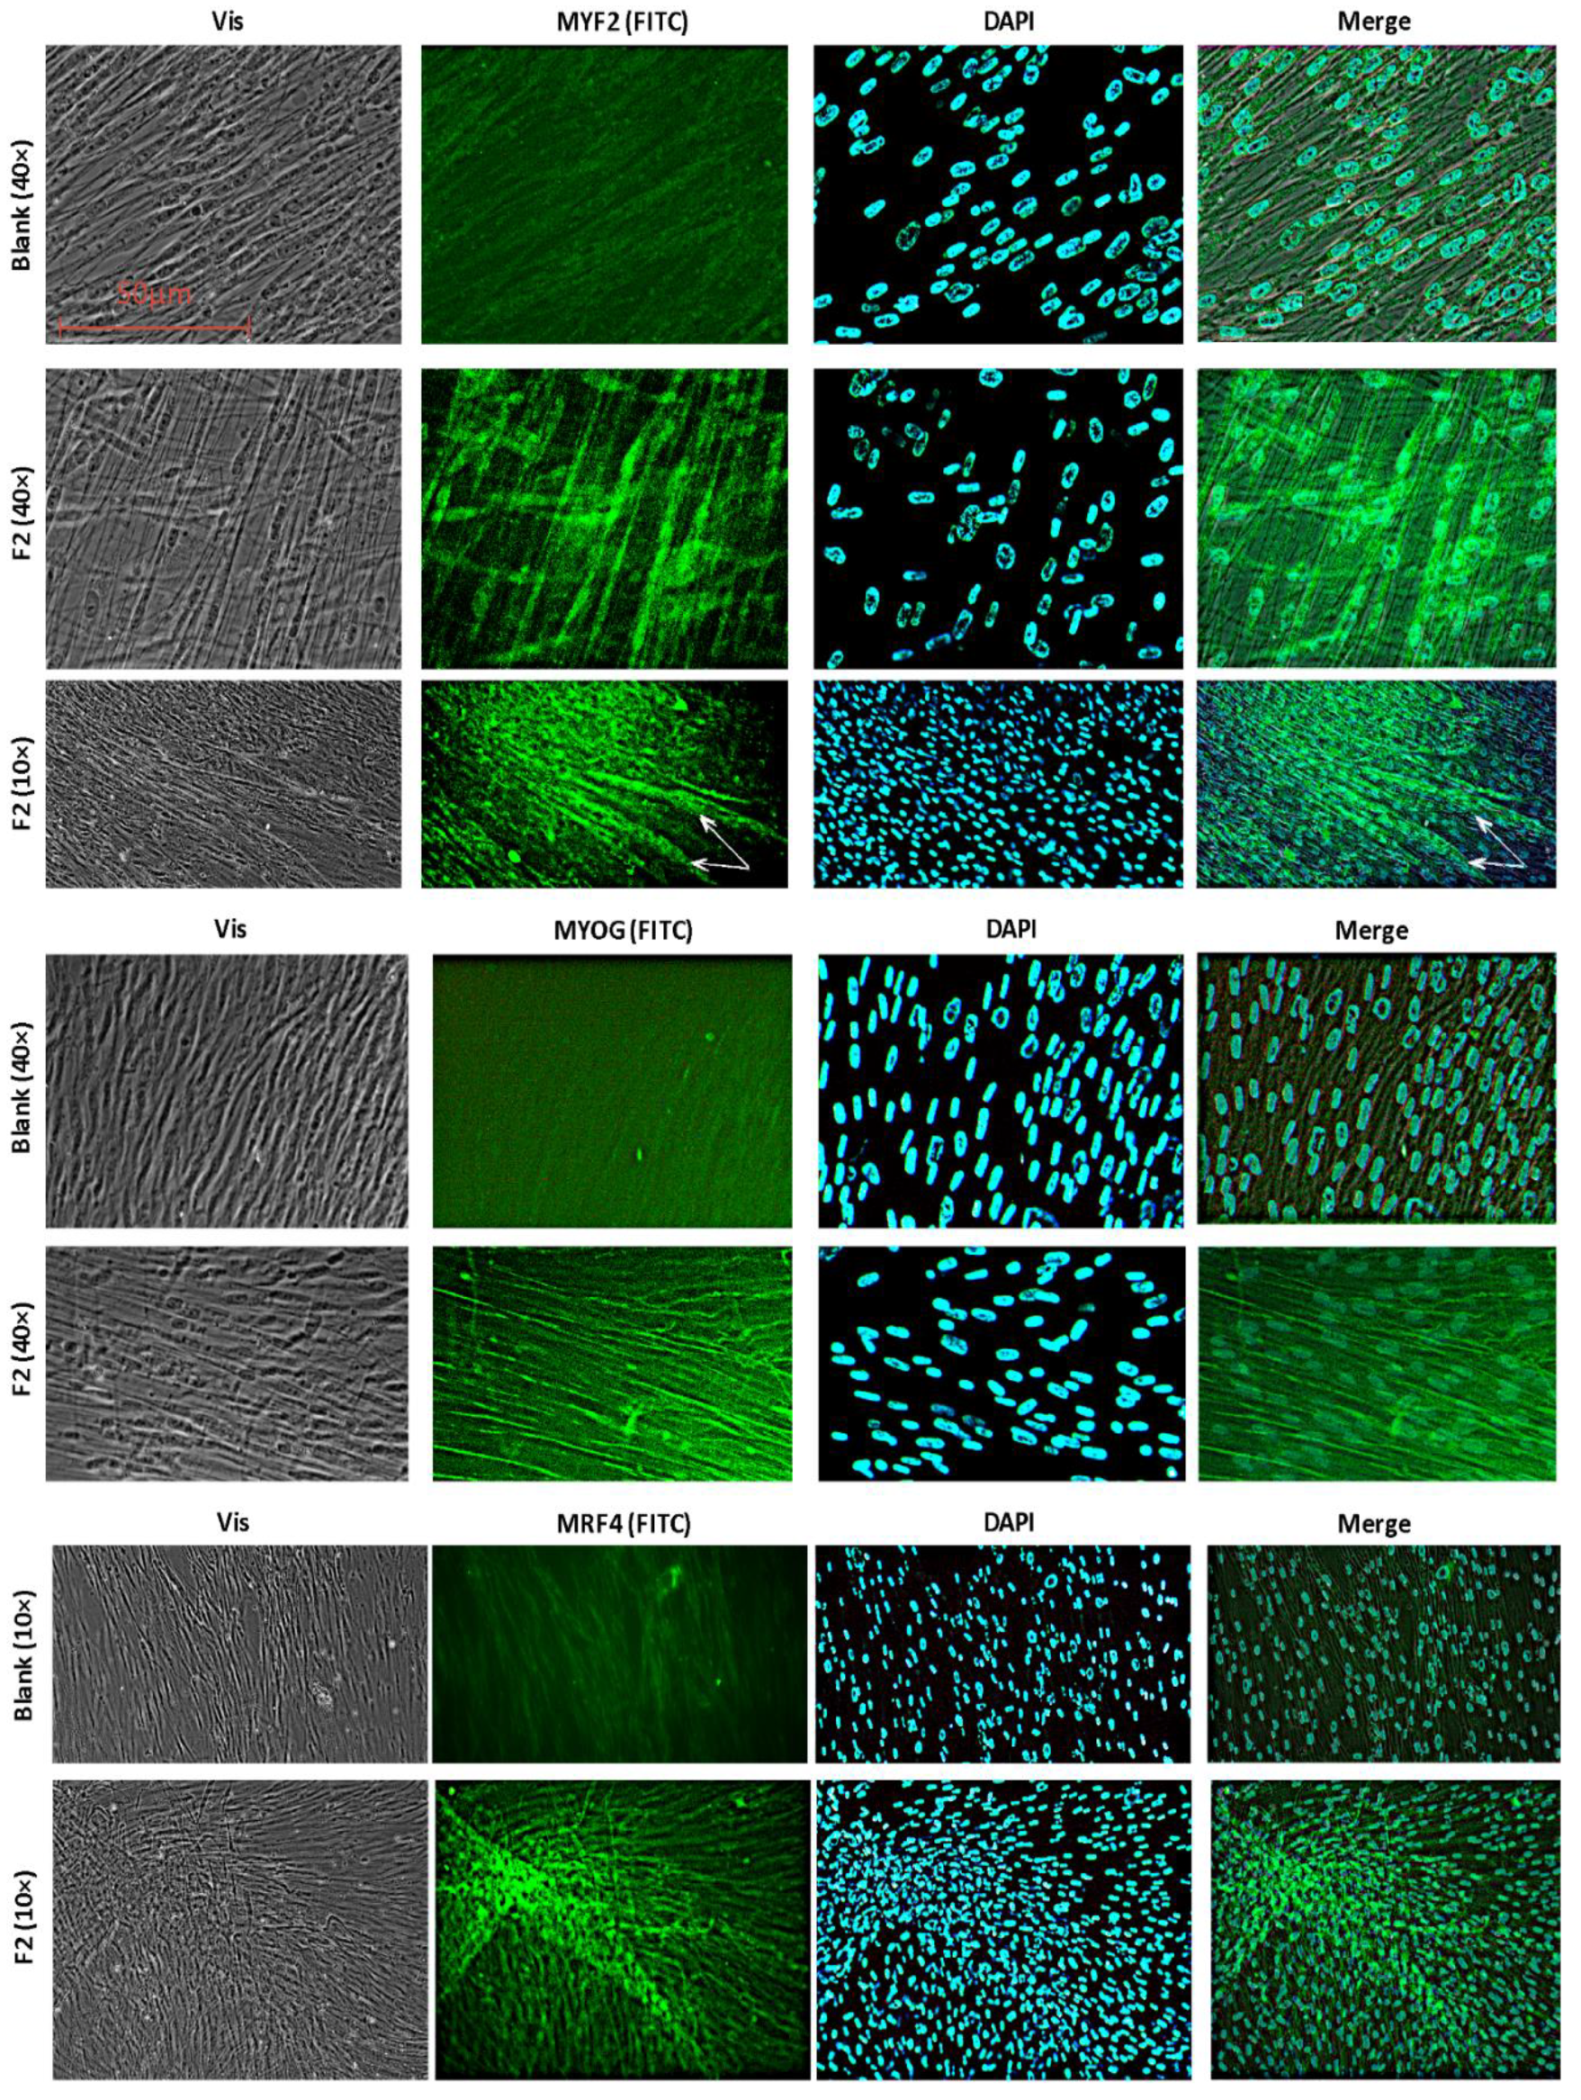
2.2.5. Immunohistochemical Staining
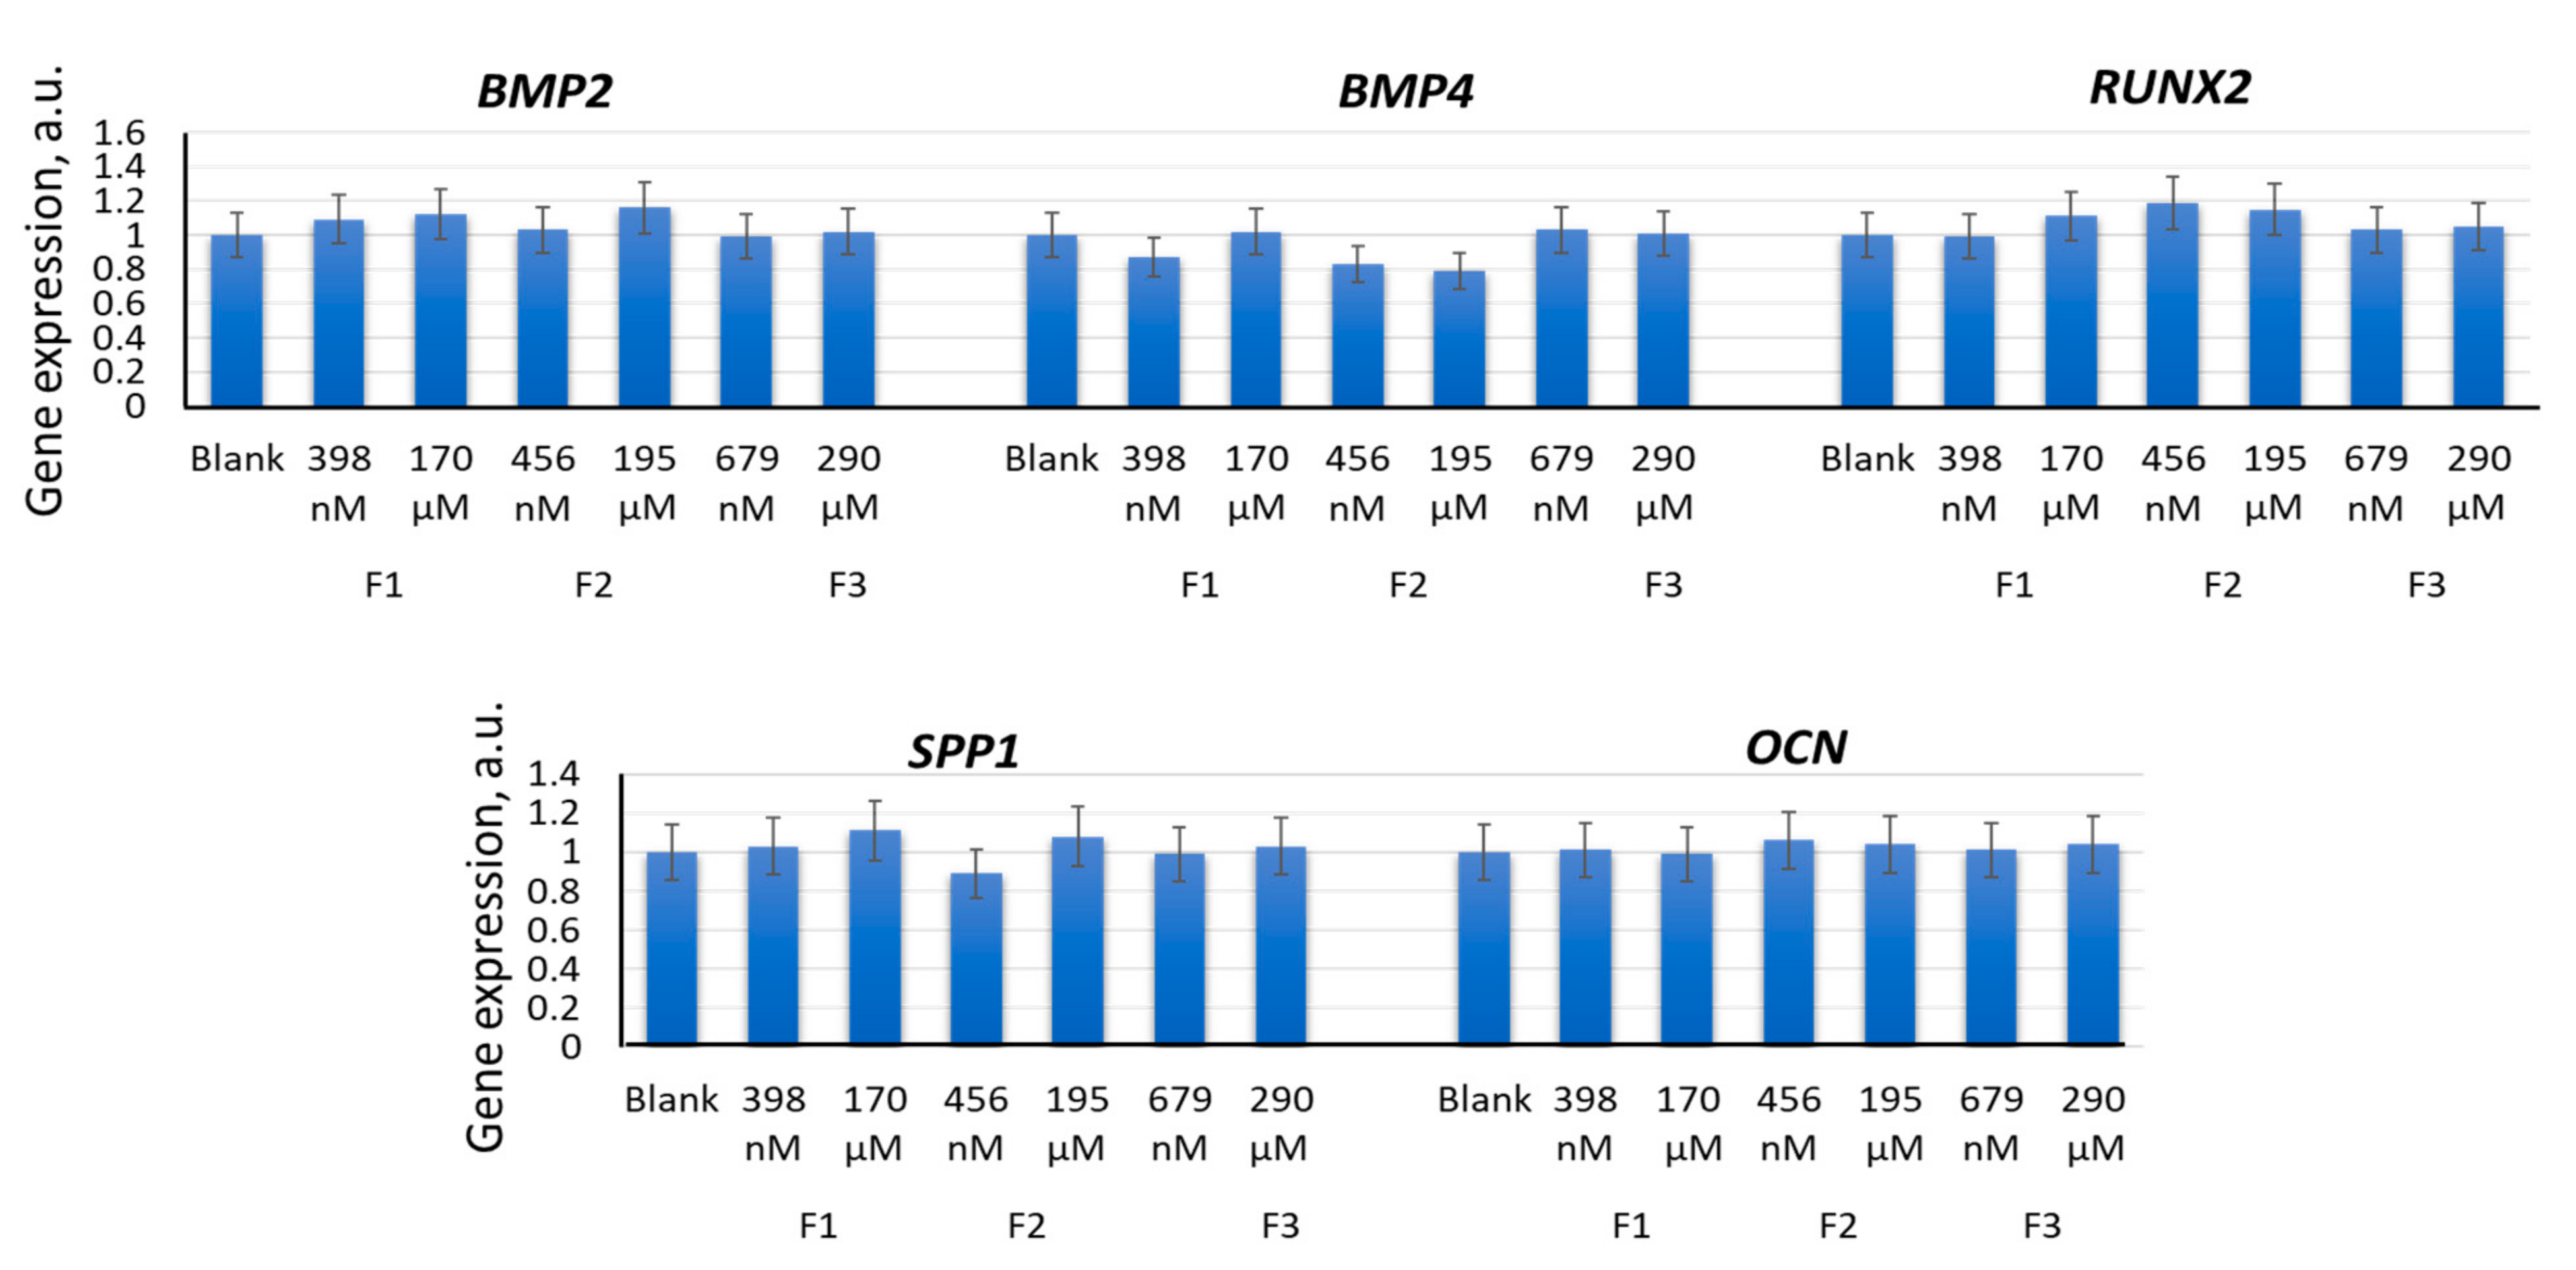
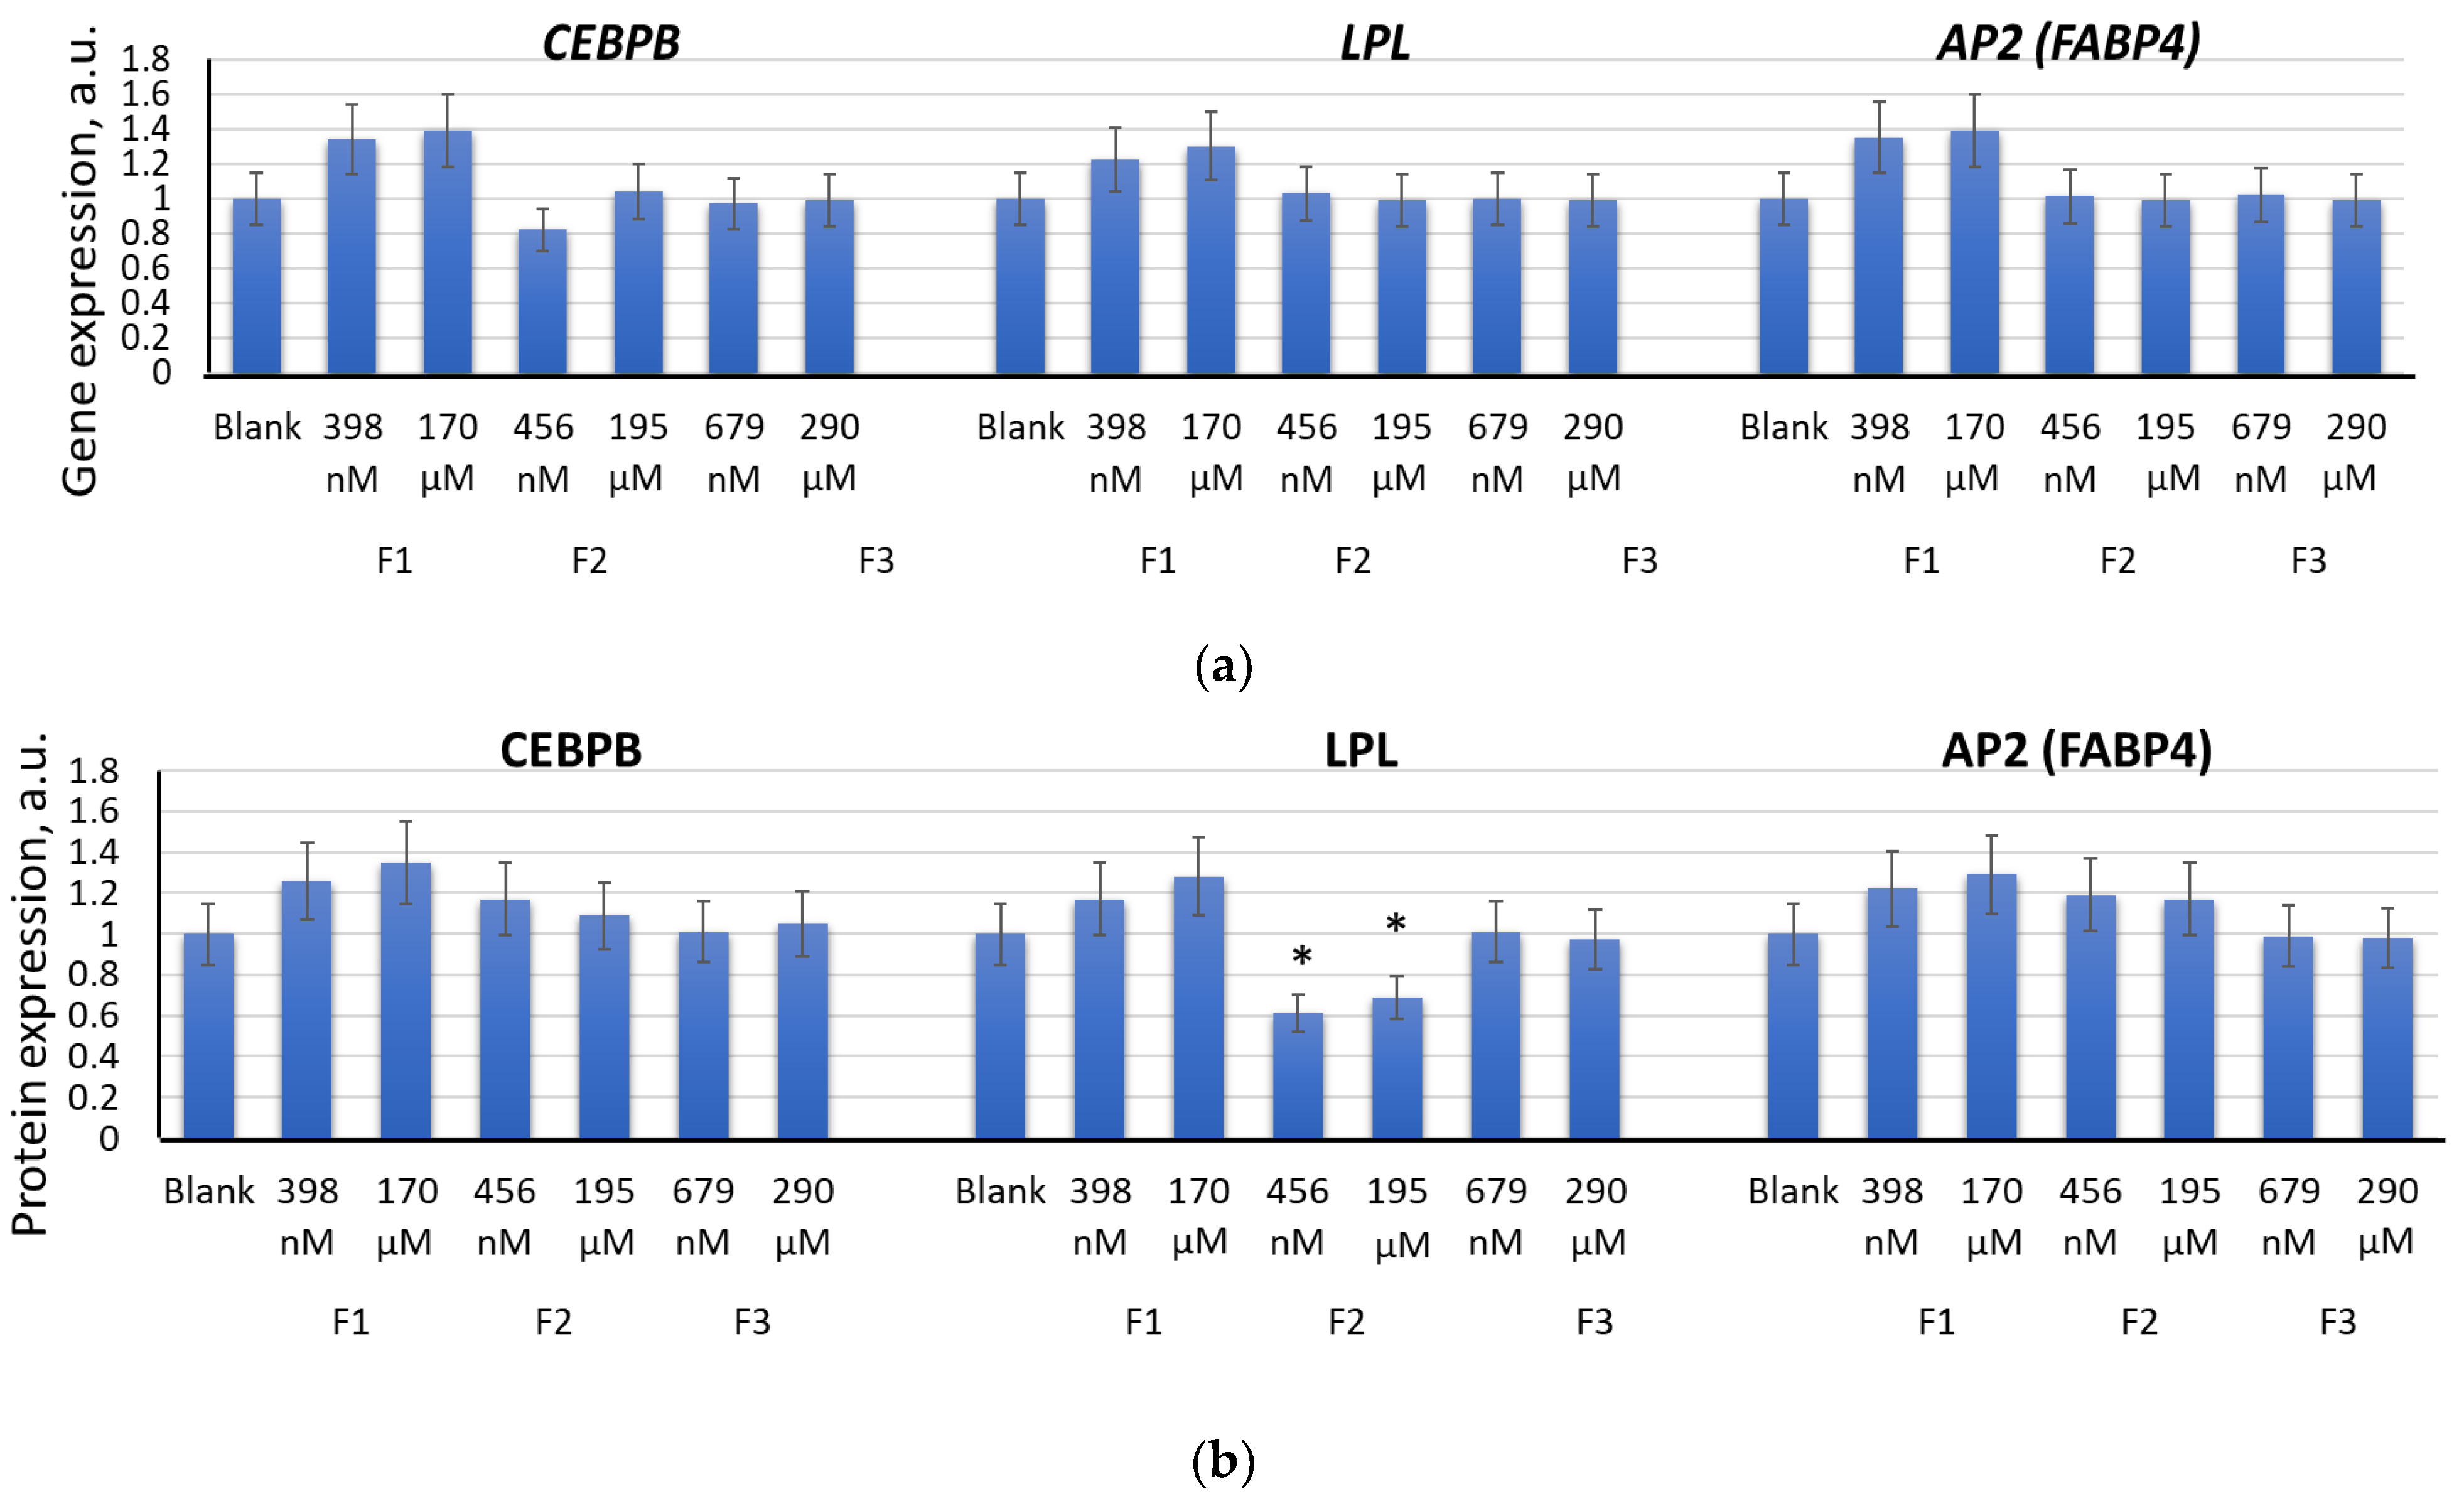
2.3. Effects of F1, F2, and F3 on the Expression of Genes of the Osteogenic and Adipogenic Differentiation
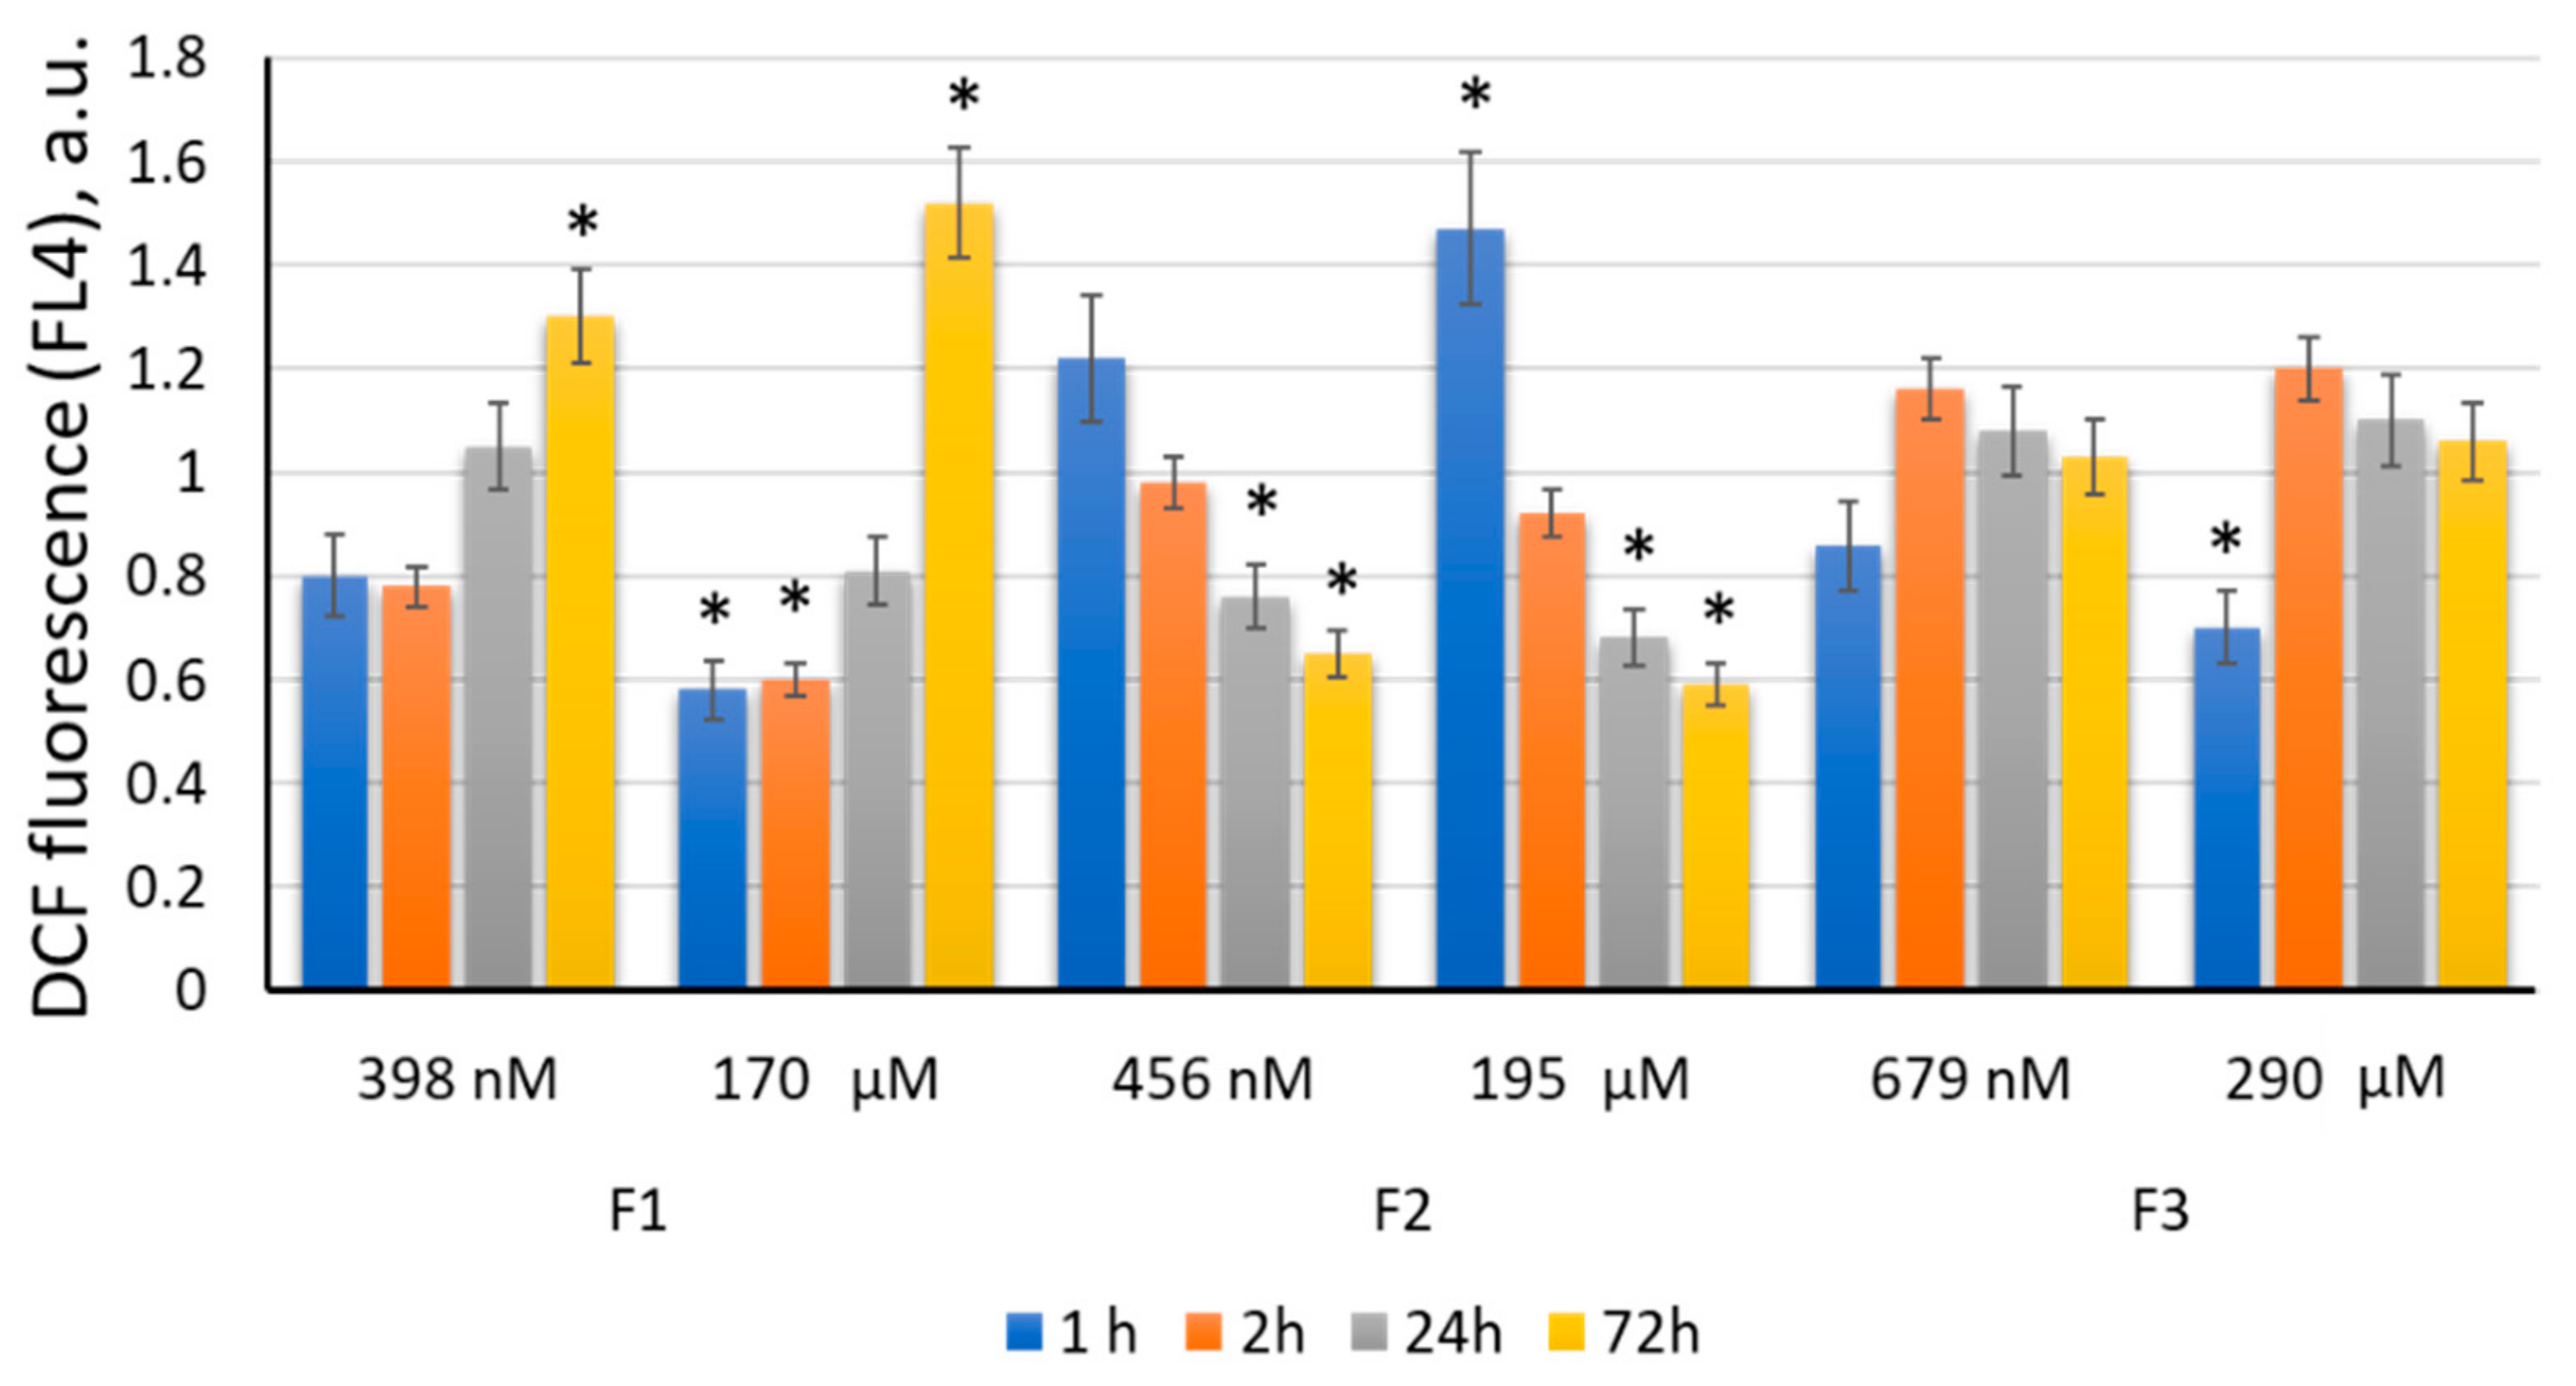
2.4. Effects of F1, F2, and F3 on Intracellular Reactive Oxygen Species in MSCs
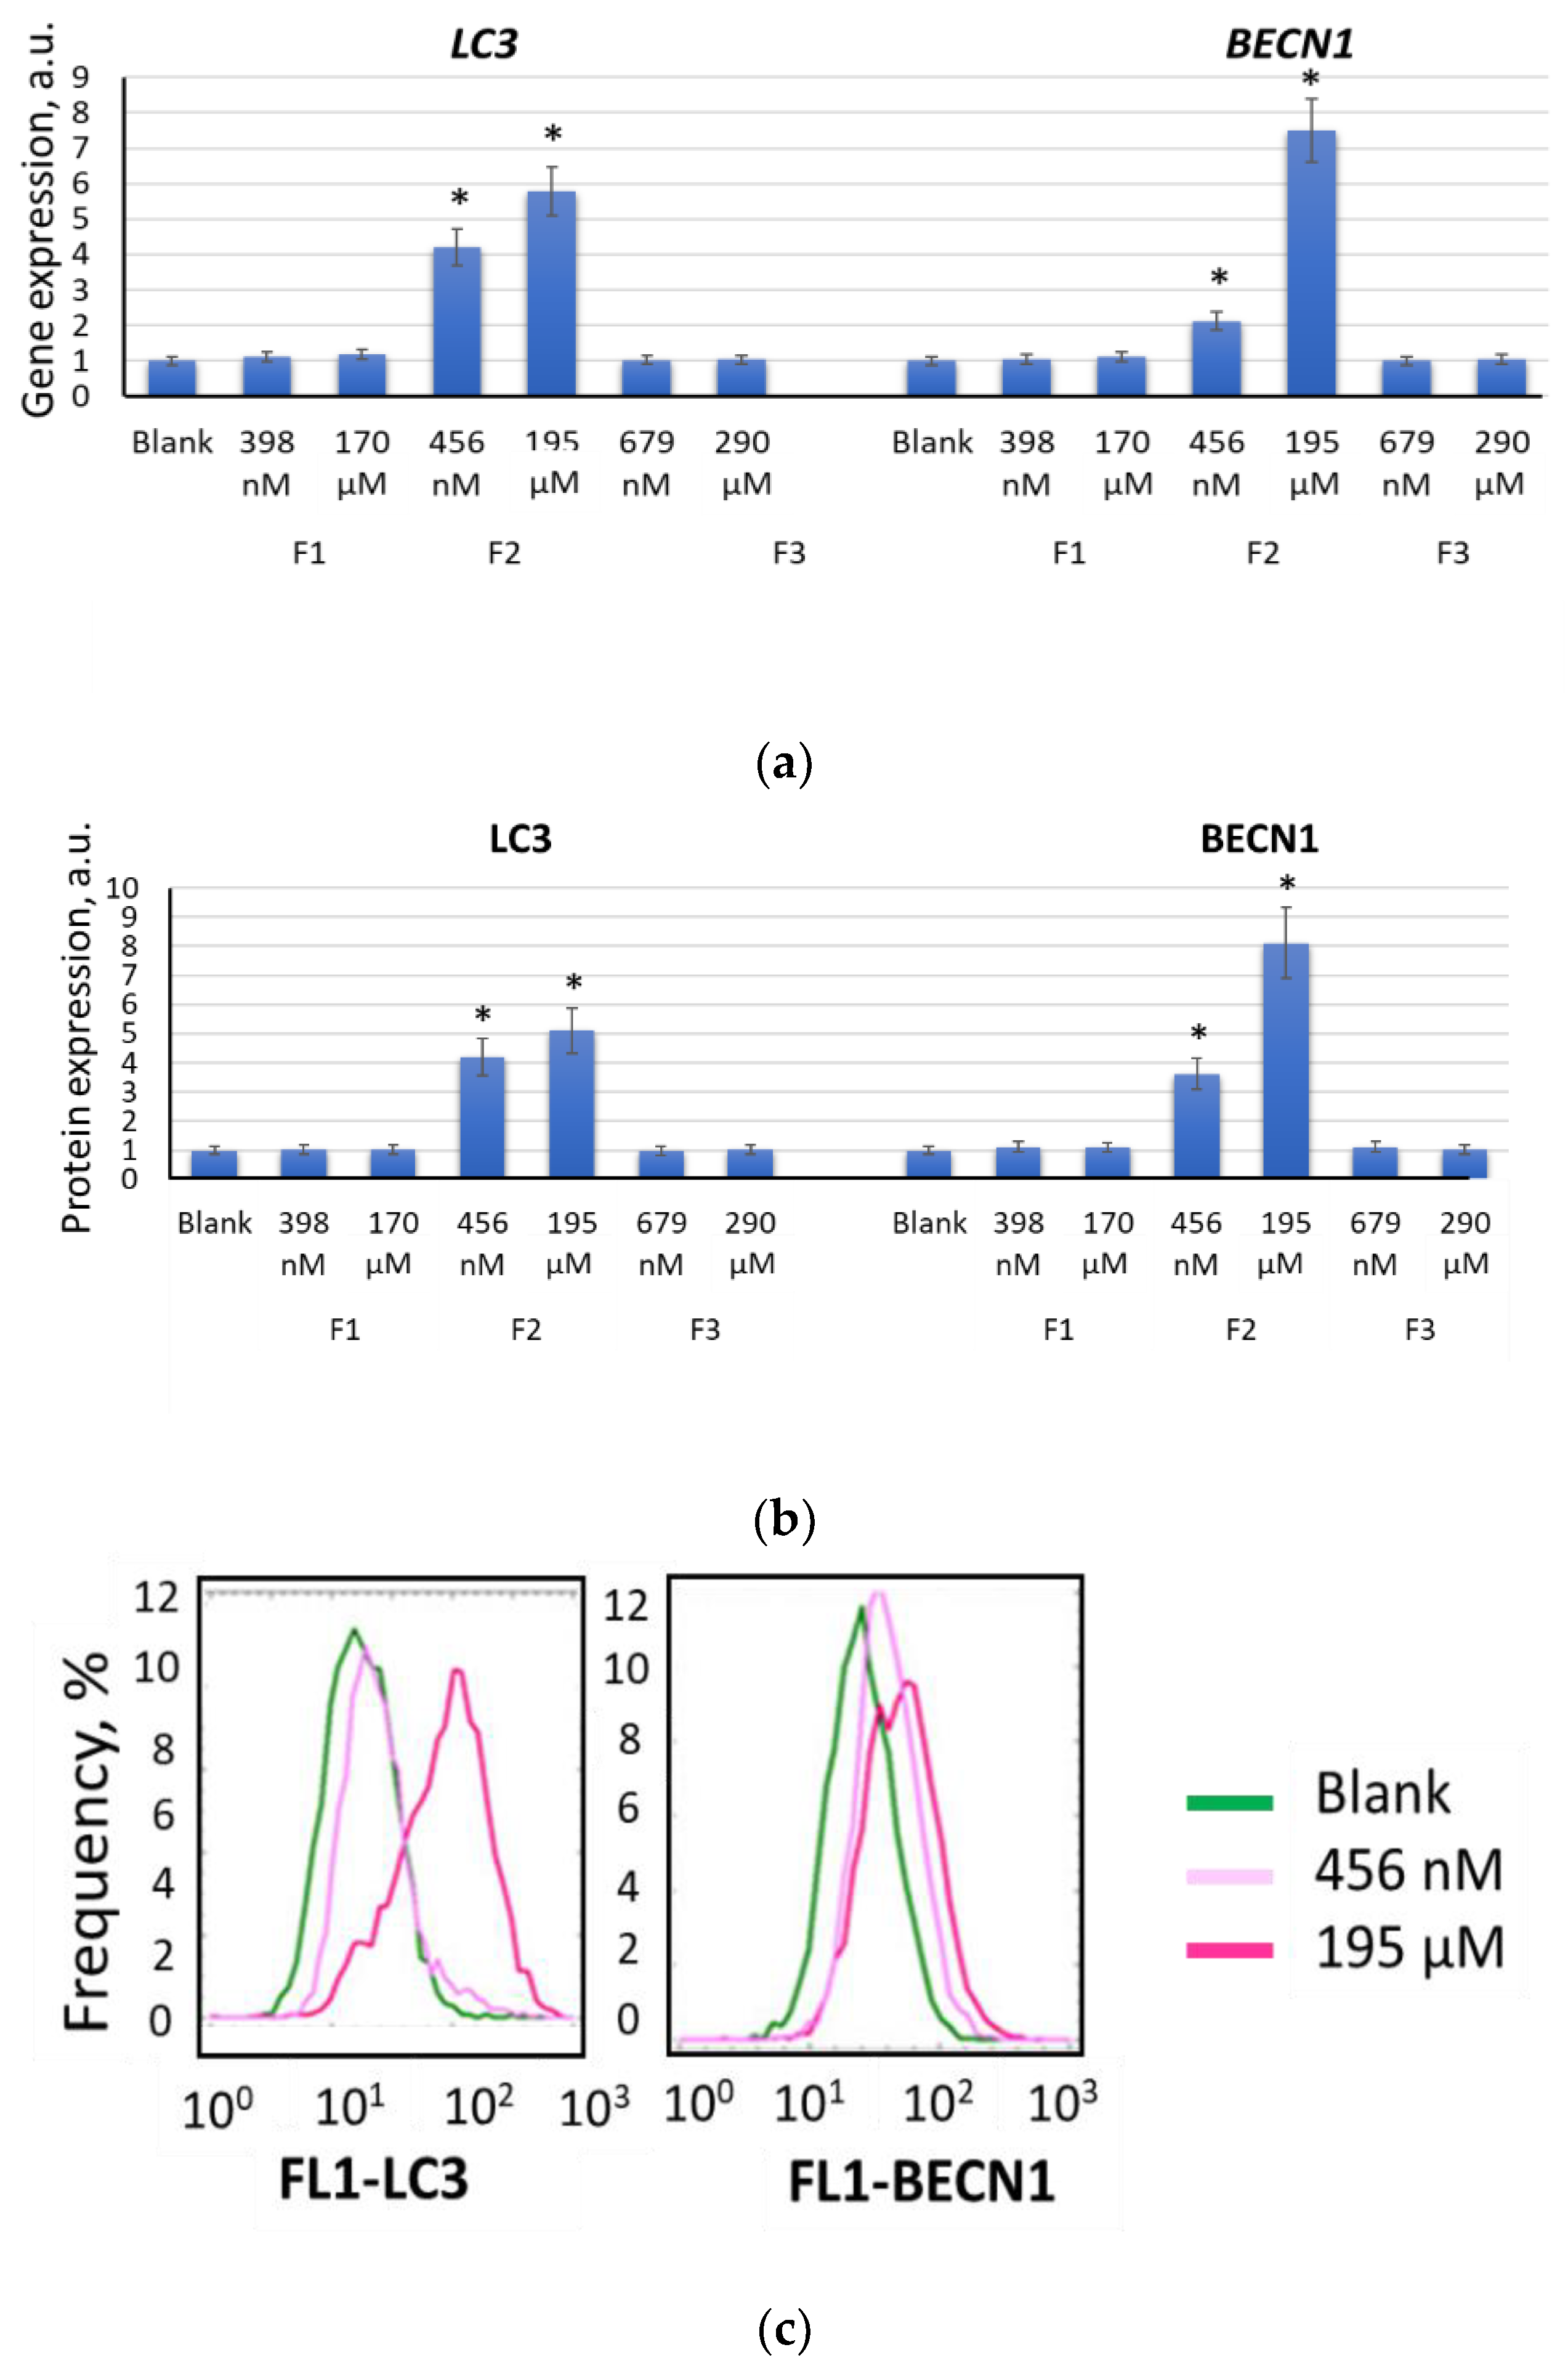
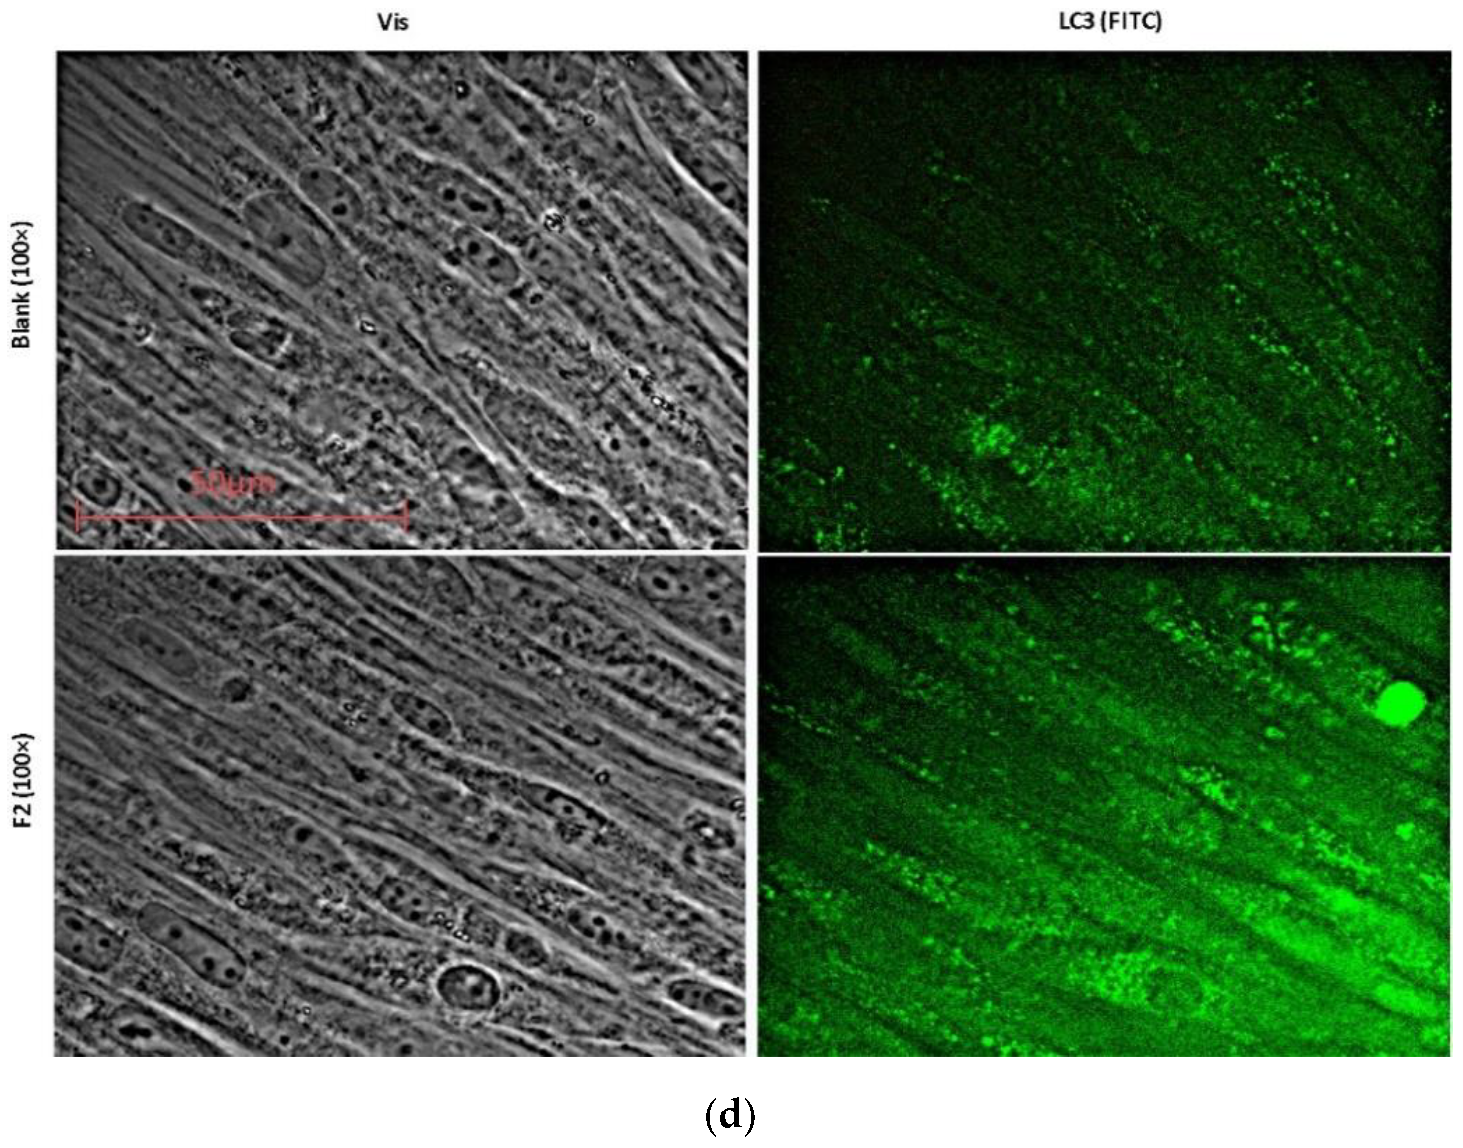
2.5. Autophagy Promotes Myogenic Differentiation of MSCs
3. Discussion
3.1. MSC-Based Therapy of Muscular Dystrophies
3.2. ROS and Differentiation of MSCs
3.3. ROS and Autophagy in MSCs
3.4. The Role of pH and Potassium
3.5. Autophagy and Differentiation in MSCs
3.6. Carbon Nanomaterials as Modulators of Differentiation in MSCs
4. Materials and Methods
4.1. Synthesis of Phosphonate Fullerene Derivatives
4.2. Adipose-Derived Mesenchymal Stem Cells
4.3. Culturing Cells with the Fullerenes
4.4. MTT Assay
4.5. Fluorescence Microscopy
4.6. Gene Expression by Real-Time PCR Assay
4.7. Flow Cytometry Assay
4.8. Statistics
5. Conclusions
Author Contributions
Funding
Institutional Review Board Statement
Informed Consent Statement
Data Availability Statement
Conflicts of Interest
Appendix A


| Differentiation Stimulus | MYF5 | MYOD | MYOG | MRF4 | ||||
|---|---|---|---|---|---|---|---|---|
| Gene | Protein | Gene | Protein | Gene | Protein | Gene | Protein | |
| F2 (456 nM) | 2.6 | 2.6 | 4.1 | 2.7 | 2.5 | 1.7 | 4.7 | 1.8 |
| F2 (195 µM) | 6.7 | 4.2 | 9.4 | 2.7 | 2.9 | 2.1 | 4.9 | 2.4 |
| Positive control | 1.2 | 1.1 | 3.9 | 2.6 | 4.1 | 3.1 | 5.1 | 2.7 |
References
- Ansari, S.; Chen, C.; Xu, X.; Annabi, N.; Zadeh, H.H.; Wu, B.M.; Khademhosseini, A.; Shi, S.; Moshaverinia, A. Muscle Tissue Engineering Using Gingival Mesenchymal Stem Cells Encapsulated in Alginate Hydrogels Containing Multiple Growth Factors. Ann. Biomed. Eng. 2016, 44, 1908–1920. [Google Scholar] [CrossRef] [PubMed] [Green Version]
- Sakuma, K. (Ed.) Muscular Dystrophies; IntechOpen: London, UK, 2019. [Google Scholar]
- Fortunato, F.; Rossi, R.; Falzarano, M.S.; Ferlini, A. Innovative Therapeutic Approaches for Duchenne Muscular Dystrophy. J. Clin. Med. 2021, 10, 820. [Google Scholar] [CrossRef] [PubMed]
- Schatzl, T.; Kaiser, L.; Deigner, H.P. Facioscapulohumeral muscular dystrophy: Genetics, gene activation and downstream signalling with regard to recent therapeutic approaches: An update. Orphanet J. Rare Dis. 2021, 16, 129. [Google Scholar] [CrossRef]
- Lemmers, R.J.; van der Vliet, P.J.; Klooster, R.; Sacconi, S.; Camano, P.; Dauwerse, J.G.; Snider, L.; Straasheijm, K.R.; van Ommen, G.J.; Padberg, G.W.; et al. A unifying genetic model for facioscapulohumeral muscular dystrophy. Science 2010, 329, 1650–1653. [Google Scholar] [CrossRef] [Green Version]
- Jain, A.; Al Khalili, Y. Congenital Myotonic Dystrophy; StatPearls Publishing: Treasure Island, FL, USA, 2021; Bookshelf ID: NBK557446. [Google Scholar]
- Wilschut, K.J.; Ling, V.B.; Bernstein, H.S. Concise review: Stem cell therapy for muscular dystrophies. Stem. Cells Transl. Med. 2012, 1, 833–842. [Google Scholar] [CrossRef]
- Le Blanc, K.; Ringden, O. Immunobiology of human mesenchymal stem cells and future use in hematopoietic stem cell transplantation. Biol. Blood Marrow Transplant. 2005, 11, 321–334. [Google Scholar] [CrossRef] [Green Version]
- Almalki, S.G.; Agrawal, D.K. Key transcription factors in the differentiation of mesenchymal stem cells. Differentiation 2016, 92, 41–51. [Google Scholar] [CrossRef] [Green Version]
- Ferri, P.; Barbieri, E.; Burattini, S.; Guescini, M.; D’Emilio, A.; Biagiotti, L.; Del Grande, P.; De Luca, A.; Stocchi, V.; Falcieri, E. Expression and subcellular localization of myogenic regulatory factors during the differentiation of skeletal muscle C2C12 myoblasts. J. Cell. Biochem. 2009, 108, 1302–1317. [Google Scholar] [CrossRef] [PubMed]
- Sabourin, L.A.; Rudnicki, M.A. The molecular regulation of myogenesis. Clin. Genet. 2000, 57, 16–25. [Google Scholar] [CrossRef]
- Zammit, P.S.; Heslop, L.; Hudon, V.; Rosenblatt, J.D.; Tajbakhsh, S.; Buckingham, M.E.; Beauchamp, J.R.; Partridge, T.A. Kinetics of myoblast proliferation show that resident satellite cells are competent to fully regenerate skeletal muscle fibers. Exp. Cell Res. 2002, 281, 39–49. [Google Scholar] [CrossRef]
- Bareja, A.; Holt, J.A.; Luo, G.; Chang, C.; Lin, J.; Hinken, A.C.; Freudenberg, J.M.; Kraus, W.E.; Evans, W.J.; Billin, A.N. Human and mouse skeletal muscle stem cells: Convergent and divergent mechanisms of myogenesis. PLoS ONE 2014, 9, e90398. [Google Scholar] [CrossRef] [PubMed] [Green Version]
- Singh, K.; Dilworth, F.J. Differential modulation of cell cycle progression distinguishes members of the myogenic regulatory factor family of transcription factors. FEBS J. 2013, 280, 3991–4003. [Google Scholar] [CrossRef]
- Crist, C.G.; Montarras, D.; Buckingham, M. Muscle satellite cells are primed for myogenesis but maintain quiescence with sequestration of Myf5 mRNA targeted by microRNA-31 in mRNP granules. Cell Stem Cell 2012, 11, 118–126. [Google Scholar] [CrossRef] [Green Version]
- Hernandez-Hernandez, J.M.; Garcia-Gonzalez, E.G.; Brun, C.E.; Rudnicki, M.A. The myogenic regulatory factors, determinants of muscle development, cell identity and regeneration. Semin. Cell Dev. Biol. 2017, 72, 10–18. [Google Scholar] [CrossRef]
- Hu, P.; Geles, K.G.; Paik, J.H.; DePinho, R.A.; Tjian, R. Codependent activators direct myoblast-specific MyoD transcription. Dev. Cell 2008, 15, 534–546. [Google Scholar] [CrossRef] [Green Version]
- Grifone, R.; Demignon, J.; Houbron, C.; Souil, E.; Niro, C.; Seller, M.J.; Hamard, G.; Maire, P. Six1 and Six4 homeoproteins are required for Pax3 and Mrf expression during myogenesis in the mouse embryo. Development 2005, 132, 2235–2249. [Google Scholar] [CrossRef] [Green Version]
- Deato, M.D.; Tjian, R. Switching of the core transcription machinery during myogenesis. Genes Dev. 2007, 21, 2137–2149. [Google Scholar] [CrossRef] [PubMed] [Green Version]
- Yao, J.; Tjian, R. Sub-nuclear compartmentalization of core promoter factors and target genes. Cell Cycle 2011, 10, 2405–2406. [Google Scholar] [CrossRef] [Green Version]
- Tapscott, S.J. The circuitry of a master switch: Myod and the regulation of skeletal muscle gene transcription. Development 2005, 132, 2685–2695. [Google Scholar] [CrossRef] [Green Version]
- Soleimani, V.D.; Yin, H.; Jahani-Asl, A.; Ming, H.; Kockx, C.E.; van Ijcken, W.F.; Grosveld, F.; Rudnicki, M.A. Snail regulates MyoD binding-site occupancy to direct enhancer switching and differentiation-specific transcription in myogenesis. Mol. Cell 2012, 47, 457–468. [Google Scholar] [CrossRef] [PubMed] [Green Version]
- Sabourin, L.A.; Girgis-Gabardo, A.; Seale, P.; Asakura, A.; Rudnicki, M.A. Reduced differentiation potential of primary MyoD-/- myogenic cells derived from adult skeletal muscle. J. Cell Biol. 1999, 144, 631–643. [Google Scholar] [CrossRef] [Green Version]
- Deato, M.D.; Marr, M.T.; Sottero, T.; Inouye, C.; Hu, P.; Tjian, R. MyoD targets TAF3/TRF3 to activate myogenin transcription. Mol. Cell 2008, 32, 96–105. [Google Scholar] [CrossRef] [Green Version]
- Liu, Q.C.; Zha, X.H.; Faralli, H.; Yin, H.; Louis-Jeune, C.; Perdiguero, E.; Pranckeviciene, E.; Munoz-Canoves, P.; Rudnicki, M.A.; Brand, M.; et al. Comparative expression profiling identifies differential roles for Myogenin and p38alpha MAPK signaling in myogenesis. J. Mol. Cell Biol 2012, 4, 386–397. [Google Scholar] [CrossRef] [Green Version]
- Dilworth, F.J.; Blais, A. Epigenetic regulation of satellite cell activation during muscle regeneration. Stem Cell Res. Ther. 2011, 2, 18. [Google Scholar] [CrossRef] [Green Version]
- Massenet, J.; Gardner, E.; Chazaud, B.; Dilworth, F.J. Epigenetic regulation of satellite cell fate during skeletal muscle regeneration. Skelet Muscle 2021, 11, 4. [Google Scholar] [CrossRef] [PubMed]
- Blais, A.; Tsikitis, M.; Acosta-Alvear, D.; Sharan, R.; Kluger, Y.; Dynlacht, B.D. An initial blueprint for myogenic differentiation. Genes Dev. 2005, 19, 553–569. [Google Scholar] [CrossRef] [Green Version]
- Hinterberger, T.J.; Sassoon, D.A.; Rhodes, S.J.; Konieczny, S.F. Expression of the muscle regulatory factor MRF4 during somite and skeletal myofiber development. Dev. Biol 1991, 147, 144–156. [Google Scholar] [CrossRef]
- Moretti, I.; Ciciliot, S.; Dyar, K.A.; Abraham, R.; Murgia, M.; Agatea, L.; Akimoto, T.; Bicciato, S.; Forcato, M.; Pierre, P.; et al. MRF4 negatively regulates adult skeletal muscle growth by repressing MEF2 activity. Nat. Commun. 2016, 7, 12397. [Google Scholar] [CrossRef]
- Delaney, K.; Kasprzycka, P.; Ciemerych, M.A.; Zimowska, M. The role of TGF-beta1 during skeletal muscle regeneration. Cell Biol. Int. 2017, 41, 706–715. [Google Scholar] [CrossRef] [Green Version]
- Jang, Y.N.; Baik, E.J. JAK-STAT pathway and myogenic differentiation. Jakstat 2013, 2, e23282. [Google Scholar] [CrossRef] [PubMed] [Green Version]
- Park, S.; Choi, Y.; Jung, N.; Kim, J.; Oh, S.; Yu, Y.; Ahn, J.H.; Jo, I.; Choi, B.O.; Jung, S.C. Autophagy induction in the skeletal myogenic differentiation of human tonsil-derived mesenchymal stem cells. Int J. Mol. Med. 2017, 39, 831–840. [Google Scholar] [CrossRef] [Green Version]
- Olson, E.N.; Klein, W.H. bHLH factors in muscle development: Dead lines and commitments, what to leave in and what to leave out. Genes Dev. 1994, 8, 1–8. [Google Scholar] [CrossRef] [PubMed] [Green Version]
- Hao, T.; Li, J.; Yao, F.; Dong, D.; Wang, Y.; Yang, B.; Wang, C. Injectable Fullerenol/Alginate Hydrogel for Suppression of Oxidative Stress Damage in Brown Adipose-Derived Stem Cells and Cardiac Repair. ACS Nano 2017, 11, 5474–5488. [Google Scholar] [CrossRef] [PubMed]
- Hao, T.; Zhou, J.; Lu, S.; Yang, B.; Wang, Y.; Fang, W.; Jiang, X.; Lin, Q.; Li, J.; Wang, C. Fullerene mediates proliferation and cardiomyogenic differentiation of adipose-derived stem cells via modulation of MAPK pathway and cardiac protein expression. Int. J. Nanomed. 2016, 11, 269–283. [Google Scholar] [CrossRef] [Green Version]
- Li, W.; Li, N.; Sui, B.; Yang, D. Anti-aging effect of fullerenol on skin aging through derived stem cells in a mouse model. Exp. Ther. Med. 2017, 14, 5045–5050. [Google Scholar] [CrossRef] [PubMed]
- Nie, X.; Tang, J.; Liu, Y.; Cai, R.; Miao, Q.; Zhao, Y.; Chen, C. Fullerenol inhibits the crosstalk between bone marrow-derived mesenchymal stem cells and tumor cells by regulating MAPK signaling. Nanomedicine 2017, 13, 1879–1890. [Google Scholar] [CrossRef] [PubMed]
- Kraevaya, O.A.; Novikov, A.V.; Shestakov, A.F.; Ershova, E.S.; Savinova, E.A.; Kameneva, L.V.; Veiko, N.N.; Schols, D.; Balzarini, J.; Kostyuk, S.V.; et al. Water-soluble fullerene-based nanostructures with promising antiviral and myogenic activity. Chem. Commun. 2020, 56, 10203–10206. [Google Scholar] [CrossRef] [PubMed]
- Ershova, E.S.; Sergeeva, V.A.; Tabakov, V.J.; Kameneva, L.A.; Porokhovnik, L.N.; Khakina, E.A.; Troshin, P.A.; Kutsev, S.I.; Veiko, N.N. Functionalized Fullerene Increases NF-kappaB Activity and Blocks Genotoxic Effect of Oxidative Stress in Serum-Starving Human Embryo Lung Diploid Fibroblasts. Oxid. Med. Cell. Longev. 2016, 2016, 9895245. [Google Scholar] [CrossRef] [Green Version]
- Ershova, E.S.; Sergeeva, V.A.; Chausheva, A.I.; Zheglo, D.G.; Nikitina, V.A.; Smirnova, T.D.; Kameneva, L.V.; Porokhovnik, L.N.; Kutsev, S.I.; Troshin, P.A.; et al. Toxic and DNA damaging effects of a functionalized fullerene in human embryonic lung fibroblasts. Mutat. Res. Genet. Toxicol. Environ. Mutagen. 2016, 805, 46–57. [Google Scholar] [CrossRef] [PubMed]
- Sergeeva, V.; Kraevaya, O.; Ershova, E.; Kameneva, L.; Malinovskaya, E.; Dolgikh, O.; Konkova, M.; Voronov, I.; Zhilenkov, A.; Veiko, N.; et al. Antioxidant Properties of Fullerene Derivatives Depend on Their Chemical Structure: A Study of Two Fullerene Derivatives on HELFs. Oxid. Med. Cell. Longev. 2019, 2019, 4398695. [Google Scholar] [CrossRef] [PubMed]
- Kitzmann, M.; Fernandez, A. Crosstalk between cell cycle regulators and the myogenic factor MyoD in skeletal myoblasts. Cell Mol. Life Sci. 2001, 58, 571–579. [Google Scholar] [CrossRef]
- Doucet, C.; Gutierrez, G.J.; Lindon, C.; Lorca, T.; Lledo, G.; Pinset, C.; Coux, O. Multiple phosphorylation events control mitotic degradation of the muscle transcription factor Myf5. BMC Biochem. 2005, 6, 27. [Google Scholar] [CrossRef] [Green Version]
- Brack, A.S.; Rando, T.A. Tissue-specific stem cells: Lessons from the skeletal muscle satellite cell. Cell Stem Cell 2012, 10, 504–514. [Google Scholar] [CrossRef] [PubMed] [Green Version]
- Tomczak, K.K.; Marinescu, V.D.; Ramoni, M.F.; Sanoudou, D.; Montanaro, F.; Han, M.; Kunkel, L.M.; Kohane, I.S.; Beggs, A.H. Expression profiling and identification of novel genes involved in myogenic differentiation. Faseb J. 2004, 18, 403–405. [Google Scholar] [CrossRef] [PubMed] [Green Version]
- Sun, L.; Trausch-Azar, J.S.; Ciechanover, A.; Schwartz, A.L. Ubiquitin-proteasome-mediated degradation, intracellular localization, and protein synthesis of MyoD and Id1 during muscle differentiation. J. Biol. Chem. 2005, 280, 26448–26456. [Google Scholar] [CrossRef] [Green Version]
- Batonnet, S.; Leibovitch, M.P.; Tintignac, L.; Leibovitch, S.A. Critical role for lysine 133 in the nuclear ubiquitin-mediated degradation of MyoD. J. Biol. Chem. 2004, 279, 5413–5420. [Google Scholar] [CrossRef] [PubMed] [Green Version]
- Figueroa, A.; Cuadrado, A.; Fan, J.; Atasoy, U.; Muscat, G.E.; Munoz-Canoves, P.; Gorospe, M.; Munoz, A. Role of HuR in skeletal myogenesis through coordinate regulation of muscle differentiation genes. Mol. Cell Biol. 2003, 23, 4991–5004. [Google Scholar] [CrossRef] [Green Version]
- Higashioka, K.; Koizumi, N.; Sakurai, H.; Sotozono, C.; Sato, T. Myogenic Differentiation from MYOGENIN-Mutated Human iPS Cells by CRISPR/Cas9. Stem Cells Int. 2017, 2017, 9210494. [Google Scholar] [CrossRef] [Green Version]
- Acharya, S.; Stark, T.D.; Oh, S.T.; Jeon, S.; Pak, S.C.; Kim, M.; Hur, J.; Matsutomo, T.; Hofmann, T.; Hill, R.A.; et al. (2R,3S,2’’R,3’’R)-Manniflavanone Protects Proliferating Skeletal Muscle Cells against Oxidative Stress and Stimulates Myotube Formation. J. Agric. Food Chem. 2017, 65, 3636–3646. [Google Scholar] [CrossRef]
- LeBel, C.P.; Ischiropoulos, H.; Bondy, S.C. Evaluation of the probe 2’,7’-dichlorofluorescin as an indicator of reactive oxygen species formation and oxidative stress. Chem. Res. Toxicol. 1992, 5, 227–231. [Google Scholar] [CrossRef] [Green Version]
- Royall, J.A.; Ischiropoulos, H. Evaluation of 2′,7′-dichlorofluorescin and dihydrorhodamine 123 as fluorescent probes for intracellular H2O2 in cultured endothelial cells. Arch. Biochem. Biophys. 1993, 302, 348–355. [Google Scholar] [CrossRef] [PubMed]
- Mizuno, H.; Hyakusoku, H. Mesengenic potential and future clinical perspective of human processed lipoaspirate cells. J. Nippon Med. Sch. 2003, 70, 300–306. [Google Scholar] [CrossRef] [PubMed] [Green Version]
- Gimble, J.; Guilak, F. Adipose-derived adult stem cells: Isolation, characterization, and differentiation potential. Cytotherapy 2003, 5, 362–369. [Google Scholar] [CrossRef] [PubMed]
- Zuk, P.A.; Zhu, M.; Mizuno, H.; Huang, J.; Futrell, J.W.; Katz, A.J.; Benhaim, P.; Lorenz, H.P.; Hedrick, M.H. Multilineage cells from human adipose tissue: Implications for cell-based therapies. Tissue Eng. 2001, 7, 211–228. [Google Scholar] [CrossRef] [Green Version]
- Zuk, P.A.; Zhu, M.; Ashjian, P.; De Ugarte, D.A.; Huang, J.I.; Mizuno, H.; Alfonso, Z.C.; Fraser, J.K.; Benhaim, P.; Hedrick, M.H. Human adipose tissue is a source of multipotent stem cells. Mol. Biol. Cell. 2002, 13, 4279–4295. [Google Scholar] [CrossRef] [PubMed]
- Jiang, W.; Xu, J. Immune modulation by mesenchymal stem cells. Cell Prolif 2020, 53, e12712. [Google Scholar] [CrossRef]
- Mundra, V.; Gerling, I.C.; Mahato, R.I. Mesenchymal stem cell-based therapy. Mol. Pharm. 2013, 10, 77–89. [Google Scholar] [CrossRef] [Green Version]
- Mansourabadi, A.H.; Mohamed Khosroshahi, L.; Noorbakhsh, F.; Amirzargar, A. Cell therapy in transplantation: A comprehensive review of the current applications of cell therapy in transplant patients with the focus on Tregs, CAR Tregs, and Mesenchymal stem cells. Int. Immunopharmacol. 2021, 97, 107669. [Google Scholar] [CrossRef]
- Choi, S.J.; Kim, J.K.; Hwang, S.D. Mesenchymal stem cell therapy for chronic renal failure. Expert Opin. Biol. Ther. 2010, 10, 1217–1226. [Google Scholar] [CrossRef]
- Johnson, L.D.V.; Pickard, M.R.; Johnson, W.E.B. The Comparative Effects of Mesenchymal Stem Cell Transplantation Therapy for Spinal Cord Injury in Humans and Animal Models: A Systematic Review and Meta-Analysis. Biology 2021, 10, 230. [Google Scholar] [CrossRef]
- Munir, H.; McGettrick, H.M. Mesenchymal Stem Cell Therapy for Autoimmune Disease: Risks and Rewards. Stem Cells Dev. 2015, 24, 2091–2100. [Google Scholar] [CrossRef]
- Yu, X.; Yu, L.; Guo, B.; Chen, R.; Qiu, C. A narrative review of research advances in mesenchymal stem cell therapy for asthma. Ann. Transl. Med. 2020, 8, 1461. [Google Scholar] [CrossRef] [PubMed]
- Sang, L.; Guo, X.; Shi, J.; Hou, S.; Fan, H.; Lv, Q. Characteristics and Developments in Mesenchymal Stem Cell Therapy for COVID-19: An Update. Stem Cells Int. 2021, 2021, 5593584. [Google Scholar] [CrossRef] [PubMed]
- Zhu, Y.; Ge, J.; Huang, C.; Liu, H.; Jiang, H. Application of mesenchymal stem cell therapy for aging frailty: From mechanisms to therapeutics. Theranostics 2021, 11, 5675–5685. [Google Scholar] [CrossRef] [PubMed]
- Eom, Y.W.; Kim, G.; Baik, S.K. Mesenchymal stem cell therapy for cirrhosis: Present and future perspectives. World J. Gastroenterol. 2015, 21, 10253–10261. [Google Scholar] [CrossRef] [PubMed] [Green Version]
- Eom, Y.W.; Shim, K.Y.; Baik, S.K. Mesenchymal stem cell therapy for liver fibrosis. Korean J. Intern. Med. 2015, 30, 580–589. [Google Scholar] [CrossRef]
- Hocking, A.M. Mesenchymal Stem Cell Therapy for Cutaneous Wounds. Adv. Wound Care 2012, 1, 166–171. [Google Scholar] [CrossRef] [PubMed] [Green Version]
- Fu, H.; Chen, Q. Mesenchymal stem cell therapy for heart failure: A meta-analysis. Herz 2020, 45, 557–563. [Google Scholar] [CrossRef] [PubMed]
- Toyoshima, A.; Yasuhara, T.; Date, I. Mesenchymal Stem Cell Therapy for Ischemic Stroke. Acta Med. Okayama 2017, 71, 263–268. [Google Scholar] [CrossRef]
- Norozi, F.; Ahmadzadeh, A.; Shahrabi, S.; Vosoughi, T.; Saki, N. Mesenchymal stem cells as a double-edged sword in suppression or progression of solid tumor cells. Tumour. Biol. 2016, 37, 11679–11689. [Google Scholar] [CrossRef]
- Ichim, T.E.; Alexandrescu, D.T.; Solano, F.; Lara, F.; Campion Rde, N.; Paris, E.; Woods, E.J.; Murphy, M.P.; Dasanu, C.A.; Patel, A.N.; et al. Mesenchymal stem cells as anti-inflammatories: Implications for treatment of Duchenne muscular dystrophy. Cell. Immunol. 2010, 260, 75–82. [Google Scholar] [CrossRef] [PubMed]
- Goncalves, M.A.; de Vries, A.A.; Holkers, M.; van de Watering, M.J.; van der Velde, I.; van Nierop, G.P.; Valerio, D.; Knaan-Shanzer, S. Human mesenchymal stem cells ectopically expressing full-length dystrophin can complement Duchenne muscular dystrophy myotubes by cell fusion. Hum. Mol. Genet. 2006, 15, 213–221. [Google Scholar] [CrossRef] [PubMed] [Green Version]
- Siemionow, M.; Szilagyi, E.; Cwykiel, J.; Domaszewska-Szostek, A.; Heydemann, A.; Garcia-Martinez, J.; Siemionow, K. Transplantation of Dystrophin Expressing Chimeric Human Cells of Myoblast/Mesenchymal Stem Cell Origin Improves Function in Duchenne Muscular Dystrophy Model. Stem Cells Dev. 2021, 30, 190–202. [Google Scholar] [CrossRef] [PubMed]
- Shabbir, A.; Zisa, D.; Leiker, M.; Johnston, C.; Lin, H.; Lee, T. Muscular dystrophy therapy by nonautologous mesenchymal stem cells: Muscle regeneration without immunosuppression and inflammation. Transplantation 2009, 87, 1275–1282. [Google Scholar] [CrossRef] [PubMed] [Green Version]
- Markert, C.D.; Atala, A.; Cann, J.K.; Christ, G.; Furth, M.; Ambrosio, F.; Childers, M.K. Mesenchymal stem cells: Emerging therapy for Duchenne muscular dystrophy. PM&R 2009, 1, 547–559. [Google Scholar] [CrossRef] [Green Version]
- Rajput, B.S.; Chakrabarti, S.K.; Dongare, V.S.; Ramirez, C.M.; Deb, K.D. Human Umbilical Cord Mesenchymal Stem Cells in the Treatment of Duchenne Muscular Dystrophy: Safety and Feasibility Study in India. J. Stem Cells 2015, 10, 141–156. [Google Scholar] [PubMed]
- Gomes, J.P.; Coatti, G.C.; Valadares, M.C.; Assoni, A.F.; Pelatti, M.V.; Secco, M.; Zatz, M. Human Adipose-Derived CD146(+) Stem Cells Increase Life Span of a Muscular Dystrophy Mouse Model More Efficiently than Mesenchymal Stromal Cells. DNA Cell Biol. 2018, 37, 798–804. [Google Scholar] [CrossRef]
- Bougle, A.; Rocheteau, P.; Briand, D.; Hardy, D.; Verdonk, F.; Tremolada, C.; Hivelin, M.; Chretien, F. Beneficial role of adipose-derived mesenchymal stem cells from microfragmented fat in a murine model of duchenne muscular dystrophy. Muscle Nerve 2019, 60, 328–335. [Google Scholar] [CrossRef]
- Atashi, F.; Modarressi, A.; Pepper, M.S. The role of reactive oxygen species in mesenchymal stem cell adipogenic and osteogenic differentiation: A review. Stem Cells Dev. 2015, 24, 1150–1163. [Google Scholar] [CrossRef] [PubMed] [Green Version]
- Wang, W.; Zhang, Y.; Lu, W.; Liu, K. Mitochondrial reactive oxygen species regulate adipocyte differentiation of mesenchymal stem cells in hematopoietic stress induced by arabinosylcytosine. PLoS ONE 2015, 10, e0120629. [Google Scholar] [CrossRef]
- Kim, J.H.; Kim, S.H.; Song, S.Y.; Kim, W.S.; Song, S.U.; Yi, T.; Jeon, M.S.; Chung, H.M.; Xia, Y.; Sung, J.H. Hypoxia induces adipocyte differentiation of adipose-derived stem cells by triggering reactive oxygen species generation. Cell Biol. Int. 2014, 38, 32–40. [Google Scholar] [CrossRef] [PubMed]
- Kanda, Y.; Hinata, T.; Kang, S.W.; Watanabe, Y. Reactive oxygen species mediate adipocyte differentiation in mesenchymal stem cells. Life Sci. 2011, 89, 250–258. [Google Scholar] [CrossRef] [PubMed]
- Zhou, T.; Yan, Y.; Zhao, C.; Xu, Y.; Wang, Q.; Xu, N. Resveratrol improves osteogenic differentiation of senescent bone mesenchymal stem cells through inhibiting endogenous reactive oxygen species production via AMPK activation. Redox Rep. 2019, 24, 62–69. [Google Scholar] [CrossRef] [PubMed] [Green Version]
- Chen, Y.; Azad, M.B.; Gibson, S.B. Superoxide is the major reactive oxygen species regulating autophagy. Cell Death Differ. 2009, 16, 1040–1052. [Google Scholar] [CrossRef] [Green Version]
- Ureshino, R.P.; Rocha, K.K.; Lopes, G.S.; Bincoletto, C.; Smaili, S.S. Calcium signaling alterations, oxidative stress, and autophagy in aging. Antioxid. Redox Signal. 2014, 21, 123–137. [Google Scholar] [CrossRef]
- Ghanta, S.; Tsoyi, K.; Liu, X.; Nakahira, K.; Ith, B.; Coronata, A.A.; Fredenburgh, L.E.; Englert, J.A.; Piantadosi, C.A.; Choi, A.M.; et al. Mesenchymal Stromal Cells Deficient in Autophagy Proteins Are Susceptible to Oxidative Injury and Mitochondrial Dysfunction. Am. J. Respir Cell Mol. Biol. 2017, 56, 300–309. [Google Scholar] [CrossRef]
- Li, L.; Tan, J.; Miao, Y.; Lei, P.; Zhang, Q. ROS and Autophagy: Interactions and Molecular Regulatory Mechanisms. Cell Mol. Neurobiol. 2015, 35, 615–621. [Google Scholar] [CrossRef] [PubMed]
- Song, C.; Song, C.; Tong, F. Autophagy induction is a survival response against oxidative stress in bone marrow-derived mesenchymal stromal cells. Cytotherapy 2014, 16, 1361–1370. [Google Scholar] [CrossRef]
- Hu, C.; Zhao, L.; Wu, D.; Li, L. Modulating autophagy in mesenchymal stem cells effectively protects against hypoxia- or ischemia-induced injury. Stem Cell Res. Ther. 2019, 10, 120. [Google Scholar] [CrossRef] [Green Version]
- Sbrana, F.V.; Cortini, M.; Avnet, S.; Perut, F.; Columbaro, M.; De Milito, A.; Baldini, N. The Role of Autophagy in the Maintenance of Stemness and Differentiation of Mesenchymal Stem Cells. Stem Cell Rev. Rep. 2016, 12, 621–633. [Google Scholar] [CrossRef]
- Suk, J.; Kwak, S.S.; Lee, J.H.; Choi, J.H.; Lee, S.H.; Lee, D.H.; Byun, B.; Lee, G.H.; Joe, C.O. Alkaline stress-induced autophagy is mediated by mTORC1 inactivation. J. Cell Biochem. 2011, 112, 2566–2573. [Google Scholar] [CrossRef] [PubMed]
- Lin, V.J.T.; Zolekar, A.; Shi, Y.; Koneru, B.; Dimitrijevich, S.; Di Pasqua, A.J.; Wang, Y.C. Potassium as a pluripotency-associated element identified through inorganic element profiling in human pluripotent stem cells. Sci. Rep. 2017, 7, 5005. [Google Scholar] [CrossRef] [PubMed] [Green Version]
- Pchelintseva, E.; Djamgoz, M.B.A. Mesenchymal stem cell differentiation: Control by calcium-activated potassium channels. J. Cell. Physiol. 2018, 233, 3755–3768. [Google Scholar] [CrossRef]
- Vigneault, P.; Naud, P.; Qi, X.; Xiao, J.; Villeneuve, L.; Davis, D.R.; Nattel, S. Calcium-dependent potassium channels control proliferation of cardiac progenitor cells and bone marrow-derived mesenchymal stem cells. J. Physiol. 2018, 596, 2359–2379. [Google Scholar] [CrossRef] [Green Version]
- Yang, M.; Zhao, Q.; Zhao, H.; Yang, A.; Wang, F.; Wang, X.; Tang, Y.; Huang, C. Adiposederived stem cells overexpressing SK4 calciumactivated potassium channel generate biological pacemakers. Int. J. Mol. Med. 2019, 44, 2103–2112. [Google Scholar] [CrossRef] [PubMed]
- Nuschke, A.; Rodrigues, M.; Stolz, D.B.; Chu, C.T.; Griffith, L.; Wells, A. Human mesenchymal stem cells/multipotent stromal cells consume accumulated autophagosomes early in differentiation. Stem Cell Res. Ther. 2014, 5, 140. [Google Scholar] [CrossRef] [PubMed] [Green Version]
- Disthabanchong, S.; Radinahamed, P.; Stitchantrakul, W.; Hongeng, S.; Rajatanavin, R. Chronic metabolic acidosis alters osteoblast differentiation from human mesenchymal stem cells. Kidney Int. 2007, 71, 201–209. [Google Scholar] [CrossRef] [Green Version]
- Isomoto, S.; Hattori, K.; Ohgushi, H.; Nakajima, H.; Tanaka, Y.; Takakura, Y. Rapamycin as an inhibitor of osteogenic differentiation in bone marrow-derived mesenchymal stem cells. J. Orthop. Sci. 2007, 12, 83–88. [Google Scholar] [CrossRef] [PubMed]
- Lee, K.W.; Yook, J.Y.; Son, M.Y.; Kim, M.J.; Koo, D.B.; Han, Y.M.; Cho, Y.S. Rapamycin promotes the osteoblastic differentiation of human embryonic stem cells by blocking the mTOR pathway and stimulating the BMP/Smad pathway. Stem Cells Dev. 2010, 19, 557–568. [Google Scholar] [CrossRef] [PubMed]
- Gupta, T.K.; Budarapu, P.R.; Chappidi, S.R.; Paggi, M.; Bordas, S.P. Advances in Carbon Based Nanomaterials for Bio-Medical Applications. Curr. Med. Chem. 2019, 26, 6851–6877. [Google Scholar] [CrossRef]
- Anilkumar, P.; Lu, F.; Cao, L.; Luo, P.G.; Liu, J.H.; Sahu, S.; Tackett, K.N.; Wang, Y.; Sun, Y.P. Fullerenes for applications in biology and medicine. Curr. Med. Chem. 2011, 18, 2045–2059. [Google Scholar] [CrossRef]
- Bakry, R.; Vallant, R.M.; Najam-ul-Haq, M.; Rainer, M.; Szabo, Z.; Huck, C.W.; Bonn, G.K. Medicinal applications of fullerenes. Int. J. Nanomed. 2007, 2, 639–649. [Google Scholar]
- Moussa, F. 5 - [60]Fullerene and derivatives for biomedical applications. In Nanobiomaterials; Narayan, R., Ed.; Woodhead Publishing: Sawston, Cambridge, UK, 2018; pp. 113–136. [Google Scholar]
- Castro, E.; Hernandez Garcia, A.; Zavala, G.; Echegoyen, L. Fullerenes in Biology and Medicine. J. Mater. Chem. B 2017, 5, 6523–6535. [Google Scholar] [CrossRef]
- Park, J.; Park, S.; Ryu, S.; Bhang, S.H.; Kim, J.; Yoon, J.K.; Park, Y.H.; Cho, S.P.; Lee, S.; Hong, B.H.; et al. Graphene-regulated cardiomyogenic differentiation process of mesenchymal stem cells by enhancing the expression of extracellular matrix proteins and cell signaling molecules. Adv. Healthc. Mater. 2014, 3, 176–181. [Google Scholar] [CrossRef] [PubMed]
- Mooney, E.; Mackle, J.N.; Blond, D.J.; O’Cearbhaill, E.; Shaw, G.; Blau, W.J.; Barry, F.P.; Barron, V.; Murphy, J.M. The electrical stimulation of carbon nanotubes to provide a cardiomimetic cue to MSCs. Biomaterials 2012, 33, 6132–6139. [Google Scholar] [CrossRef] [PubMed] [Green Version]
- Li, X.; Zhou, J.; Liu, Z.; Chen, J.; Lu, S.; Sun, H.; Li, J.; Lin, Q.; Yang, B.; Duan, C.; et al. A PNIPAAm-based thermosensitive hydrogel containing SWCNTs for stem cell transplantation in myocardial repair. Biomaterials 2014, 35, 5679–5688. [Google Scholar] [CrossRef] [PubMed]
- Yang, X.; Li, C.J.; Wan, Y.; Smith, P.; Shang, G.; Cui, Q. Antioxidative fullerol promotes osteogenesis of human adipose-derived stem cells. Int. J. Nanomed. 2014, 9, 4023–4031. [Google Scholar] [CrossRef] [PubMed] [Green Version]
- Yurkova, A.A.; Khakina, E.A.; Troyanov, S.I.; Chernyak, A.; Shmygleva, L.; Peregudov, A.S.; Martynenko, V.M.; Dobrovolskiy, Y.A.; Troshin, P.A. Arbuzov chemistry with chlorofullerene C60Cl6: A powerful method for selective synthesis of highly functionalized [60]fullerene derivatives. Chem. Commun. 2012, 48, 8916–8918. [Google Scholar] [CrossRef] [PubMed]
- Sergeeva, V.A.; Ershova, E.S.; Veiko, N.N.; Malinovskaya, E.M.; Kalyanov, A.A.; Kameneva, L.V.; Stukalov, S.V.; Dolgikh, O.A.; Konkova, M.S.; Ermakov, A.V.; et al. Low-Dose Ionizing Radiation Affects Mesenchymal Stem Cells via Extracellular Oxidized Cell-Free DNA: A Possible Mediator of Bystander Effect and Adaptive Response. Oxid. Med. Cell. Longev. 2017, 2017, 9515809. [Google Scholar] [CrossRef] [Green Version]
- Dominici, M.; Le Blanc, K.; Mueller, I.; Slaper-Cortenbach, I.; Marini, F.; Krause, D.; Deans, R.; Keating, A.; Prockop, D.; Horwitz, E. Minimal criteria for defining multipotent mesenchymal stromal cells. The International Society for Cellular Therapy position statement. Cytotherapy 2006, 8, 315–317. [Google Scholar] [CrossRef]


| F1 | F2 | F3 | |
|---|---|---|---|
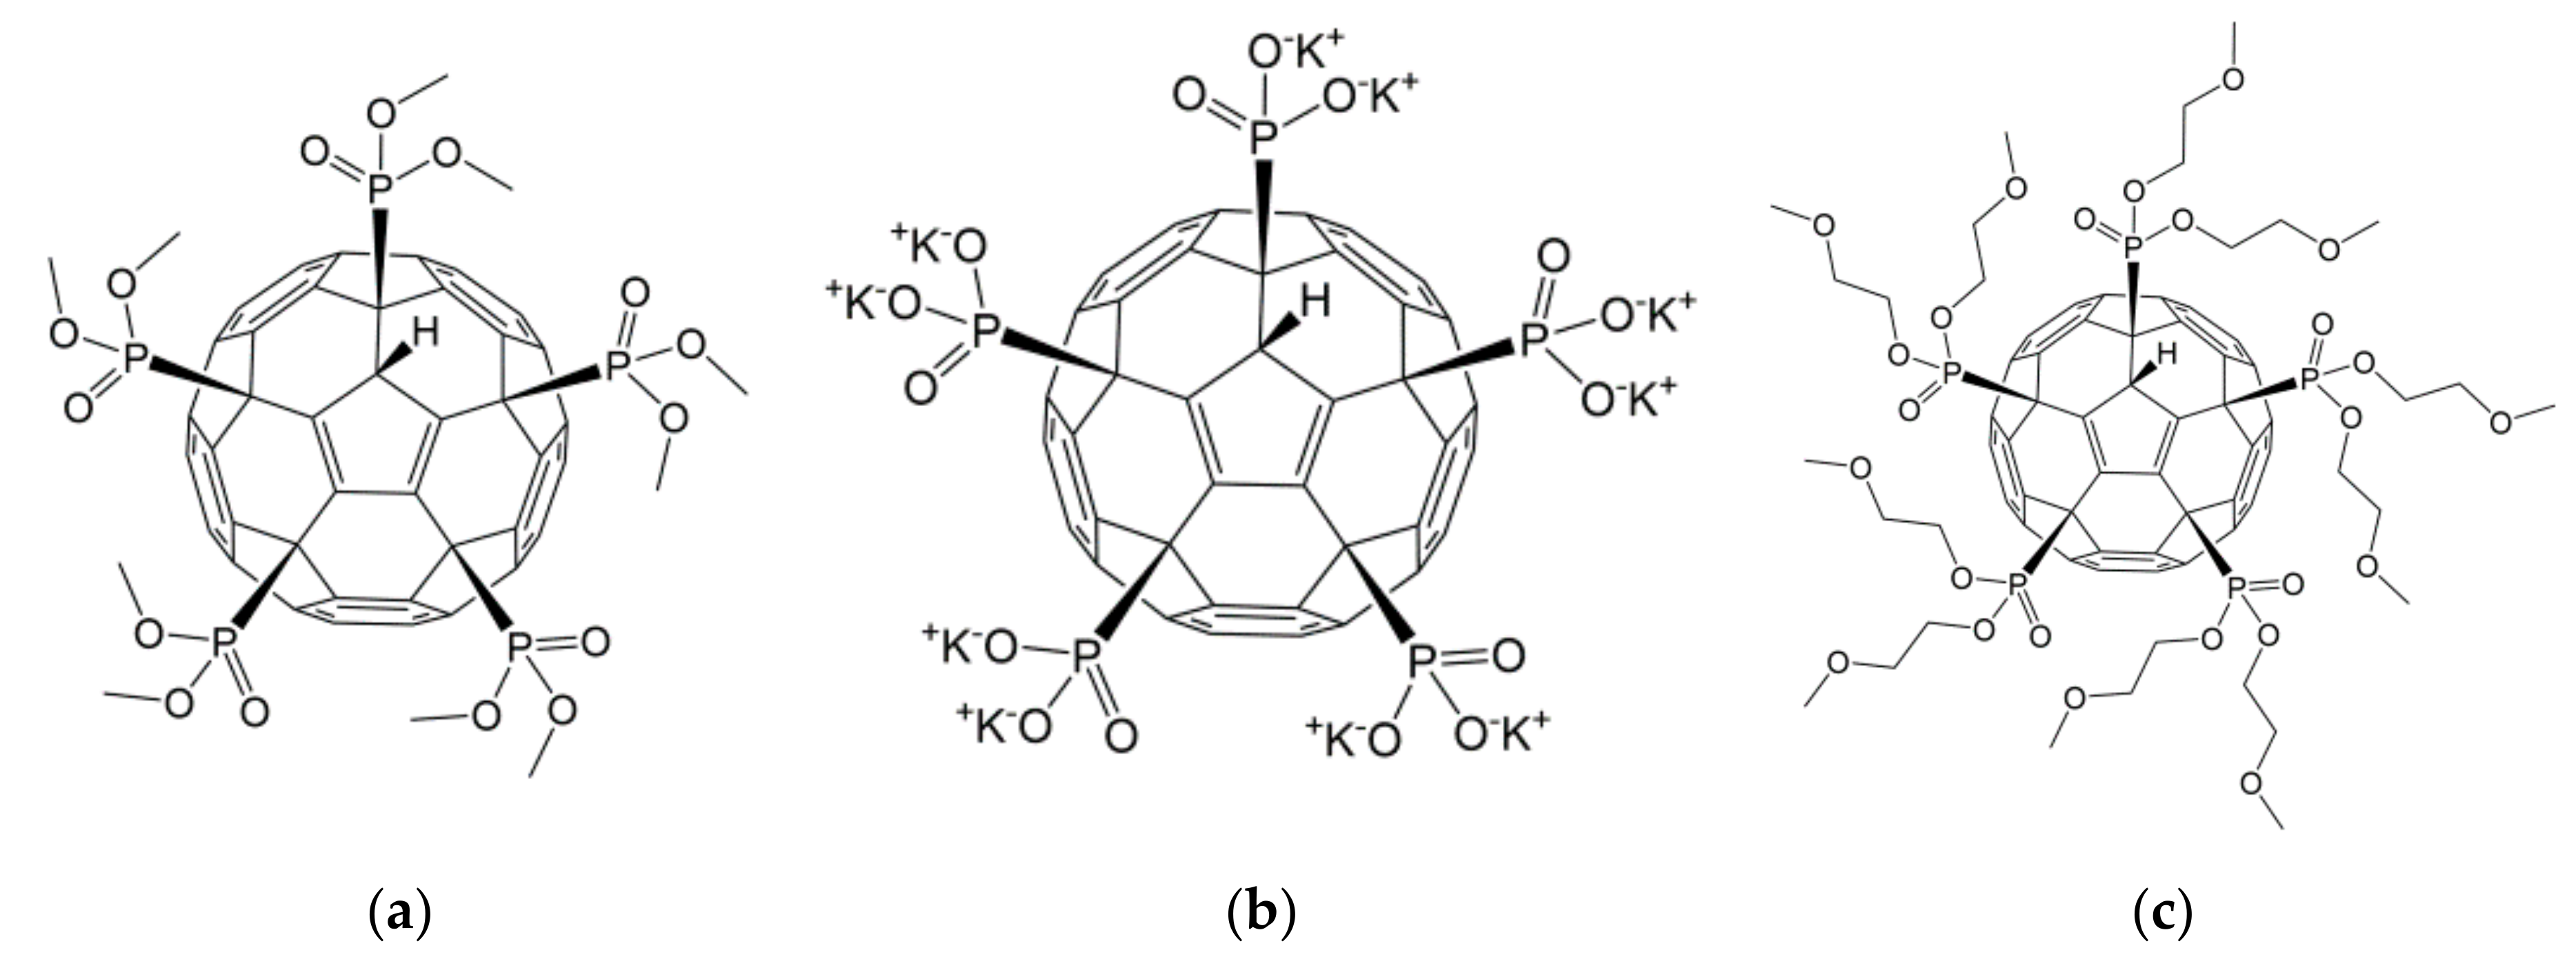
| Chemical name | C60-pentadimethylphosphonate | C60-pentaphosphonate, potassium salt | C60-pentadimethoxyethylphosphonate |
| Chemical structure |  |  |  |
| Maximal nontoxic concentration | 175 µM | 200 µM | 295 µM |
| Intracellular ROS | A nonsignificant decrease in ROS during the first two hours, followed by oxidative stress | An increase in ROS during the first hour, followed by antioxidative state | No significant effect on intracellular ROS |
| Autophagy | No effect | Activates autophagy | No effect |
| Myogenic differentiation | Activation of the early stages of myogenic differentiation | Activation of the complete process of myogenic differentiation | Activation of the early stages of myogenic differentiation |
| Osteogenic differentiation | No effect | No effect | No effect |
| Adipogenic differentiation | No effect | No effect | No effect |
Publisher’s Note: MDPI stays neutral with regard to jurisdictional claims in published maps and institutional affiliations. |
© 2021 by the authors. Licensee MDPI, Basel, Switzerland. This article is an open access article distributed under the terms and conditions of the Creative Commons Attribution (CC BY) license (https://creativecommons.org/licenses/by/4.0/).
Share and Cite
Kostyuk, S.V.; Proskurnina, E.V.; Ershova, E.S.; Kameneva, L.V.; Malinovskaya, E.M.; Savinova, E.A.; Sergeeva, V.A.; Umriukhin, P.E.; Dolgikh, O.A.; Khakina, E.A.; et al. The Phosphonate Derivative of C60 Fullerene Induces Differentiation towards the Myogenic Lineage in Human Adipose-Derived Mesenchymal Stem Cells. Int. J. Mol. Sci. 2021, 22, 9284. https://0-doi-org.brum.beds.ac.uk/10.3390/ijms22179284
Kostyuk SV, Proskurnina EV, Ershova ES, Kameneva LV, Malinovskaya EM, Savinova EA, Sergeeva VA, Umriukhin PE, Dolgikh OA, Khakina EA, et al. The Phosphonate Derivative of C60 Fullerene Induces Differentiation towards the Myogenic Lineage in Human Adipose-Derived Mesenchymal Stem Cells. International Journal of Molecular Sciences. 2021; 22(17):9284. https://0-doi-org.brum.beds.ac.uk/10.3390/ijms22179284
Chicago/Turabian StyleKostyuk, Svetlana V., Elena V. Proskurnina, Elizaveta S. Ershova, Larisa V. Kameneva, Elena M. Malinovskaya, Ekaterina A. Savinova, Vasilina A. Sergeeva, Pavel E. Umriukhin, Olga A. Dolgikh, Ekaterina A. Khakina, and et al. 2021. "The Phosphonate Derivative of C60 Fullerene Induces Differentiation towards the Myogenic Lineage in Human Adipose-Derived Mesenchymal Stem Cells" International Journal of Molecular Sciences 22, no. 17: 9284. https://0-doi-org.brum.beds.ac.uk/10.3390/ijms22179284