Article

Environmental Enrichment Induces Meningeal Niche Remodeling through TrkB-Mediated Signaling

1
Section of Pharmacology, Department of Diagnostic and Public Health, University of Verona, 37134 Verona, Italy
2
Department of Surgical Sciences, Dentistry, Gynecology and Pediatrics, University of Verona, 37134 Verona, Italy
3
Laboratory of Cell Metabolism and Regenerative Medicine, Department of Medical Biotechnology and Translational Medicine, University of Milan, 20129 Milan, Italy
*
Author to whom correspondence should be addressed.
Int. J. Mol. Sci. 2021, 22(19), 10657; https://0-doi-org.brum.beds.ac.uk/10.3390/ijms221910657
Submission received: 5 June 2021 / Revised: 22 September 2021 / Accepted: 26 September 2021 / Published: 1 October 2021
(This article belongs to the Special Issue Neuron and Brain Maturation)

Abstract

:
Neural precursors (NPs) present in the hippocampus can be modulated by several neurogenic stimuli, including environmental enrichment (EE) acting through BDNF-TrkB signaling. We have recently identified NPs in meninges; however, the meningeal niche response to pro-neurogenic stimuli has never been investigated. To this aim, we analyzed the effects of EE exposure on NP distribution in mouse brain meninges. Following neurogenic stimuli, although we did not detect modification of the meningeal cell number and proliferation, we observed an increased number of neural precursors in the meninges. A lineage tracing experiment suggested that EE-induced β3-Tubulin+ immature neuronal cells present in the meninges originated, at least in part, from GLAST+ radial glia cells. To investigate the molecular mechanism responsible for meningeal reaction to EE exposure, we studied the BDNF-TrkB interaction. Treatment with ANA-12, a TrkB non-competitive inhibitor, abolished the EE-induced meningeal niche changes. Overall, these data showed, for the first time, that EE exposure induced meningeal niche remodeling through TrkB-mediated signaling. Fluoxetine treatment further confirmed the meningeal niche response, suggesting it may also respond to other pharmacological neurogenic stimuli. A better understanding of the neurogenic stimuli modulation for meninges may be useful to improve the effectiveness of neurodegenerative and neuropsychiatric treatments.

1. Introduction

Mammal adult neurogenesis can be modulated by several stimuli, including exposure to environmental enrichment (EE) [1,2] and antidepressant treatments [3,4,5,6].
EE has been shown to induce hippocampal neurogenesis, and its therapeutic effect has been used to ameliorate brain injury outcomes [7]. Similarly, fluoxetine (FLUOX), a selective serotonin reuptake inhibitor (SSRI) antidepressant [3,8], as well as other SSRI antidepressants like imipramine, also increase hippocampal neurogenesis [3,4,9]. The molecular mechanisms responsible for the induction of hippocampal neurogenesis modulation by neurogenic stimuli have not been fully elucidated. However, a major role of the BDNF-TrkB signaling pathway has been described by several groups [10,11,12,13]. Aside from the effects of neurogenic stimuli on hippocampal neurogenesis, little is known about their effects on other less-studied brain neural stem cell (NSC) niches [14].
Recently, a subset of meningeal-residing neural progenitors (NPs) has been identified during both development and adulthood in different mammals, including humans [14,15,16,17,18,19]. Single-cell RNA sequencing (scRNAseq) analysis of the meningeal cells identified a small fraction of cells with a signature corresponding to radial glia-like cells, expressing GLAST and a population with a neuroblast signature expressing β3-Tubulin [20]. These NPs can migrate from the meninges to the brain parenchyma and differentiate into functional cortical neurons or oligodendrocytes [20,21]. The meningeal stem cell niche is composed of specific trophic extracellular matrix components (ECMs) called fractones, and it is able to sense and respond to neurotrophic stimuli including FGF2, NGF and EGF [22,23,24]. It is noteworthy that the NPs present in meninges have been shown to react to CNS diseases, including spinal cord and brain injuries, stroke and progressive ataxia [16,25]. Meninges may therefore represent a functional niche for NPs. However, the response of NPs in meninges to neurogenic stimuli such as EE tasks [26] or drugs [27] (e.g., fluoxetine) has never been assessed. In this work, we investigate the effects and the molecular mechanisms of the meningeal niche response to EE exposure.
We found that EE exposure induced meningeal niche remodeling by increasing the number of NPs in the meninges. Lineage tracing experiments showed that the EE-induced NPs in meninges were derived from radial glia GLAST+ cells. Pharmacological inhibition of the TrkB receptor following EE exposure abolished both the hippocampal and meningeal increase in NPs, supporting the role of TrkB-BDNF signaling in the hippocampal and meningeal responses to EE. Fluoxetine administration further confirmed that the meningeal niche response was not restricted to EE exposure, and it may be extended to other neurogenic stimuli.

2. Results

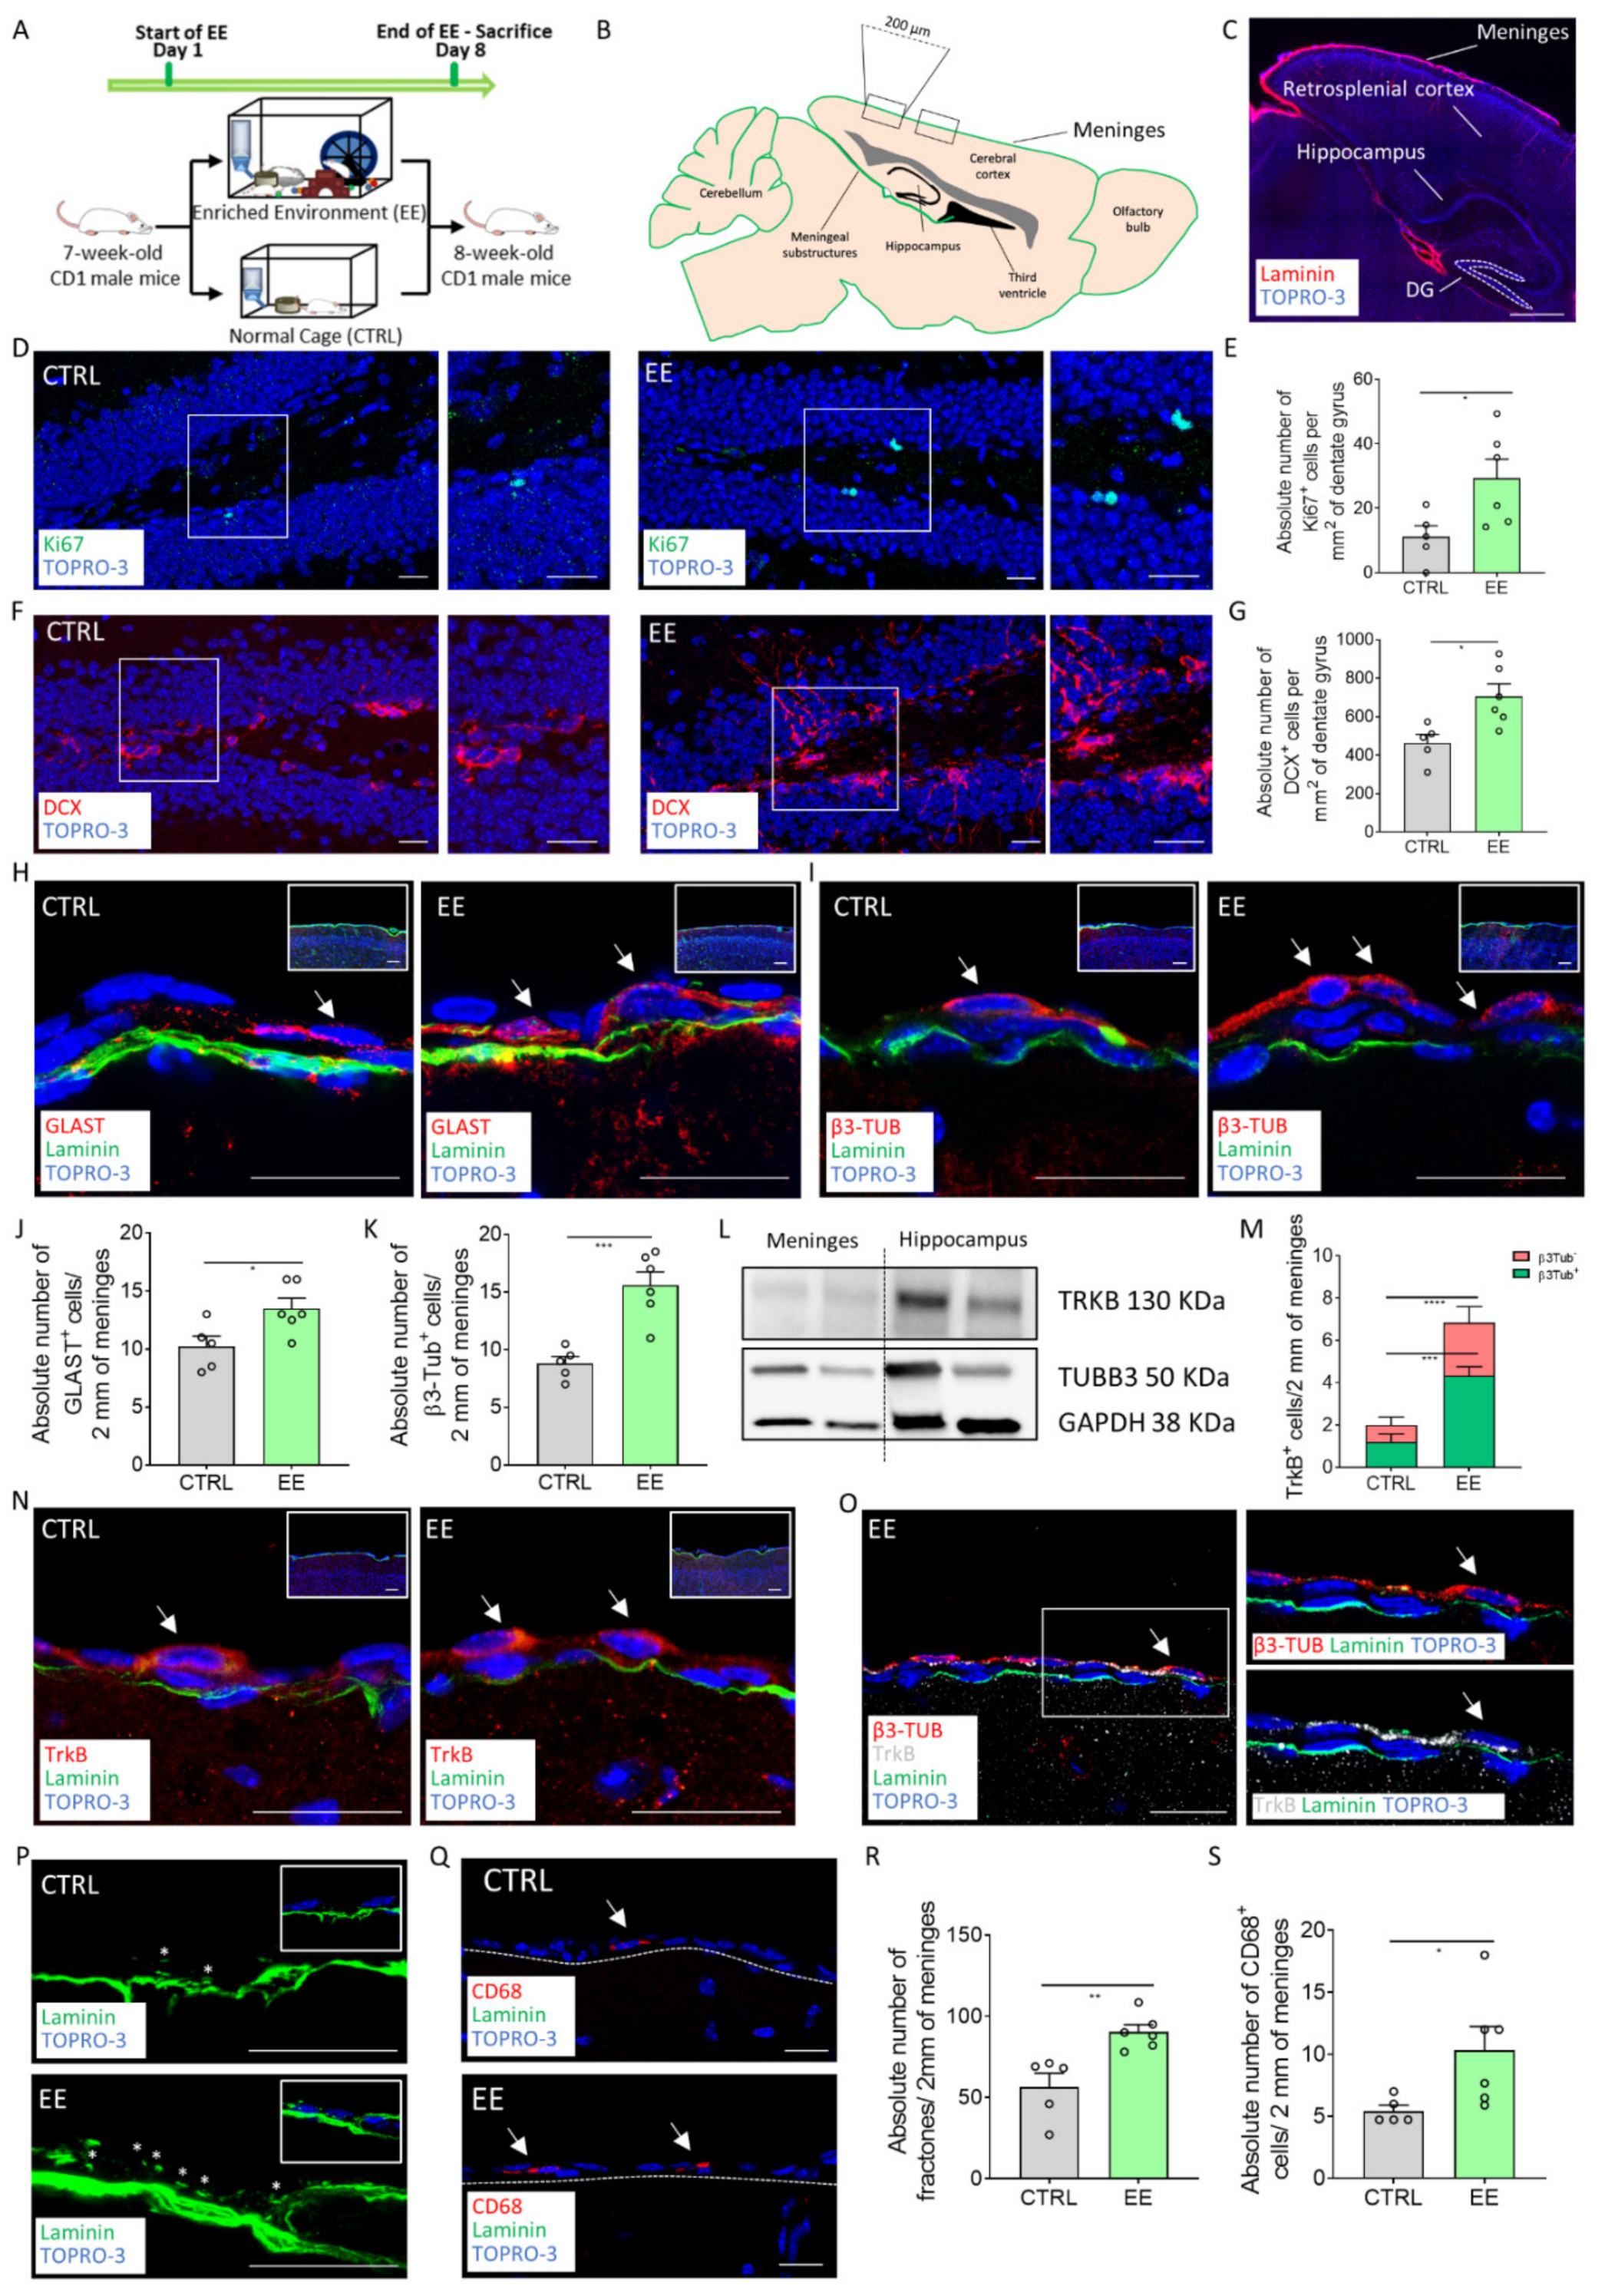
2.1. EE Exposure Induces Meningeal Niche Remodeling

EE is a pro-neurogenic stimulus known to induce hippocampal neurogenesis. In order to assess the effectiveness of the EE treatment on the meningeal niche, we exposed to an EE CD1 mice for 7 days and then analyzed the sagittal mouse brain sections at the retrosplenial cortical level by immunofluorescence and confocal analysis (Figure 1A–C). To validate the EE treatment, we first assessed its known impact on hippocampal neurogenesis [10,28,29] by analyzing the number of cells expressing the proliferation marker Ki67 or the immature neuronal marker DCX in the dentate gyrus (DG) (Figure 1D–G). The number of Ki67+ and DCX+ cells in the DGs of the treated mice was significantly higher compared with the control mice (number of Ki67+ cells per mm2 of DG area: CTRL = 11.06 ± 3.513, n = 5; EE = 29.31 ± 5.876, n = 6; p = 0.0325; number of DCX+ cells per mm2 of DG: CTRL = 463 ± 44.57, n = 5; EE = 706.5 ± 62.84, n = 6; p = 0.0142) (Figure 1E,G). In line with the literature data, these results confirmed that the EE was effective and it increased hippocampal neurogenesis [10,28,29]. To investigate if the EE affected the meningeal niche, we first analyzed the number of cell nuclei and the expression of Ki67 in 2 mm (5 brain sections, 2 segments of 200 µm in each section for each animal) of cross-sectioned brain retrosplenial meninges (Figure 1B). We did not observe differences in either the total cell number or the proliferation index in the meninges of the control or EE-treated groups (Figure S1).
The NPs present in retrosplenial meninges are characterized by features of radial glia-like cells expressing GLAST and immature neurons expressing β3-Tubulin [16]. Therefore, we analyzed in the retrosplenial meninges the distribution of radial glia-like cells expressing GLAST and immature neurons expressing β3-Tubulin (Figure 1H–K). We found a significant increase in the GLAST+ cells and β3-Tubulin+ cells in the treated mice compared with the control group (number of GLAST+ cells per 2 mm of cross-sectioned meninges: CTRL = 10.2 ± 0.9028, n = 5; EE = 13.5 ± 0.8756, n = 6; p = 0.0284; number of β3-Tubulin+ cells per 2 mm of cross-sectioned meninges: CTRL = 8.8 ± 0.6042, n = 5; EE = 15.58 ± 1.158, n = 6; p = 0.0009) (Figure 1J,K). These data indicate that the meningeal niche responded to the EE neurogenic stimulus by increasing the NP cell number.
It is known that EE-mediated neurogenesis is carried out via molecular mediators, including the BDNF-TrkB signaling pathway [3,10]. TrkB was identified as a gene expressed by the meningeal niche [20]. To investigate if this pathway was involved in the meningeal response to neurogenic stimuli, we first confirmed the expression of TrkB and β3-Tubulin in the meningeal cells via western blot analysis (Figure 1L). We then proceeded to analyze the retrosplenial meninges through immunofluorescence and confocal analysis of mice exposed to the EE. We found a significant increase in the TrkB+ retrosplenial meningeal cell population in response to EE exposure (number of TrkB+ cells per 2 mm of cross-sectioned meninges: CTRL = 2 ± 0.5477, n = 5; EE = 6.833 ± 0.4773, n = 6; p < 0.0001) (Figure 1M–O). In addition, we identified a rare population of immature neurons co-expressing β3-Tubulin and the BDNF receptor TrkB. While this double positive population was extremely sporadic in the control animals, it was significantly increased in the EE-exposed mice (number of β3-Tubulin+/+TrkB+ cells per 2 mm of cross-sectioned meninges: CTRL = 1.2 ± 0.3742, n = 5; EE = 4.333 ± 0.4216, n = 6; p = 0.0004) treatment groups (Figure 1M,O).
The meningeal niche is endowed with fractones, small laminin-based structures able to capture growth factors and exert a trophic role for the neural stem cell niche [30], and immune cells fundamental to maintaining neurogenesis [31]. We therefore evaluated the distribution of the fractones in the meninges by analyzing the laminin+ puncta [15] and the number the macrophages identified by the CD68 marker (Figure 1P–S). We found a statistically significant increase in the meningeal fractones and in the CD68+ cells after exposure to EE (number of fractones per 2 mm of cross-sectioned meninges: CTRL = 56.2 ± 8.599, n = 5; EE = 90.25 ± 4.393, n = 6; p = 0.0048; number of CD68+ cells per 2 mm of cross-sectioned meninges: CTRL = 5.432 ± 0.4638, n = 5; EE = 10.34 ± 1.878, n = 6; p = 0.0456; Figure 1R,S). These data further indicated that the EE induced changes in the meningeal ECM and macrophages, suggesting a trophic activation of the meningeal niche.
Overall, these results showed that EE exposure induced meningeal niche remodeling by modulation of the NPs, immature neurons, fractones and macrophages, supporting the responsiveness of the meningeal niche to pro-neurogenic stimuli.

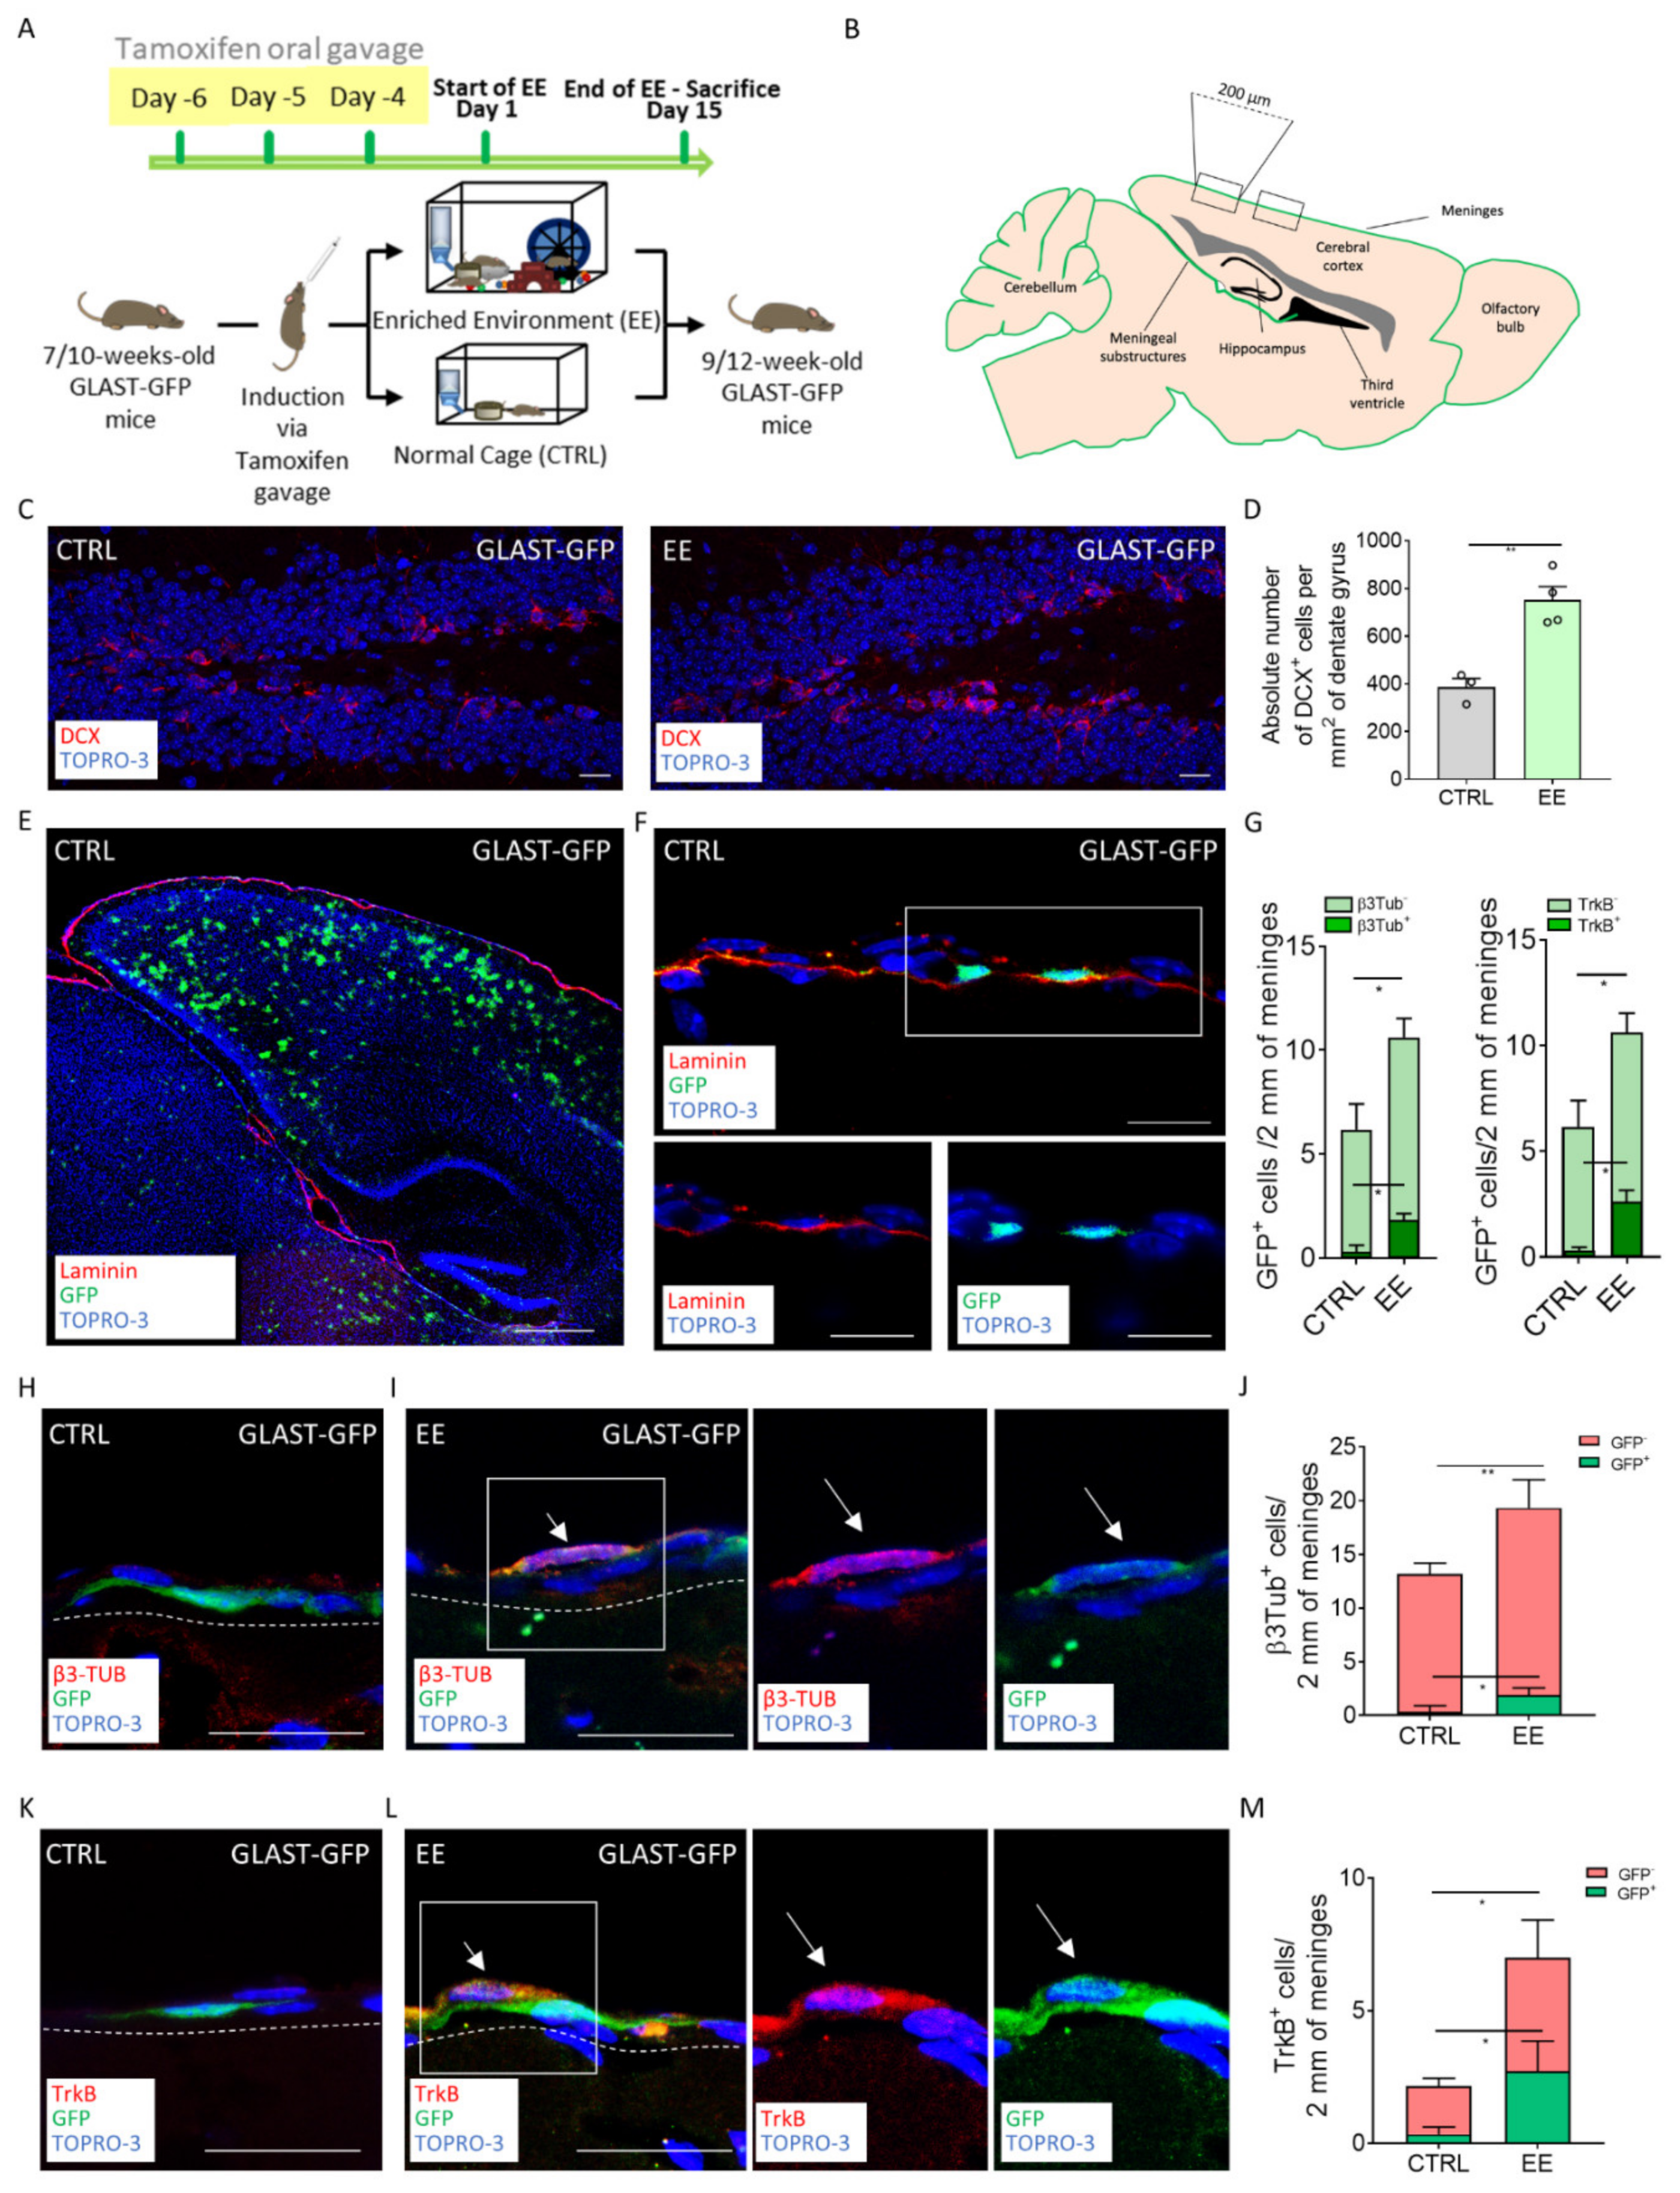
2.2. EE-Induced NPs in Meninges Derived from GLAST+ Radial Glia Progenitors

To identify the lineage of the immature neurons, which increased in the meninges after the exposure to EE, we took advantage of an inducible transgenic mouse model for the radial glial cells. The GLAST-CreERT2 mice [32], intercrossed with the CAG-CAT-EGFP reporter line [33] (GLAST-GFP), allowed all the GLAST+ cells and their progeny to be labeled by GFP following tamoxifen administration. After 3 days of tamoxifen induction via oral gavage, we subjected the mice to 15 days of the EE, and then we analyzed the brain and the retrosplenial meninges of the control and treated mice (Figure 2A,B) [32].
At first, we confirmed the effectiveness of the EE protocol in the GLAST-GFP mice by assessing the increased number of DCX cells in the DGs of the treated mice (Figure 2C,D) (number of DCX+ per mm2 of DG area, CTRL = 386.4 ± 36.7, n = 3:, n = 4; EE = 751.8 ± 56.24, n = 4; p = 0.0042). The time of the exposure to the EE was increased to 15 days, as we could not observe the hippocampal neurogenic response in the GLAST-GFP mice after 7 days, possibly due to gavage administration of tamoxifen (data not shown) [34,35,36].
We then analyzed the distribution and fate of the GFP+ GLAST-derived progenitors. As expected, we found GFP+ cells in the cortex, DG, striatum and meninges both in the EE-treated and the control mice (Figure 2E,F) [32]. We observed a statistical increase in the GFP+ cells in the meninges after exposure to EE (number of GFP+ cells per 2 mm of cross-sectioned meninges: CTRL = 6.167 ± 1.244, n = 3; EE = 10.62 ± 0.9157, n = 4; p = 0.0315) (Figure 2G). Since tamoxifen-induced recombination was done before the EE exposure, and there was no change in the cell number of retrosplenial cortical meninges, the total increase in GFP+ cells may have arisen from migrating progenitors coming from other brain regions.
In order to assess the fate of the GFP+ cells in the retrosplenial meninges following EE exposure, we analyzed their co-expression of β3-Tubulin. We found the presence of a double positive GFP+/β3-Tubulin+ cell population in the EE-treated mice meninges (Figure 2H–J). On the contrary, double positive cells were almost absent in the control mice, potentially suggesting that some immature neurons differentiated from the GLAST-derived cells following EE exposure (number of GFP+/β3-Tubulin+ cells per 2 mm of cross-sectioned meninges: CTRL = 0.3333 ± 0.3333, n = 3; EE = 1.893 ± 0.3362, n = 4; p = 0.0237; Figure 2G,J). In line with the results obtained in the CD1 mice, following EE exposure, we observed also in C57Bl6 mice an overall increase in β3-Tubulin+ cells in the meninges (Figure 2J) (number of β3-Tubulin+ cells per 2 mm of cross-sectioned meninges: CTRL = 13.17 ± 0.6009, n = 3; EE = 19.33 ± 1.113, n = 4; p = 0,0072).
We further confirmed the increased expression of TrkB/GFP+ cells in the meninges (Figure 2K–L) (number of GFP+/TrkB+ cells per 2 mm of cross-sectioned meninges: CTRL = 0.3333 ± 0.1667, n = 3; EE = 2.72 ± 0.5725, n = 4; p = 0.0182; number of TrkB+ cells per 2 mm of cross-sectioned meninges: CTRL = 2.167 ± 0.1667, n = 3; EE = 7 ± 1.186, n = 4; p = 0.0187) (Figure 2G,M), suggesting that they were partially derived from the GLAST+ radial glia lineage.
Altogether, these data indicated that following EE exposure, the increased β3-Tubulin+ immature neurons and TrkB+ cells in the meninges partially originated from the radial glia GLAST+ cells.

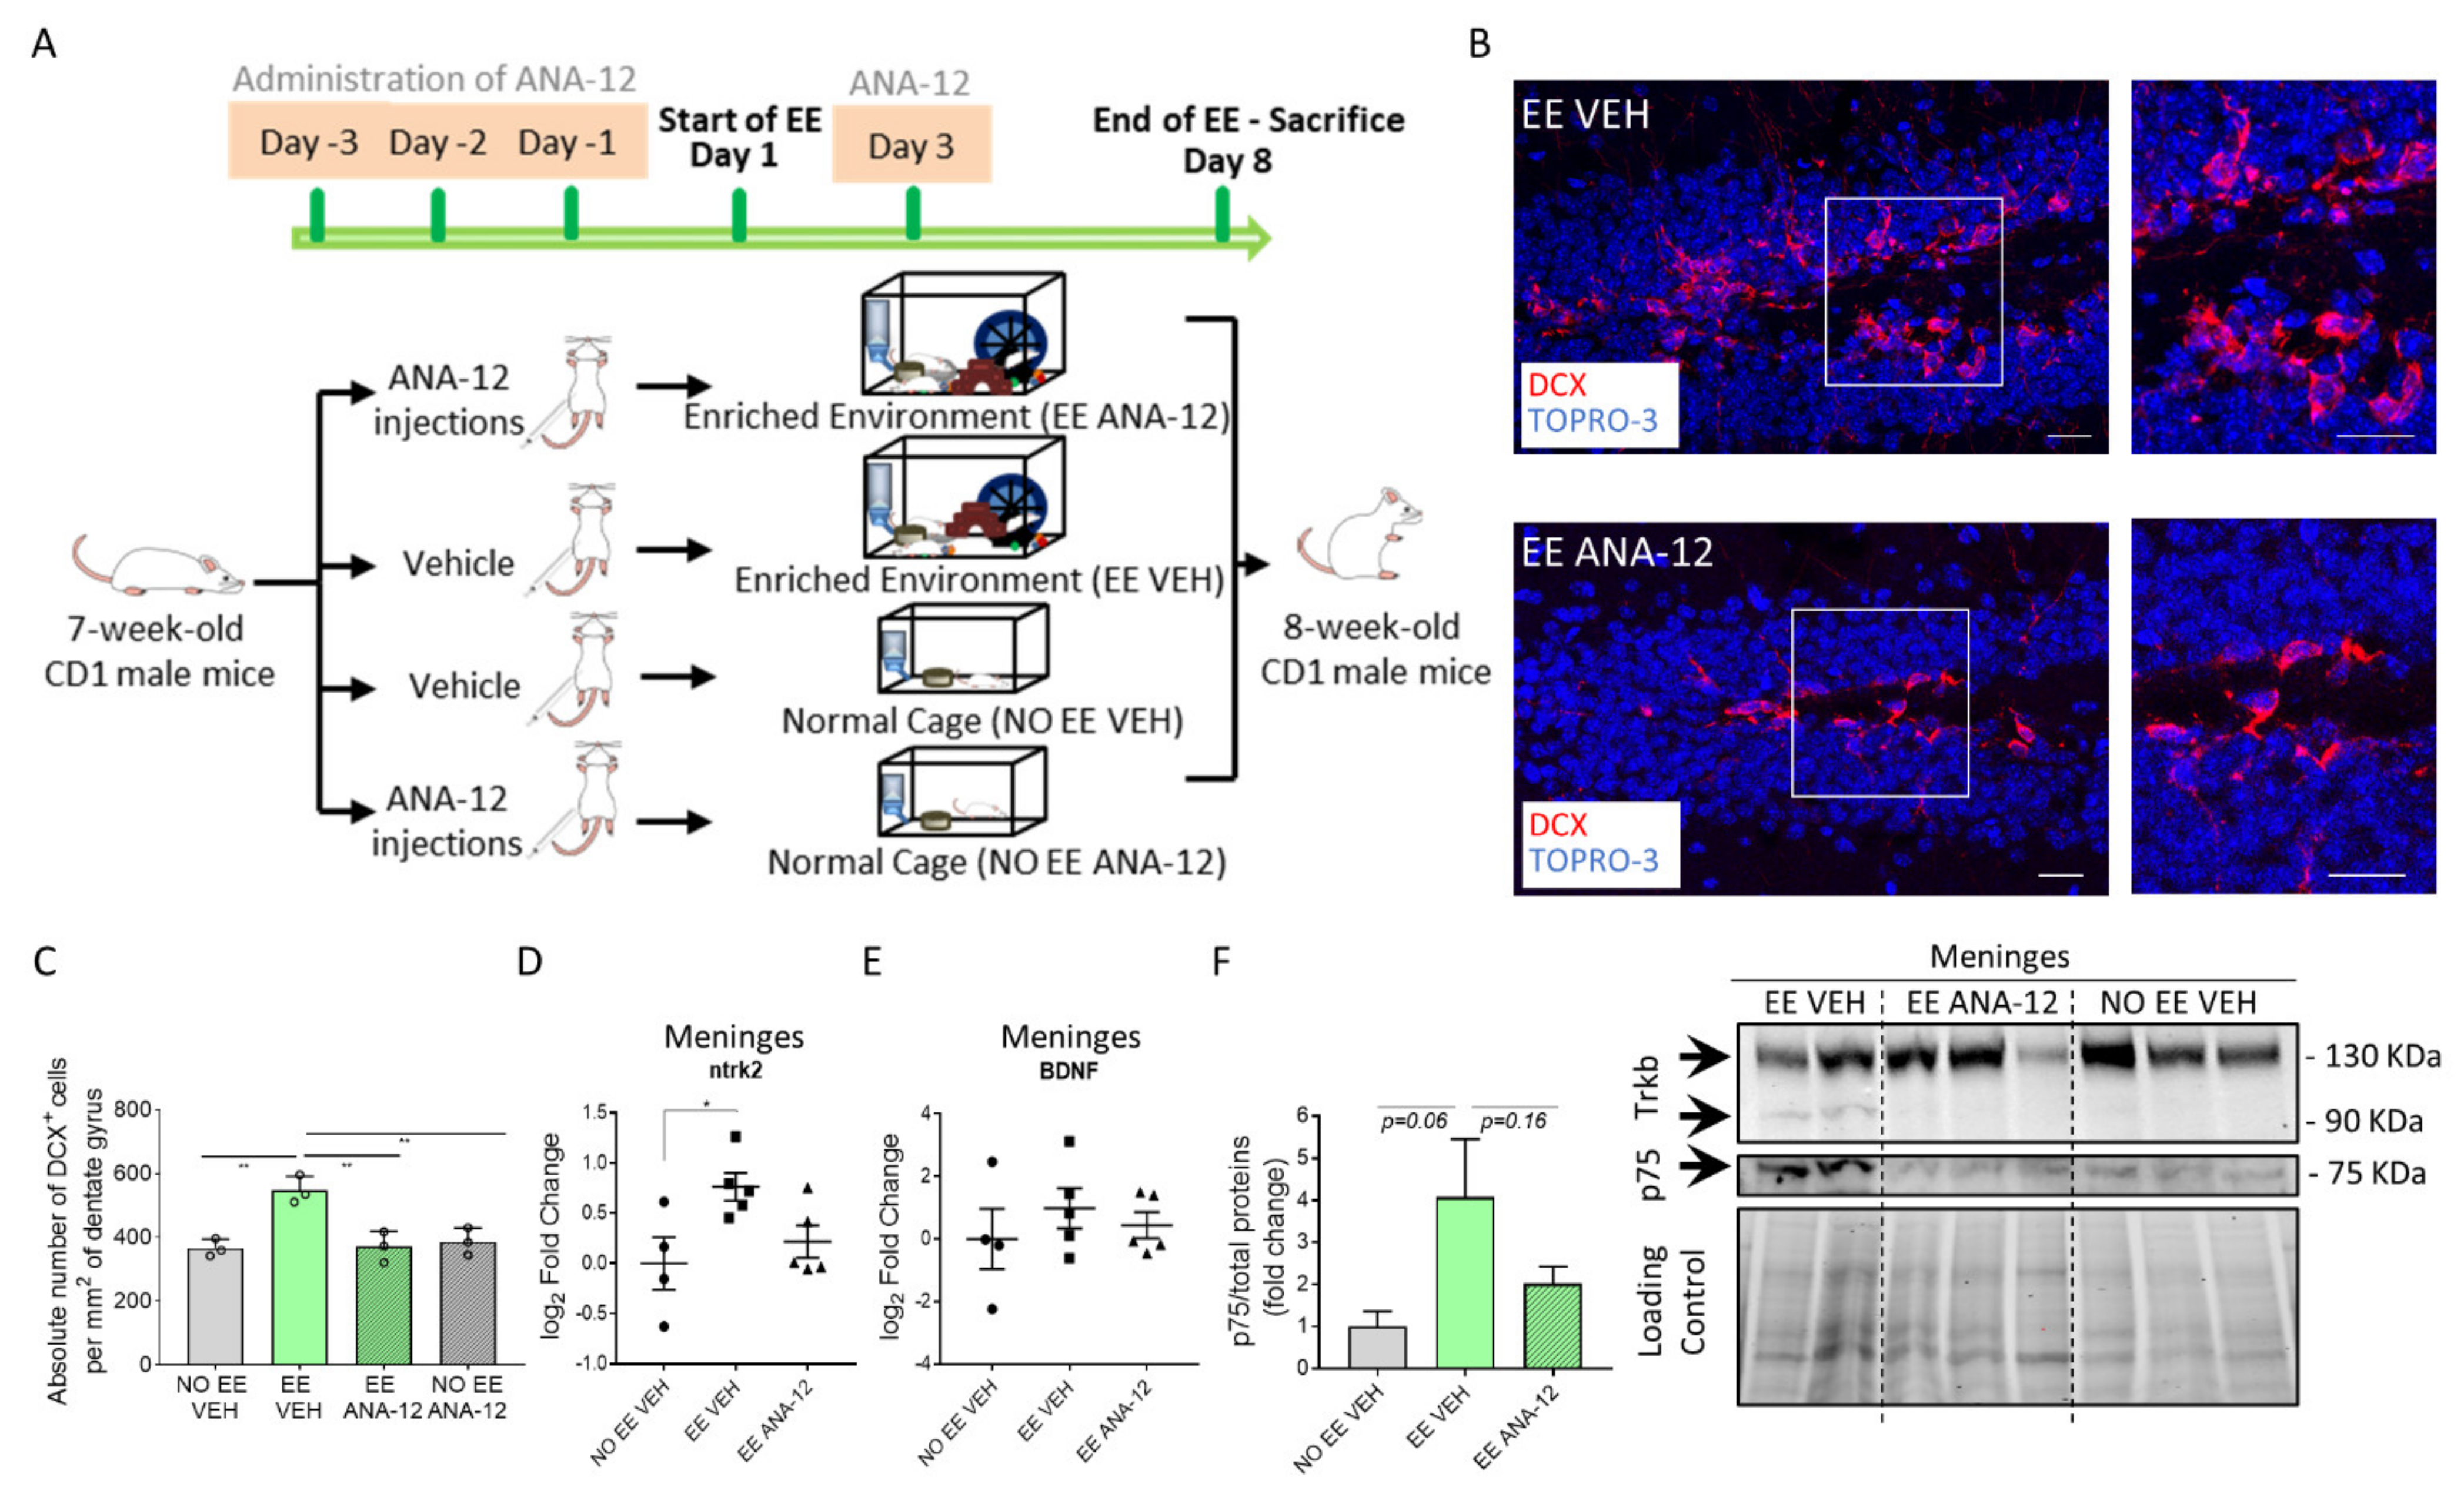
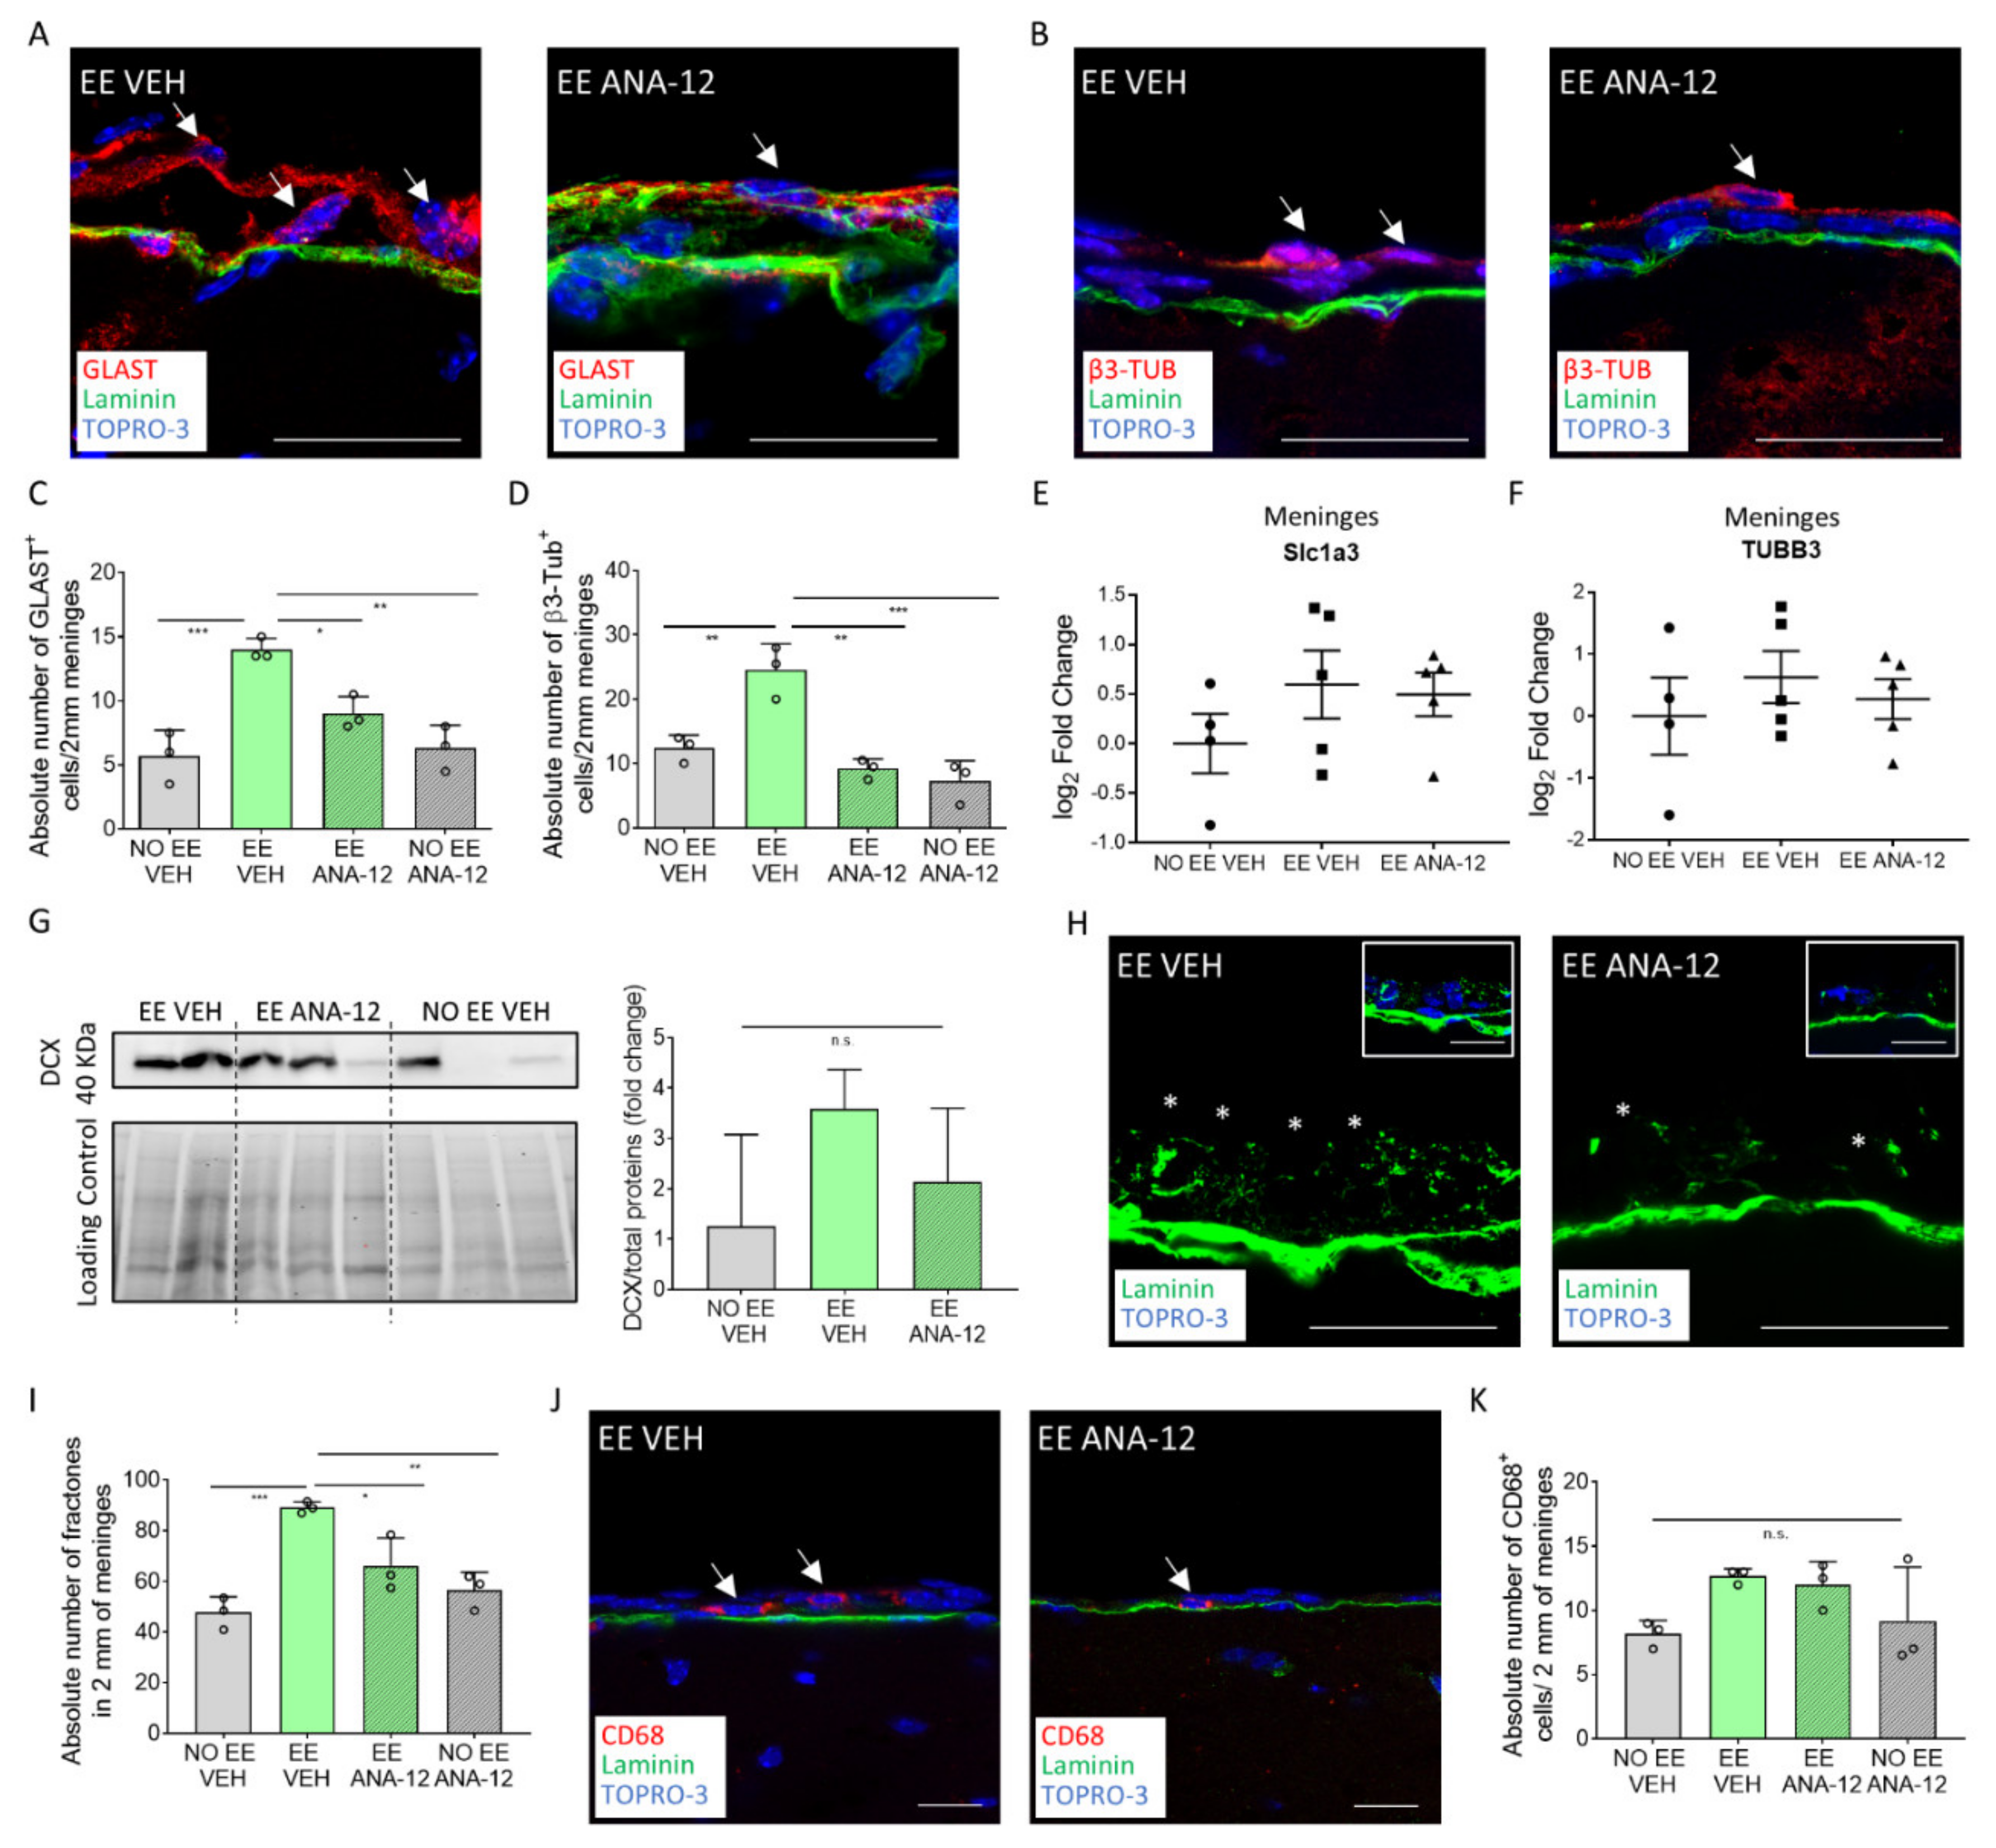
2.3. TrkB/BDNF Signaling Modulates the Meningeal Niche Response to Enriched Environment Exposure

We found that TrkB was expressed in the meninges, and following EE exposure, it increased in association with the β3-Tubulin meningeal progenitors (Figure 1M–O). TrkB receptor activation is suppressed by ANA-12 [37], a non-competitive inhibitor. In order to provide evidence that the meningeal response was directly regulated by the activation of the neurotrophic receptor TrkB, we administrated ANA-12 to CD1 mice 3 days before and at the third day of EE exposure (Figure 3A) [38]. In order to compare the effect of EE exposure and EE exposure plus the ANA-12 inhibitor, we set up the following experimental groups: EE ANA-12 (animals exposed to EE and injected with the inhibitor), EE VEH (animals exposed to EE and injected with the vehicle), NO EE VEH (single-housed animals receiving just vehicle injections) and NO EE ANA-12 (single-housed animals receiving the inhibitor) (Figure 3A).
At first, we assessed if the inhibitor was able to ablate the canonical effects caused by the EE on the hippocampal neurogenesis. As expected, ANA-12 ablated the EE neurogenic effects on the DG (number of DCX+ cells per 2 mm of DG area: NO EE VEH = 366.1 ± 16.16, n = 3; EE VEH = 547.1 ± 25.39, n = 3; EE ANA-12: 370.7 ± 27.76, n = 3; NO EE ANA-12: 386.6 ± 24.68, n = 3; NO EE VEH vs. EE VEH, p= 0.0030; EE VEH vs. EE ANA-12, p = 0.0036; EE VEH vs. NO EE ANA-12, p = 0.0063) (Figure 3B,C). These results validated the effect of ANA-12 on the hippocampal neurogenesis.
We then verified whether ANA-12 affected the expression of TrkB/BDNF in the meninges. We found that ntrk2 (the gene name for TrkB) significantly increased its gene expression in meninges following EE exposure and decreased when the EE exposure was associated with ANA-12 administration (log2 fold change: NO EE VEH = 0 ± 0.26, n = 4; EE VEH = 0.76 ± 0.14, n = 5; EE ANA-12 = 0.22 ± 0.16, n = 5; NO EE VEH vs. EE VEH, p = 0.0272) (Figure 3D). qRT-PCR indicated BDNF expression in the meninges which did not change following EE exposure or EE plus ANA-12 administration (log2 fold change: NO EE VEH = 0 ± 0.96, n = 4; EE VEH = 0.98 ± 0.64, n = 5; EE ANA-12 = 0.44 ± 0.42, n = 5) (Figure 3E). Western blot analysis showed that, following EE exposure, TrkB increased the expression of the truncated 1 isoform (TrkB.T1: 90 KDa) [39], which decreased to an undetectable control level following ANA-12 administration (Figure 3F). The full-length TrkB (130 KDa) did not change its expression among the different groups. To further confirm the increase in the expression of the TrkB signaling pathway in the meninges following EE exposure, we assessed the expression of the neurotrophin receptor p75 [40,41]. The p75 receptor cross links with the TrkB receptor to activate the response to BDNF signaling. Indeed, we found that p75 increased following EE exposure and decreased after ANA-12 administration (p75/total proteins (fold change): NO EE VEH = 1 ± 0.36, n = 3; EE VEH = 4.08 ± 1.38, n = 2; EE ANA-12 = 2.03 ± 0.4, n = 3; NO EE VEH vs. EE VEH, p = 0.0695) (Figure 3F).
We then assessed if the changes observed in the meninges after EE exposure could be reversed by blocking the TrkB/BDNF signaling.
We found that the GLAST+ progenitors decreased in the EE-treated group after the co-administration of ANA-12 (number of GLAST+ cells per 2 mm of cross-sectioned meninges: NO EE VEH = 5.667 ± 1.167, n = 3; EE VEH = 14 ± 0.5, n = 3; EE ANA-12 = 9 ± 0.7638, n = 3; NO EE ANA-12 = 6.333 ± 1.014, n = 3; NO EE VEH vs. EE VEH, p = 0.0008; EE VEH vs. EE ANA-12, p = 0.0181; EE VEH vs. NO EE ANA-12, p = 0.0014) (Figure 4A,C). We also observed that the EE-induced increase in the β3-Tubulin+ population was completely ablated when the TrkB inhibitor was administered (Figure 4B,D) (number of β3-Tubulin+ cells per 2 mm of cross-sectioned meninges: NO EE VEH = 12.33 ± 1.202, n = 3; EE VEH = 24.5 ± 2.363, n = 3; EE ANA-12 = 9.167 ± 0.8819, n = 3; NO EE ANA-12 = 7.22 ± 1.848, n = 3; NO EE VEH vs. EE VEH, p = 0.0053; EE VEH vs. EE ANA-12, p = 0.0012; EE VEH vs. NO EE ANA-12, p = 0.0005). Gene expression analysis of the meningeal cells of the entire brain further confirmed the expression of Slc1a3 (GLAST) and TUBB3 (β3-Tubulin) genes in the meninges (Slc1a3 log2 fold change: NO EE VEH = 0 ± 0.23, n = 4; EE VEH = 0.6 ± 0.34, n = 5; EE ANA-12 = 0.5 ± 0.22, n = 5; TUBB3 log2 fold change: NO EE VEH = 0 ± 0.64, n = 4; EE VEH = 0.63 ± 0.42, n = 5; EE ANA-12 = 0.28 ± 0.33, n = 5) (Figure 4E,F).
To further confirm the TrkB signaling modulation of the meningeal neural progenitors following EE exposure, we assessed the expression of DCX, a different neural progenitor marker. DCX-positive cells in meninges are extremely rare in adult mice [15], however we were able to observe an increase in DCX protein in meninges following EE exposure. This increment was partially reduced in the EE plus ANA12 mice (DCX/total proteins (fold change): NO EE VEH = 1.25 ± 0.74, n = 3; EE VEH = 3.58 ± 0.39, n = 2; EE ANA-12 = 2.14 ± 0.6, n = 3) (Figure 4G).
These data suggest that the administration of ANA-12 may interfere with the potential of meningeal β3-Tubulin+ immature neurons to react to EE.
We then assessed the effect of ANA-12 inhibition on the trophic and immune states of the meningeal niche. Interestingly, the increase in fractones in the meninges after EE exposure was reduced by ANA-12 administration, suggesting its regulation by TrkB/BDNF signaling (number of fractones per 2 mm of cross-sectioned meninges: NO EE VEH = 47.67 ± 3.632, n = 3; EE VEH = 89.17 ± 1.302, n = 3; EE ANA-12 = 66.17 ± 6.333, n = 3; NO EE ANA-12 = 56.5 ± 4.093, n = 3; NO EE VEH vs. EE VEH, p = 0.0006; EE VEH vs. EE ANA-12, p = 0.0207; EE VEH vs. NO EE ANA-12, p = 0.0027) (Figure 4H–I). We did not identify any reduction trend in the number of CD68+ cells in the meninges (Figure 4J–K).
Overall, the data suggested that the meningeal niche response to neurogenic EE stimulus was mediated by the neurotrophic receptor TrkB.

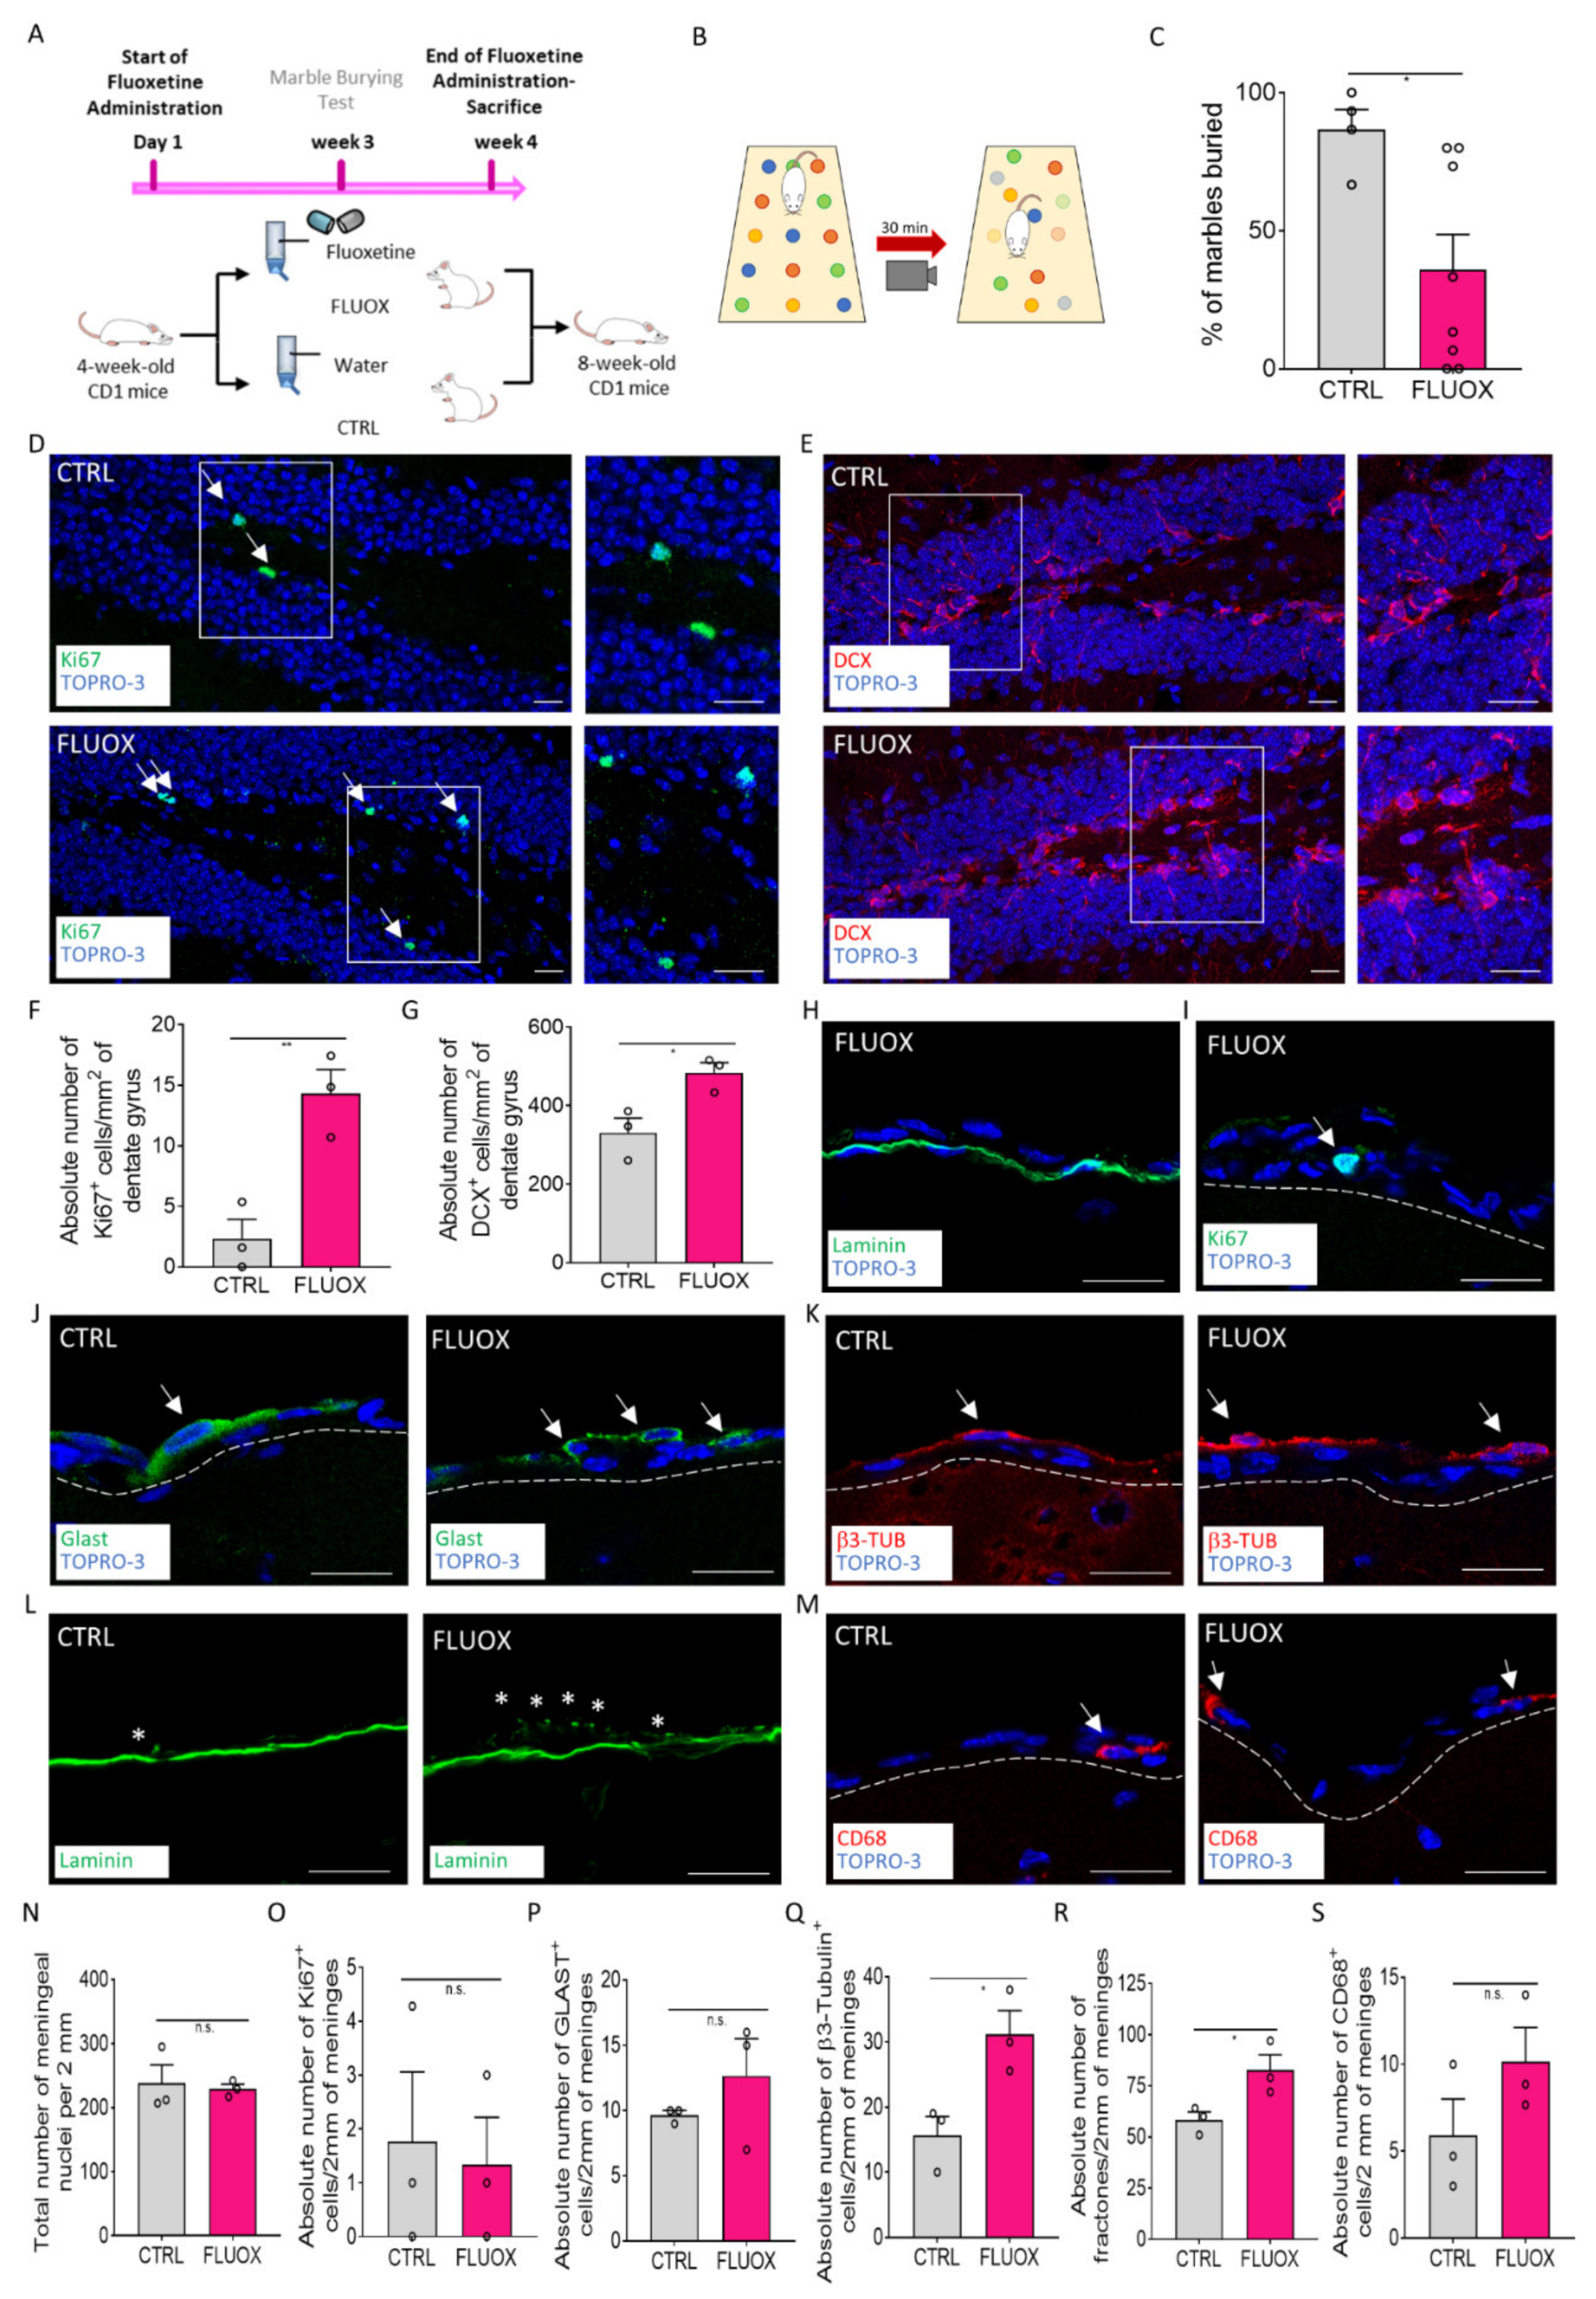
2.4. Fluoxetine Administration Induces the Meningeal Niche Response

Hippocampal adult neurogenesis can be enhanced by external stimuli such as antidepressant treatment [4,5,6]. Fluoxetine is an SSRI antidepressant which has been shown to ameliorate anxiety- or depression-related behavior and hippocampal neurogenesis [4].
To investigate if a pro-neurogenic stimulus different from EE was able to induce changes in the meningeal niche, we exposed the CD1 mice (4 weeks old) to chronic (4 weeks) administration of fluoxetine as described by others (Figure 5A) [3,4,42].
We first confirmed the effectiveness of the fluoxetine treatment on animal behavior using an anxiety- and obsessive-compulsive disorder (OCD)-evaluating behavioral test (the marble burying test (MBT)) [43,44]. As shown in Figure 5B,C, following 4 weeks of drug administration, the percentage of marbles buried by the treated animals was significantly lower when compared with the controls (percentage of marbles buried over the total marble number: CTRL = 86.67% ± 7.2, n = 4; FLUOX = 35.83% ± 12.84, n = 8; p = 0.0246). As expected, the antidepressant was able to reduce OCD-like behavior and, thus, it suggested that fluoxetine exerted its pharmacological effect. We further confirmed fluoxetine’s efficacy on hippocampal neurogenesis by analyzing the expression of the proliferation marker Ki67 and DCX in the DG (Figure 5D–G). In line with previous observations, we found that the number of Ki67+ and DCX+ cells of the DGs were significantly higher in the fluoxetine-treated mice compared with the control mice (number of Ki67+ cells per mm2 of DG area: CTRL = 2.322 ± 1.592, n = 3; FLUOX = 14.33 ± 1.963, n = 3; p = 0.0090) (number of DCX+ cells per mm2 of DG area: CTRL = 331.3 ± 37.04, n = 3; FLUOX = 484.1 ± 25.58, n = 3; p = 0.0274) (Figure 5F,G). These data confirmed the fluoxetine treatment’s effectiveness, supporting its known effect on both OCD-like behavior and hippocampal neuronal differentiation [3,4,42].
A similar approach was used to characterize the possible antidepressant-induced effects on the meninges. We first analyzed the mouse brain retrosplenial meningeal cell number and proliferation following 4 weeks of fluoxetine treatment. Similar to the EE exposure observations, the meningeal nuclei number as well as the number of proliferating cells did not change following the treatment (Figure 5H,I,N,O). We found that while the GLAST+ neural precursors showed a trend of increasing, the β3-Tubulin+ cells increased significantly in the treated group compared with the control (Figure 5J,K,P,Q) (number of GLAST+ cells per 2 mm of cross-sectioned meninges: CTRL = 9.667 ± 0.3333, n = 3; FLUOX = 12.67 ± 2.848, n = 3; p = 0.3545; number of β3-Tubulin+ cells per 2 mm of cross-sectioned meninges: CTRL = 15.67 ± 2.848, n = 3; FLUOX = 31.19 ± 3.641, n = 3; p = 0.0284). These data suggest that the meningeal niche responded to fluoxetine-increasing immature neurons, as observed following EE exposure.
Consistently, the number of fractones in meninges was significantly higher in the fluoxetine-treated group when compared with the controls (Figure 5L,R) (number of fractones per 2 mm of cross-sectioned meninges: CTRL = 58.33 ± 3.844, n = 3; FLUOX = 82.67 ± 7.446, n = 3; p= 0.0440), Finally, we assessed the number of macrophages in the meningeal niche following fluoxetine treatment. We observed an increasing trend of CD68+ cells in meninges of fluoxetine-treated mice, although the difference was not statistically significant (Figure 5M,S).
Collectively, we found that the meningeal niche reacted to fluoxetine treatment by increasing the immature neurons and the trophic ECM fractones in line with EE meningeal induction. Overall, these results suggest that the meningeal niche may respond not only to EE but also to other pharmacological neurogenic stimuli. Further studies will be necessary to clarify the role of TrkB signaling in the meningeal response to pharmacological neurogenic stimuli.

3. Discussion

In this study, we described, for the first time, the meningeal niche response to neurogenic stimuli. EE exposure induced meningeal niche remodeling by modulation of the neural precursor cells, immature neurons, fractones and macrophages. In addition, administration of the TrkB blocker ANA-12 [37] inhibited this response, suggesting that the effects of the EE on the meningeal niche was, at least in part, mediated by BDNF receptor signaling.
Hippocampal neurogenesis has been extensively investigated with pro-neurogenic paradigms like EE and antidepressant treatments. However, the effect of neurogenic stimuli on novel less-known NSC niches, like meninges, is still unexplored [4,10,28]. We first verified the effectiveness of the pro-neurogenic stimuli active in hippocampal neurogenesis, and then we investigated how the meningeal niche reacts to these neurogenic stimuli. Strikingly, EE exposure increased the GLAST+ NPs and β3-Tubulin+ immature neurons in the meninges without cellular proliferation. The meningeal response to the EE partially differed from the hippocampal one [4,6,28,45,46], as there was no apparent increase in cellular proliferation. However, an overall increase in immature neurons was observed in both the meninges and the hippocampus.
In line with these data, the meningeal niche was already shown to be able to sense and respond to different types of stimuli both in physiological and pathological conditions. Administration of FGF-2 and NGF in the meninges induced hyperplastic changes within the meninges of the rat and monkey [23,24]. Injuries, including spinal cord injuries (SCIs) [25], progressive ataxia [47] and brain stroke [48], were able to increase the number of meningeal-derived doublecortin (DCX)-positive immature neurons.
Aside from the effects on immature neurons and NPs, the pro-neurogenic stimuli are also able to remodel in a significant way the extracellular matrix, as previously described in the brain cortex [49]. Interestingly, we observed an increase in fractones [30], specialized ECM components of the neurogenic niche able to retain trophic factors [50], suggesting an overall remodeling of the meningeal niche.
While the mechanisms underlying the pro-neurogenic effects of neurogenic stimuli have been not entirely clarified, the pivotal role played by BDNF in these contexts has been shown [4,10,13]. We examined BDNF’s role using ANA-12, a small molecule acting as a TrkB non-competitive inhibitor [37]. We observed that the effects on β3-Tubulin and TrkB expression induced by the EE in meninges were partially reverted by ANA-12 administration. The number of CD68+ cells was not altered by the TrkB inhibitor, while a statistical reduction in the number of meningeal fractones was observed, suggesting that macrophage activity to generate ECMs may be partially reduced [50].
To identify the origin of the immature neurons emerging in meninges after exposure to the neurogenic stimuli, we took advantage of a transgenic model used for radial glia (RG) cell tracing [32,33]. We observed that the GFP+ cells in meninges increased after EE exposure. However, since there was no change in the retrosplenial cortical meningeal cell proliferation, the total increase in GFP+ cells may have arisen from migrating progenitors coming from other brain regions. We also detected an increase in the radial glia-derived neural precursors co-expressing TrkB and β3-Tubulin in the meninges following EE exposure, suggesting the RG origin of a part of those populations. The RG origin of neurons present in the meningeal niche was already characterized in a healthy newborn mouse [20]. Here, we showed for the first time their presence in an adult mouse brain. The increase in the number of immature neurons observed in the meninges after the pro-neurogenic stimulus may have different explanations, including (1) differentiation of the RG cells already present in the meninges, (2) other meningeal neural progenitor populations not investigated in this study (including Nestin+ and PDGFrβ+ cells [20]) or (3) neural precursors migrating from other brain neurogenic niches to the meninges.
We further assessed the meningeal response to fluoxetine, an antidepressant acting as a neurogenic stimulus of the DG [4,5,6]. Consistently, following fluoxetine administration, we observed meningeal niche remodeling through increasing the immature neurons and the ECM fractones. Therefore, similar to the hippocampal niche, the meningeal niche response may not be restricted to the EE, and it may also be generated by other neurogenic stimuli. Previous studies have shown the role of TrkB in anxiety [51] and fluoxetine treatment [13]. However, further studies will be necessary to elucidate the molecular mechanisms driving the meningeal response to pharmacological neurogenic stimuli, including antidepressant treatment.
While the findings regarding the generation of immature neurons in brain meninges after exposure to neurogenic stimuli are completely novel, one question out of many remains to be answered: what is the function of these cells? In recent years, the presence of “standby” neuroblasts expressing markers of neural precursors (like Nestin or GLAST) or of migrating cells (like DCX) while being in a quiescent state (no expression of Ki67 and no BrdU incorporation) was described [14,52,53,54]. Those quiescent cells were found in classical NSC niches like the subgranular [55,56] and the subventricular zone [57] but also in newly described niches like the cortex, the striatum and the meninges themselves [14,20,55,58,59,60]. The role covered by those standby neuroblasts is still an object of speculation and hypothesis, as little is known about their function in the adult brain. Our study showed that, at least in the meninges, quiescent precursors are sensitive to pro-neurogenic stimuli. This opens the stage to further investigations that may help clarify the function of immature neurons in the regeneration or repair processes occurring in an adult brain.

4. Material and Methods

4.1. Animals

Animal housing and all experimental procedures were approved by the Istituto Superiore della Sanita` (I.S.S., National Institute of Health, Roma, Italy) of Italy and the Animal Ethics Committee (C.I.R.S.A.L., Centro Interdipartimentale di Servizio alla Ricerca Sperimentale, Verona, Italy) of the University of Verona, Italy (authorization number: 237/2016-PR; date of approval: 3 March 2016; protocol number: 56DC9.13). Wild-type (WT) CD1 mice and GLAST-GFP transgenic mice [32,33] were used for all the experiments, as reported in Table 1. The WT CD1 mice were purchased from Charles River Laboratory Italia (Calco, Italy), while the GLAST-GFP transgenic mice were obtained by intercrossing GLAST-CreERT2 mice [32] with the CAG-CAT-EGFP reporter line [33].
The animals were kept in a non-reversed light cycle at a temperature between 20 and 24 °C and humidity between 45 and 60%, and food and water were provided ad libitum.

4.2. Exposure to an Enriched Environment

Seven-week-old CD1 male mice (n = 6) were housed together in a single rat cage for 1 week. A running wheel and nesting material were always present in the cage, while other toys (e.g., stairs, cardboard rolls and marbles) were added alternatively to the cage to preserve the novelty, according to what is shown in Table 2. The animals were sacrificed after 7 days of EE exposure. Seven-week-old CD1 male mice (n = 5) single-housed in a normal cage for 1 week were used as the control animals, as previously described in [61]. The animals were sacrificed 7 days after the start of the experiment.

4.3. GLAST-GFP Exposure to EE

The GLAST-CreERT2 mice [32] intercrossed with the CAG-CAT-EGFP reporter line [33] (GLAST-GFP) allowed for labeling by GFP all the GLAST+ cells and their progeny following tamoxifen administration, creating the GLAST-GFP strain. Male GLAST-GFP mice from 7 to 10 weeks old were induced using 3 instances of daily tamoxifen (T5648-1G, Sigma-Aldrich, St. Louis, MO, USA) gavage before the start of the EE protocol. Tamoxifen was dissolved into sunflower seed oil at a 30 mg/mL concentration, and the mice received 3.5 mg of tamoxifen per 35 g of body weight. The animals were left alone for 2 days to recover from the handling and then were either subjected to an EE (n = 4) or the control treatment (n = 3) as previously described. Observing that the gavage procedure stressed the animals in a significant way, we decided to prolong the EE exposure from 1 to 2 weeks in order to give them time to recover.

4.4. Exposure to the EE and TrkB Inhibitor ANA-12

The 7-week-old CD1 male mice (n = 12) were injected intraperitoneally with (1) 10 µL/g of TrkB inhibitor ANA-12 [37] dissolved in sunflower seed oil supplemented with 1% DMSO at a 0.1 mg/mL concentration for 3 consecutive days before the start of the experiment and at the third day of the experiment or (2) the vehicle (sunflower seed oil + 1% DMSO). This administration protocol was adapted from Moy et al. (2019) [38].
After the injections, the mice were divided into four experimental groups: EE ANA-12 (animals exposed to the EE and injected with the inhibitor), EE VEH (animals exposed to the EE and injected with the vehicle), NO EE VEH (single-housed animals receiving just vehicle injections) and NO EE ANA-12 (single-housed animals receiving the inhibitor).

4.5. Fluoxetine Administration

The 4-week-old CD1 male mice (n = 8) were treated orally with fluoxetine (fluoxetine hydrochloride, LRAA9180, Sigma-Aldrich, St. Louis, MO, USA) for 4 consecutive weeks. The drug was dissolved into the water (0.16 mg/mL concentration) contained in the dispenser normally present in the mice cages, and the mice were able to freely access the water containing the drug. As fluoxetine is light-sensitive, a tinfoil sheet was used to cover the water dispenser in order to avoid any kind of light-induced change in the drug. The drug-containing water was changed by the operator two times per week, and the dispenser was weighted to evaluate the average water consumption for every animal. On the basis of this evaluation, on average, the animals took 29 mg/kg/day of fluoxetine via oral administration. The control group consisted of age-matched CD1 male mice (n = 4) which normal water was administered to.
All the animals used in the experiment were administered the marble burying test (MBT), while only n = 3 per experimental group were used for subsequent immunofluorescence analysis.

4.6. Marble Test Administration

A behavioral marble test was performed at the end of the third week of fluoxetine treatment to preliminarily assess the efficacy of the treatment [62]. The animals were individually placed into a new cage containing 15 equally spaced marbles placed over approximately 5 cm of saw dust, and they were allowed to acclimate for 2 min. Then, their behavior was video-recorded for 30 min. The number of buried marbles (criterium of at least three quarters of its surface under the saw dust) was blindly assessed. All the behavioral testing was performed during the light phase between 12:00 and 4:00 p.m.

4.7. Tissue Preparation and Immunofluorescence

At the end of the experimental procedures, all animals were anesthetized by intraperitoneal injection of zoletil (50 mg/kg) and xylazine (7 mg/kg). Once the pedal reflex was lost, the animals were sacrificed by intracardiac perfusion of PBS with a 4% paraformaldehyde (PFA) 4% sucrose (pH 7.4) solution. The brains were extracted, fixed in a 4% PFA solution and transferred into 10% and subsequently 30% sucrose solutions. By cryostat cutting, 35-µm thick medio lateral sagittal brain sections were obtained and processed by immunofluorescence as previously described in [40]. Immunostaining on the cryosections was performed after 30 min of incubation in a blocking solution (PBS 1X with 0.25% Triton X-100, 2% BSA). If required by the specific antibody combination, mouse serum (1:100) was added during incubation in the blocking solution. The sections were then incubated with primary antibodies in the blocking solution overnight at 4 °C. After rinsing 6 times for 5 min in the blocking solution, appropriate secondary antibodies were applied for 4 h at room temperature. After the final washing steps in the blocking solution and then in PBS, nuclear staining with 4′,6-Diamidino-2-phenylindole dihydrochloride (DAPI, Molecular Probes-Thermo Fisher Scientific, Waltham MA, USA) or TO-PRO™-3 iodide (TO-PRO-3, Molecular Probes-Thermo Fisher Scientific) was performed, and the slides were mounted using 1,4-Diazabicyclo[2.2.2]octane (DABCO, Sigma-Aldrich). Staining for the nuclear marker of proliferation Ki67 required a different blocking solution (PBS 1X with 0.5% Triton X-100, 2% BSA).
For immunofluorescence staining using GFP and TrkB antibodies, as they are both produced in the same host, we developed the following protocol using a conjugated primary antibody and a non-conjugated primary antibody.
The cryosectioned sagittal sections were obtained as previously described. Immunostaining was performed after 30 min of incubation in a blocking solution (PBS 1X with 0.25% Triton X-100, 2% BSA). The sections were then incubated with the non-conjugated rabbit primary antibody in a blocking solution overnight at 4 °C. After rinsing 6 times for 5 min in the blocking solution, the appropriate secondary antibody was applied for 4 h at room temperature. Following additional rinsing in the blocking solution 6 times for 5 min, the GFP-conjugated antibody was added to the sections, which were incubated overnight at 4 °C. The final washing steps, nuclear staining and the mounting procedure were performed as previously described.
Control experiments with no primary antibodies were performed to ensure the specificity of the fluorescence staining (Figure S2).

4.8. Antibodies

The following primary antibodies were used: anti-GLAST (anti-EAAT1; rabbit, 1:200, Abcam, Cambridge, UK AB416), anti-GLAST (guinea pig; 1:200; Frontier Institute, Ishikari, Japan, AB2571717), anti-DCX (goat, 1:200, Santa Cruz, Santa Cruz, CA, USA, SC-8066), anti-DCX (rabbit, 1:400, Cell Signaling, Danvers, MA, USA, 4604S), anti-β3 tubulin (mouse, 1:400, Promega, Madison, WI, USA, G7121), anti-laminin (rabbit, 1:400, Sigma-Aldrich, St. Louis, MO, USA, L9393), anti-laminin-Alexa Fluor 488 (1:500, Invitrogen, Waltham, MA, USA, PA5-22901), anti-CD68 (rat, 1:200, Invitrogen, Waltham, MA, USA, 14-0681-82), anti-TrkB (anti-tyrosin kinase receptor B, 1:200, rabbit, Santa Cruz, Santa Cruz, CA, USA, SC-12), anti-Ki67 (rabbit, 1:200, Abcam, Cambridge, UK AB16667) and anti-GFP-Alexa Fluor 488 (rabbit, 1:500, Invitrogen, Waltham, MA, USA, A21311).
The following secondary antibodies were used: donkey anti-rabbit Alexa Fluor 488 (1:500, Molecular Probes-Thermo Fisher Scientific, Waltham MA, USA), donkey anti-rabbit Alexa Fluor 647 (1:500, Molecular Probes-Thermo Fisher Scientific, Waltham, MA, USA), donkey anti-goat Alexa Fluor 546 (1:500, Life Technologies-Thermo Fisher Scientific), goat anti-mouse CY3 (1:500, Jackson ImmunoResearch, West Grove, PA, USA), donkey anti-rat CY3 (1:500, Jackson ImmunoResearch, West Grove, PA, USA) and donkey anti-guinea pig CY3 (Jackson ImmunoResearch, West Grove, PA, USA). For nuclear staining, TO-PRO™-3 (1:3000, Molecular Probes-Thermo Fisher Scientific, Waltham, MA, USA) and DAPI (1:2000, Molecular Probes-Thermo Fisher Scientific, Waltham, MA, USA) were used.

4.9. Immunofluorescence Image Acquisition, Analysis and Quantification

Immunofluorescence imaging of the brain sections was performed using an Eclipse Ti Nikon microscope (Nikon, Tokyo, Japan) and a Zeiss L710 confocal microscope (Carl Zeiss, Munich, Germany). The acquisition parameter settings (pinhole, gain, offset and laser intensity) were kept fixed for each channel in different sessions of observation at the fluorescence and confocal microscopes. For confocal microscopy, single-plane images were acquired to realize all the quantifications.
Quantification of different markers and nuclei was conducted by counting the positive cells above the basal lamina (identified by laminin reactivity) in at least 15 brain slices for each experimental group (n ≥ 3 animals analyzed), analyzing at least five slices from each animal.
At least two images representing 200 μm of meningeal tissue were taken from each slice. A total of at least 2 mm of meninges was analyzed for each animal.
Evaluation of the DG area was realized by designing a user-defined region of interest (R.O.I.) using Fiji-Image J software [63]. The R.O.I.s were delineated while taking into consideration the nuclei composing the DG.

4.10. Protein Extraction from the Mouse Meninges and Immunoblot Analysis

After the experimental procedures, the mice (NO EE VEH n = 3, EE VEH n = 3, EE ANA-12 n = 2) were anesthetized by intraperitoneal injection of zoletil (50 mg/kg) and xylazine (7 mg/kg) and sacrificed via decapitation. The brains were quickly extracted, and the meninges and hippocampi were harvested using tweezers under an optical microscope and washed with an HBSS solution (sterile water, HBSS 10X, HEPES 0.3 M, 1% Pen/Strep) and then with PBS1X. The proteins were extracted via mechanical homogenization (GentleMACSTM M tubes, Miltenyi Biotec, Bergisch Gladbach, Germany) in an NP-40 buffer (150 mM NaCl, 1.0% NP-40, 50 mM Tris pH 8.0) in the presence of protease and phosphatase inhibitors. The samples were incubated on ice for 30 min and centrifuged at 10,000× g for 15 min at 4 °C. The supernatants were collected and concentrated with centrifugal filters (Amicon Ultra 10 KDa, Merck Millipore, Burlington, MA, USA) according to the manufacturer’s instructions. The protein concentration was determined with a bicinchoninic acid (BCA) protein assay kit (Thermo Scientific, Waltham, MA, USA). The aliquots (25 μg each) were run through a 4–15% SDS–polyacrylamide gel electrophoresis (PAGE) and electroblotted onto a PVDF membrane (Trans-Blot Turbo Transfer System, Bio-Rad Laboratories, Hercules, CA, USA). The membranes were then blocked (EveryBlot Blocking Buffer, Bio-Rad Laboratories, Hercules, CA, USA) and probed with the primary antibodies overnight at +4 °C. The following primary antibodies were used: anti-DCX (Cell Signaling, Danvers, MA, USA cat.no. 4604, 1:500), anti TRK-B (Genetex, Irvine, CA, USA, cat.no. GTX133722, 1:500), anti β3-tubulin (Promega, Madison, WI, USA, cat.no. G7121, 1:500) and anti-p75 (Promega, cat.no. G3231, 1:1000). Subsequently, incubation with anti-mouse or anti-rabbit HRP-conjugated secondary antibodies (Promega, Madison, WI, USA) for 2 h at room temperature was performed. Chemiluminescence-based immunostaining (Clarity Western ECL Substrate, Bio-Rad Laboratories, Hercules, CA, USA) was performed. The images were acquired with the Chemidoc MP Imaging System (Bio-Rad Laboratories, Hercules, CA, USA). Quantitative analyses were performed using Image Lab™ software version 6.0.1 for Windows (Bio-Rad Laboratories, Hercules, CA, USA) and normalizing the total protein content of each lane.

4.11. RNA Extraction from the Mouse Brain Meninges and Real-Time (rt) PCR Analysis

After the experimental procedures, animals destined for further Rt-PCR analysis (NO EE VEH n = 5, EE VEH n = 5, EE ANA-12 n = 5) were anesthetized by intraperitoneal injection of zoletil (50 mg/kg) and xylazine (7 mg/kg) and sacrificed via decapitation. After collecting the heads, the skin and skulls were removed to access the brains, which were then extracted. The meninges were harvested using tweezers under an optical microscope and collected into an HBSS solution (sterile water, HBSS 10X, HEPES 0.3 M, 1% Pen/Strep). After centrifugation at 300 g per 1 min, the HBSS was substituted with PBS1X and centrifuged at 300 g per 1 min. The total RNA was extracted from the fresh mouse meningeal tissue (NO EE VEH n = 4, EE VEH n = 5, EE ANA-12 n = 5) using the RNeasy Plus Micro Kit (Qiagen, Hilden, Germany Cat No. 74034) according to the manufacturer’s protocol, and the RNA abundance was evaluated using the NanoDrop™ One/OneC Microvolume UV-Vis Spectrophotometer (ThermoFisher Scientific, Waltham, MA, USA). Reverse transcription was carried out using a Superscript VILO Master Mix (Invitrogen, Thermo-Fisher Scientific, Waltham, MA, USA). The expression levels of the ntrk2, BDNF, Slc1a3 and TUBB3 (for primer sequences, see Table 3) genes were quantified by Sybr Green-based real-time PCR (7900HT real-time PCR system, Applied Biosystem, Waltham, MA, USA) according to the ΔΔCt method [64] and by using the Gaphd reference gene for data normalization.

4.12. Statistics

Data are expressed as the mean ± SEM. Statistical differences were calculated by a two-tailed Student’s t-test or ordinary one-way ANOVA test using GraphPadPrism (GraphPad Inc., La Jolla, CA, USA), where p ≤ 0.05 was considered statistically significant.

Supplementary Materials

Author Contributions

S.Z. performed the experiments, analyzed and interpreted the data, wrote the manuscript and gave final approval of the manuscript; A.C. performed the experiments, analyzed and interpreted the data, wrote the manuscript and gave final approval of manuscript; F.C. helped with the images and gene expression analysis; G.M. conducted the gene expression analysis; E.B. conducted the western blot analysis; S.D. analyzed the data and set up the figures; A.P. collaborated for conceptualization and the experiments on fluoxetine treatment; A.A. and F.B. contributed to the confocal acquisition; G.F.F., C.C., F.B. and I.D. reviewed and gave final approval of the manuscript and provided funding; F.B. and I.D. conceptualized the study; I.D. supervised the study. All authors have read and agreed to the published version of the manuscript.

Funding

This research was funded by: the Fondazione Cariverona (grant number 2017-0604) for support provided to I.D., C.C. and G.F.; Fondazione Italiana Sclerosi multipla(FISM) (Grant Number 2017/R/11) and financed or co-financed with 5 per mille public funding to I.D.; European Union project FETPROACT-2018-2020 HEREMES (grant number 824164), support provided to I.D.; Fondazione Telethon–Italy (grant number GSP20004_PAsMCT8006) for support provided to I.D.; the italian patient association la Colonna, GALM to I.D. and G.F. and the Fondazione Telethon–Italy (grant number GGP19250) for support provided to F.B.

Institutional Review Board Statement

The study was conducted according to the guidelines of the Declaration of Helsinki, and approved by the Istituto Superiore della Sanita` (I.S.S., National Institute of Health, Roma, Italy) of Italy and the Animal Ethics Committee (C.I.R.S.A.L., Centro Interdipartimentale di Servizio alla Ricerca Sperimentale, Verona, Italy) of the University of Verona (Verona, Italy) (authorization number: 237/2016-PR; date of approval: 3 March 2016; protocol number: 56DC9.13).

Informed Consent Statement

Not applicable.

Data Availability Statement

The data that support the findings of this study are available from the corresponding author upon request.

Acknowledgments

We acknowledge the Centro Interdipartimentale di Servizi per la Ricerca che utilizza Animali da Laboratorio (CIRSAL) for help in the management of the animals needed for the experimental procedures. We thank Marzia Di Chio for her helpful technical assistance, Alberto Poli, Giulia Lucianer and Nicola Piazza for their help with the immunofluorescence analysis. We acknowledge M. Goetz for kindly providing the Glast-Cre ERT2 mice.

Conflicts of Interest

The authors declare that the research was conducted in the absence of any commercial or financial relationships that could be construed as a potential conflict of interest.

Abbreviations

BDNFBrain-derived neurotrophic factors
BrdUBromodeoxyuridine
CD68Cluster of differentiation 68
CNSCentral nervous system
CTRLControl animal
DCXDoublecortin
DGDentate gyrus
ECMExtracellular matrix
EEEnriched environment
FGFFibroblast growth factor
FGF2Fibroblast growth factor 2
FLUOXAnimal treated with fluoxetine
GFPGreen fluorescent protein
GLASTGlutamate and aspartate transporter
MBTMarble burying test
NGFNerve growth factor
NPNeural precursors
NSCNeural stem cells
OCDObsessive compulsive disorder
RGRadial glia
SCISpinal cord injury
scRNAseqsingle-cell RNA sequencing
SSRISelective serotonin reuptake inhibitor
TrkBTropomyosin receptor kinase B
WTWild-type
β3-TubTubulin β3

References

  1. Venna, V.R.; Xu, Y.; Doran, S.J.; Patrizz, A.; McCullough, L.D. Social interaction plays a critical role in neurogenesis and recovery after stroke. Transl. Psychiatry 2014, 4, e351. [Google Scholar] [CrossRef] [Green Version]
  2. Benarroch, E.E. Adult neurogenesis in the dentate gyrus: General concepts and potential implications. Neurology 2013, 81, 1443–1452. [Google Scholar] [CrossRef]
  3. Samuels, B.A.; Hen, R. Neurogenesis and affective disorders. Eur. J. Neurosci. 2011, 33, 1152–1159. [Google Scholar] [CrossRef]
  4. David, D.J.; Samuels, B.A.; Rainer, Q.; Wang, J.W.; Marsteller, D.; Mendez, I.; Drew, M.; Craig, D.A.; Guiard, B.P.; Guilloux, J.P.; et al. Neurogenesis-dependent and -independent effects of fluoxetine in an animal model of anxiety/depression. Neuron 2009, 62, 479–493. [Google Scholar] [CrossRef] [PubMed] [Green Version]
  5. Micheli, L.; Ceccarelli, M.; D’Andrea, G.; Tirone, F. Depression and adult neurogenesis: Positive effects of the antidepressant fluoxetine and of physical exercise. Brain Res. Bull 2018, 143, 181–193. [Google Scholar] [CrossRef]
  6. Wang, J.W.; David, D.J.; Monckton, J.E.; Battaglia, F.; Hen, R. Chronic fluoxetine stimulates maturation and synaptic plasticity of adult-born hippocampal granule cells. J. Neurosci. 2008, 28, 1374–1384. [Google Scholar] [CrossRef]
  7. Forbes, T.A.; Goldstein, E.Z.; Dupree, J.L.; Jablonska, B.; Scafidi, J.; Adams, K.L.; Imamura, Y.; Hashimoto-Torii, K.; Gallo, V. Environmental enrichment ameliorates perinatal brain injury and promotes functional white matter recovery. Nat. Commun. 2020, 11, 964. [Google Scholar] [CrossRef]
  8. Ferguson, J.M. Mechanism of Action of Antidepressant Medications. Prim. Care Companion J. Clin. Psychiatry 2001, 3, 22–27. [Google Scholar] [CrossRef] [PubMed]
  9. Duman, R.S.; Monteggia, L.M. A neurotrophic model for stress-related mood disorders. Biol. Psychiatry 2006, 59, 1116–1127. [Google Scholar] [CrossRef]
  10. Eisinger, B.E.; Zhao, X. Identifying molecular mediators of environmentally enhanced neurogenesis. Cell Tissue Res. 2018, 371, 7–21. [Google Scholar] [CrossRef] [PubMed]
  11. Bjorkholm, C.; Monteggia, L.M. BDNF—A key transducer of antidepressant effects. Neuropharmacology 2016, 102, 72–79. [Google Scholar] [CrossRef] [Green Version]
  12. Kozisek, M.E.; Middlemas, D.; Bylund, D.B. Brain-derived neurotrophic factor and its receptor tropomyosin-related kinase B in the mechanism of action of antidepressant therapies. Pharmacol. Ther. 2008, 117, 30–51. [Google Scholar] [CrossRef]
  13. Casarotto, P.C.; Girych, M.; Fred, S.M.; Kovaleva, V.; Moliner, R.; Enkavi, G.; Biojone, C.; Cannarozzo, C.; Sahu, M.P.; Kaurinkoski, K.; et al. Antidepressant drugs act by directly binding to TRKB neurotrophin receptors. Cell 2021, 184, 1299–1313.e19. [Google Scholar] [CrossRef]
  14. Pino, A.; Fumagalli, G.; Bifari, F.; Decimo, I. New neurons in adult brain: Distribution, molecular mechanisms and therapies. Biochem. Pharmacol. 2017, 141, 4–22. [Google Scholar] [CrossRef] [PubMed]
  15. Bifari, F.; Berton, V.; Pino, A.; Kusalo, M.; Malpeli, G.; Di Chio, M.; Bersan, E.; Amato, E.; Scarpa, A.; Krampera, M.; et al. Meninges harbor cells expressing neural precursor markers during development and adulthood. Front. Cell Neurosci. 2015, 9, 383. [Google Scholar] [CrossRef] [PubMed] [Green Version]
  16. Decimo, I.; Dolci, S.; Panuccio, G.; Riva, M.; Fumagalli, G.; Bifari, F. Meninges: A Widespread Niche of Neural Progenitors for the Brain. Neuroscientist 2021, 5, 506–528. [Google Scholar] [CrossRef] [PubMed]
  17. Dolci, S.; Pino, A.; Berton, V.; Gonzalez, P.; Braga, A.; Fumagalli, M.; Bonfanti, E.; Malpeli, G.; Pari, F.; Zorzin, S.; et al. High Yield of Adult Oligodendrocyte Lineage Cells Obtained from Meningeal Biopsy. Front. Pharmacol. 2017, 8, 703. [Google Scholar] [CrossRef] [Green Version]
  18. Bifari, F.; Decimo, I.; Chiamulera, C.; Bersan, E.; Malpeli, G.; Johansson, J.; Lisi, V.; Bonetti, B.; Fumagalli, G.; Pizzolo, G.; et al. Novel stem/progenitor cells with neuronal differentiation potential reside in the leptomeningeal niche. J. Cell Mol. Med. 2009, 13, 3195–3208. [Google Scholar] [CrossRef] [Green Version]
  19. Bifari, F.; Dolci, S.; Bottani, E.; Pino, A.; di Chio, M.; Zorzin, S.; Ragni, M.; Zamfir, R.G.; Brunetti, D.; Bardelli, D.; et al. Complete neural stem cell (NSC) neuronal differentiation requires a branched chain amino acids-induced persistent metabolic shift towards energy metabolism. Pharmacol. Res. 2020, 158, 104863. [Google Scholar] [CrossRef]
  20. Bifari, F.; Decimo, I.; Pino, A.; Llorens-Bobadilla, E.; Zhao, S.; Lange, C.; Panuccio, G.; Boeckx, B.; Thienpont, B.; Vinckier, S.; et al. Neurogenic Radial Glia-like Cells in Meninges Migrate and Differentiate into Functionally Integrated Neurons in the Neonatal Cortex. Cell Stem Cell 2017, 20, 360–373.e7. [Google Scholar] [CrossRef] [Green Version]
  21. Dang, T.C.; Ishii, Y.; Nguyen, V.; Yamamoto, S.; Hamashima, T.; Okuno, N.; Nguyen, Q.L.; Sang, Y.; Ohkawa, N.; Saitoh, Y.; et al. Powerful Homeostatic Control of Oligodendroglial Lineage by PDGFRalpha in Adult Brain. Cell Rep. 2019, 27, 1073–1089.e5. [Google Scholar] [CrossRef] [PubMed] [Green Version]
  22. Nakagomi, T.; Molnar, Z.; Nakano-Doi, A.; Taguchi, A.; Saino, O.; Kubo, S.; Clausen, M.; Yoshikawa, H.; Nakagomi, N.; Matsuyama, T. Ischemia-induced neural stem/progenitor cells in the pia mater following cortical infarction. Stem Cells Dev. 2011, 20, 2037–2051. [Google Scholar] [CrossRef] [PubMed]
  23. Day-Lollini, P.A.; Stewart, G.R.; Taylor, M.J.; Johnson, R.M.; Chellman, G.J. Hyperplastic Changes within the Leptomeninges of the Rat and Monkey in Response to Chronic Intracerebroventricular Infusion of Nerve Growth Factor. Exp. Neurol. 1997, 145, 24–37. [Google Scholar] [CrossRef]
  24. Parr, A.M.; Tator, C.H.; Keating, A. Bone marrow-derived mesenchymal stromal cells for the repair of central nervous system injury. Bone Marrow Transpl. 2007, 40, 609–619. [Google Scholar] [CrossRef]
  25. Decimo, I.; Bifari, F.; Rodriguez, F.J.; Malpeli, G.; Dolci, S.; Lavarini, V.; Pretto, S.; Vasquez, S.; Sciancalepore, M.; Montalbano, A.; et al. Nestin- and doublecortin-positive cells reside in adult spinal cord meninges and participate in injury-induced parenchymal reaction. Stem Cells 2011, 29, 2062–2076. [Google Scholar] [CrossRef] [PubMed] [Green Version]
  26. Kempermann, G.; Kuhn, H.G.; Gage, F.H. More hippocampal neurons in adult mice living in an enriched environment. Nature 1997, 386, 493–495. [Google Scholar] [CrossRef]
  27. Zhou, Q.G.; Lee, D.; Ro, E.J.; Suh, H. Regional-specific effect of fluoxetine on rapidly dividing progenitors along the dorsoventral axis of the hippocampus. Sci. Rep. 2016, 6, 35572. [Google Scholar] [CrossRef] [Green Version]
  28. Kempermann, G. Environmental enrichment, new neurons and the neurobiology of individuality. Nat. Rev. Neurosci. 2019, 20, 235–245. [Google Scholar] [CrossRef]
  29. Young, D.; Lawlor, P.A.; Leone, P.; Dragunow, M.; During, M.J. Environmental enrichment inhibits spontaneous apoptosis, prevents seizures and is neuroprotective. Nat. Med. 1999, 5, 448–453. [Google Scholar] [CrossRef]
  30. Mercier, F. Fractones: Extracellular matrix niche controlling stem cell fate and growth factor activity in the brain in health and disease. Cell Mol. Life Sci. 2016, 73, 4661–4674. [Google Scholar] [CrossRef]
  31. Ziv, Y.; Ron, N.; Butovsky, O.; Landa, G.; Sudai, E.; Greenberg, N.; Cohen, H.; Kipnis, J.; Schwartz, M. Immune cells contribute to the maintenance of neurogenesis and spatial learning abilities in adulthood. Nat. Neurosci. 2006, 9, 268–275. [Google Scholar] [CrossRef]
  32. Mori, T.; Tanaka, K.; Buffo, A.; Wurst, W.; Kuhn, R.; Gotz, M. Inducible gene deletion in astroglia and radial glia—A valuable tool for functional and lineage analysis. Glia 2006, 54, 21–34. [Google Scholar] [CrossRef] [Green Version]
  33. Nakamura, T.; Colbert, M.C.; Robbins, J. Neural crest cells retain multipotential characteristics in the developing valves and label the cardiac conduction system. Circ. Res. 2006, 98, 1547–1554. [Google Scholar] [CrossRef] [Green Version]
  34. Balcombe, J.; Barnard, N.; Sandusky, C. Laboratory Routines Cause Animal Stress. Contemp. Top. Lab. Anim. Sci. 2004, 6, 42–51. [Google Scholar]
  35. Bonnichsen, M.; Dragsted, N.; Hansen, A.K. The welfare impact of gavaging laboratory rats. Anim. Welf. 2005, 14, 223–227. [Google Scholar]
  36. Brown, A.P.; Dinger, N.; Levine, B.S. Stress Produced by Gavage Administration in the Rat. Contemp. Top. Lab. Anim. Sci. 2000, 39, 17–21. [Google Scholar] [PubMed]
  37. Cazorla, M.; Premont, J.; Mann, A.; Girard, N.; Kellendonk, C.; Rognan, D. Identification of a low-molecular weight TrkB antagonist with anxiolytic and antidepressant activity in mice. J. Clin. Investig. 2011, 121, 1846–1857. [Google Scholar] [CrossRef] [PubMed] [Green Version]
  38. Moy, J.K.; Szabo-Pardi, T.; Tillu, D.V.; Megat, S.; Pradhan, G.; Kume, M.; Asiedu, M.N.; Burton, M.D.; Dussor, G.; Price, T.J. Temporal and sex differences in the role of BDNF/TrkB signaling in hyperalgesic priming in mice and rats. Neurobiol. Pain 2019, 5, 100024. [Google Scholar] [CrossRef]
  39. Tomassoni-Ardori, F.; Fulgenzi, G.; Becker, J.; Barrick, C.; Palko, M.E.; Kuhn, S.; Koparde, V.; Cam, M.; Yanpallewar, S.; Oberdoerffer, S.; et al. Rbfox1 up-regulation impairs BDNF-dependent hippocampal LTP by dysregulating TrkB isoform expression levels. eLife 2019, 8, e49673. [Google Scholar] [CrossRef]
  40. Formaggio, E.; Fazzini, F.; Dalfini, A.C.; di Chio, M.; Cantu, C.; Decimo, I.; Fiorini, Z.; Fumagalli, G.; Chiamulera, C. Nicotine increases the expression of neurotrophin receptor tyrosine kinase receptor A in basal forebrain cholinergic neurons. Neuroscience 2010, 166, 580–589. [Google Scholar] [CrossRef]
  41. Meeker, R.B.; Williams, K.S. The p75 neurotrophin receptor: At the crossroad of neural repair and death. Neural Regen. Res. 2015, 10, 721–725. [Google Scholar] [CrossRef]
  42. Khodanovich, M.; Kisel, A.; Kudabaeva, M.; Chernysheva, G.; Smolyakova, V.; Krutenkova, E.; Wasserlauf, I.; Plotnikov, M.; Yarnykh, V. Effects of Fluoxetine on Hippocampal Neurogenesis and Neuroprotection in the Model of Global Cerebral Ischemia in Rats. Int. J. Mol. Sci. 2018, 19, 162. [Google Scholar] [CrossRef] [Green Version]
  43. Kraeuter, A.K.; Guest, P.C.; Sarnyai, Z. Object Burying Test for Assessment of Obsessive Compulsive Behaviors in Mice. Methods Mol. Biol. 2019, 1916, 81–85. [Google Scholar]
  44. De Brouwer, G.; Fick, A.; Harvey, B.H.; Wolmarans, W. A critical inquiry into marble-burying as a preclinical screening paradigm of relevance for anxiety and obsessive-compulsive disorder: Mapping the way forward. Cogn. Affect. Behav. Neurosci. 2019, 19, 1–39. [Google Scholar] [CrossRef] [PubMed] [Green Version]
  45. Sohur, U.S.; Emsley, J.G.; Mitchell, B.D.; Macklis, J.D. Adult neurogenesis and cellular brain repair with neural progenitors, precursors and stem cells. Philos. Trans. R. Soc. Lond B Biol. Sci. 2006, 361, 1477–1497. [Google Scholar] [CrossRef] [PubMed]
  46. Ming, G.L.; Song, H. Adult neurogenesis in the mammalian brain: Significant answers and significant questions. Neuron 2011, 70, 687–702. [Google Scholar] [CrossRef] [PubMed] [Green Version]
  47. Kumar, M.; Csaba, Z.; Peineau, S.; Srivastava, R.; Rasika, S.; Mani, S.; Gressens, P.; El Ghouzzi, V. Endogenous cerebellar neurogenesis in adult mice with progressive ataxia. Ann. Clin. Transl. Neurol. 2014, 1, 968–981. [Google Scholar] [CrossRef] [Green Version]
  48. Nakagomi, T.; Molnar, Z.; Taguchi, A.; Nakano-Doi, A.; Lu, S.; Kasahara, Y.; Nakagomi, N.; Matsuyama, T. Leptomeningeal-derived doublecortin-expressing cells in poststroke brain. Stem Cells Dev. 2012, 21, 2350–2354. [Google Scholar] [CrossRef] [Green Version]
  49. Slaker, M.; Barnes, J.; Sorg, B.A.; Grimm, J.W. Impact of Environmental Enrichment on Perineuronal Nets in the Prefrontal Cortex following Early and Late Abstinence from Sucrose Self-Administration in Rats. PLoS ONE 2016, 11, e0168256. [Google Scholar] [CrossRef] [PubMed] [Green Version]
  50. Kerever, A.; Schnack, J.; Vellinga, D.; Ichikawa, N.; Moon, C.; Arikawa-Hirasawa, E.; Efird, J.T.; Mercier, F. Novel extracellular matrix structures in the neural stem cell niche capture the neurogenic factor fibroblast growth factor 2 from the extracellular milieu. Stem Cells 2007, 25, 2146–2157. [Google Scholar] [CrossRef]
  51. Bergami, M.; Rimondini, R.; Santi, S.; Blum, R.; Götz, M.; Canossa, M. Deletion of TrkB in adult progenitors alters newborn neuron integration into hippocampal circuits and increases anxiety-like behavior. PNAS 2008, 105, 15570–15575. [Google Scholar] [CrossRef] [Green Version]
  52. Benedetti, B.; Dannehl, D.; Konig, R.; Coviello, S.; Kreutzer, C.; Zaunmair, P.; Jakubecova, D.; Weiger, T.M.; Aigner, L.; Nacher, J.; et al. Functional Integration of Neuronal Precursors in the Adult Murine Piriform Cortex. Cereb. Cortex 2020, 30, 1499–1515. [Google Scholar] [CrossRef] [PubMed] [Green Version]
  53. La Rosa, C.; Ghibaudi, M.; Bonfanti, L. Newly Generated and Non-Newly Generated “Immature” Neurons in the Mammalian Brain: A Possible Reservoir of Young Cells to Prevent Brain Aging and Disease? J. Clin. Med. 2019, 8, 685. [Google Scholar] [CrossRef] [Green Version]
  54. La Rosa, C.; Cavallo, F.; Pecora, A.; Chincarini, M.; Ala, U.; Faulkes, C.G.; Nacher, J.; Cozzi, B.; Sherwood, C.C.; Amrein, I.; et al. Phylogenetic variation in cortical layer II immature neuron reservoir of mammals. eLife 2020, 9, e55456. [Google Scholar] [CrossRef] [PubMed]
  55. Fuentealba, L.C.; Rompani, S.B.; Parraguez, J.I.; Obernier, K.; Romero, R.; Cepko, C.L.; Alvarez-Buylla, A. Embryonic Origin of Postnatal Neural Stem Cells. Cell 2015, 161, 1644–1655. [Google Scholar] [CrossRef] [Green Version]
  56. Jhaveri, D.J.; O’Keeffe, I.; Robinson, G.J.; Zhao, Q.Y.; Zhang, Z.H.; Nink, V.; Narayanan, R.K.; Osborne, G.W.; Wray, N.R.; Bartlett, P.F. Purification of neural precursor cells reveals the presence of distinct, stimulus-specific subpopulations of quiescent precursors in the adult mouse hippocampus. J. Neurosci. 2015, 35, 8132–8144. [Google Scholar] [CrossRef] [PubMed] [Green Version]
  57. Ottone, C.; Krusche, B.; Whitby, A.; Clements, M.; Quadrato, G.; Pitulescu, M.E.; Adams, R.H.; Parrinello, S. Direct cell-cell contact with the vascular niche maintains quiescent neural stem cells. Nat. Cell Biol. 2014, 16, 1045–1056. [Google Scholar] [CrossRef] [Green Version]
  58. Luzzati, F.; Nato, G.; Oboti, L.; Vigna, E.; Rolando, C.; Armentano, M.; Bonfanti, L.; Fasolo, A.; Peretto, P. Quiescent neuronal progenitors are activated in the juvenile guinea pig lateral striatum and give rise to transient neurons. Development 2014, 141, 4065–4075. [Google Scholar] [CrossRef] [Green Version]
  59. Paredes, M.F.; James, D.; Gil-Perotin, S.; Kim, H.; Cotter, J.A.; Ng, C.; Sandoval, K.; Rowitch, D.H.; Xu, D.; McQuillen, P.S.; et al. Extensive migration of young neurons into the infant human frontal lobe. Science 2016, 354, aaf7073. [Google Scholar] [CrossRef] [Green Version]
  60. Kempermann, G. A Back Door to Cortical Development. Cell Stem Cell 2017, 20, 295–296. [Google Scholar] [CrossRef] [Green Version]
  61. Lopez, M.F.; Laber, K. Impact of social isolation and enriched environment during adolescence on voluntary ethanol intake and anxiety in C57BL/6J mice. Physiol. Behav. 2015, 148, 151–156. [Google Scholar] [CrossRef] [Green Version]
  62. Baek, I.S.; Park, J.Y.; Han, P.L. Chronic Antidepressant Treatment in Normal Mice Induces Anxiety and Impairs Stress-coping Ability. Exp. Neurobiol. 2015, 24, 156–168. [Google Scholar] [CrossRef] [PubMed] [Green Version]
  63. Schindelin, J.; Arganda-Carreras, I.; Frise, E.; Kaynig, V.; Longair, M.; Pietzsch, T.; Preibisch, S.; Rueden, C.; Saalfeld, S.; Schmid, B.; et al. Fiji: An open-source platform for biological-image analysis. Nat. Methods 2012, 9, 676–682. [Google Scholar] [CrossRef] [PubMed] [Green Version]
  64. Livak, K.J.; Schmittgen, T.D. Analysis of relative gene expression data using real-time quantitative PCR and the 2(-Delta Delta C(T)) Method. Methods 2001, 25, 402–408. [Google Scholar] [CrossRef] [PubMed]
Figure 1. The meningeal niche is responsive to enriched environment exposure. (A) Schematic representation of the experimental design used for EE exposure. (B) Scheme depicting the sagittal section of the mouse brain, highlighting the specific regions where brain external meninges were analyzed. (C) Sagittal brain section of CD1 mice with laminin (red) identifying the brain meninges. White dashed lines delineate the dentate gyrus (DG) area used for quantification. (D) Sagittal brain section of CD1 mice showing hippocampal Ki67+ (green) cells in non-treated (CTRL) and treated (EE) animals. A white box highlights a DG zone, reported as a magnification on the right panel. (E) Graph showing the number of Ki67+ cells per mm2 of the DG in the CTRL and EE animals. (F) Sagittal brain sections of CD1 mice showing hippocampal DCX+ (red) cells in the CTRL and EE mice. A white box highlights a DG zone reported as a magnification on the right panel. (G) Graph showing the number of DCX+ cells per mm2 of the DG in the CTRL and EE animals. (H) Sagittal brain sections of CD1 mice showing GLAST+ (red) cells above the meningeal basal lamina (green) in the CTRL and EE mice. An insert illustrates a panoramic image where the single-cell level image was taken. (I) Sagittal brain sections of CD1 mice showing β3-Tubulin+ (red) cells above the meningeal basal lamina (green) in the CTRL and EE mice. An insert illustrates a panoramic image where the single-cell level image was taken. (J) Graph showing the number of GLAST+ cells in 2 mm of the retrosplenial brain meninges of the CTRL and EE animals. (K) Graph showing the number of β3-Tubulin+ cells in 2 mm of the retrosplenial brain meninges of the CTRL and EE animals. (L) Representative western blot analysis of mouse brain protein extracts, which shows the presence of TrkB and β3-Tubulin proteins in both the mouse meningeal samples and the hippocampal samples. (M) Graph showing TrkB+/β3-Tubulin+ and Trkb+/β3-Tubunlin cells in 2 mm of the retrosplenial brain meninges of the CTRL and EE animals. (N) Sagittal brain sections of CD1 mice showing TrkB+ (red) cells above the meningeal basal lamina (green) in the CTRL and EE mice. An insert illustrates a panoramic image where the single-cell level image was taken. (O) Sagittal brain section of CD1 mice exposed to an EE showing a cell double positive for β3-Tubulin (red) and TrkB (white) above the meningeal basal lamina (green). A white box highlights a double positive cell, reported as a magnification on the right panel. (P) Sagittal brain sections of CD1 mice showing fractones (*) identified via laminin (green) staining in the retrosplenial brain meninges of the CTRL and EE mice. An insert illustrates laminin staining (fractones) below the meningeal nuclei (TOPRO-3). (Q) Sagittal brain sections of CD1 mice showing CD68+ (red) cells in the brain meninges of the CTRL and EE mice. The meninges are delineated using white dashes. (R) Graph showing the number of fractones in 2 mm of the retrosplenial brain meninges of the CTRL and EE animals. (S) Graph showing the number of CD68+ cells in 2 mm of the retrosplenial brain meninges of the CTRL and EE animals. Data are presented as the mean ± SEM. * p value ≤ 0.05. ** p value ≤ 0.01. *** p value ≤ 0.001. **** p value ≤ 0.0001. In (C,D,F,H,I,NQ), the nuclei are in blue (TOPRO-3 nuclear staining). (C,O,Q) are single-plane confocal images. (D,F,H,I,N,P) are the maximum intensity projections of the z-stack confocal images. The scale bars represent 500 µm (C), 20 µm in the magnified pictures (D,F,H,I,N,O,P,Q) and 100 µm in the panoramic anchor images (H,I,N). White arrows indicate positive cells, while asterisks indicate fractones.
Ijms 22 10657 g001
Figure 2. Lineage tracing confirms the radial glial origin of the EE-induced immature neurons. (A) Schematic representation of the experimental design used for EE exposure for the GLAST-GFP mice. (B) Scheme depicting the sagittal section of a mouse brain, highlighting the specific regions where the brain external meninges were analyzed. (C) Sagittal brain section of GLAST-GFP mice, showing hippocampal DCX+ (red) cells in the CTRL and EE mice. (D) Graph showing the number of DCX+ cells per mm2 of the dentate gyri (DG) in the CTRL and EE animals. (E) Sagittal brain section of the GLAST-GFP CTRL mice, with laminin (red) identifying the brain meninges and GFP (green) identifying the transgene expression. (F) Sagittal brain section of the GLAST-GFP mice, showing GFP+ (green) cells above the meningeal basal lamina identified via laminin (red) staining. A white box highlights the GFP-positive cells, reported as split channels on the lower panel. (G) Graphs showing GFP+/β3-Tubulin+ and GFP+/β3-Tubulin cells (left) and GFP+/TrkB+ and GFP+/TrkB cells (right). (H) Sagittal brain section of the GLAST-GFP CTRL mice, showing a cell only positive for GFP (green). White dashes delineate the meninges. (I) Sagittal brain section of the GLAST-GFP mice, showing a cell positive for both β3-Tubulin (red) and GFP (green) in the EE mice. A white box highlights a double positive cell reported as split channels on the right. White dashes delineate the meninges. (J) Graph showing the β3-Tubulin+/GFP+ and β3-Tubulin+/GFP cells in 2 mm of the retrosplenial brain meninges of the CTRL and EE animals. (K) Sagittal brain section of the GLAST-GFP CTRL mice, showing a cell only positive for GFP (green). White dashes delineate the meninges. (L) Sagittal brain section of the GLAST-GFP mice, showing a cell positive for both TrkB (red) and GFP (green) in the EE mice. A white box highlights a double positive cell reported as split channels on the right. White dashes delineate the meninges. (M) Graph showing the TrkB+/GFP+ and TrkB+/GFP cells in 2 mm of the retrosplenial brain meninges of the CTRL and EE animals. Data are presented as the mean ± SEM. * p value ≤ 0.05. ** p value ≤ 0.01. In (C,E,F,H,I,K,L), the nuclei are in blue (TOPRO-3 nuclear staining). (E,F) are single-plane confocal images. (C,H,I,K,L) are maximum-intensity projections of z-stack confocal images. The scale bars represent 20 µm in pictures (C,F,H,I,K,L) and 500 µm in (E). White arrows indicate positive cells.
Ijms 22 10657 g002
Figure 3. ANA-12 inhibits hippocampal neurogenesis and impacts BDNF-TrkB signaling in the meninges. (A) Schematic representation of the experimental design used for EE exposure and TrkB inhibitor ANA-12 administration in CD1 mice. (B) Sagittal brain sections of CD1 mice, showing hippocampal DCX+ (red) cells in animals exposed to the EE and administered only the vehicle (EE VEH) and animals exposed to the EE and administered with the TrkB inhibitor ANA-12 (EE ANA-12). A white box highlights a dentate gyrus (DG) zone, reported as a magnification on the right panel. (C) Graph showing the number of DCX+ cells per mm2 of the DG in animals subjected to the EE or not and administered with the vehicle or ANA-12 (NO EE VEH, EE VEH, EE ANA-12 and NO EE ANA-12). (D) Graph depicting gene expression analysis for ntrk2 (TrkB) in NO EE VEH, EE VEH and EE ANA-12 samples. Expression levels are reported as the log2 fold change with respect to NO EE VEH. (E) Graph depicting gene expression analysis for BDNF in NO EE VEH, EE VEH and EE ANA-12 mice. Expression levels are reported as the log2 fold change with respect to the NO EE VEH mice. (F) Graph showing the differential fold change in protein expression for the p75 protein in NO EE VEH, EE VEH and EE ANA-12 mice with respect to the NO EE VEH samples (left panel). A representative western blot analysis of the mouse brain meningeal protein extracts shows the presence of TrkB and p75 proteins in the EE VEH, EE ANA-12 and NO EE VEH samples (right). In the EE VEH samples, one additional TrkB protein isoform was identified. Data are presented as the mean ± SEM. * p value ≤ 0.05. ** p value ≤ 0.01. In (B), the nuclei are in blue (TOPRO-3 nuclear staining). (B) shows the maximum intensity projections of the z-stack confocal images. The scale bars represent 20 µm.
Ijms 22 10657 g003
Figure 4. ANA-12 administration reverts EE-induced changes in the meningeal niche. (A) Sagittal brain sections of the CD1 mice, showing GLAST+ (red) cells above the meningeal basal lamina (green) in the EE VEH and EE ANA-12 mice. (B) Sagittal brain sections of the CD1 mice, showing β3-Tubulin+ (red) cells above the meningeal basal lamina (green) in the EE VEH and EE ANA-12 mice. (C) Graph showing the number of GLAST+ cells in 2 mm of the retrosplenial brain meninges of the NO EE VEH, EE VEH, EE ANA-12 and NO EE ANA-12 animals. (D) Graph showing the number of β3-Tubulin+ cells in 2 mm of the retrosplenial brain meninges of the NO EE VEH, EE VEH, EE ANA-12 and NO EE ANA-12 animals. (E) Graph depicting gene expression analysis for Slc1a3 (GLAST) in the NO EE VEH, EE VEH and EE ANA-12 mice. Expression levels are reported as the log2 fold change with respect to the NO EE VEH mice. (F) Graph depicting gene expression analysis for TUBB3 (β3-Tubulin) in the NO EE VEH, EE VEH and EE ANA-12 mice. Expression levels are reported as the log2 fold change with respect to the NO EE VEH mice. (G) Representative western blot analysis of mouse brain meningeal protein extracts, which shows the presence of the DCX protein in the EE VEH, EE ANA-12 and NO EE VEH samples (left panel). The graph shows the differential fold change in protein expression for the DCX protein in the NO EE VEH, EE VEH and EE ANA-12 mice with respect to the NO EE VEH mice (right panel). (H) Sagittal brain sections of the CD1 mice, showing fractones (*) identified via laminin (green) staining in the brain meninges of EE VEH and EE ANA-12 mice. An insert illustrates laminin staining (fractones) below the meningeal nuclei (TOPRO-3). (I) Graph showing the number of CD68+ cells in 2 mm of the retrosplenial brain meninges of the NO EE VEH, EE VEH, EE ANA-12 and NO EE ANA-12 animals. (J) Sagittal brain sections of the CD1 mice showing CD68+ (red) cells in the brain meninges of the EE VEH and EE ANA-12 mice. (K) Graph showing the number of fractones in 2 mm of the retrosplenial brain meninges of the NO EE VEH, EE VEH, EE ANA-12 and NO EE ANA-12 animals. Data are presented as the mean ± SEM, and n.s. = not statistically significant. * p value ≤ 0.05. ** p value ≤ 0.01. *** p value ≤ 0.001. In (A,B,H,J), the nuclei are in blue (TOPRO-3 nuclear staining). (J) is a single-plane confocal images. (A,B,H) are the maximum intensity projections of the z-stack confocal images. The scale bars represent 20 µm. White arrows indicate positive cells, while asterisks indicate fractones.
Ijms 22 10657 g004
Figure 5. The meningeal niche responds to fluoxetine treatment. (A) Schematic representation of the experimental design used for fluoxetine administration. (B) Schematic representation of behavioral testing for OCD-like behavior via the marble burying test (MBT). (C) Graph showing the percentage of marbles buried by treated (FLUOX) and non-treated (CTRL) animals. (D,E) Sagittal brain sections of the CD1 mice, showing the presence of Ki67+ cells (green) and DCX+ cells (red) in the hippocampal dentate gyri (DGs) in the CTRL and FLUOX animals. A white box highlights a DG zone reported as a magnification on the right panel. (F) Graph showing the number of Ki67+ cells per mm2 of DG in the CTRL and FLUOX animals. (G) Graph showing the number of DCX+ cells per mm2 of DG in the CTRL and FLUOX animals. (H) Sagittal brain section of the CD1 mice, showing the brain meningeal nuclei and meningeal basal laminin (green) in a FLUOX animal. (I) Sagittal brain section of CD1 mice, showing a brain meningeal Ki67+ (green) cell in a FLUOX animal. The meninges are delineated via white dashes. (J) Sagittal brain sections of CD1 mice, showing brain meningeal GLAST+ cells in the CTRL and FLUOX mice. The meninges are delineated via white dashes. (K) Sagittal brain sections of CD1 mice, showing brain meningeal β3-Tubulin+ (red) cells in the CTRL and FLUOX mice. The meninges are delineated via white dashes. (L) Sagittal brain sections of CD1 mice, showing fractones (*) identified via laminin (green) staining in the brain meninges of the CTRL and FLUOX mice. (M) Sagittal brain sections of CD1 mice, showing brain meningeal CD68+ (red) cells in the CTRL and FLUOX mice. The meninges are delineated via white dashes. (N–S) Graphs showing the number of (N) nuclei, (O) Ki67+ cells, (P) GLAST+ cells, (Q) β3-Tubulin+ cells, (R) fractones and (S) CD68+ cells in 2 mm of the retrosplenial brain meninges of the CTRL and FLUOX animals. Data are presented as the mean ± SEM, and n.s. = not statistically significant. * p value ≤ 0.05. ** p value ≤ 0.01. In (D,E,HK,M), the nuclei are in blue (TOPRO-3 nuclear staining). (HM) are single-plane confocal images. (D,E) are maximum-intensity projections of z-stack confocal images. The scale bars represent 20 µm. White arrows indicate positive cells, while asterisks indicate fractones.
Ijms 22 10657 g005
Table 1. Table representing the number of animals used for the different experimental protocols. M = male mice; N.A. = not applicable; IF = immunofluorescence; WB = western blot; RT-PCR = real-time PCR.
Experimental ProcedureMouse StrainSexAge at Time of SacrificeIFWBRt-PCR
Enriched EnvironmentCD1M8 weeksCTRL n = 5
EE n = 6
N.A.N.A.
Enriched Environment on Lineage Tracing ModelGLAST-GFP [32,33]M9–12 weeksCTRL n = 3
EE n = 4
N.A.N.A.
Enriched Environment with Administration of TrkB Inhibitor ANA-12CD1M8 weeksNO EE VEH n = 3
EE VEH n = 3
EE ANA-12 n = 3
NO EE ANA-12 n = 3
NO EE VEH n = 3
EE VEH n = 2
EE ANA-12 n = 3
NO EE VEH n = 4
EE VEH n = 5
EE ANA-12 n = 5
Fluoxetine AdministrationCD1M 8 weeksCTRL n = 3
FLUOX n = 3
N.A.N.A.
Table 2. Scheme of the toys differentially used to perform the environmental enrichment for the 7-week-old CD1 male mice. An X in a square states that the toy (raw) was present in the cage for that specific day (column). If a cell is empty, it means that the toy (row) was not present for that specific day (column).
ToysDay 1Day 2Day 3Day 4Day 5Day 6Day 7
Running WheelXXXXXXX
Nesting MaterialXXXXXXX
Carboard Rolls X X X
Marbles X XX
Stairs X XX
Table 3. Table reporting the primer sequences for the RT-PCR analysis. TUBB3 is the β3-Tubulin gene, ntrk2 is the TrkB gene, and Slc1a3 is the GLAST gene.
Gene NameForward SequenceReverse Sequence
BDNFCACATTACCTTCCTGCATCTGTTGCTGGTGGAACATTGTGGCTTT
TUBB3ACAATGAGGCCTCCTCTCACATCCATCGTTCCAGGTTCCAA
ntrk2CACACACAGGGCTCCTTAAGGTGGCGCAAAATGCACAGT
Slc1a3CGCGGTGATAATGTGGTATGCGAGGCCGACAATGACTGTCA
GapdhGTCCGTCGTGGATCTGAGATGCCTGCTTCACCACCTT
Publisher’s Note: MDPI stays neutral with regard to jurisdictional claims in published maps and institutional affiliations.

