
Impact of the Pd2Spm (Spermine) Complex on the Metabolism of Triple-Negative Breast Cancer Tumors of a Xenograft Mouse Model

 ,
,  , , , and
Abstract
:1. Introduction
2. Results
3. Discussion
4. Materials and Methods
4.1. Chemicals
4.2. Ethical Considerations
4.3. Animals Handling Procedures
4.4. Tumor Extracts
4.5. NMR Spectroscopy
4.6. Data Processing and Statistical Analysis
5. Conclusions
Supplementary Materials
Author Contributions
Funding
Institutional Review Board Statement
Informed Consent Statement
Data Availability Statement
Acknowledgments
Conflicts of Interest
References
- Sung, H.; Ferlay, J.; Siegel, R.L.; Laversanne, M.; Soerjomataram, I.; Jemal, A.; Bray, F. Global Cancer Statistics 2020: GLOBOCAN Estimates of Incidence and Mortality Worldwide for 36 Cancers in 185 Countries. CA Cancer J. Clin. 2021, 71, 209–249. [Google Scholar] [CrossRef] [PubMed]
- World Health Organization, Breast Cancer Page. Available online: https://www.who.int/news-room/fact-sheets/detail/breast-cancer (accessed on 26 August 2021).
- Ferlay, J.; Ervik, M.; Lam, F.; Colombet, M.; Mery, L.; Piñeros, M.; Znaor, A.; Soerjomataram, I.; Bray, F. Global Cancer Observatory: Cancer Today. Lyon, France: International Agency for Research on Cancer. Int. J. Cancer 2019, 144, 1941–1953. Available online: https://gco.iarc.fr/today/home (accessed on 26 August 2021). [CrossRef] [PubMed] [Green Version]
- Cancer Research UK, Worldwide Cancer Incidence Statistics Page. Available online: https://www.cancerresearchuk.org/health-professional/cancer-statistics/worldwide-cancer/incidence#heading-One (accessed on 26 August 2021).
- Rahib, L.; Wehner, M.R.; Matrisian, L.M.; Nead, K.T. Estimated Projection of US Cancer Incidence and Death to 2040. JAMA Netw. Open 2021, 4, e214708. [Google Scholar] [CrossRef] [PubMed]
- Watkins, E.J. Overview of breast cancer. J. Am. Acad. PAs 2019, 32, 13–17. [Google Scholar] [CrossRef] [PubMed] [Green Version]
- Perou, C.; Sørlie, T.; Eisen, M.; van de Rijn, J.S.S.; Rees, C.A.; Pollack, J.R.; Ross, D.T.; Johnsen, H.; Akslen, L.A.; Fluge, Ø.; et al. Molecular portraits of human breast tumours. Nature 2000, 406, 747–752. [Google Scholar] [CrossRef]
- Sørlie, T.; Perou, C.M.; Tibshirani, R.; Aas, T.; Geisler, S.; Johnsen, H.; Hastie, T.; Eisen, M.B.; van de Rijn, J.S.S.; Thorsen, T.; et al. Gene expression patterns of breast carcinomas distinguish tumor subclasses with clinical implications. Proc. Natl. Acad. Sci. USA 2001, 98, 10869–10874. [Google Scholar] [CrossRef] [Green Version]
- Kumar, P.; Aggarwal, R. An overview of triple-negative breast cancer. Arch. Gynecol. Obstet. 2016, 293, 247–269. [Google Scholar] [CrossRef]
- Yin, L.; Duan, J.J.; Bian, X.W.; Yu, S.C. Triple-negative breast cancer molecular subtyping and treatment progress. Breast Cancer Res. 2020, 22, 61. [Google Scholar] [CrossRef]
- Isakoff, S.J. Triple-negative breast cancer: Role of specific chemotherapy agents. Cancer J. 2010, 16, 53–61. [Google Scholar] [CrossRef] [PubMed] [Green Version]
- Pandy, J.G.P.; Balolong-Garcia, J.C.; Cruz-Ordinario, M.V.B.; Que, F.V.F. Triple negative breast cancer and platinum-based systemic treatment: A meta-analysis and systematic review. BMC Cancer 2019, 19, 1065. [Google Scholar] [CrossRef] [Green Version]
- Pralea, I.-E.; Moldovan, R.-C.; Țigu, A.-B.; Ionescu, C.; Iuga, C.-A. Mass Spectrometry-Based Omics for the Characterization of Triple-Negative Breast Cancer Bio-Signature. J. Pers. Med. 2020, 10, 277. [Google Scholar] [CrossRef] [PubMed]
- Dasari, S.; Tchounwou, P.B. Cisplatin in cancer therapy: Molecular mechanisms of action. Eur. J. Pharmacol. 2014, 740, 364–378. [Google Scholar] [CrossRef] [PubMed] [Green Version]
- Rebucci, M.; Michiels, C. Molecular aspects of cancer cell resistance to chemotherapy. Biochem. Pharmacol. 2013, 85, 1219–1226. [Google Scholar] [CrossRef] [PubMed]
- Oun, R.; Moussa, Y.E.; Wheate, N.J. The side effects of platinum-based chemotherapy drugs: A review for chemists. Dalton Trans. 2018, 47, 6645–6653. [Google Scholar] [CrossRef] [PubMed]
- Khosravi-Shahi, P.; Cabezón-Gutiérrez, L.; Custodio-Cabello, S. Metastatic triple negative breast cancer: Optimizing treatment options, new and emerging targeted therapies. Asia-Pac. J. Clin. Oncol. 2018, 14, 32–39. [Google Scholar] [CrossRef] [PubMed] [Green Version]
- Medina, M.A.; Oza, G.; Sharma, A.; Arriaga, L.G.; Hernández Hernández, J.M.; Rotello, V.M.; Ramirez, J.T. Triple-Negative Breast Cancer: A Review of Conventional and Advanced Therapeutic Strategies. Int. J. Environ. Res. Public Health 2020, 20, 2078. [Google Scholar] [CrossRef] [PubMed] [Green Version]
- Sun, X.; Wang, M.; Wang, M.; Yu, X.; Guo, J.; Sun, T.; Li, X.; Yao, L.; Dong, H.; Xu, Y. Metabolic Reprogramming in Triple-Negative Breast Cancer. Front. Oncol. 2020, 10, 428. [Google Scholar] [CrossRef] [PubMed]
- Beatty, A.; Fink, L.S.; Singh, T.; Strigun, A.; Peter, E.; Ferrer, C.M.; Nicolas, E.; Cai, K.Q.; Moran, T.P.; Reginato, M.J.; et al. Metabolite Profiling Reveals the Glutathione Biosynthetic Pathway as a Therapeutic Target in Triple-Negative Breast Cancer. Mol. Cancer Ther. 2018, 17, 264–275. [Google Scholar] [CrossRef] [PubMed] [Green Version]
- Winnike, J.H.; Stewart, D.A.; Pathmasiri, W.W.; McRitchie, S.L.; Sumner, S.J. Stable Isotope-Resolved Metabolomic Differences between Hormone-Responsive and Triple-Negative Breast Cancer Cell Lines. Int. J. Breast Cancer 2018, 30, 2063540. [Google Scholar] [CrossRef]
- Gao, J.; Guo, Z.; Cheng, J.; Sun, B.; Yang, J.; Li, H.; Wu, S.; Dong, F.; Yan, X. Differential metabolic responses in breast cancer cell lines to acidosis and lactic acidosis revealed by stable isotope assisted metabolomics. Sci. Rep. 2020, 10, 21967. [Google Scholar] [CrossRef]
- Ghanbari, F.; Fortier, A.-M.; Park, M.; Philip, A. Cholesterol-Induced Metabolic Reprogramming in Breast Cancer Cells Is Mediated via the ERRα Pathway. Cancers 2021, 13, 2605. [Google Scholar] [CrossRef]
- Willmann, L.; Schlimpert, M.; Hirschfeld, M.; Erbes, T.; Neubauer, H.; Stickeler, E.; Kammerer, B. Alterations of the exo- and endometabolite profiles in breast cancer cell lines: A mass spectrometry-based metabolomics approach. Anal. Chim. Acta 2016, 925, 34–42. [Google Scholar] [CrossRef]
- Kou, F.; Zhu, B.; Zhou, W.; Lv, C.; Cheng, Y.; Wei, H. Targeted metabolomics reveals dynamic portrayal of amino acids and derivatives in triple-negative breast cancer cells and culture media. Mol. Omics 2021, 17, 142–152. [Google Scholar] [CrossRef]
- Stewart, D.A.; Winnike, J.H.; McRitchie, S.L.; Clark, R.F.; Pathmasiri, W.W.; Sumner, S.J. Metabolomics Analysis of Hormone-Responsive and Triple-Negative Breast Cancer Cell Responses to Paclitaxel Identify Key Metabolic Differences. J. Proteome Res. 2016, 15, 3225–3240. [Google Scholar] [CrossRef] [PubMed]
- Jose, J.; Tavares, C.D.J.; Ebelt, N.D.; Lodi, A.; Edupuganti, R.; Xie, X.; Devkota, A.K.; Kaoud, T.S.; Van Den Berg, C.L.; Anslyn, E.V.; et al. Serotonin Analogues as Inhibitors of Breast Cancer Cell Growth. ACS Med. Chem. Lett. 2017, 8, 1072–1076. [Google Scholar] [CrossRef]
- Maria, R.M.; Altei, W.F.; Selistre-de-Araujo, H.S.; Colnago, L.A. Impact of chemotherapy on metabolic reprogramming: Characterization of the metabolic profile of breast cancer MDA-MB-231 cells using 1H HR-MAS NMR spectroscopy. J. Pharm. Biomed. Anal. 2017, 146, 324–328. [Google Scholar] [CrossRef] [PubMed] [Green Version]
- Gowda, G.A.N.; Barding, G.A., Jr.; Dai, J.; Gu, H.; Margineantu, D.H.; Hockenbery, D.M.; Raftery, D. A Metabolomics Study of BPTES Altered Metabolism in Human Breast Cancer Cell Lines. Front. Mol. Biosci. 2018, 5, 49. [Google Scholar] [CrossRef] [PubMed]
- Abu El Maaty, M.A.; Dabiri, Y.; Almouhanna, F.; Blagojevic, B.; Theobald, J.; Büttner, M.; Wölfl, S. Activation of pro-survival metabolic networks by 1,25(OH)2D3 does not hamper the sensitivity of breast cancer cells to chemotherapeutics. Cancer Metab. 2018, 6, 11. [Google Scholar] [CrossRef] [PubMed] [Green Version]
- Minafra, L.; Porcino, N.; Bravatà, V.; Gaglio, D.; Bonanomi, M.; Amore, E.; Cammarata, F.P.; Russo, G.; Militello, C.; Savoca, G.; et al. Radiosensitizing effect of curcumin-loaded lipid nanoparticles in breast cancer cells. Sci. Rep. 2019, 9, 11134. [Google Scholar] [CrossRef] [PubMed] [Green Version]
- Geck, R.C.; Foley, J.R.; Stewart, T.M.; Asara, J.M.; Casero, R.A., Jr.; Toker, A. Inhibition of the polyamine synthesis enzyme ornithine decarboxylase sensitizes triple-negative breast cancer cells to cytotoxic chemotherapy. J. Biol. Chem. 2020, 295, 6263–6277. [Google Scholar] [CrossRef] [Green Version]
- Guerra, Â.R.; Paulino, A.F.; Castro, M.M.; Oliveira, H.; Duarte, M.F.; Duarte, I.F. Triple Negative Breast Cancer and Breast Epithelial Cells Differentially Reprogram Glucose and Lipid Metabolism upon Treatment with Triterpenic Acids. Biomolecules 2020, 10, 1163. [Google Scholar] [CrossRef] [PubMed]
- Ma, S.; Wang, F.; Zhang, C.; Wang, X.; Wang, X.; Yu, Z. Cell metabolomics to study the function mechanism of Cyperus rotundus L. on triple-negative breast cancer cells. BMC Complementary Med. Ther. 2020, 20, 262. [Google Scholar] [CrossRef] [PubMed]
- Guerra, Â.R.; Soares, B.I.G.; Freire, C.S.R.; Silvestre, A.J.D.; Duarte, M.F.; Duarte, I.F. Metabolic Effects of a Eucalyptus Bark Lipophilic Extract on Triple Negative Breast Cancer and Nontumor Breast Epithelial Cells. J. Proteome Res. 2021, 20, 565–575. [Google Scholar] [CrossRef] [PubMed]
- Iqbal, M.A.; Chattopadhyay, S.; Siddiqui, F.A.; Ur Rehman, A.; Siddiqui, S.; Prakasam, G.; Khan, A.; Sultana, S.; Bamezai, R.N. Silibinin induces metabolic crisis in triple-negative breast cancer cells by modulating EGFR-MYC-TXNIP axis: Potential therapeutic implications. FEBS J. 2021, 288, 471–485. [Google Scholar] [CrossRef]
- Lefort, N.; Brown, A.; Lloyd, V.; Ouellette, R.; Touaibia, M.; Culf, A.S.; Cuperlovic-Culf, M. ¹H NMR metabolomics analysis of the effect of dichloroacetate and allopurinol on breast cancers. J. Pharm. Biomed. Anal. 2014, 93, 77–85. [Google Scholar] [CrossRef]
- Borrego, S.L.; Fahrmann, J.; Datta, R.; Stringari, C.; Grapov, D.; Zeller, M.; Chen, Y.; Wang, P.; Baldi, P.; Gratton, E.; et al. Metabolic changes associated with methionine stress sensitivity in MDA-MB-468 breast cancer cells. Cancer Metab. 2016, 4, 9. [Google Scholar] [CrossRef] [Green Version]
- Goode, G.; Gunda, V.; Chaika, N.V.; Purohit, V.; Yu, F.; Singh, P.K. MUC1 facilitates metabolomic reprogramming in triple-negative breast cancer. PLoS ONE 2017, 12, e0176820. [Google Scholar] [CrossRef] [Green Version]
- Yang, J.; Cheng, J.; Sun, B.; Li, H.; Wu, S.; Dong, F.; Yan, X. Untargeted and stable isotope-assisted metabolomic analysis of MDA-MB-231 cells under hypoxia. Metabolomics 2018, 14, 40. [Google Scholar] [CrossRef]
- O’Day, E.M.; Idos, G.E.; Hill, C.; Chen, J.W.; Wagner, G. Cytidine monophosphate N-acetylneuraminic acid synthetase en-hances invasion of human triple-negative breast cancer cells. Onco Targets Ther. 2018, 11, 6827–6838. [Google Scholar] [CrossRef] [PubMed] [Green Version]
- Roig, B.; Rodríguez-Balada, M.; Samino, S.; Lam, E.W.-F.; Guaita-Esteruelas, S.; Gomes, A.R.; Correig, X.; Borràs, J.; Yanes, O.; Gumà, J. Metabolomics reveals novel blood plasma biomarkers associated to the BRCA1-mutated phenotype of human breast cancer. Sci. Rep. 2017, 7, 1–9. [Google Scholar] [CrossRef] [PubMed] [Green Version]
- Arenas, M.; Rodríguez, E.; García-Heredia, A.; Fernández-Arroyo, S.; Sabater, S.; Robaina, R.; Gascón, M.; Rodríguez-Pla, M.; Cabré, N.; Luciano-Mateo, F.; et al. Metabolite normalization with local radiotherapy following breast tumor resection. PLoS ONE 2018, 13, e0207474. [Google Scholar] [CrossRef]
- Debik, J.; Euceda, L.R.; Lundgren, S.; Gythfeldt, H.V.L.; Garred, Ø.; Borgen, E.; Engebraaten, O.; Bathen, T.F.; Giskeødegård, G.F. Assessing Treatment Response and Prognosis by Serum and Tissue Metabolomics in Breast Cancer Patients. J. Proteome Res. 2019, 18, 3649–3660. [Google Scholar] [CrossRef]
- Fahrmann, J.F.; Vykoukal, J.; Fleury, A.; Tripathi, S.; Dennison, J.B.; Murage, E.; Wang, P.; Yu, C.Y.; Capello, M.; Creighton, C.J.; et al. Association between Plasma Diacetylspermine and Tumor Spermine Synthase with Outcome in Triple-Negative Breast Cancer. J. Natl. Cancer Inst. 2020, 112, 607–616. [Google Scholar] [CrossRef]
- Eghlimi, R.; Shi, X.; Hrovat, J.; Xi, B.; Gu, H. Triple Negative Breast Cancer Detection Using LC-MS/MS Lipidomic Profiling. J. Proteome Res. 2020, 19, 2367–2378. [Google Scholar] [CrossRef]
- Li, L.; Zheng, X.; Zhou, Q.; Villanueva, N.; Nian, W.; Liu, X.; Huan, T. Metabolomics-Based Discovery of Molecular Signatures for Triple Negative Breast Cancer in Asian Female Population. Sci. Rep. 2020, 10, 370. [Google Scholar] [CrossRef] [PubMed]
- Díaz-Beltrán, L.; González-Olmedo, C.; Luque-Caro, N.; Díaz, C.; Martín-Blázquez, A.; Fernández-Navarro, M.; Orte-ga-Granados, A.L.; Gálvez-Montosa, F.; Vicente, F.; Pérez Del Palacio, J.; et al. Human Plasma Metabolomics for Biomarker Discovery: Targeting the Molecular Subtypes in Breast Cancer. Cancers 2021, 13, 147. [Google Scholar] [CrossRef]
- Xavier Assad, D.; Acevedo, A.C.; Cançado Porto Mascarenhas, E.; Costa Normando, A.G.; Pichon, V.; Chardin, H.; Neves Silva Guerra, E.; Combes, A. Using an Untargeted Metabolomics Approach to Identify Salivary Metabolites in Women with Breast Cancer. Metabolites 2020, 10, 506. [Google Scholar] [CrossRef] [PubMed]
- Choi, J.S.; Baek, H.-M.; Kim, S.; Kim, M.J.; Youk, J.H.; Moon, H.J.; Kim, E.K.; Han, K.H.; Kim, D.H.; Kim, S.I.; et al. HR-MAS MR Spectroscopy of Breast Cancer Tissue Obtained with Core Needle Biopsy: Correlation with Prognostic Factors. PLoS ONE 2012, 7, e51712. [Google Scholar] [CrossRef] [PubMed]
- Cao, M.D.; Lamichhane, S.; Lundgren, S.; Bofin, A.; Fjøsne, H.; Giskeødegård, G.F.; Bathen, T.F. Metabolic characterization of triple negative breast cancer. BMC Cancer 2014, 14, 941. [Google Scholar] [CrossRef] [Green Version]
- Tayyari, F.; Gowda, G.A.N.; Olopade, O.F.; Berg, R.; Yang, H.H.; Lee, M.P.; Ngwa, W.F.; Mittal, S.K.; Raftery, D.; Mohammed, S.I. Metabolic profiles of triple-negative and luminal A breast cancer subtypes in African-American identify key metabolic differences. Oncotarget 2018, 9, 11677–11690. [Google Scholar] [CrossRef] [Green Version]
- Shen, J.; Yan, L.; Liu, S.; Ambrosone, C.B.; Zhao, H. Plasma metabolomic profiles in breast cancer patients and healthy controls: By race and tumor receptor subtypes. Transl. Oncol. 2013, 6, 757–765. [Google Scholar] [CrossRef] [Green Version]
- Kanaan, Y.M.; Sampey, B.P.; Beyene, D.; Esnakula, A.K.; Naab, T.J.; Ricks-Santi, L.J.; Dasi, S.; Day, A.; Blackman, K.W.; Frederick, W.; et al. Metabolic profile of triple-negative breast cancer in African-American women reveals potential biomarkers of aggressive disease. Cancer Genom. Proteom. 2014, 11, 279–294. [Google Scholar]
- Yamashita, Y.; Nishiumi, S.; Kono, S.; Takao, S.; Azuma, T.; Yoshida, M. Differences in elongation of very long chain fatty acids and fatty acid metabolism between triple-negative and hormone receptor-positive breast cancer. BMC Cancer 2017, 17, 589. [Google Scholar] [CrossRef] [PubMed]
- Moestue, S.A.; Borgan, E.; Huuse, E.M.; Lindholm, E.M.; Sitter, B.; Børresen-Dale, A.L.; Engebraaten, O.; Maelandsmo, G.M.; Gribbestad, I.S. Distinct choline metabolic profiles are associated with differences in gene expression for basal-like and luminal-like breast cancer xenograft models. BMC Cancer 2010, 10, 433. [Google Scholar] [CrossRef] [PubMed] [Green Version]
- Kim, E.; Tunset, H.M.; Cebulla, J.; Vettukattil, R.; Helgesen, H.; Feuerherm, A.J.; Engebråten, O.; Mælandsmo, G.M.; Johansen, B.; Moestue, S.A. Anti-vascular effects of the cytosolic phospholipase A2 inhibitor AVX235 in a patient-derived basal-like breast cancer model. BMC Cancer 2016, 16, 191. [Google Scholar] [CrossRef] [PubMed] [Green Version]
- Euceda, L.R.; Hill, D.K.; Stokke, E.; Hatem, R.; El Botty, R.; Bièche, I.; Marangoni, E.; Bathen, T.F.; Moestue, S.A. Metabolic Response to Everolimus in Patient-Derived Triple-Negative Breast Cancer Xenografts. J. Proteome Res. 2017, 16, 1868–1879. [Google Scholar] [CrossRef] [PubMed]
- Grinde, M.T.; Hilmarsdottir, B.; Tunset, H.M.; Henriksen, I.M.; Kim, J.; Haugen, M.H.; Rye, M.B.; Mælandsmo, G.M.; Moestue, S.A. Glutamine to proline conversion is associated with response to glutaminase inhibition in breast cancer. Breast Cancer Res. 2019, 21, 61. [Google Scholar] [CrossRef]
- Li, Q.; Li, M.; Zhang, J.; Shi, X.; Yang, M.; Zheng, Y.; Cao, X.; Yue, X.; Ma, S. Donkey milk inhibits triple-negative breast tumor progression and is associated with increased cleaved-caspase-3 expression. Food Funct. 2020, 11, 3053–3065. [Google Scholar] [CrossRef] [PubMed]
- Rezaee, R.; Abdollahi, M. The importance of translatability in drug discovery. Expert Opin. Drug Discov. 2017, 12, 237–239. [Google Scholar] [CrossRef] [Green Version]
- Weljie, A.M.; Bondareva, A.; Zang, P.; Jirik, F.R. 1H NMR metabolomics identification of markers of hypoxia-induced metabolic shifts in a breast cancer model system. J. Biomol. NMR 2011, 49, 185–193. [Google Scholar] [CrossRef]
- Blomme, A.; Costanza, B.; de Tullio, P.; Thiry, M.; Van Simaeys, G.; Boutry, S.; Doumont, G.; Di Valentin, E.; Hirano, T.; Yokobori, T.; et al. Myoferlin regulates cellular lipid metabolism and promotes metastases in triple-negative breast cancer. Oncogene 2017, 36, 2116–2130. [Google Scholar] [CrossRef] [Green Version]
- Lehmann, B.D.; Bauer, J.A.; Chen, X.; Sanders, M.E.; Chakravarthy, A.B.; Shyr, Y.; Pietenpol, J.A. Identification of human triple-negative breast cancer subtypes and preclinical models for selection of targeted therapies. J. Clin. Investig. 2011, 121, 2750–2767. [Google Scholar] [CrossRef] [Green Version]
- Armiñán, A.; Palomino-Schätzlein, M.; Deladriere, C.; Arroyo-Crespo, J.J.; Vicente-Ruiz, S.; Vicent, M.J.; Pineda-Lucena, A. Metabolomics facilitates the discrimination of the specific anti-cancer effects of free- and polymer-conjugated doxorubicin in breast cancer models. Biomaterials 2018, 162, 144–153. [Google Scholar] [CrossRef]
- Nayeem, N.; Contel, M. Exploring the Potential of Metallodrugs as Chemotherapeutics for Triple Negative Breast Cancer. Chem. Eur. J. 2021, 27, 8891–8917. [Google Scholar] [CrossRef]
- Vojtek, M.; Marques, M.P.M.; Ferreira, I.M.P.L.V.O.; Mota-Filipe, H.; Diniz, C. Anticancer activity of palladium-based complexes against triple negative breast cancer. Drug Discov. Today 2019, 24, 1044–1058. [Google Scholar] [CrossRef] [PubMed]
- Navarro-Ranninger, C.; Zamora, F.; López-Solera, I.; Masaguer, J.R.; Pérez, J.M.; Alonso, C.; Martínez-Carrera, S. Palladium(II) salt and complexes of spermidine with a six-member chelate ring. Synthesis, characterization, and initial DNA-binding and antitumor studies. J. Inorg. Biochem. 1992, 46, 267–279. [Google Scholar] [CrossRef]
- Navarro-Ranninger, C.; Zamora, F.; Masaguer, J.; Perez, J.; Gonzalez, V.M.; Alonso, C. Palladium(II) compounds of putrescine and spermine. Synthesis, characterization, and DNA-binding and antitumor properties. J. Inorg. Biochem. 1993, 52, 37–49. [Google Scholar] [CrossRef]
- Fiuza, S.M.; Holy, J.; de Carvalho, L.A.E.B.; Marques, M.P.M. Biologic activity of a dinuclear pd(II)-spermine complex toward human breast cancer. Chem. Biol. Drug Des. 2011, 77, 477–488. [Google Scholar] [CrossRef] [Green Version]
- de Carvalho, A.L.M.B.; Pilling, M.; Gardner, P.; Doherty, J.; Cinque, G.; Wehbe, K.; Kelley, C.; de Carvalho, L.A.E.B.; Marques, M.P.M. Chemotherapeutic response to cisplatin-like drugs in human breast cancer cells probed by vibrational microspectroscopy. Faraday Discuss. 2016, 187, 273–298. [Google Scholar] [CrossRef] [Green Version]
- Batista De Carvalho, A.L.M.; Medeiros, P.S.C.; Costa, F.M.; Ribeiro, V.P.; Sousa, J.B.; Diniz, C.; Marques, M.P.M. Anti-invasive and anti-proliferative synergism between docetaxel and a polynuclear pd-spermine agent. PLoS ONE 2016, 11, e0167218. [Google Scholar] [CrossRef] [PubMed] [Green Version]
- Vojtek, M.; Gonçalves-Monteiro, S.; Pinto, E.; Kalivodová, S.; Almeida, A.; Marques, M.P.M.; de Carvalho, A.L.M.B.; Martins, C.B.; Mota-Filipe, H.; Ferreira, I.M.P.L.V.O.; et al. Preclinical Pharmacokinetics and Biodistribution of Anticancer Dinuclear Palladium(II)-Spermine Complex (Pd2Spm) in Mice. Pharmaceuticals 2021, 14, 173. [Google Scholar] [CrossRef]
- Berben, L.; Sereika, S.M.; Engberg, S. Effect size estimation: Methods and examples. Int. J. Nurs. Stud. 2012, 49, 1039–1047. [Google Scholar] [CrossRef] [PubMed]
- Benjamini, Y.; Hochberg, Y. Controlling the false discovery rate: A practical and powerful approach to multiple testing. J. R. Stat. Soc. Ser. B 1995, 57, 289–300. [Google Scholar] [CrossRef]
- Bathe, O.F.; Shaykhutdinov, R.; Kopciuk, K.; Weljie, A.M.; McKay, A.; Sutherland, F.R.; Dixon, E.; Dunse, N.; Sotiropoulos, D.; Vogel, H.J. Feasibility of identifying pancreatic cancer based on serum metabolomics. Cancer Epidemiol. Prev. Biomark. 2011, 20, 140–147. [Google Scholar] [CrossRef] [PubMed] [Green Version]
- Li, Y.; Wang, C.; Li, D.; Deng, P.; Shao, X.; Hu, J.; Liu, C.; Jie, H.; Lin, Y.; Li, Z.; et al. 1H-NMR-based metabolic profiling of a colorectal cancer CT-26 lung metastasis model in mice. Oncol. Rep. 2017, 38, 3044–3054. [Google Scholar] [CrossRef] [PubMed] [Green Version]
- Solanky, K.S.; Bailey, N.J.; Holmes, E.; Lindon, J.C.; Davis, A.L.; Mulder, T.P.; Van Duynhoven, J.P.; Nicholson, J.K. NMR-based metabonomic studies on the biochemical effects of epicatechin in the rat. J. Agric. Food Chem. 2003, 51, 4139–4145. [Google Scholar] [CrossRef]
- Cao, M.D.; Giskeodegard, G.F.; Bathen, T.F.; Sitter, B.; Bofin, A.; Lonning, P.E.; Lundgren, S.; Gribbestad, I.S. Prognostic value of metabolic response in breast cancer patients receiving neoadjuvant chemotherapy. BMC Cancer 2012, 12, 39. [Google Scholar] [CrossRef] [Green Version]
- Sitter, B.; Bathen, T.F.; Singstad, T.E.; Fjosne, H.E.; Lundgren, S.; Halgunset, J.; Gribbestad, I.S. Quantification of metabolites in breast cancer patients with different clinical prognosis using HR MAS MR spectroscopy. NMR Biomed. 2010, 23, 424–431. [Google Scholar] [CrossRef]
- Grinde, M.T.; Skrbo, N.; Moestue, S.A.; Rødland, E.A.; Borgan, E.; Kristian, A.; Sitter, B.; Bathen, T.F.; Børresen-Dale, A.L.; Mælandsmo, G.M.; et al. Interplay of choline metabolites and genes in patient-derived breast cancer xenografts. Breast Cancer Res. 2014, 16, 1–16. [Google Scholar] [CrossRef] [Green Version]
- Sitter, B.; Lundgren, S.; Bathen, T.F.; Halgunset, J.; Fjosne, H.E.; Gribbestad, I.S. Comparison of HR MAS MR spectroscopic profiles of breast cancer tissue with clinical parameters. NMR Biomed. 2006, 19, 30–40. [Google Scholar] [CrossRef]
- Waseem, M.; Bhardwaj, M.; Tabassum, H.; Raisuddin, S.; Parvez, S. Cisplatin hepatotoxicity mediated by mitochondrial stress. Drug Chem. Toxicol. 2015, 38, 452–459. [Google Scholar] [CrossRef]
- Aldossary, S.A. Review on Pharmacology of Cisplatin: Clinical Use, Toxicity and Mechanism of Resistance of Cisplatin. Biomed. Pharmacol. J. 2019, 12, 7–15. [Google Scholar] [CrossRef]
- Codina, G.; Caubet, A.; López, C.; Moreno, V.; Molins, E. Palladium(II) and platinum(II) polyamine complexes: X-ray crystal structures of (SP-4-2) chloro{N-[(3-amino-κN)propyl]propane-1,3-diamine-κN,κN′}palladium(1+) tetrachloropalladate (2–) (2:1) and (R,S)-tetrachloro[μ-(spermine)]dipalladium(II) (={μ {N,N′-Bis[(3-amino-κN)propyl]butane-1,4-diamine-κN:κN′}}tetrachlorodipalladium). Helv. Chim. Acta 1999, 82, 1025–1037. [Google Scholar] [CrossRef]
- Marques, M.P.M.; de Carvalho, A.L.M.B.; Mamede, A.P.; Santos, I.P.; Sakai, V.G.; Dopplapudi, A.; Cinque, G.; Wolna, M.; Gardner, P.; de Carvalho, L.A.E.B. Chemotherapeutic targets in osteosarcoma—Insights from synchrotron-microFTIR and quasi-elastic neutron scattering. J. Phys. Chem. B 2019, 123, 6968–6979. [Google Scholar] [CrossRef]
- Kilkenny, C.; Browne, W.J.; Cuthill, I.C.; Emerson, M.; Altman, D.G. Improving bioscience research reporting: The ARRIVE guidelines for reporting animal research. PLoS Biol. 2010, 8, e1000412. [Google Scholar] [CrossRef]
- Beckonert, O.; Keun, H.C.; Ebbels, T.M.D.; Bundy, J.G.; Holmes, E.; Lindon, J.C.; Nicholson, J.K. Metabolic profiling, metabolomic and metabonomic procedures for NMR spectroscopy of urine, plasma, serum and tissue extracts. Nat. Protoc. 2007, 2, 2692–2703. [Google Scholar] [CrossRef]
- Lin, C.Y.; Wu, H.; Tjeerdema, R.S.; Viant, M.R. Evaluation of metabolite extraction strategies from tissue samples using NMR metabolomics. Metabolomics 2007, 3, 55–67. [Google Scholar] [CrossRef]
- Le Belle, J.E.; Harris, N.G.; Williams, S.R.; Bhakoo, K.K. A comparison of cell and tissue extraction techniques using high-resolution 1H-NMR spectroscopy. NMR Biomed. 2002, 15, 37–44. [Google Scholar] [CrossRef]
- Wu, H.; Southam, A.D.; Hines, A.; Viant, M.R. High-throughput tissue extraction protocol for NMR- and MS-based metabolomics. Anal. Biochem. 2008, 372, 204–212. [Google Scholar] [CrossRef]
- Wishart, D.S.; Feunang, Y.D.; Marcu, A.; Guo, A.C.; Liang, K.; Vázquez-Fresno, R.; Sajed, T.; Johnson, D.; Li, C.; Karu, N.; et al. HMDB 4.0-The human metabolome database for 2018. Nucleic Acids Res. 2018, 46, D608–D617. [Google Scholar] [CrossRef]
- Kanehisa, M.; Goto, S. KEGG: Kyoto Encyclopedia of Genes and Genomes. Nucleic Acids Res. 2020, 28, 27–30. [Google Scholar] [CrossRef]


| cDDP vs. Ctr | Pd2Spm vs. Ctr | Pd2Spm vs. cDDP | ||||||||||||
|---|---|---|---|---|---|---|---|---|---|---|---|---|---|---|
| Metabolite | δ/ppm (Multiplicity) | ES | ± | Error | p-Value | ES | ± | Error | p-Value | ES | ± | Error | p-Value | |
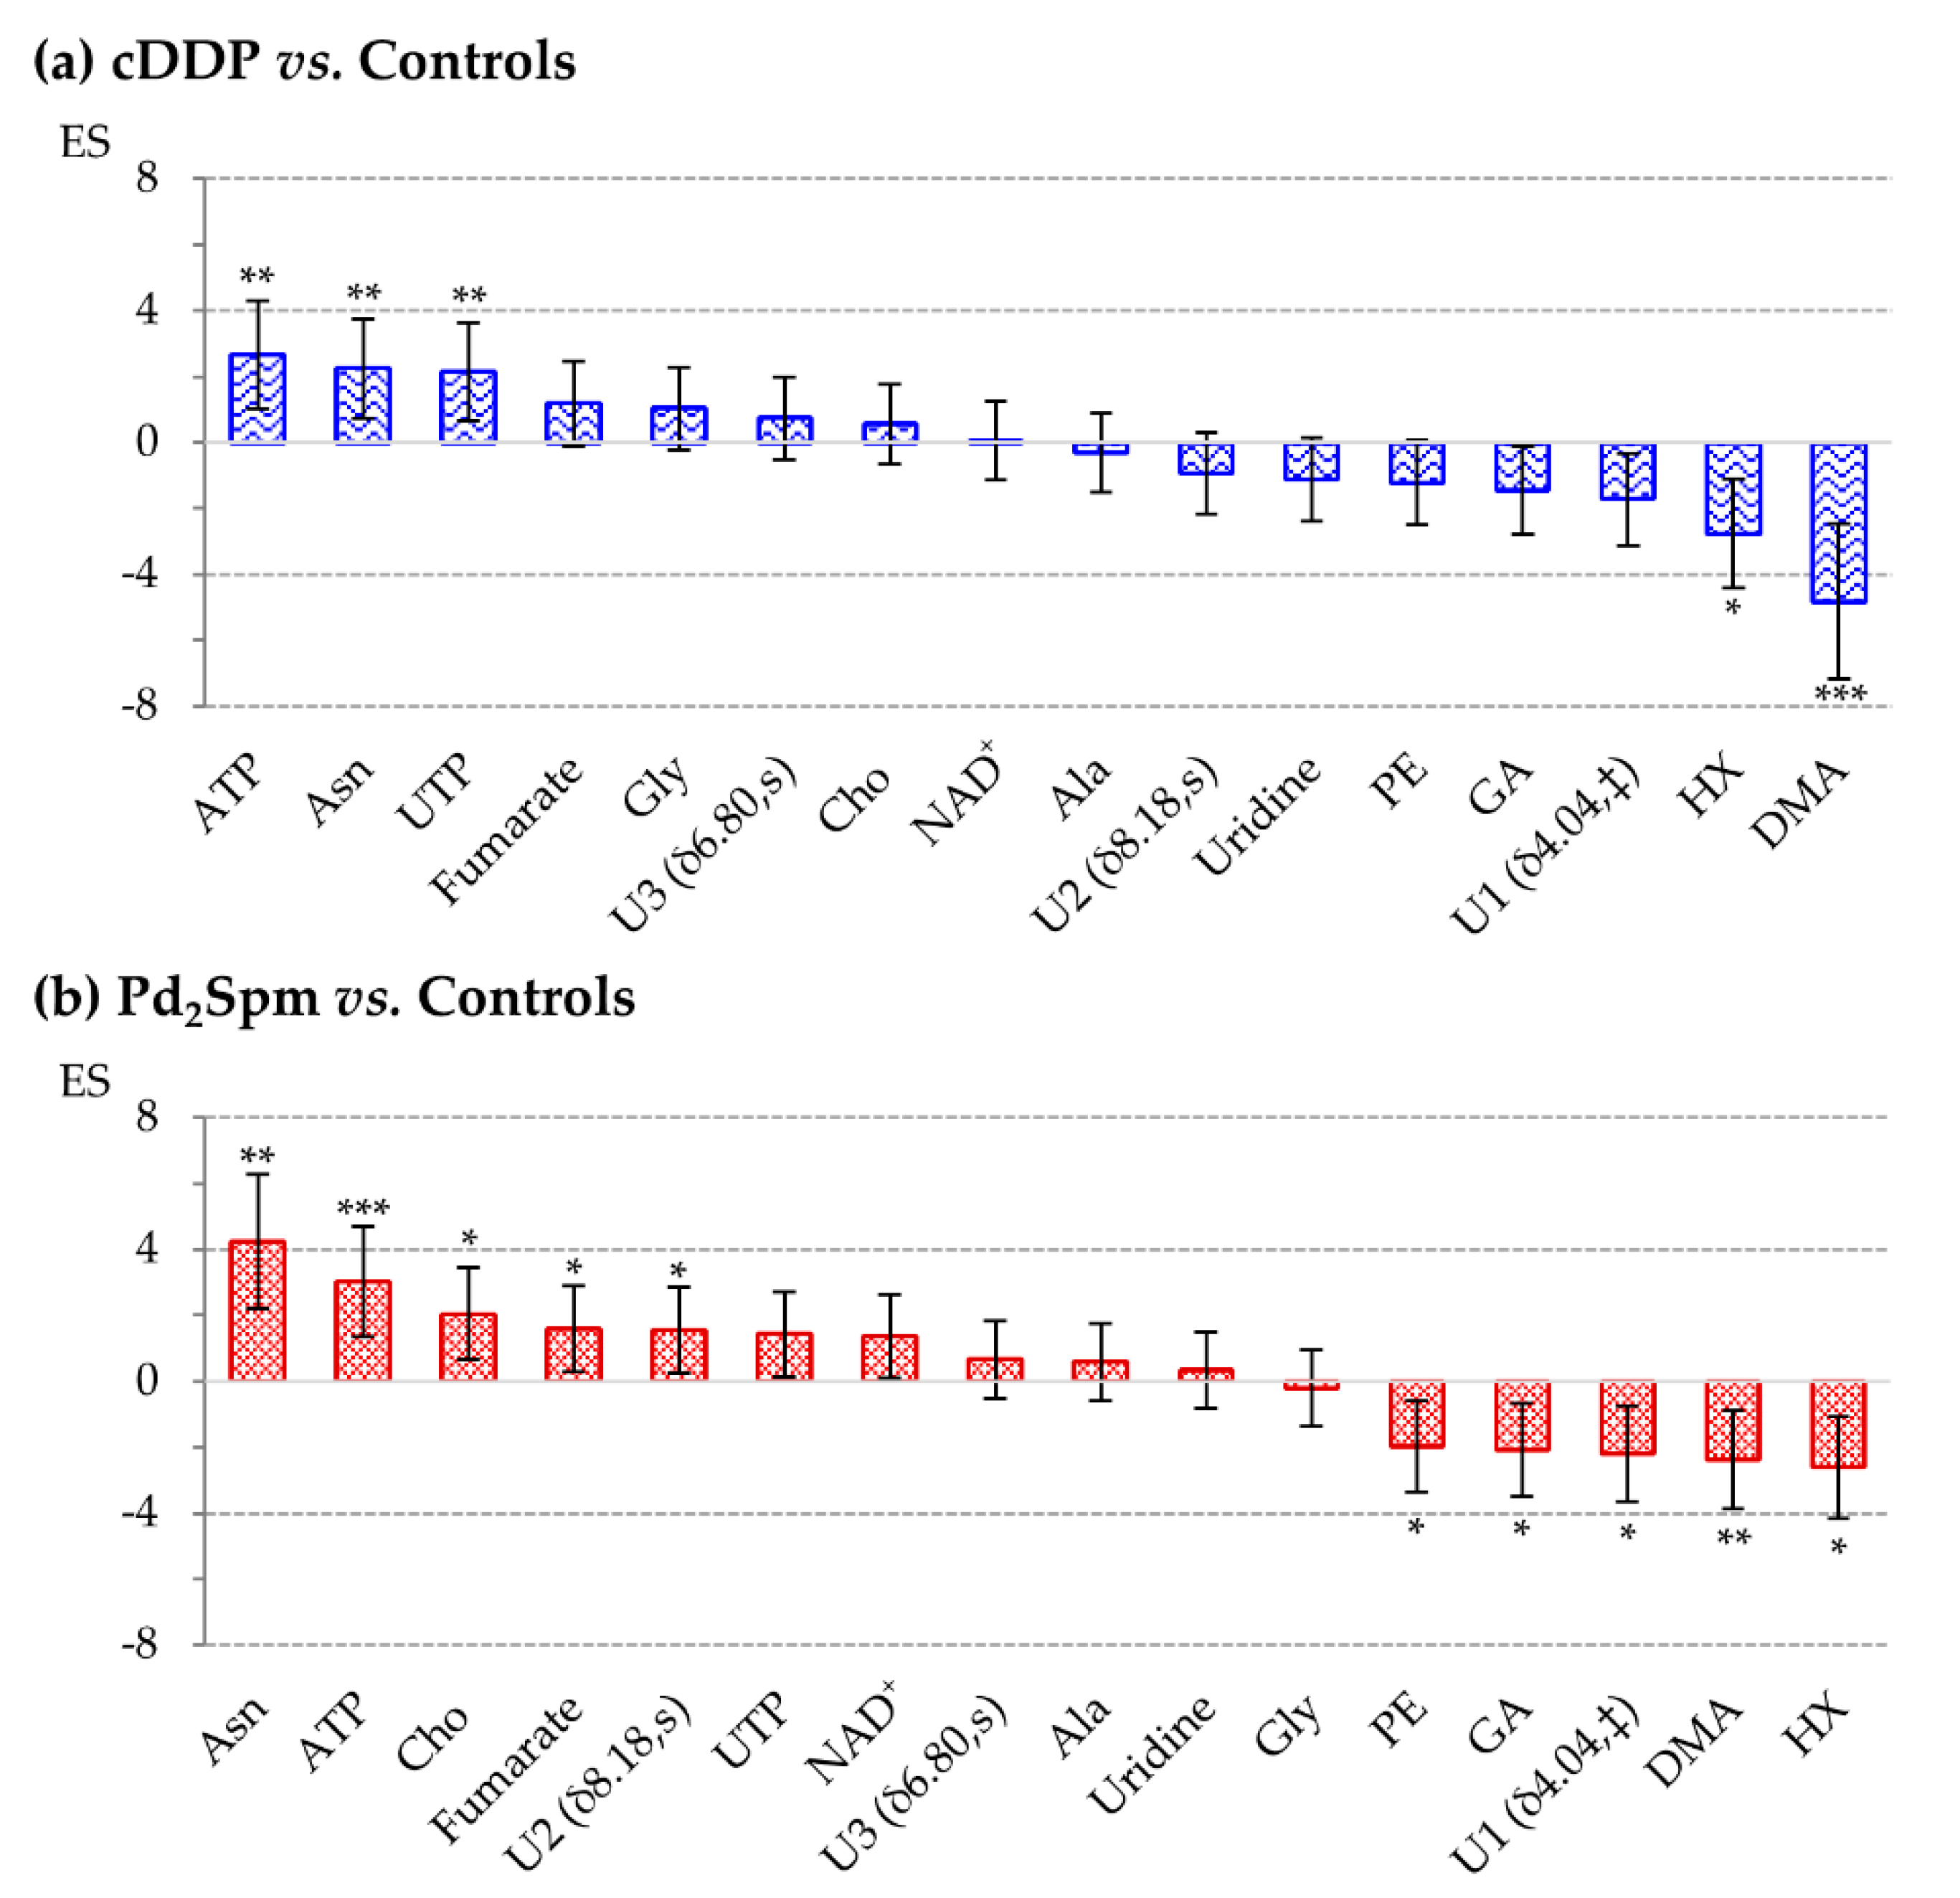
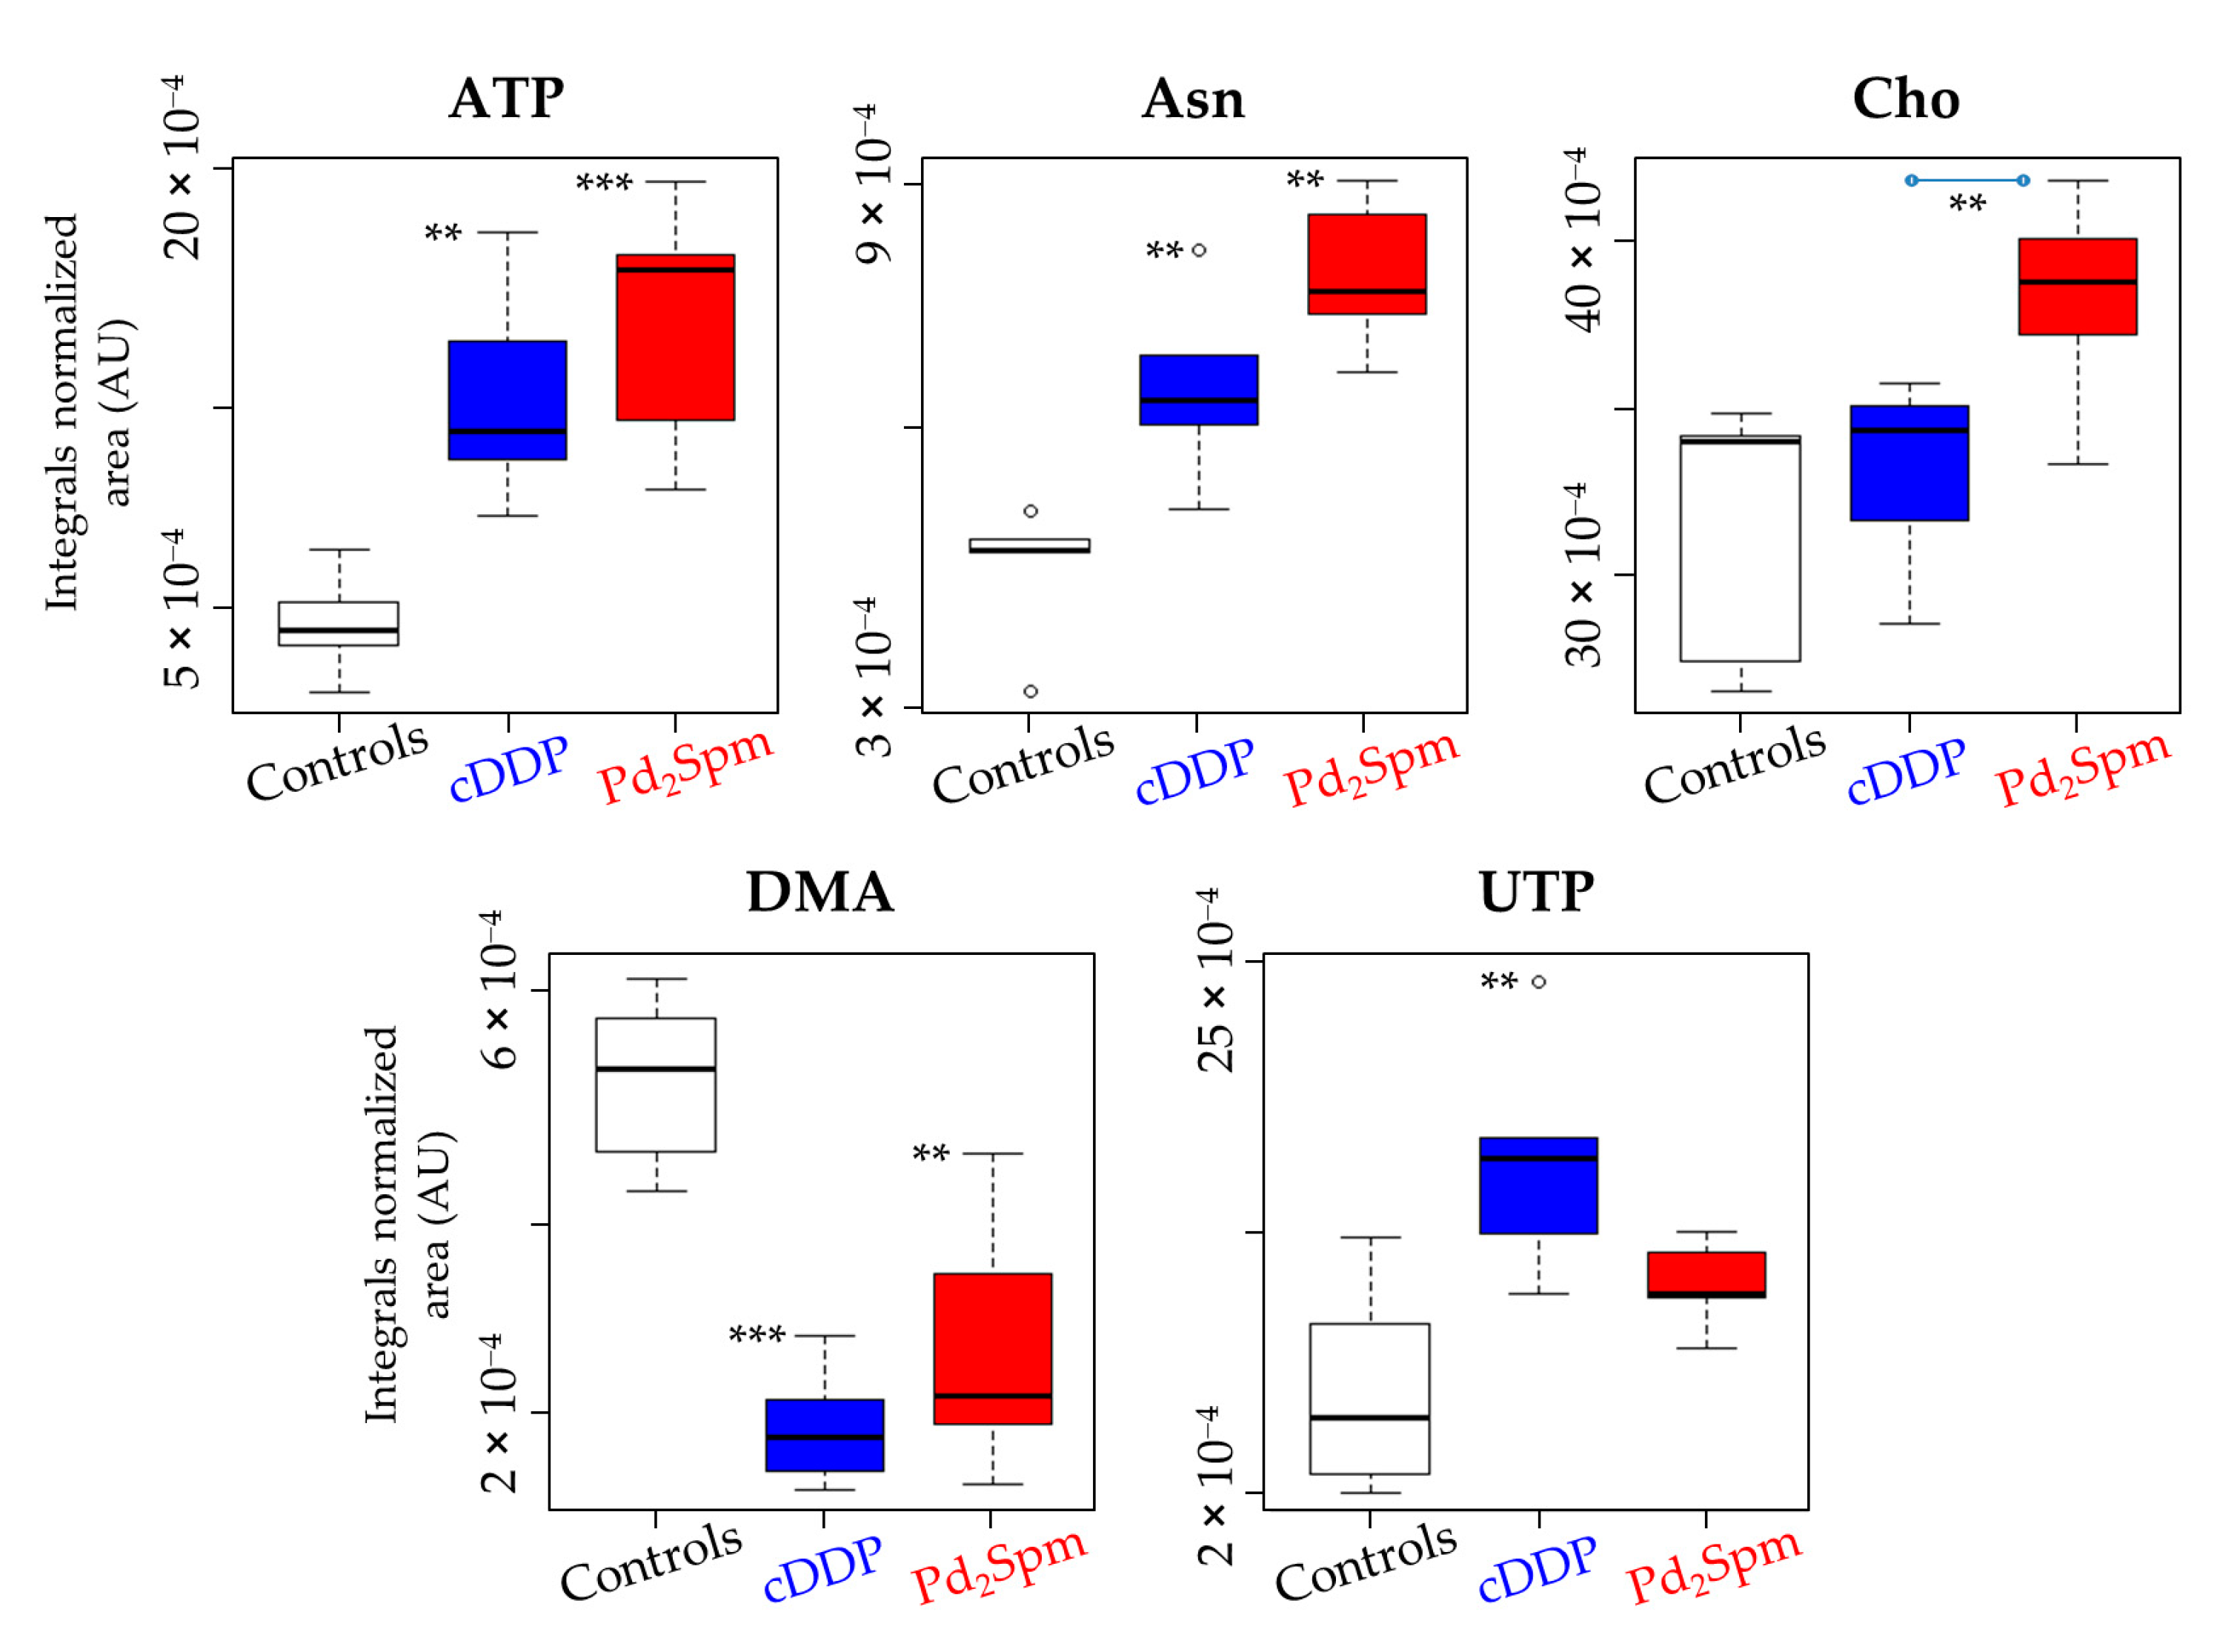
| Amino acids metabolism | Ala | 1.48 (d) | — | — | — | — | — | — | — | — | 1.59 | ± | 1.25 | 1.39 × 10⁻² |
| Asn | 2.85 (m) | 2.25 | ± | 1.51 | 4.33 × 10⁻³ a | 4.23 | ± | 2.04 | 2.53 × 10⁻³ a | 1.53 | ± | 1.24 | 2.26 × 10⁻² | |
| Gly | 3.55 (s) | — | — | — | — | — | — | — | — | –1.32 | ± | 1.2 | 3.33 × 10⁻² | |
| Membrane precursors | Cho | 3.21 (s) | — | — | — | — | 2.05 | ± | 1.41 | 1.39 × 10⁻² | 1.81 | ± | 1.29 | 7.70 × 10⁻³ a |
| PE | 3.99 (m) | — | — | — | — | –1.97 | ± | 1.39 | 3.52 × 10⁻² | –1.46 | ± | 1.23 | 2.30 × 10⁻² | |
| TCA cycle | Fumarate | 6.52 (s) | — | — | — | — | 1.6 | ± | 1.31 | 2.10 × 10⁻² | — | — | — | — |
| Nucleotides metabolism | ATP | 8.54 (s) | 2.66 | ± | 1.63 | 1.78 × 10⁻³ a | 3.02 | ± | 1.67 | 2.75 × 10⁻⁴ a | — | — | — | — |
| GA | 3.79 (s) | — | — | — | — | –2.09 | ± | 1.42 | 3.04 × 10⁻² | –1.33 | ± | 1.21 | 3.25 × 10⁻² | |
| HX | 8.20 (s) | –2.76 | ± | 1.65 | 1.06 × 10⁻² a | –2.61 | ± | 1.55 | 2.01 × 10⁻² | — | — | — | — | |
| NAD+ | 8.43 (s) | — | — | — | — | — | — | — | — | 1.35 | ± | 1.21 | 3.93 × 10⁻² | |
| Uridine | 7.86 (d) | — | — | — | — | — | — | — | — | 1.27 | ± | 1.19 | 4.17 × 10⁻² | |
| UTP | 8.00 (d) | 2.15 | ± | 1.49 | 6.80 × 10⁻³ a | — | — | — | — | 1.57 | ± | 1.25 | 3.69 × 10⁻² | |
| Carbon metabolism | DMA | 2.73 (s) | –4.82 | ± | 2.34 | 1.89 × 10⁻⁴ a | -2.39 | ± | 1.49 | 1.51× 10⁻³ a | - | - | - | - |
| Unassigned resonances | U1 | 4.04 (‡) | — | — | — | — | –2.19 | ± | 1.44 | 3.48 × 10⁻² | –1.40 | ± | 1.22 | 4.51 × 10⁻² |
| U2 | 8.18 (s) | — | — | — | — | 1.56 | ± | 1.31 | 4.80 × 10⁻² | - | - | - | - | |
| U3 | 6.80 (s) | — | — | — | — | — | — | — | — | 1.27 | ± | 1.19 | 3.95 × 10⁻² | |
Publisher’s Note: MDPI stays neutral with regard to jurisdictional claims in published maps and institutional affiliations. |
© 2021 by the authors. Licensee MDPI, Basel, Switzerland. This article is an open access article distributed under the terms and conditions of the Creative Commons Attribution (CC BY) license (https://creativecommons.org/licenses/by/4.0/).
Share and Cite
Carneiro, T.J.; Araújo, R.; Vojtek, M.; Gonçalves-Monteiro, S.; de Carvalho, A.L.M.B.; Marques, M.P.M.; Diniz, C.; Gil, A.M. Impact of the Pd2Spm (Spermine) Complex on the Metabolism of Triple-Negative Breast Cancer Tumors of a Xenograft Mouse Model. Int. J. Mol. Sci. 2021, 22, 10775. https://0-doi-org.brum.beds.ac.uk/10.3390/ijms221910775
Carneiro TJ, Araújo R, Vojtek M, Gonçalves-Monteiro S, de Carvalho ALMB, Marques MPM, Diniz C, Gil AM. Impact of the Pd2Spm (Spermine) Complex on the Metabolism of Triple-Negative Breast Cancer Tumors of a Xenograft Mouse Model. International Journal of Molecular Sciences. 2021; 22(19):10775. https://0-doi-org.brum.beds.ac.uk/10.3390/ijms221910775
Chicago/Turabian StyleCarneiro, Tatiana J., Rita Araújo, Martin Vojtek, Salomé Gonçalves-Monteiro, Ana L. M. Batista de Carvalho, Maria Paula M. Marques, Carmen Diniz, and Ana M. Gil. 2021. "Impact of the Pd2Spm (Spermine) Complex on the Metabolism of Triple-Negative Breast Cancer Tumors of a Xenograft Mouse Model" International Journal of Molecular Sciences 22, no. 19: 10775. https://0-doi-org.brum.beds.ac.uk/10.3390/ijms221910775