
Potential of Salivary Biomarkers in Autism Research: A Systematic Review

Abstract
:1. Introduction
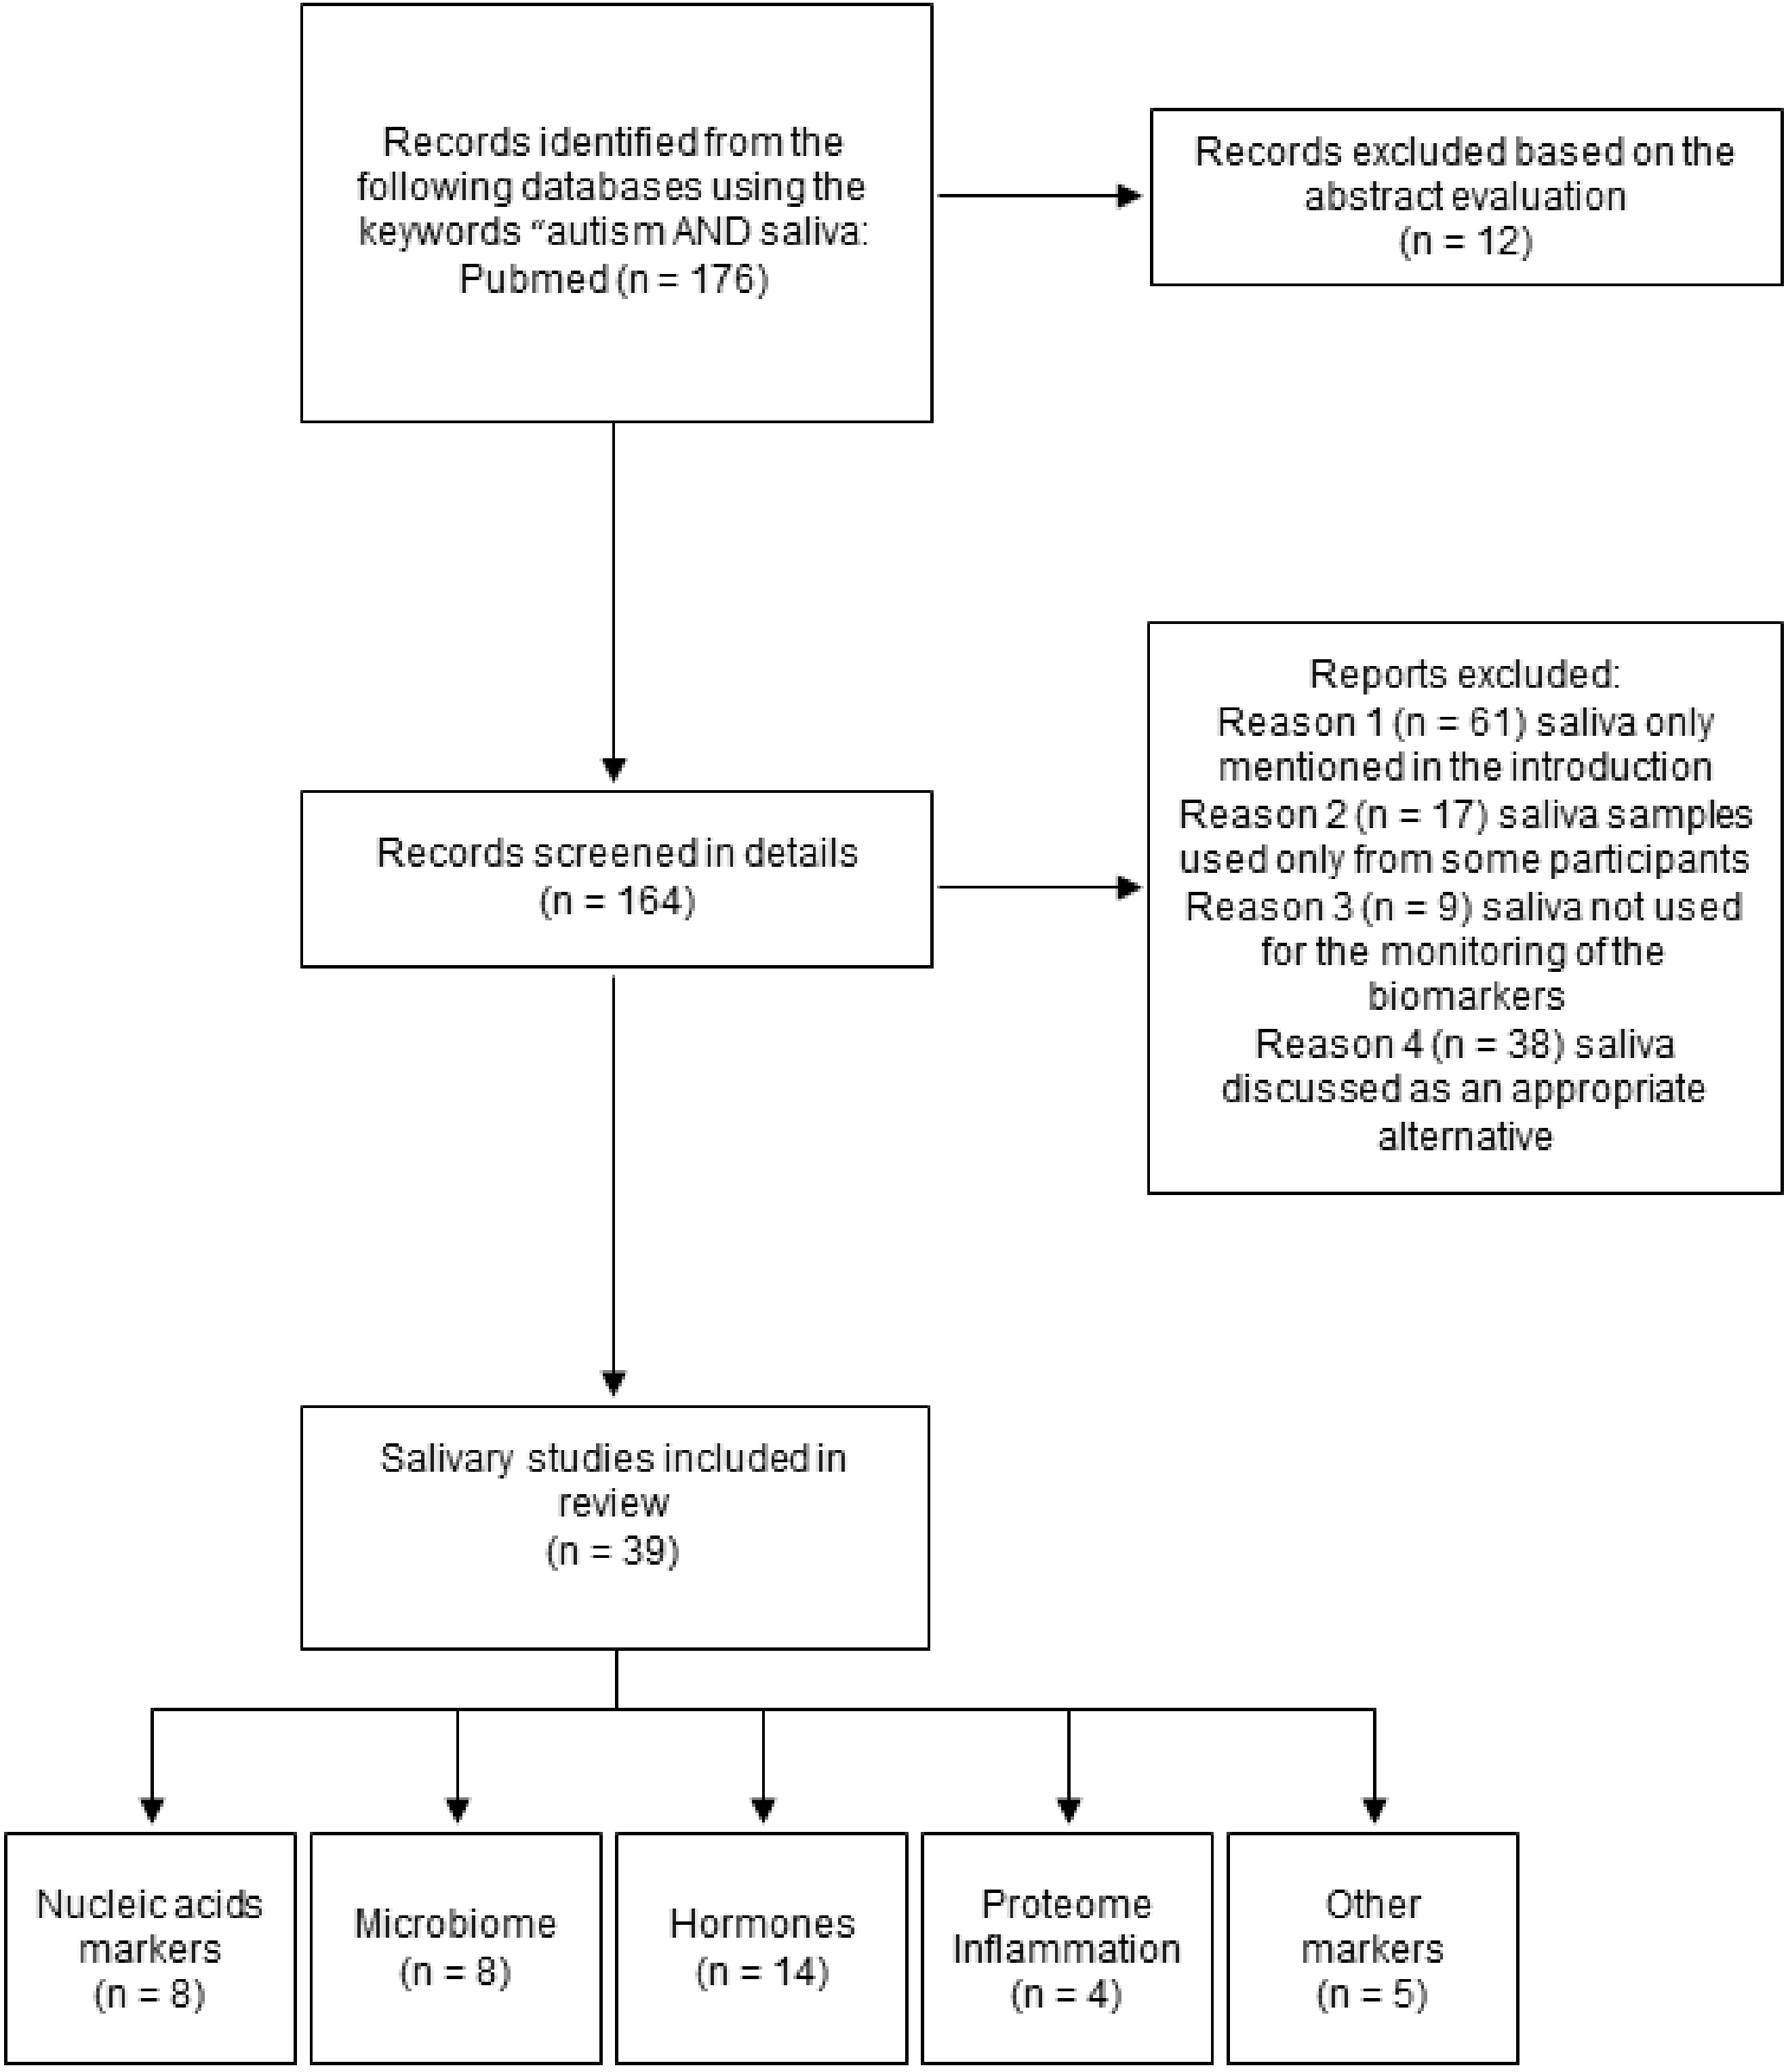
2. Methods
3. Challenges in Salivary Biomarker Research
4. Saliva in ASD Research
4.1. DNA Markers
4.2. RNA Markers

| Children No. ASD No. Non-ASD Geographic Region | ASD Dg. Tool/ Module | Age (Years) ASD Non-ASD | Timing | Saliva Collection and Nucleic Acids Extraction | Duration of Sal/Volume | Centrif | Marker | Method | Results ↓↑ in ASD | Ref |
|---|---|---|---|---|---|---|---|---|---|---|
| ASD: 5 M, 2 F SA: 2 M, 4F Non-ASD (Down syndrome, Opitz GBBB syndrome): 1 M, 1 F NA | NA | 12 ± 9.07 6.5 ± 3.64 6 ± 1 | noon | Salivette | 2 min/0.1–2 mL | 1500 g 10 min | DNA- SNPs CYP1A2*1C CYP1A2*1K CYP1A2*3 CYP1A2*4 CYP1A2*6 CYP1A2*1F | qPCR | SNP found in eight of fifteen patients, Allele *1C in two patients Allele *1F in six patients | [58] |
| 457 families with ASD, including 418 simplex and 39 multiplex families NA | ADOS, ADIR/ 1–4 | NA | NA | OGD-500 kit (DNA Genotek), DNA extracted in a CLIA-certified laboratory | NA | NA | DNA-exome | WES | CHD8, SCN2A, ADNP, KDM5B, SYNCAP1, ARID1B, SHANK3, DNMT3A, POGZ, FOXP1, CHD2, GIGYF1, ASXL3, BRSK2, KDM6B, CLCN4, ITSN1, MED13L, IRF2BPL, DMWD, QRICH1, MBD5, CPZ, SLC6A8, FEZF2, PAX5, RERE, RNF25, RALGAPB, NR4A2, EGR3, KDM1B, SH3RF3, DPP6 | [63] |
| ASD (comorbid diagnoses included): 19 M, 5 F Non-ASD: 16 M, 5 F NA | DSM-5, ADOS, CARS, Krug Asperger Index/ NA | 9.1 ± 2.4 9.2 ± 2.5 | Non-fasting state, 10 a.m.–3 p.m. | Rinsing with water, Oragene RNA collection kit (DNA Genotek) Trizol method, purification by RNeasy mini column(Qiagen) | 3 mL | NA | RNA-miRNA | Small RNA sequencing | ↑ miR-628-5p, miR-335-3p ↓ miR-30e-5p, miR-27a-3p, miR-23a-3p | [66] |
| Training set: ASD 156 M, 32 F Non-ASD (TD or DD): 122 M, 62 F Validation set: ASD: 45 M, 5 F Non-ASD(TD or DD): 26 M, 8 F NA | DSM-5 criteria/NA | 4.5 ± 1.25 4.08 ± 1.33 4.42 ± 1.25 3.83 ± 1.33 | NA | Rinsing with water, Oracollect RNA swab (DNA Genotek)/pooled saliva by highly absorbent swab, Trizol method | NA/5–10 sec | Whole saliva | RNA– human, microbial | Small RNA sequencing | Diagnostic panel: miR-92a-3p, mir-146b, miR-146b-5p, miR-378a-3p, miR-361-5p, miR-125-5p, miR-106a-5p, miR-3916, mir-146a, mir-10a, mir-410, piR-24684, piR-9491, piR-27400, piR-6463, piR-29114, piR-12423, piR-24085, piR-15023, SNORD118, Leadbetterarella byssophia, Alphaproteobacteria, Fusarium, Staphylococcus, Clostridiales, Pasteurella multocida, Corynebacterium uterequi, Lactobacillus fermentum, Oenococcus oeni, Streptococcus gallotycus, Ottowia, Yarrowia lipolytica | [71] |
| Training set: ASD: 161 M, 26 F Non-ASD TD: 76 M, 49 F Non-ASD DD: 48 M, 21 FTest set: ASD: 29 M, 8 F Non-ASD TD: 5 M, 3 F Non-ASD DD: 15 M,10 F NA | DSM-5, ADOS, ADIR, CARS/ NA | 4.5 ± 1.25 3.9 ± 1.5 4.2 ± 1.08 3.9 ± 1.67 4.7 ± 1.67 3.7 ± 1.67 | Non-fasting state | P-157 Nucleic Acid Stabilizing Swab (DNA Genotek), Trizol method, purification by RNeasy mini column(Qiagen) | 5–10 s | NA | RNA- miRNA | Small RNA sequencing | ↓miR-28–3p, miR-148a-5p, miR-151a-3p, miR-125b-2–3p, miR-7706 ↑miR-665, miR-4705, miR-620, miR-1277–5p | [73] |
| ASD: 25 M, 14 F Developmental disorder: 14 M, 2 F Non-ASD: 11 M, 14 F Bosnia and Herzegovina | CARS II/NA | 5.07 ± 1.26 5.03 ± 0.98 5.76 ± 1.67 | NA | mirVANA isolation kit (Invitrogen™) | NA | NA | RNA- 14 miRNAs | qPCR | ↑miR-7-5p, miR-2467-5p ↓miR-23a-3p, miR-32-5p, miR-140-3p, miR-628-5p | [74] |
| Adolescent cohort: ASD: 37 M, 11 F Non-ASD: 26 M, 22 F Younger cohort: ASD: 20 M, 2 F DD: 6 M, 3 F NA | DSM-5 criteria, ADOS-2/ NA | 11.5 ± 4.45 10.4 ± 3.03 4.36 ± 1.08 3.88 ± 1.05 | Non-fasting state | Oragene RNA collection kit (DNA Genotek)/Oracollect RNA swab (DNA Genotek), Qiagen miRNeasy MicroKit (Qiagen) | NA | NA | RNA- miRNA | Small RNA sequencing | Associations between behavior and RNA levels: hsa-miR-146b-5p, hsa-miR-29c-3p, hsa-miR-374a-5p, hsa-miR-182-5p, piR-hsa-24085, piR-has-6463, Staphylococcus Changed over time in younger cohort: hsa-let-7e-5p, hsa-miR-125a-5p, hsa-miR-125b-5p, hsa-miR-146b-5p, hsa-miR-148a-5p, hsa-miR-182-5p, hsa-miR-221-3p, Staphylococcus | [75] |
| ASD: 60 M, 16 F nonASD: 28 M, 11 F NA | ADOS, ADIR/ NA | 6.9 ± 1.5 6.9 ± 1.8 | No eating or drinking for at least 3 h prior to saliva collection between 8:30 and 10:30 a.m. | Non-stimulated, Qiagen miRNeasy Mini Kit (Qiagen), PureLink Genomic DNA Kit (Thermo Fisher Scientific) | 800 µL–4 mL | 10,000 rpm, 15 min at 4 °C | NanoString technology, qPCR, 16S RNA sequencing | ↑miR-29a-3p and miR-141-3p ↓miR-16-5p, let-7b-5p, miR-451a ↑Rothia, Filifactor, Actinobacillus, Weeksellaceae, Ralstonia, Pasteurellaceae, Aggregatibacter ↓Tannerella, Moryella, TM7-3 | [76] |
4.3. Salivary Microbiome in ASD
4.4. Hormones
| Children No. ASD No. CTRL Geographic Region | Dg. Tool/ ASD Module | Age (Years) ASD CTRL | Timing | Saliva | Duration of Sal/Volume | Centrif | Marker | Concentration ASD, CTRL | Method | Results ↓↑ | Ref |
|---|---|---|---|---|---|---|---|---|---|---|---|
| High functioning ASD 37 M 2 F NA | ADIR/ NA | 8.64 ± 1.50 | NA | UWMS Salivette Sorbette | NA 45 s | NA | µg/dL Cortisol | RM ANOVA F(2,37) = 0.53 Mean (SD) 0.089 (0.045) 0.084 (0.036) 0.084 (0.035) | ELISA | p = 0.592 | [29] |
| ASD M 23 CTRL M 21 ASD F 22 CTRL F 16 22 markers were analyzed, also in saliva of females Poland | DSM-IV CARS/ NA | 3.7 ± 0.1 3.5 ± 0.1 3.9 ± 0.2 3.4 ± 0.1 8.2 ± 0.2 8.4 ± 0.2 7.7 ± 0.2 8.4 ± 1.4 | 8–10 a.m. | Salivette | 0.15–5 mL | Frozen 3000- 4000 g, 10 min | nmol/L DHEA-C Androsterone-C Pregnenolone Allopregnanolone DHEA DHEA-C Androstenediol Etiocholanolone Epiandrosterone | Mean (±SEM), ASD, CTRL boys 69.66 (30.05); 7.702 (1.440) 6.972 (1.767); 3.0.57 (0.770) ASD, CTRL males 4.454 (0.682); 1.295 (0.133) 0.177 (0.029); 0.030 (0.008) 5.522 (1.934); 0.880 (0.106) 560.05 (278.11); 39.06 (23.82) 1.746 (0.206); 0.637 (0.091) 0.0702 (0.014); 0.015 (0.003) 0.402 (0.223); 0.075 (0.011) | GC-MS RIA | ↑ ASD (0 < 0.05) ↑ ASD (p = 0.010) ↑ ASD (p < 0.05) ↑ ASD (p < 0.05) ↑ ASD (p < 0.01) ↑ ASD (p < 0.01) ↑ ASD (p < 0.01) ↑ ASD (p < 0.01) ↑ ASD (p < 0.01) | [93] |
| ASD 20 M ASDanx 32 M CTRL 23 M United Kingdom | ADOS-G ADI-R SCQ/ NA | 13.9 (1.9) 12.9 (2.0) 12.8 (2.0) | 1:20 p.m. 1:40 p.m. | Salivette | NA | NA | Unit NA Cortisol | Log-transformed, F(2,72) = 0.06 F(2,72) = 0.11 Mean (SD) 13:20 p.m., 13:40 p.m. 1.77 (0.53); 1.82 (0.50); 1.80 (0.46) 1.56 (0.41); 1.54 (0.40); 1.59 (0.34) | Immulite | - | [94] |
| ASD 49 M CTRL 28 M The Netherlands | DSM-V DISC-IV/ NA | 15.0 ± 1.8 15.9 ± 2.1 | 6:45 a.m.–12:30 p.m. | UWMS | NA/6 mL | Non-C | Oxytocin Testosterone Cortisol | Calculated as Z scores (SD) −0.22 (0.89); 0.49 (0.97) −0.26 (0.99); −0.04 (0.74) −0.19 (1.02); 0.02 (0.75) | RIA | Oxytocin ↓ ASD (p < 0.01) | [95] |
| ASD 30 M, 6 F CTRL 23 M, 4 F NA | ADOS DSM-IV/ NA | 10.2 ± 1.96 9.71 ± 1.54 | M1—waking M2—30 min after A—approx. 3 p.m. E-30 min bedtime | UWMS | NA | Frozen 2558 g 15 min | ng/mL Cortisol | Diagnosis-F(1,128) = 4.78 M1-F(1,103) < 1 M2-F(1,123) < 1 A-F(1,110) < 1 E-F(1,122) = 7.86 Mean (SD) M1—2.86 (1.20); 2.54 (1.11) M2—3.58 (1.60); 3.23 (1.46) A—1.40 (1.73); 0.83 (0.35) E—0.47 (0.59); 0.18 (0.14) | Coat-A-count RIA | p = 0.031 p = 0.50 p = 0.76 p = 0.40 ASD p = 0.006 | [96] |
| ASD 57 M, 7 F CTRL 42 M, 7 F NA | ADOS DSM-V/ NA | 12.02 11.17 | M1—waking M2—30 min after AFT—1–4 p.m. EVE-30 min bedtime | straw | 1 mL | Frozen 3640 rpm 15 min | ng/mL Cortisol-C | dg x C—F(1,103) = 1.73, 2 = 0.02 dg x time F(2.20,226.99) = 4.08, 2 = 0.04 EVE—F(1,103) = 6.88, 2 = 0.06 Log-transformed Mean (SD) M1—0.33 (0.25); 0.34 (0.26) M2—0.44 (0.31); 0.48 (0.19) AFT—−0.05 (0.32); −0.10 (0.28) EVE—−0.60 (0.40); −0.81 (0.41) | Coat-A-count RIA | p = 0.19 p = 0.02 ↑ ASD (p = 0.01) p = 0.82 p = 0.45 p = 0.42 ↓ ASD p = 0.01 | [97] |
| LF ASD 36 M,19 F CTRL 22 M, 12 F France | DSM-5 ICD-10 CFTMEA ADOS-G ADI-R/ module 1 | 11.3 ± 4.1 11.7 ± 4.9 | 8 a.m. 11 a.m. 4 p.m. 0 a.m. 8 a.m. next day | swab | >1 min | NA | µg/dL Cortisol | Mean (SEM) 0.803 (±0.134); 0.620 (±0.070) 0.529 (±0.94); 0.429 (±0.089) 0.365 (±0.048); 0.201 (±0.018) 0.305 (±0.077); 0.104 (±0.002) 1.209 (±0.167); 0.620 (±0.071) RM measures of variance Group–F(1,31) = 20.74 Time–F(4,124) = 54.07 Group by time –F(4,124) = 1.59 | ELISA | p = 0.2318 p = 0.2154 ↑ ASD p = 0.0017 ↑ ASD p = 0.0001 ↑ ASD p = 0.0016 p < 0.001 p < 0.001 p = 0.187 | [98] |
| ASD 12 M CTRL 10 M California | ADOS DSM-IV/ NA | 8.5 9.2 | 1–3 p.m. (1) Eve—30 min of bedtime M-30 min post-waking 1–3 p.m. (2) Eve (2) M (3) | Chewing gum, straw | 30 s | Frozen 6000 rpm 10 min | nmol/L Cortisol | Log-transformed NA | RIA | Overall cortisol level—p = 0.45 Daily variations p > 0.08 (for interactions between ASD and both time of day contrasts) | [99] |
| ASD 16 F CTRL 29 F NA | DSM-V ICD-10/ NA | 18–50 29.9 ± 8.4 28.7 ± 9.0 | NA | UWMS | NA | NA | pg/mL Estradiol Testosterone Oxytocin | Mean (SD) 1.0 (±0.3); 1.2 (±0.5) 70.3 (±24.9); 69.4 (±21.4) 3.1 (±0.5); 2.8 (±0.16) | ELISA RIA | p = 0.19 p = 0.91 p = 0.064 | [102] |
| ASD 17 M CTRL 24 M Japan | DSM-V DISCO/ NA | 27.4 ± 7.2 29.0 ± 9.8 | NA | Salivette | NA | NA | pg/mL Oxytocin | 36.2 (13.2); 43.6 (17.0) | ELISA | p = 0.154 | [103] |
| ASD 11 M, 9 F CTRL 15 M,13 F NA | ADOS DSM-IV-TR CARS/ NA | 3–10 | Before blood draw 20 min after 40 min after | Salivette Sorbette | NA | NA | µg/dL; log-transformed Cortisol | Mean (SEM), ASD; CTRL 0.242 (0.061); 0.175 (0.024) 0.426 (0.107); 0.132 (0.018) 0.329 (0.111); 0.011 (0.018) | EIA | p = 0.242 p = 0.014 ↑ ASD p = 0.057 | [104] |
| ASD M 22, F 4 CTRL M 23, F 3 NA | ADOS-G ADI-R DSM-IV/ NA | Age in months 45.1 ± 8.9 39.4 ± 10.5 | Waking within 30 min Midday 2 p.m. Bedtime within 30 min Waking 2 Midday 2 Bedtime 2 | Kool-Aid drink swab | 0.5–1.0 mL | nmol/L Cortisol | Coefficient 0.17 (CI, −0.08–0.49) | ELISA Kinetic reaction assay | p > 0.23 | [109] | |
| ASD 21 M, 1 F CTRL 19 M, 3 F California | ADOS ADI DSM-IV/ NA | 8.81 ± 1.90 9.35 ± 1.75 | M1—waking A1—afternoon (1–4 p.m.) E1—30min bedtime Collection 6 days during 2 weeks | chewing gum | NA | Refrigerated until the end of collection Frozen 6000 rpm 10 min | nmol/L Cortisol M1 A1 E1 M2 A2 E2 M3 A3 E3 M4 A4 E4 M5 A5 E5 M6 A6 E6 | Mean (SD), ASD; CTRL 15.60 (16.90); 11.40 (6.87) 3.90 (2.92); 3.14 (1.34) 2.31 (3.39); 1.46 (0.72) 10.30 (3.39); 9.83 (4.63) 3.25 (2.17); 3.03 (1.57) 2.53 (3.18); 1.26 (0.21) 11.70 (7.07); 12.10 (5.97) 3.60 (3.20); 3.22 (1.64) 4.94 (12.0); 1.40 (0.30) 11.20 (5.02); 11.30 (5.81) 4.84 (4.94); 2.97 (1.30) 2.50 (2.86); 1.31 (0.46) 8.88 (4.14); 11.60 (6.50) 4.76 (3.68); 3.40 (1.54) 2.05 (1.63); 1.53 (0.57) 8.15 (6.12); 10.70 (4.29) 4.60 (7.72); 3.17 1.77) 3.07 (4.56); 1.53 (0.57) | RIA | E concentration over 6 days p = 0.021 E2-E5 ↑ ASD p < 0.04 Multiple regression Time p > 0.05 Sleep p > 0.05 Age p > 0.05 | [110] |
| ASD 50 CTRL 50 NA | NA/ NA | 6–12 | 2× 8–8:30 a.m. 2× 4–4:15 p.m. | UWMS | 2 min drooling intervals/2mL | Non-C | Cortisol (NA) 1st day morning 1st day evening 2nd day morning 2nd day evening | Mean (SD) 57.12 (14.108); 96.16 (15.694) 101.4 (17.647); 66.39 (11.735) 57.96 (13.883); 96.73 (16.569) 102 (17.827); 66.55 (12.099) | ECL | ↓ ASD (<0.001) ↑ ASD (<0.001) ↓ ASD (<0.001) ↑ ASD (<0.001) | [111] |
4.5. Protein and Inflammatory Markers
| Children No. ASD No. CTRL Geographic Region | ASD Dg. Tool/ Module | Age (Years) ASD CTRL | Timing | Saliva | Duration of Sal/ Volume | Centrif | Marker | Method | Results ↓↑ in ASD | Ref |
|---|---|---|---|---|---|---|---|---|---|---|
| ASD 27 CTRL 23 NA | NA | 2–15 years | NA | NA | NA | NA | proteome | NA | Hypophosphorylation of histatin, statherin, proline-rich phosphopeptide | [118] |
| ASD 6 M, 0 F CTRL 6 M, 0 F NA | DSM-5/ NA | 11.67 ± 2.49 9.5 ± 2.22 | NA | Passive drool into a straw and collection cup | 1–2 mL | 20 min | proteome | nanoLC-MS/MS | ↑ prolactin-inducible protein, lactotransferrin, Ig kappa chain C region, Ig gamma-1 chain C region, neutrophil elastase, polymeric immunoglobulin receptor, deleted malignant brain tumors 1 ↓ acidic proline rich phosphoprotein, Statherin, histatin-1 | [119] |
| ASD 6 M, 0 F CTRL 6 M, 0 F NA | DSM-5/ NA | 11.67 ± 2.49 9.5 ± 2.22 | NA | Passive drool into a straw and collection cup | 1–2 mL | 14000 rpm 10 min | proteome | 2D-PAGE, nanoLC-MS/MS | ↑ proto-oncogene FRAT1, Ig alpha-1 chain C region, immunoglobulin heavy chain constant region alpha-2 subunit, V-type proton ATPase subunit C 1, Kinesin family member 14, Integrin alpha 6 subunit, growth hormone regulated TBC protein 1, parotid secretory protein, Prolactin-inducible protein precursor, Mucin-16, Ca binding protein MRP14 ↓ alpha-amylase, CREB-binding protein, p532, Transferrin variant, Protein-L-isoaspartate O-methyltransferase domain-containing protein 1 isoform 3, Chain A of Human Pancreatic Alpha-Amylase In Complex With Myricetin, V-type proton ATPase subunit C 1, Ig J-chain, Zn alpha2 glycoprotein, Glutamate-rich protein 6B, Immunoglobulin heavy chain variable region, Albumin protein, Sperm activating protein subunit I-Apo A1-SPAP-subunit I, Zymogen granule protein 16 homologue B precursor, Putative lipocalin 1-like protein 1, cystatin D, plasminogen | [120] |
| ASD 18 M, 1 F CTRL 15 M, 4 F Poland | DSM-5, ADOS-2/ NA | 6.78 ± 2.8 6.84 ± 2.52 | 9–11 a.m. | Salivette collection tube | 5 min/>1 mL | 4500 g 10 min | Eotaxin, RANTES, IL-6, IL-8, IL-1β, TNF-α, MCP-1 | Luminex | ↓ RANTES | [121] |
4.6. Oxidative Stress Markers
4.7. pH, Ions, and Buffering Capacity
5. Conclusions
Author Contributions
Funding
Institutional Review Board Statement
Informed Consent Statement
Data Availability Statement
Acknowledgments
Conflicts of Interest
References
- Hodges, H.; Fealko, C.; Soares, N. Autism spectrum disorder: Definition, epidemiology, causes, and clinical evaluation. Transl. Pediatrics 2020, 9 (Suppl. 1), S55–S65. [Google Scholar] [CrossRef]
- Maenner, M.J.; Shaw, K.A.; Baio, J.; Washington, A.; Patrick, M.; DiRienzo, M.; Christensen, D.L.; Wiggins, L.D.; Pettygrove, S.; Andrews, J.G.; et al. Prevalence of Autism Spectrum Disorder among Children Aged 8 Years—Autism and Developmental Disabilities Monitoring Network, 11 Sites, United States, 2016. MMWR Surveill. Summ. 2020, 69, 1–12. [Google Scholar] [CrossRef]
- Kosidou, K.; Dalman, C.; Widman, L.; Arver, S.; Lee, B.K.; Magnusson, C.; Gardner, R.M. Maternal polycystic ovary syndrome and the risk of autism spectrum disorders in the offspring: A population-based nationwide study in Sweden. Mol. Psychiatry 2016, 21, 1441–1448. [Google Scholar] [CrossRef] [Green Version]
- Imbriani, G.; Panico, A.; Grassi, T.; Idolo, A.; Serio, F.; Bagordo, F.; De Filippis, G.; De Giorgi, D.; Antonucci, G.; Piscitelli, P.; et al. Early-Life Exposure to Environmental Air Pollution and Autism Spectrum Disorder: A Review of Available Evidence. Int. J. Environ. Res. Public Health 2021, 18, 1204. [Google Scholar] [CrossRef]
- Iossifov, I.; O’Roak, B.J.; Sanders, S.J.; Ronemus, M.; Krumm, N.; Levy, D.; Stessman, H.A.; Witherspoon, K.T.; Vives, L.; Patterson, K.E.; et al. The contribution of de novo coding mutations to autism spectrum disorder. Nature 2014, 515, 216–221. [Google Scholar] [CrossRef] [Green Version]
- Jansakova, K.; Hill, M.; Celarova, D.; Celusakova, H.; Repiska, G.; Bicikova, M.; Macova, L.; Ostatnikova, D. Alteration of the steroidogenesis in boys with autism spectrum disorders. Transl. Psychiatry 2020, 10, 340. [Google Scholar] [CrossRef]
- Fombonne, E. Epidemiology of pervasive developmental disorders. Pediatr. Res. 2009, 65, 591–598. [Google Scholar] [CrossRef] [PubMed]
- Elsabbagh, M.; Divan, G.; Koh, Y.J.; Kim, Y.S.; Kauchali, S.; Marcin, C.; Montiel-Nava, C.; Patel, V.; Paula, C.S.; Wang, C.; et al. Global prevalence of autism and other pervasive developmental disorders. Autism Res. Off. J. Int. Soc. Autism Res. 2012, 5, 160–179. [Google Scholar] [CrossRef] [PubMed] [Green Version]
- Hansen, S.N.; Schendel, D.E.; Parner, E.T. Explaining the increase in the prevalence of autism spectrum disorders: The proportion attributable to changes in reporting practices. JAMA Pediatr. 2015, 169, 56–62. [Google Scholar] [CrossRef] [PubMed] [Green Version]
- Kim, Y.S.; Leventhal, B.L.; Koh, Y.J.; Fombonne, E.; Laska, E.; Lim, E.C.; Cheon, K.A.; Kim, S.J.; Kim, Y.K.; Lee, H.; et al. Prevalence of autism spectrum disorders in a total population sample. Am. J. Psychiatry 2011, 168, 904–912. [Google Scholar] [CrossRef] [PubMed] [Green Version]
- Christensen, D.L.; Maenner, M.J.; Bilder, D.; Constantino, J.N.; Daniels, J.; Durkin, M.S.; Fitzgerald, R.T.; Kurzius-Spencer, M.; Pettygrove, S.D.; Robinson, C.; et al. Prevalence and Characteristics of Autism Spectrum Disorder among Children Aged 4 Years—Early Autism and Developmental Disabilities Monitoring Network, Seven Sites, United States, 2010, 2012, and 2014. MMWR Surveill. Summ. 2019, 68, 1–19. [Google Scholar] [CrossRef] [PubMed] [Green Version]
- American Psychiatric Publishing. Diagnostic and Statistical Manual of Mental Disorders: DSM-5™, 5th ed.; American Psychiatric Publishing, Inc.: Arlington, VA, USA, 2013; p. 947. [Google Scholar]
- Lord, C.; Risi, S.; Lambrecht, L.; Cook, E.H., Jr.; Leventhal, B.L.; DiLavore, P.C.; Pickles, A.; Rutter, M. The autism diagnostic observation schedule-generic: A standard measure of social and communication deficits associated with the spectrum of autism. J. Autism Dev. Disord. 2000, 30, 205–223. [Google Scholar] [CrossRef]
- Lord, C.; Rutter, M.; Le Couteur, A. Autism Diagnostic Interview-Revised: A revised version of a diagnostic interview for caregivers of individuals with possible pervasive developmental disorders. J. Autism Dev. Disord. 1994, 24, 659–685. [Google Scholar] [CrossRef] [PubMed]
- Yoon, S.H.; Choi, J.; Lee, W.J.; Do, J.T. Genetic and Epigenetic Etiology Underlying Autism Spectrum Disorder. J. Clin. Med. 2020, 9, 966. [Google Scholar] [CrossRef] [PubMed] [Green Version]
- Baron-Cohen, S.; Auyeung, B.; Norgaard-Pedersen, B.; Hougaard, D.M.; Abdallah, M.W.; Melgaard, L.; Cohen, A.S.; Chakrabarti, B.; Ruta, L.; Lombardo, M.V. Elevated fetal steroidogenic activity in autism. Mol. Psychiatry 2015, 20, 369–376. [Google Scholar] [CrossRef] [Green Version]
- Pivovarciova, A.; Durdiakova, J.; Babinska, K.; Kubranska, A.; Vokalova, L.; Minarik, G.; Celec, P.; Murin, M.; Ostatnikova, D. Testosterone and Androgen Receptor Sensitivity in Relation to Hyperactivity Symptoms in Boys with Autism Spectrum Disorders. PLoS ONE 2016, 11, e0149657. [Google Scholar] [CrossRef]
- Galiana-Simal, A.; Munoz-Martinez, V.; Calero-Bueno, P.; Vela-Romero, M.; Beato-Fernandez, L. Towards a future molecular diagnosis of autism: Recent advances in biomarkers research from saliva samples. Int. J. Dev. Neurosci. Off. J. Int. Soc. Dev. Neurosci. 2018, 67, 1–5. [Google Scholar] [CrossRef] [PubMed]
- Pfaffe, T.; Cooper-White, J.; Beyerlein, P.; Kostner, K.; Punyadeera, C. Diagnostic potential of saliva: Current state and future applications. Clin. Chem. 2011, 57, 675–687. [Google Scholar] [CrossRef] [Green Version]
- Roi, A.; Rusu, L.C.; Roi, C.I.; Luca, R.E.; Boia, S.; Munteanu, R.I. A New Approach for the Diagnosis of Systemic and Oral Diseases Based on Salivary Biomolecules. Dis. Markers 2019, 2019, 8761860. [Google Scholar] [CrossRef] [Green Version]
- Page, M.J.; McKenzie, J.E.; Bossuyt, P.M.; Boutron, I.; Hoffmann, T.C.; Mulrow, C.D.; Shamseer, L.; Tetzlaff, J.M.; Akl, E.A.; Brennan, S.E.; et al. The PRISMA 2020 statement: An updated guideline for reporting systematic reviews. Syst. Rev. 2021, 10, 89. [Google Scholar] [CrossRef]
- Said, H.S.; Suda, W.; Nakagome, S.; Chinen, H.; Oshima, K.; Kim, S.; Kimura, R.; Iraha, A.; Ishida, H.; Fujita, J.; et al. Dysbiosis of salivary microbiota in inflammatory bowel disease and its association with oral immunological biomarkers. DNA Res. Int. J. Rapid Publ. Rep. Genes Genomes 2014, 21, 15–25. [Google Scholar] [CrossRef] [PubMed] [Green Version]
- Banasova, L.; Kamodyova, N.; Jansakova, K.; Tothova, L.; Stanko, P.; Turna, J.; Celec, P. Salivary DNA and markers of oxidative stress in patients with chronic periodontitis. Clin. Oral Investig. 2015, 19, 201–207. [Google Scholar] [CrossRef]
- Jansakova, K.; Escudier, M.; Tothova, L.; Proctor, G. Salivary changes in oxidative stress related to inflammation in oral and gastrointestinal diseases. Oral Dis. 2021, 27, 280–289. [Google Scholar] [CrossRef] [PubMed]
- Granger, D.A.; Kivlighan, K.T.; Fortunato, C.; Harmon, A.G.; Hibel, L.C.; Schwartz, E.B.; Whembolua, G.L. Integration of salivary biomarkers into developmental and behaviorally-oriented research: Problems and solutions for collecting specimens. Physiol. Behav. 2007, 92, 583–590. [Google Scholar] [CrossRef] [PubMed]
- Zimmermann, L.K. A salivary collection method for young children. Psychophysiology 2008, 45, 353–355. [Google Scholar] [CrossRef] [PubMed]
- Wiener, R.C.; Wu, B.; Crout, R.; Wiener, M.; Plassman, B.; Kao, E.; McNeil, D. Hyposalivation and xerostomia in dentate older adults. J. Am. Dent. Assoc. 2010, 141, 279–284. [Google Scholar] [CrossRef] [PubMed] [Green Version]
- Jensen, S.B.; Vissink, A. Salivary gland dysfunction and xerostomia in Sjogren’s syndrome. Oral Maxillofac. Surg. Clin. N. Am. 2014, 26, 35–53. [Google Scholar] [CrossRef] [PubMed]
- Putnam, S.K.; Lopata, C.; Fox, J.D.; Thomeer, M.L.; Rodgers, J.D.; Volker, M.A.; Lee, G.K.; Neilans, E.G.; Werth, J. Comparison of saliva collection methods in children with high-functioning autism spectrum disorders: Acceptability and recovery of cortisol. Child. Psychiatry Hum. Dev. 2012, 43, 560–573. [Google Scholar] [CrossRef]
- Holm-Hansen, C.; Tong, G.; Davis, C.; Abrams, W.R.; Malamud, D. Comparison of oral fluid collectors for use in a rapid point-of-care diagnostic device. Clin. Diagn. Lab. Immunol. 2004, 11, 909–912. [Google Scholar] [CrossRef] [Green Version]
- Gomar-Vercher, S.; Simon-Soro, A.; Montiel-Company, J.M.; Almerich-Silla, J.M.; Mira, A. Stimulated and unstimulated saliva samples have significantly different bacterial profiles. PLoS ONE 2018, 13, e0198021. [Google Scholar] [CrossRef] [Green Version]
- Okuma, N.; Saita, M.; Hoshi, N.; Soga, T.; Tomita, M.; Sugimoto, M.; Kimoto, K. Effect of masticatory stimulation on the quantity and quality of saliva and the salivary metabolomic profile. PLoS ONE 2017, 12, e0183109. [Google Scholar] [CrossRef] [Green Version]
- Jasim, H.; Olausson, P.; Hedenberg-Magnusson, B.; Ernberg, M.; Ghafouri, B. The proteomic profile of whole and glandular saliva in healthy pain-free subjects. Sci. Rep. 2016, 6, 39073. [Google Scholar] [CrossRef] [PubMed]
- Nunes, L.A.; Mussavira, S.; Bindhu, O.S. Clinical and diagnostic utility of saliva as a non-invasive diagnostic fluid: A systematic review. Biochem. Med. 2015, 25, 177–192. [Google Scholar] [CrossRef] [PubMed]
- Duarte, D.; Castro, B.; Pereira, J.L.; Marques, J.F.; Costa, A.L.; Gil, A.M. Evaluation of Saliva Stability for NMR Metabolomics: Collection and Handling Protocols. Metabolites 2020, 10, 515. [Google Scholar] [CrossRef] [PubMed]
- Esser, D.; Alvarez-Llamas, G.; de Vries, M.P.; Weening, D.; Vonk, R.J.; Roelofsen, H. Sample Stability and Protein Composition of Saliva: Implications for Its Use as a Diagnostic Fluid. Biomark. Insights 2008, 3, 25–27. [Google Scholar] [CrossRef] [PubMed]
- Takehara, S.; Yanagishita, M.; Podyma-Inoue, K.A.; Kawaguchi, Y. Degradation of MUC7 and MUC5B in human saliva. PLoS ONE 2013, 8, e69059. [Google Scholar] [CrossRef] [PubMed] [Green Version]
- Durdiakova, J.; Fabryova, H.; Koborova, I.; Ostatnikova, D.; Celec, P. The effects of saliva collection, handling and storage on salivary testosterone measurement. Steroids 2013, 78, 1325–1331. [Google Scholar] [CrossRef]
- Bhattarai, K.R.; Kim, H.R.; Chae, H.J. Compliance with Saliva Collection Protocol in Healthy Volunteers: Strategies for Managing Risk and Errors. Int. J. Med. Sci. 2018, 15, 823–831. [Google Scholar] [CrossRef] [Green Version]
- Hicks, S.D.; Uhlig, R.; Afshari, P.; Williams, J.; Chroneos, M.; Tierney-Aves, C.; Wagner, K.; Middleton, F.A. Oral microbiome activity in children with autism spectrum disorder. Autism Res. Off. J. Int. Soc. Autism Res. 2018, 11, 1286–1299. [Google Scholar] [CrossRef]
- Kong, X.; Liu, J.; Cetinbas, M.; Sadreyev, R.; Koh, M.; Huang, H.; Adeseye, A.; He, P.; Zhu, J.; Russell, H.; et al. New and Preliminary Evidence on Altered Oral and Gut Microbiota in Individuals with Autism Spectrum Disorder (ASD): Implications for ASD Diagnosis and Subtyping Based on Microbial Biomarkers. Nutrients 2019, 11, 2128. [Google Scholar] [CrossRef] [Green Version]
- Qiao, Y.; Wu, M.; Feng, Y.; Zhou, Z.; Chen, L.; Chen, F. Alterations of oral microbiota distinguish children with autism spectrum disorders from healthy controls. Sci. Rep. 2018, 8, 1597. [Google Scholar] [CrossRef] [Green Version]
- Pappa, E.; Vastardis, H.; Rahiotis, C. Chair-side saliva diagnostic tests: An evaluation tool for xerostomia and caries risk assessment in children with type 1 diabetes. J. Dent. 2020, 93, 103224. [Google Scholar] [CrossRef] [PubMed]
- Farah, R.; Haraty, H.; Salame, Z.; Fares, Y.; Ojcius, D.M.; Said Sadier, N. Salivary biomarkers for the diagnosis and monitoring of neurological diseases. Biomed. J. 2018, 41, 63–87. [Google Scholar] [CrossRef]
- Blomqvist, M.; Bejerot, S.; Dahllof, G. A cross-sectional study on oral health and dental care in intellectually able adults with autism spectrum disorder. BMC Oral Health 2015, 15, 81. [Google Scholar] [CrossRef] [Green Version]
- Kuter, B.; Guler, N. Caries experience, oral disorders, oral hygiene practices and socio-demographic characteristics of autistic children. Eur. J. Paediatr. Dent. 2019, 20, 237–241. [Google Scholar] [PubMed]
- Qiao, Y.; Shi, H.; Wang, H.; Wang, M.; Chen, F. Oral Health Status of Chinese Children with Autism Spectrum Disorders. Front. Psychiatry 2020, 11, 398. [Google Scholar] [CrossRef]
- Diab, H.M.; Motlaq, S.S.; Alsharare, A.; Alshammery, A.; Alshammery, N.; Khawja, S.G.; Shah, A.H. Comparison of Gingival Health and Salivary Parameters among Autistic and Non-Autistic School Children in Riyadh. J. Clin. Diagn. Res. 2016, 10, ZC110–ZC113. [Google Scholar] [CrossRef]
- Kuter, B.; Uzel, I. Evaluation of oral health status and oral disorders of children with autism spectrum disorders by gender. Arch. Pediatr. 2021, 28, 33–38. [Google Scholar] [CrossRef]
- Morales-Chavez, M.C.; Villarroel-Dorrego, M.; Salas, V. Salivary Factors Related to Caries in Children with Autism. J. Clin. Pediatr. Dent. 2019, 43, 22–26. [Google Scholar] [CrossRef] [PubMed]
- Zhang, Y.; Lin, L.; Liu, J.; Shi, L.; Lu, J. Dental Caries Status in Autistic Children: A Meta-analysis. J. Autism Dev. Disord. 2020, 50, 1249–1257. [Google Scholar] [CrossRef]
- Leiva-García, B.; Planells, E.; del Pozo, P.P.; Molina-López, J. Association between Feeding Problems and Oral Health Status in Children with Autism Spectrum Disorder. J. Autism Dev. Disord. 2019, 49, 4997–5008. [Google Scholar] [CrossRef]
- Malhi, P.; Venkatesh, L.; Bharti, B.; Singhi, P. Feeding Problems and Nutrient Intake in Children with and without Autism: A Comparative Study. Indian J. Pediatr. 2017, 84, 283–288. [Google Scholar] [CrossRef] [PubMed]
- Ahearn, W.H.; Castine, T.; Nault, K.; Green, G. An assessment of food acceptance in children with autism or pervasive developmental disorder-not otherwise specified. J. Autism Dev. Disord. 2001, 31, 505–511. [Google Scholar] [CrossRef]
- Bolte, E.R. Autism and Clostridium tetani. Med. Hypotheses 1998, 51, 133–144. [Google Scholar] [CrossRef]
- Finegold, S.M.; Molitoris, D.; Song, Y.; Liu, C.; Vaisanen, M.L.; Bolte, E.; McTeague, M.; Sandler, R.; Wexler, H.; Marlowe, E.M.; et al. Gastrointestinal microflora studies in late-onset autism. Clin. Infect. Dis. 2002, 35 (Suppl. 1), S6–S16. [Google Scholar] [CrossRef] [PubMed]
- Bhandary, S.; Hari, N. Salivary biomarker levels and oral health status of children with autistic spectrum disorders: A comparative study. Eur. Arch. Paediatr. Dent. 2017, 18, 91–96. [Google Scholar] [CrossRef]
- Braam, W.; Keijzer, H.; Struijker Boudier, H.; Didden, R.; Smits, M.; Curfs, L. CYP1A2 polymorphisms in slow melatonin metabolisers: A possible relationship with autism spectrum disorder? J. Intellect. Disabil. Res. 2013, 57, 993–1000. [Google Scholar] [CrossRef]
- Ostheim, P.; Tichy, A.; Sirak, I.; Davidkova, M.; Stastna, M.M.; Kultova, G.; Paunesku, T.; Woloschak, G.; Majewski, M.; Port, M.; et al. Overcoming challenges in human saliva gene expression measurements. Sci. Rep. 2020, 10, 11147. [Google Scholar] [CrossRef]
- De Rubeis, S.; Buxbaum, J.D. Genetics and genomics of autism spectrum disorder: Embracing complexity. Hum. Mol. Genet. 2015, 24, R24–R31. [Google Scholar] [CrossRef]
- Bralten, J.; van Hulzen, K.J.; Martens, M.B.; Galesloot, T.E.; Vasquez, A.A.; Kiemeney, L.A.; Buitelaar, J.K.; Muntjewerff, J.W.; Franke, B.; Poelmans, G. Autism spectrum disorders and autistic traits share genetics and biology. Mol. Psychiatry 2018, 23, 1205–1212. [Google Scholar] [CrossRef] [Green Version]
- Guo, H.; Duyzend, M.H.; Coe, B.P.; Baker, C.; Hoekzema, K.; Gerdts, J.; Turner, T.N.; Zody, M.C.; Beighley, J.S.; Murali, S.C.; et al. Genome sequencing identifies multiple deleterious variants in autism patients with more severe phenotypes. Genet. Med. 2019, 21, 1611–1620. [Google Scholar] [CrossRef]
- Feliciano, P.; Zhou, X.; Astrovskaya, I.; Turner, T.N.; Wang, T.; Brueggeman, L.; Barnard, R.; Hsieh, A.; Snyder, L.G.; Muzny, D.M.; et al. Exome sequencing of 457 autism families recruited online provides evidence for autism risk genes. NPJ Genom. Med. 2019, 4, 19. [Google Scholar] [CrossRef] [Green Version]
- Jacquemont, S.; Coe, B.P.; Hersch, M.; Duyzend, M.H.; Krumm, N.; Bergmann, S.; Beckmann, J.S.; Rosenfeld, J.A.; Eichler, E.E. A higher mutational burden in females supports a “female protective model” in neurodevelopmental disorders. Am. J. Hum. Genet. 2014, 94, 415–425. [Google Scholar] [CrossRef] [Green Version]
- Bourgeron, T. From the genetic architecture to synaptic plasticity in autism spectrum disorder. Nat. Rev. Neurosci. 2015, 16, 551–563. [Google Scholar] [CrossRef] [PubMed]
- Hicks, S.D.; Ignacio, C.; Gentile, K.; Middleton, F.A. Salivary miRNA profiles identify children with autism spectrum disorder, correlate with adaptive behavior, and implicate ASD candidate genes involved in neurodevelopment. BMC Pediatrics 2016, 16, 52. [Google Scholar] [CrossRef] [PubMed] [Green Version]
- Coolen, M.; Bally-Cuif, L. MicroRNAs in brain development and physiology. Curr. Opin. Neurobiol. 2009, 19, 461–470. [Google Scholar] [CrossRef] [PubMed]
- Hu, Y.; Ehli, E.A.; Boomsma, D.I. MicroRNAs as biomarkers for psychiatric disorders with a focus on autism spectrum disorder: Current progress in genetic association studies, expression profiling, and translational research. Autism Res. 2017, 10, 1184–1203. [Google Scholar] [CrossRef] [PubMed]
- Shen, L.; Lin, Y.; Sun, Z.; Yuan, X.; Chen, L.; Shen, B. Knowledge-Guided Bioinformatics Model for Identifying Autism Spectrum Disorder Diagnostic MicroRNA Biomarkers. Sci. Rep. 2016, 6, 39663. [Google Scholar] [CrossRef]
- Konecna, B.; Radosinska, J.; Kemenyova, P.; Repiska, G. Detection of disease-associated microRNAs—Application for autism spectrum disorders. Rev. Neurosci. 2020, 31, 757–769. [Google Scholar] [CrossRef]
- Hicks, S.D.; Rajan, A.T.; Wagner, K.E.; Barns, S.; Carpenter, R.L.; Middleton, F.A. Validation of a Salivary RNA Test for Childhood Autism Spectrum Disorder. Front. Genet. 2018, 9, 534. [Google Scholar] [CrossRef] [PubMed] [Green Version]
- Wagner, K.E.; McCormick, J.B.; Barns, S.; Carney, M.; Middleton, F.A.; Hicks, S.D. Parent Perspectives towards Genetic and Epigenetic Testing for Autism Spectrum Disorder. J. Autism Dev. Disord. 2020, 50, 3114–3125. [Google Scholar] [CrossRef] [Green Version]
- Hicks, S.D.; Carpenter, R.L.; Wagner, K.E.; Pauley, R.; Barros, M.; Tierney-Aves, C.; Barns, S.; Greene, C.D.; Middleton, F.A. Saliva MicroRNA Differentiates Children with Autism from Peers with Typical and Atypical Development. J. Am. Acad. Child. Adolesc. Psychiatry 2020, 59, 296–308. [Google Scholar] [CrossRef] [Green Version]
- Sehovic, E.; Spahic, L.; Smajlovic-Skenderagic, L.; Pistoljevic, N.; Dzanko, E.; Hajdarpasic, A. Identification of developmental disorders including autism spectrum disorder using salivary miRNAs in children from Bosnia and Herzegovina. PLoS ONE 2020, 15, e0232351. [Google Scholar] [CrossRef]
- Levitskiy, D.; Confair, A.; Wagner, K.E.; DeVita, S.; Shea, N.; McKernan, E.P.; Kopec, J.; Russo, N.; Middleton, F.A.; Hicks, S.D. Longitudinal stability of salivary microRNA biomarkers in children and adolescents with autism spectrum disorder. Res. Autism Spectr. Disord. 2021, 85, 101788. [Google Scholar] [CrossRef] [PubMed]
- Ragusa, M.; Santagati, M.; Mirabella, F.; Lauretta, G.; Cirnigliaro, M.; Brex, D.; Barbagallo, C.; Domini, C.N.; Gulisano, M.; Barone, R.; et al. Potential Associations among Alteration of Salivary miRNAs, Saliva Microbiome Structure, and Cognitive Impairments in Autistic Children. Int. J. Mol. Sci. 2020, 21, 6203. [Google Scholar] [CrossRef] [PubMed]
- Wu, Y.E.; Parikshak, N.N.; Belgard, T.G.; Geschwind, D.H. Genome-wide, integrative analysis implicates microRNA dysregulation in autism spectrum disorder. Nat. Neurosci. 2016, 19, 1463–1476. [Google Scholar] [CrossRef] [PubMed]
- De Magistris, L.; Familiari, V.; Pascotto, A.; Sapone, A.; Frolli, A.; Iardino, P.; Carteni, M.; De Rosa, M.; Francavilla, R.; Riegler, G.; et al. Alterations of the intestinal barrier in patients with autism spectrum disorders and in their first-degree relatives. J. Pediatr. Gastroenterol. Nutr. 2010, 51, 418–424. [Google Scholar] [CrossRef] [PubMed] [Green Version]
- Goodwin, M.S.; Cowen, M.A.; Goodwin, T.C. Malabsorption and cerebral dysfunction: A multivariate and comparative study of autistic children. J. Autism Child. Schizophr. 1971, 1, 48–62. [Google Scholar] [CrossRef]
- D’Eufemia, P.; Celli, M.; Finocchiaro, R.; Pacifico, L.; Viozzi, L.; Zaccagnini, M.; Cardi, E.; Giardini, O. Abnormal intestinal permeability in children with autism. Acta Paediatr. 1996, 85, 1076–1079. [Google Scholar] [CrossRef]
- Sun, Z.; Cade, J.R.; Fregly, M.J.; Privette, R.M. β-Casomorphin Induces Fos-Like Immunoreactivity in Discrete Brain Regions Relevant to Schizophrenia and Autism. Autism Int. J. Res. Pract. 1999, 3, 67–83. [Google Scholar] [CrossRef]
- Van Sadelhoff, J.H.J.; Perez Pardo, P.; Wu, J.; Garssen, J.; van Bergenhenegouwen, J.; Hogenkamp, A.; Hartog, A.; Kraneveld, A.D. The Gut-Immune-Brain Axis in Autism Spectrum Disorders; A Focus on Amino Acids. Front. Endocrinol. 2019, 10, 247. [Google Scholar] [CrossRef] [PubMed]
- Benach, J.L.; Li, E.; McGovern, M.M. A microbial association with autism. mBio 2012, 3, e00019-12. [Google Scholar] [CrossRef] [PubMed] [Green Version]
- Jaber, M.A. Dental caries experience, oral health status and treatment needs of dental patients with autism. J. Appl. Oral Sci. 2011, 19, 212–217. [Google Scholar] [CrossRef] [Green Version]
- Jaber, M.A.; Sayyab, M.; Abu Fanas, S.H. Oral health status and dental needs of autistic children and young adults. J. Investig. Clin. Dent. 2011, 2, 57–62. [Google Scholar] [CrossRef] [PubMed]
- Krajmalnik-Brown, R.; Lozupone, C.; Kang, D.W.; Adams, J.B. Gut bacteria in children with autism spectrum disorders: Challenges and promise of studying how a complex community influences a complex disease. Microb. Ecol. Health Dis. 2015, 26, 26914. [Google Scholar] [CrossRef]
- Galland, L. The gut microbiome and the brain. J. Med. Food 2014, 17, 1261–1272. [Google Scholar] [CrossRef]
- Forsyth, A.; Raslan, K.; Lyashenko, C.; Bona, S.; Snow, M.; Khor, B.; Herrman, E.; Ortiz, S.; Choi, D.; Maier, T.; et al. Children with autism spectrum disorder: Pilot studies examining the salivary microbiome and implications for gut metabolism and social behavior. Hum. Microbiome J. 2020, 15, 100066. [Google Scholar] [CrossRef]
- Ding, H.T.; Taur, Y.; Walkup, J.T. Gut Microbiota and Autism: Key Concepts and Findings. J. Autism Dev. Disord. 2017, 47, 480–489. [Google Scholar] [CrossRef]
- Kang, V.; Wagner, G.C.; Ming, X. Gastrointestinal dysfunction in children with autism spectrum disorders. Autism Res. Off. J. Int. Soc. Autism Res. 2014, 7, 501–506. [Google Scholar] [CrossRef]
- Malamud, D. Saliva as a diagnostic fluid. Dent. Clin. N. Am. 2011, 55, 159–178. [Google Scholar] [CrossRef] [Green Version]
- Alhajj, M.; Farhana, A. Enzyme Linked Immunosorbent Assay. In StatPearls 2021; StatPearls: Treasure Island, FL, USA, 2021. [Google Scholar]
- Majewska, M.D.; Hill, M.; Urbanowicz, E.; Rok-Bujko, P.; Bienkowski, P.; Namyslowska, I.; Mierzejewski, P. Marked elevation of adrenal steroids, especially androgens, in saliva of prepubertal autistic children. Eur. Child. Adolesc. Psychiatry 2014, 23, 485–498. [Google Scholar] [CrossRef] [PubMed] [Green Version]
- Hollocks, M.J.; Howlin, P.; Papadopoulos, A.S.; Khondoker, M.; Simonoff, E. Differences in HPA-axis and heart rate responsiveness to psychosocial stress in children with autism spectrum disorders with and without co-morbid anxiety. Psychoneuroendocrinology 2014, 46, 32–45. [Google Scholar] [CrossRef]
- Bakker-Huvenaars, M.J.; Greven, C.U.; Herpers, P.; Wiegers, E.; Jansen, A.; van der Steen, R.; van Herwaarden, A.E.; Baanders, A.N.; Nijhof, K.S.; Scheepers, F.; et al. Saliva oxytocin, cortisol, and testosterone levels in adolescent boys with autism spectrum disorder, oppositional defiant disorder/conduct disorder and typically developing individuals. Eur. Neuropsychopharmacol. J. Eur. Coll. Neuropsychopharmacol. 2020, 30, 87–101. [Google Scholar] [CrossRef] [PubMed]
- Tomarken, A.J.; Han, G.T.; Corbett, B.A. Temporal patterns, heterogeneity, and stability of diurnal cortisol rhythms in children with autism spectrum disorder. Psychoneuroendocrinology 2015, 62, 217–226. [Google Scholar] [CrossRef] [Green Version]
- Muscatello, R.A.; Corbett, B.A. Comparing the effects of age, pubertal development, and symptom profile on cortisol rhythm in children and adolescents with autism spectrum disorder. Autism Res. Off. J. Int. Soc. Autism Res. 2018, 11, 110–120. [Google Scholar] [CrossRef] [PubMed] [Green Version]
- Tordjman, S.; Anderson, G.M.; Kermarrec, S.; Bonnot, O.; Geoffray, M.M.; Brailly-Tabard, S.; Chaouch, A.; Colliot, I.; Trabado, S.; Bronsard, G.; et al. Altered circadian patterns of salivary cortisol in low-functioning children and adolescents with autism. Psychoneuroendocrinology 2014, 50, 227–245. [Google Scholar] [CrossRef]
- Corbett, B.A.; Mendoza, S.; Abdullah, M.; Wegelin, J.A.; Levine, S. Cortisol circadian rhythms and response to stress in children with autism. Psychoneuroendocrinology 2006, 31, 59–68. [Google Scholar] [CrossRef]
- Jamnadass, E.S.; Keelan, J.A.; Hollier, L.P.; Hickey, M.; Maybery, M.T.; Whitehouse, A.J. The perinatal androgen to estrogen ratio and autistic-like traits in the general population: A longitudinal pregnancy cohort study. J. Neurodev. Disord. 2015, 7, 17. [Google Scholar] [CrossRef] [PubMed] [Green Version]
- Auyeung, B.; Taylor, K.; Hackett, G.; Baron-Cohen, S. Foetal testosterone and autistic traits in 18 to 24-month-old children. Mol. Autism 2010, 1, 11. [Google Scholar] [CrossRef] [Green Version]
- Procyshyn, T.L.; Lombardo, M.V.; Lai, M.C.; Auyeung, B.; Crockford, S.K.; Deakin, J.; Soubramanian, S.; Sule, A.; Baron-Cohen, S.; Bethlehem, R.A.I. Effects of oxytocin administration on salivary sex hormone levels in autistic and neurotypical women. Mol. Autism 2020, 11, 20. [Google Scholar] [CrossRef] [Green Version]
- Fujioka, T.; Fujisawa, T.X.; Inohara, K.; Okamoto, Y.; Matsumura, Y.; Tsuchiya, K.J.; Katayama, T.; Munesue, T.; Tomoda, A.; Wada, Y.; et al. Attenuated relationship between salivary oxytocin levels and attention to social information in adolescents and adults with autism spectrum disorder: A comparative study. Ann. Gen. Psychiatry 2020, 19, 38. [Google Scholar] [CrossRef]
- Groschl, M.; Wagner, R.; Rauh, M.; Dorr, H.G. Stability of salivary steroids: The influences of storage, food and dental care. Steroids 2001, 66, 737–741. [Google Scholar] [CrossRef]
- Garde, A.H.; Hansen, A.M. Long-term stability of salivary cortisol. Scand. J. Clin. Lab. Investig. 2005, 65, 433–436. [Google Scholar] [CrossRef] [PubMed]
- Skoluda, N.; La Marca, R.; Gollwitzer, M.; Muller, A.; Limm, H.; Marten-Mittag, B.; Gundel, H.; Angerer, P.; Nater, U.M. Long-term stability of diurnal salivary cortisol and alpha-amylase secretion patterns. Physiol. Behav. 2017, 175, 1–8. [Google Scholar] [CrossRef] [PubMed]
- Zhu, C.; Yuan, C.; Ren, Q.; Wei, F.; Yu, S.; Sun, X.; Zheng, S. Comparative analysis of the effects of collection methods on salivary steroids. BMC Oral Health 2021, 21, 352. [Google Scholar] [CrossRef] [PubMed]
- Spratt, E.G.; Nicholas, J.S.; Brady, K.T.; Carpenter, L.A.; Hatcher, C.R.; Meekins, K.A.; Furlanetto, R.W.; Charles, J.M. Enhanced cortisol response to stress in children in autism. J. Autism Dev. Disord. 2012, 42, 75–81. [Google Scholar] [CrossRef] [PubMed] [Green Version]
- Kidd, S.A.; Corbett, B.A.; Granger, D.A.; Boyce, W.T.; Anders, T.F.; Tager, I.B. Daytime secretion of salivary cortisol and alpha-amylase in preschool-aged children with autism and typically developing children. J. Autism Dev. Disord. 2012, 42, 2648–2658. [Google Scholar] [CrossRef] [Green Version]
- Corbett, B.A.; Mendoza, S.; Wegelin, J.A.; Carmean, V.; Levine, S. Variable cortisol circadian rhythms in children with autism and anticipatory stress. J. Psychiatry Neurosci. Jpn. 2008, 33, 227–234. [Google Scholar]
- Abdulla, A.M.; Hegde, A.M. Salivary Cortisol Levels and its Implication on Behavior In Children with Autism during Dental Treatment. J. Clin. Pediatric Dent. 2015, 39, 128–132. [Google Scholar] [CrossRef]
- Ander, S.E.; Diamond, M.S.; Coyne, C.B. Immune responses at the maternal-fetal interface. Sci. Immunol. 2019, 4, eaat6114. [Google Scholar] [CrossRef]
- Boulanger-Bertolus, J.; Pancaro, C.; Mashour, G.A. Increasing Role of Maternal Immune Activation in Neurodevelopmental Disorders. Front. Behav. Neurosci. 2018, 12, 230. [Google Scholar] [CrossRef] [Green Version]
- Jash, S.; Sharma, S. In utero immune programming of autism spectrum disorder (ASD). Hum. Immunol. 2021, 82, 379–384. [Google Scholar] [CrossRef] [PubMed]
- Saghazadeh, A.; Ataeinia, B.; Keynejad, K.; Abdolalizadeh, A.; Hirbod-Mobarakeh, A.; Rezaei, N. A meta-analysis of pro-inflammatory cytokines in autism spectrum disorders: Effects of age, gender, and latitude. J. Psychiatr. Res. 2019, 115, 90–102. [Google Scholar] [CrossRef]
- Loo, J.A.; Yan, W.; Ramachandran, P.; Wong, D.T. Comparative human salivary and plasma proteomes. J. Dent. Res. 2010, 89, 1016–1023. [Google Scholar] [CrossRef] [Green Version]
- Campanati, A.; Martina, E.; Diotallevi, F.; Radi, G.; Marani, A.; Sartini, D.; Emanuelli, M.; Kontochristopoulos, G.; Rigopoulos, D.; Gregoriou, S.; et al. Saliva Proteomics as Fluid Signature of Inflammatory and Immune-Mediated Skin Diseases. Int. J. Mol. Sci. 2021, 22, 7018. [Google Scholar] [CrossRef] [PubMed]
- Castagnola, M.; Messana, I.; Inzitari, R.; Fanali, C.; Cabras, T.; Morelli, A.; Pecoraro, A.M.; Neri, G.; Torrioli, M.G.; Gurrieri, F. Hypo-phosphorylation of salivary peptidome as a clue to the molecular pathogenesis of autism spectrum disorders. J. Proteome Res. 2008, 7, 5327–5332. [Google Scholar] [CrossRef] [PubMed]
- Ngounou Wetie, A.G.; Wormwood, K.L.; Russell, S.; Ryan, J.P.; Darie, C.C.; Woods, A.G. A Pilot Proteomic Analysis of Salivary Biomarkers in Autism Spectrum Disorder. Autism Res. Off. J. Int. Soc. Autism Res. 2015, 8, 338–350. [Google Scholar] [CrossRef] [PubMed]
- Ngounou Wetie, A.G.; Wormwood, K.L.; Charette, L.; Ryan, J.P.; Woods, A.G.; Darie, C.C. Comparative two-dimensional polyacrylamide gel electrophoresis of the salivary proteome of children with autism spectrum disorder. J. Cell Mol. Med. 2015, 19, 2664–2678. [Google Scholar] [CrossRef]
- Samborska-Mazur, J.; Kostiukow, A.; Miechowicz, I.; Sikorska, D.; Rutkowski, R.; Wyganowska-Swiatkowska, M.; Blochowiak, K. Salivary Cytokine Profile as a Possible Predictor of Autism Spectrum Disorder. J. Clin. Med. 2020, 9, 3101. [Google Scholar] [CrossRef] [PubMed]
- Wang, K.; Wang, X.; Zheng, S.; Niu, Y.; Zheng, W.; Qin, X.; Li, Z.; Luo, J.; Jiang, W.; Zhou, X.; et al. iTRAQ-based quantitative analysis of age-specific variations in salivary proteome of caries-susceptible individuals. J. Transl. Med. 2018, 16, 293. [Google Scholar] [CrossRef]
- Kobayashi, H.; Song, C.; Ikei, H.; Park, B.J.; Kagawa, T.; Miyazaki, Y. Diurnal Changes in Distribution Characteristics of Salivary Cortisol and Immunoglobulin A Concentrations. Int. J. Environ. Res. Public Health 2017, 14, 987. [Google Scholar] [CrossRef] [PubMed] [Green Version]
- Chen, L.; Shi, X.J.; Liu, H.; Mao, X.; Gui, L.N.; Wang, H.; Cheng, Y. Oxidative stress marker aberrations in children with autism spectrum disorder: A systematic review and meta-analysis of 87 studies (N = 9109). Transl. Psychiatry 2021, 11, 15. [Google Scholar] [CrossRef] [PubMed]
- Rai, K.; Hegde, A.M.; Jose, N. Salivary antioxidants and oral health in children with autism. Arch. Oral Biol. 2012, 57, 1116–1120. [Google Scholar] [CrossRef] [PubMed]
- Fahad, A.; Jafer, N. Salivary Physicochemical Characteristics in Relation to Oral Health Status among Institutionalized Autistic Adolescents in Baghdad/Iraq. J. Baghdad Coll. Dent. 2017, 29, 68–73. [Google Scholar]
- Karamouzi, A.; Kovachev, D.; Karamouzis, I.; Antoniadou-Hitoglou, M.; Tsikoulas, I.; Aggelopoulou-Sakadami, N. Saliva Levels of 15-F 2t -Isoprostane as Biomarker of Lipid Peroxidation in Autistic Children. Eur. J. Inflamm. 2007, 5, 141–144. [Google Scholar] [CrossRef] [Green Version]
- Lettrichova, I.; Tothova, L.; Hodosy, J.; Behuliak, M.; Celec, P. Variability of salivary markers of oxidative stress and antioxidant status in young healthy individuals. Redox Rep. Commun. Free Radic. Res. 2016, 21, 24–30. [Google Scholar] [CrossRef] [Green Version]
- Demirci, E.; Guler, Y.; Ozmen, S.; Canpolat, M.; Kumandas, S. Levels of Salivary Sialic Acid in Children with Autism Spectrum Disorder; Could It Be Related to Stereotypes and Hyperactivity? Clin. Psychopharmacol. Neurosci. Off. Sci. J. Korean Coll. Neuropsychopharmacol. 2019, 17, 415–422. [Google Scholar] [CrossRef]
- Kubala, E.; Strzelecka, P.; Grzegocka, M.; Lietz-Kijak, D.; Gronwald, H.; Skomro, P.; Kijak, E. A Review of Selected Studies That Determine the Physical and Chemical Properties of Saliva in the Field of Dental Treatment. Biomed. Res. Int. 2018, 2018, 6572381. [Google Scholar] [CrossRef]
- Loke, C.; Lee, J.; Sander, S.; Mei, L.; Farella, M. Factors affecting intra-oral pH—A review. J. Oral Rehabil. 2016, 43, 778–785. [Google Scholar] [CrossRef]
- Bassoukou, I.H.; Nicolau, J.; dos Santos, M.T. Saliva flow rate, buffer capacity, and pH of autistic individuals. Clin. Oral Investig. 2009, 13, 23–27. [Google Scholar] [CrossRef]

| Children No. ASD No. CTRL Geographic Region | ASD Dg. tool/ Module | Age (years) ASD CTRL | Timing | Saliva | Duration of sal/Volume | Centrif | Marker | Concentration Mean (±SD) ASD CTRL | Method | Results ↓↑ | Ref |
|---|---|---|---|---|---|---|---|---|---|---|---|
| ASD 34 M CTRL 34 M Venezuela | NA/ Grade 1–2 | 8.12 ± 1.92 | NA | NA | NA | NA | nmol/L Ca P | 0.621 ± 0.35; 0.89 ± 0.51 6.17 ± 4.22; 5.51 ± 4.86 | ↓ ASD, p = 0.013 | [50] | |
| ASD 20 M, 10 F CTRL sib 8 M, 22 F Karnataka | NA/ NA | 6–12 | 9–11 a.m. | UWMS | 1 min | NA | mL/min Salivary flow pH | 0.8 (0.35); 0.78(0.47) 6.49 (0.58); 7.08(0.62) | pH strip | p > 0.05 ↑ ASD p < 0.05 | [57] |
| ASD 101 CTRL 50 sib NA | NA/ NA | 6–12 | 9–10 a.m. | UWMS | NA | NA | pH TAC µg/mL | Median 7; 7 Median 5.7; 38 | pH paper phospho molybdate method | p = 0.376 ↓ ASD p < 0.001 | [125] |
| ASD 40 M CTRL 40 M Iraq | NA/ NA | 12–15 | NA | Arabic gum | 10 min | 1000 rpm 10 min | GSH pH flow rate Cu Zn | 0.89 ± 0.58; 2.20 ± 1.10 7.45 ± 0.48; 6.9 ± 0.57 1.70 ± 0.25; 1.51 ± 0.30 31.58 ± 11.74; 25.21 ± 9.15 73.66 ± 17.67; 64.05 ± 16.64 | ELISA pH meter atomic absorption spectrometer | ↓ ASD p < 0.001 ↑ ASD p < 0.001 ↑ ASD p = 0.003 ↑ ASD p = 0.008 ↑ ASD p = 0.014 | [126] |
| ASD 36 M, 10 F 28 no treatment, 18 treated CTRL 21 M, 9 F NA | DSM-V CARS AuBC NA | 5.5 ± 2.05 5.35 ± 2.15 | 8–9 a.m. | Residual WS | NA/1.5–2 mL | 3000 g 15 min | Sialic acid (mmol/L) | 0.102 (±0.062) 0.100 (±0.099) 0.160 (±0.097) | Sialic acid assay kit | ↓ ASD p = 0.027 | [129] |
Publisher’s Note: MDPI stays neutral with regard to jurisdictional claims in published maps and institutional affiliations. |
© 2021 by the authors. Licensee MDPI, Basel, Switzerland. This article is an open access article distributed under the terms and conditions of the Creative Commons Attribution (CC BY) license (https://creativecommons.org/licenses/by/4.0/).
Share and Cite
Janšáková, K.; Kyselicová, K.; Ostatníková, D.; Repiská, G. Potential of Salivary Biomarkers in Autism Research: A Systematic Review. Int. J. Mol. Sci. 2021, 22, 10873. https://0-doi-org.brum.beds.ac.uk/10.3390/ijms221910873
Janšáková K, Kyselicová K, Ostatníková D, Repiská G. Potential of Salivary Biomarkers in Autism Research: A Systematic Review. International Journal of Molecular Sciences. 2021; 22(19):10873. https://0-doi-org.brum.beds.ac.uk/10.3390/ijms221910873
Chicago/Turabian StyleJanšáková, Katarína, Klaudia Kyselicová, Daniela Ostatníková, and Gabriela Repiská. 2021. "Potential of Salivary Biomarkers in Autism Research: A Systematic Review" International Journal of Molecular Sciences 22, no. 19: 10873. https://0-doi-org.brum.beds.ac.uk/10.3390/ijms221910873